 Open Access Article
Monitoring alterations of all-trans-retinal in human brain cancer cells by label-free confocal Raman imaging: regulation of the redox status of cytochrome c†
Karolina Jarczewska ,
Monika Kopeć
 ,
Halina Abramczyk
 and
Jakub Maciej Surmacki
 *
*
Lodz University of Technology, Faculty of Chemistry, Institute of Applied Radiation Chemistry, Laboratory of Laser Molecular Spectroscopy, Wroblewskiego 15, 93-590 Lodz, Poland. E-mail: jakub.surmacki@p.lodz.pl; Tel: +48 426313188
First published on 3rd July 2024
Abstract
This article has shown the impact of all-trans-retinal on human brain cancer, which is apparent in the shifts in the redox status of cytochrome c in a single cell. The connection between cytochrome c expression and its role in cancer development remains relatively unexplored. To assess this, we employed Raman spectroscopy and imaging to determine the redox state of the iron ion in cytochrome c across different cellular locations, including mitochondria, cytoplasm, lipid droplets, and the endoplasmic reticulum within human brain cancer cells. We have analyzed normal human astrocytes (NHA) and two brain cancer cell lines (astrocytoma – CRL-1718 and glioblastoma – U-87 MG) without and supplemented with all-trans-retinal. Our results confirmed that human brain cancer cells demonstrate varying redox status compared to normal cells based on the established correlation between the intensity of the cytochrome c Raman band at 1583 cm−1 and the malignancy grade of brain cancer cells. Our research unveiled that all-trans-retinal induces remarkable changes in the mitochondrial functional activity (redox status) of cancer cells, which were measured by confocal Raman spectroscopy and imaging.
Introduction
Cancer is a disease characterized by the abnormal mutation of previously healthy cells, leading to uncontrolled growth, the stimulation of angiogenesis and the ability to spread to other tissues. Brain cancer primarily affects patients aged 50 to 65, although more than 15% of those affected are individuals under 18 years old.1 The presence of a brain tumor results in a reduction in intracranial space, thereby exerting pressure on the remaining brain structures. The treatment of brain tumors involves options like surgery, radiation therapy, chemotherapy, steroid therapy, or a combination of these therapeutic approaches. Surgery, including craniotomy, can lead to the complete removal of select tumors in certain cases.A wide range of brain cancer types exists, with primary tumors originating from various sources, including glial cells, meninges, choroid plexus, the pineal gland, the pituitary gland, or blood vessels. These types encompass glioblastomas, gliomas, and meningiomas. It is worth noting that nearly half of all brain cancers result from metastases. However, the blood–brain barrier restricts the entry of drugs into the brain, which poses a challenge to the effective treatment of brain tumors.2–4
The maintenance of homeostasis relies on the delicate balance of various compounds present in the human body. Any disruption of this balance can lead to the emergence of diseases, especially cancer. Carcinogenesis disrupts this equilibrium and leads to alterations in the levels of specific compounds within metabolic pathways. For example, the levels of retinoids, including retinal, may differ from those in normal cells. By controlling these changes, such as significantly increasing or decreasing the quantity of a specific compound crucial for a metabolic pathway, it becomes feasible to impede a particular stage of carcinogenesis.5
Carotenoids and retinoids constitute two categories of nutritionally significant compounds, with carotenoids being present in a variety of plant-based foods and retinoids primarily found in animal-derived sources. The levels of these compounds in human individuals depend on the diversity and quantity of their dietary intake. Some carotenoids and retinoids have been the subject of investigation regarding their beneficial effects in the prevention of many major diseases and their influence on the immune system. It has been observed that retinoids have the potential to mediate or trigger processes like cell proliferation, differentiation, immune modulation, and the maintenance of the epidermal barrier.6
Classified within the retinoids group, retinal is an aldehyde and serves as an active form of vitamin A, displaying properties that place between retinol and retinoic acid. A retinal requires one transformation to retinoic acid in human skin. This compound impacts skin physiology by transforming into retinoic acid, which binds to receptors, instigating the renewal process and acting as an anti-aging agent. Retinal offers a range of activities, including epidermal exfoliation, melanin transport inhibition and the stimulation of collagen and elastin synthesis.7 Retinal's central role is in the visual process, where it participates in both the cone visual cycle and the canonical visual cycle. All-trans-retinal is an integral part of these cycles.8 Nevertheless, it is worth noting that an excessive concentration of retinoids, such as retinal, can have detrimental health effects, potentially leading to conditions like retinitis pigmentosa.9
Carotenoid metabolism generates retinoids in vivo and in vitro.10 Fig. 1 shows the mechanism of metabolism of β-carotene to retinol and retinoic acid and representative Raman spectra of β-carotene, all-trans-retinal, retinoic acid and retinol. In the first step, all-trans-retinal is generated from β-carotene by oxidative cleavage of C15/C15′ double bonds. This cleavage is catalyzed by carotenoid-cleaving enzyme (CCE) 15,15′-monooxydase BCMO1, which is localized in the cytoplasm.11 The second step is that the retinal might undergo oxidation or reduction on the aldehyde end to give all-trans-retinoic acid or all-trans-retinol respectively.8 Retinal might be metabolized in the liver to retinoic acid by retinaldehyde dehydrogenase or CYP from the cytochrome P450 family. Alcohol dehydrogenase might transform retinal back to retinol, thus this reaction is reversible. Retinoids act by binding to receptors located in the cell nucleus. Expression of these receptors differs depending on part of the body. Retinoid receptors are located exclusively in the epidermis, hair follicles, sebaceous glands, or cells of the immune system. The amount of receptors in these cells depends on their condition. If there is an inflammation in the cell, the number of receptors increases.12
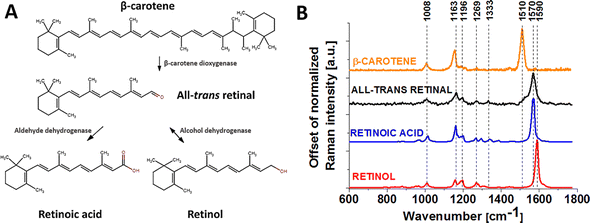 | ||
| Fig. 1 Mechanism of metabolism of β-carotene (A) and Raman spectra of β-carotene, all-trans-retinal, retinoic acid and retinol powders (B). | ||
To understand the involvement of retinoids in cellular signal transduction in cancer, it is essential to utilize the right techniques for in vivo retinoid sensing, enabling the monitoring of retinoid distribution and temporal changes in cells and tissues. Raman spectroscopy and imaging emerge as valuable tools, providing not only a biochemical profile of cells and tissues but also a deeper understanding of disease progression.
Raman spectroscopy is an analytical approach rooted in the phenomenon of spontaneous and nonlinear Raman scattering, which occurs when radiation interacts with a molecule.13,14 This interaction leads the molecule to enter a scattering virtual state, followed by the excited molecule emission. The scattered light is collected by a confocal Raman microscope and transformed into a digital signal by the detector, ultimately generating a Raman spectrum.13,15 This technique identifies the distinctive molecular vibrations modified by the environment resulting in a spectral band broadening. The position of this band indicates the nature of the specific molecular vibration mode and its' intensity is directly proportional to the molecule's concentration.16
Our current understanding of retinoid metabolism in both normal and cancer brain cells is significantly limited, largely due to the absence of experimental methodologies capable of tracking retinoids within specific cell organelles in real time. The Raman-based technique outlined in this publication emerges as a valuable tool to enhance our knowledge in this field.
To address questions concerning the role of retinoids in the metabolism and signaling of brain cancer cells, we collected Raman spectra and images from brain cells exposed to redox stimuli, such as all-trans-retinal in in vitro cell culture. To accomplish this, we cultured normal human astrocytes (NHA) and two brain cancer cell lines astrocytoma (CRL-1718) and glioblastoma (U-87 MG) with all-trans-retinal at a concentration of 1, 10 μM during a 24 and 48 hours incubation period.
In our recent work17 we have shown a fresh perspective on the role of retinoic acid in altering the redox state of the iron ion within the heme group of cytochrome c, shifting it from the oxidized Fe3+ to the reduced Fe2+ form, which carries notable implications. These implications involve the inhibition of oxidative phosphorylation, the interruption of conventional mitochondrial signal pathways that rely on specific proteins and the programmed cell death through apoptosis. The modulation of cytochrome c's redox status by different retinoids may offer an appealing path for the development of potent therapeutic strategies. Consequently, our attention here is directed toward all-trans-retinal.
Materials and methods
Chemicals
The cytochrome c (no. C2506), all-trans-retinal (no. R2500), β-carotene (no. C4582), retinoic acid (no. R2625) and retinol (no. R7632) were purchased from Merck Life Science.Cell culture and preparation for microscopy
A normal human astrocyte (NHA) and two brain cancer cell lines astrocytoma (CRL-1718) and glioblastoma (U-87 MG) cell lines were purchased from LONZA (product number CC-2565) and ATCC, respectively. NHA was cultured first using Astrocyte Growth Medium (AGM, Lonza CC-3186) and after three passages the AGM was changed to a Dulbecco's Modified Eagle Medium (DMEM, Merck D0819). CRL-1718 was cultured with RPMI-1640 Medium (Merck R8758) with L-glutamine and sodium bicarbonate. U-87 MG was cultured with Minimum Essential Medium Eagle Medium – EMEM (Merck M2279). Each medium was supplemented with Fetal Bovine Serum (FBS no. 30-2020 ATCC) to a final concentration of 10%. Each medium was recharged from 2 to 3 times per week. Cells were grown in flat-bottom culture T75 flasks (TPP – Techno Plastic Products no. 90076) and maintained at 37 °C in a humidified atmosphere containing 5% CO2. Cells were seeded on a CaF2 window (Crystran Ltd, Poole, UK; CaF2 Raman grade optically polished window 25 mm diameter × 1 mm thick, no. CAFP25-1R, Poole, UK) in a 35 mm Petri dish at a density of 5 × 10⁴ cells per Petri dish the day before the examination. Before Raman examination, cells were supplemented with all-trans-retinal at concentrations of 1 and 10 μM for 24 and 48 hours, then fixed with 4% formalin solution (neutrally buffered) and kept in PBS (no. 10010023, Gibco) during the experiment. Each of the cell lines (NHA, CRL-1718, U-87 MG) was analyzed by Raman spectroscopy and imaging in the following variants: control – unsupplemented cells, cells supplemented with 1 μM all-trans-retinal for 24 and 48 hours and cells supplemented with 10 μM all-trans-retinal for 24 and 48 hours. This gave a total of 5 samples for each cell line. This approach aimed to be able to compare the results of supplementation depending on the dose and timing of all-trans-retinal.Confocal Raman spectroscopy and imaging
Raman spectra and images were obtained using the WITec Alpha 300 RSA+ confocal microscope (Ulm, Germany). Comprehensive information regarding the WITec system is available in the provided ref. 18 The Raman spectra were measured with a 532 nm excitation wavelength laser with the power of 10 mW in the focus spot and with an integration time of 0.3 seconds (2300–3700 cm−1) and 0.5 seconds (0–1800 cm−1) by CCD camera in enhanced mode (EMCCD). The objective used is a Nikon with a 40× magnification, a numerical aperture (NA = 1.0) and a water solutions measurement cap. Raman images were recorded with a spatial resolution of 1 × 1 μm. A typical Raman map of a single cell consists of 1200 Raman spectra (map size 30 × 40 μm). Raman data analysis was performed using WITec (WITec Project Plus 4) and OriginPro 2021 programs. Raman imaging data were analyzed by the Cluster Analysis method described in our previous papers.18,19 The number of clusters was 7, the minimum number of clusters characterized by different average Raman spectra, which describe the organelles in the cell: nucleus, lipid droplets/endoplasmic reticulum (ER), cytoplasm, mitochondria, cell border and the outside of the cell. The colors of the clusters correspond to the colors of the Raman spectra of the nucleus (red), lipid droplets/ER (blue), oleic lipid droplets (orange), cytoplasm (green), mitochondria (magenta), cell border (light grey).Number of analysed cells n(NHA) = 4, n(NHA with all-trans-retinal) = 16, n(CRL-1718) = 4, n(CRL-1718 with all-trans-retinal) = 16, n(U-87 MG) = 4 and n(U-87 MG with all-trans-retinal) = 16, number of control and incubated with all-trans-retinal Raman spectra used for averaging 18![[thin space (1/6-em)]](https://www.rsc.org/images/entities/char_2009.gif) 125 and 15
125 and 15![[thin space (1/6-em)]](https://www.rsc.org/images/entities/char_2009.gif) 525; 8325 and 6825; 8325 and 6825, respectively.
525; 8325 and 6825; 8325 and 6825, respectively.
WITec Project Plus 4.1 software was used for the analysis of Raman data. Raman data were first pre-processed using: the cosmic rays removal method (model: filter size: 2, dynamic factor: 10), the smoothing procedure (Savitzky–Golay, order: 4, derivative: 0) and background subtraction. Then the Raman maps were created by the Cluster Analysis, which means that spectra were divided into groups based on similarity. Details were shown in previous works.19,20 Finally Raman spectra were transported to Origin Pro 2021 for calculation e.g. mean ± SD, ANOVA and produce graphs. The statistical analysis of the spectroscopic data was conducted using the one-way analysis of variance (ANOVA) test within the OriginPro 2021 software. Subsequently, the Tukey test was employed to determine the statistical significance; the asterisk * denotes that the differences are statistically significant, p-value ≤ 0.05.
Results and discussion
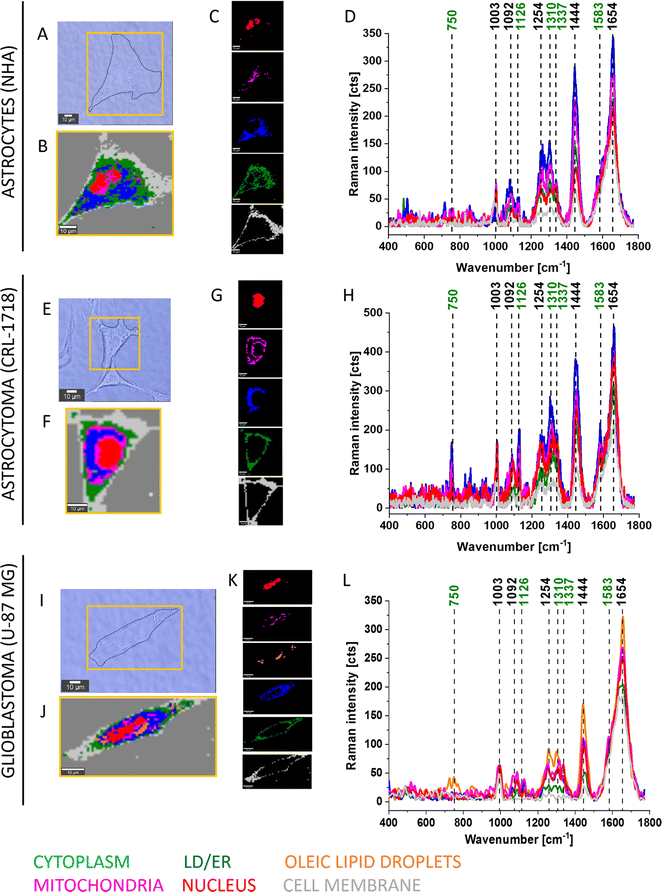
To elucidate the involvement of all-trans-retinal in cancer, we conducted an in vitro study on brain cancer cells using Raman imaging. Here we focused first on information that could be extracted from Raman imaging of normal human astrocytes (NHA), astrocytoma (CRL-1718) and glioblastoma (U-87 MG) cells, and then we clarified the effect of supplementation cells by all-trans-retinal. We focused on the biochemical compositions of cellular organelles such as the lipid droplets, mitochondria, nuclei and cytoplasm. Astrocytes (NHA) are normal brain cells, astrocytoma (CRL-1718) is a mildly aggressive brain tumor and U-87 MG is a highly aggressive brain tumor.Fig. 2 shows typical Raman images and spectra of NHA, CRL-1718 and U-87 MG cells. The Raman map of the whole cells and maps of particular organelles such as a nucleus (red), mitochondria (magenta), oleic lipid droplets (orange), lipid droplets/endoplasmic reticulum (blue), cytoplasm (green), cell membrane (light grey) are presented. The colors of Raman maps correspond to the colors of Raman spectra (400–1800 cm−1).
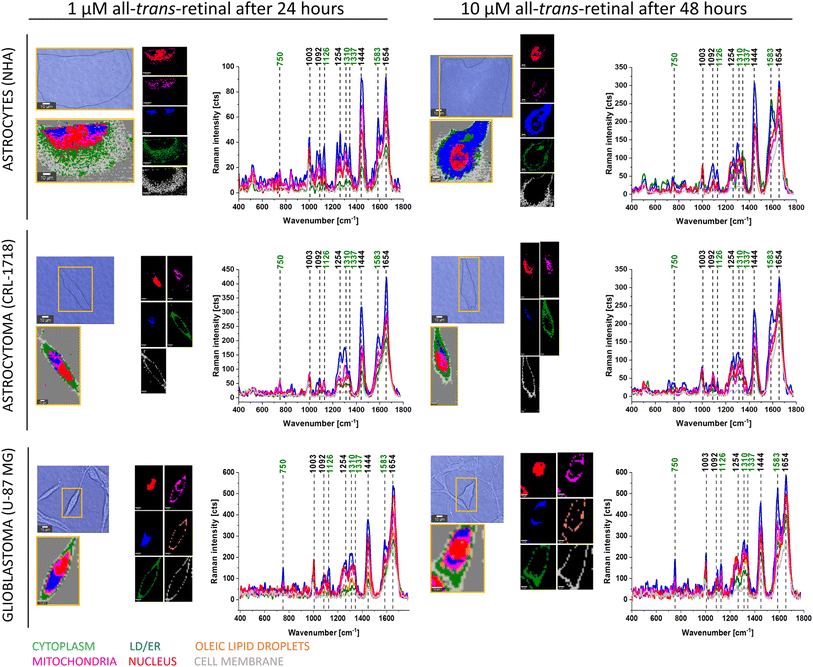
Fig. 3 shows typical Raman images and spectra of supplemented NHA, CRL-1718 and U-87 MG with 1 μM of all-trans-retinal for 24 hours (left part) and 10 μM of all-trans-retinal for 48 hours (right part), two different boundary points – the lowest concentration with the shortest time and the highest concentration with the longest time of incubation.
The results presented in Fig. 2 and 3 confirm that Raman imaging is an appropriate tool for qualitative and semi-quantitative analysis of the single human brain cell composition. Raman spectra of human brain cells are dominated by bands position at 750, 1003, 1126, 1254, 1310, 1337, 1444, 1583 and 1654 cm−1. The strongest Raman signals at 1003, 1254, 1444 and 750, 1003, 1126, 1310, 1337, 1583, 1654 are contributed to Raman bands of lipids and proteins, respectively. Bands marked on green (Fig. 2 and 3) at 750, 1126, 1310, 1337 and 1583 cm−1 perfectly correspond to the Raman vibrations of cytochrome c.19 Detailed Raman band assignments presented in Fig. 2 and 3 are presented in Table 1.
| Raman band wavenumber [cm−1] | Raman vibrational mode assignment21–32 |
|---|---|
| 750 | Heme group vibration/symmetric vibrations of pyrrole rings in cytochrome c and b |
| 1003 | Phenylalanine/lipids/proteins |
| 1092 | Fatty acids |
| 1126 | Vibrations of Cb–CH3 side radicals/cytochrome c |
| 1248 | Methine bridges (bonds CαCμ, CαCμH) cytochrome c |
| 1254 | Amide III in proteins/tryptophan/DNA/RNA bases/lipids |
| 1310 | Amide III in lipids/vibrations of all heme bonds/cytochrome c |
| 1337 | Proteins/cytochrome c |
| 1363 | Mode ν4, methine bridges (bonds CαCμ, CαCμH) cytochrome c |
| 1444 | CH2 and CH3 deformation/lipids/fatty acids/cholesterol |
| 1583 | Cytochrome c |
| 1634 | Methine bridges (bonds CαCμ, CαCμH) cytochrome c |
| 1654 | C![[double bond, length as m-dash]](https://www.rsc.org/images/entities/char_e001.gif) O amide I in proteins/C O amide I in proteins/C![[double bond, length as m-dash]](https://www.rsc.org/images/entities/char_e001.gif) O stretching in lipids/fatty acids O stretching in lipids/fatty acids |
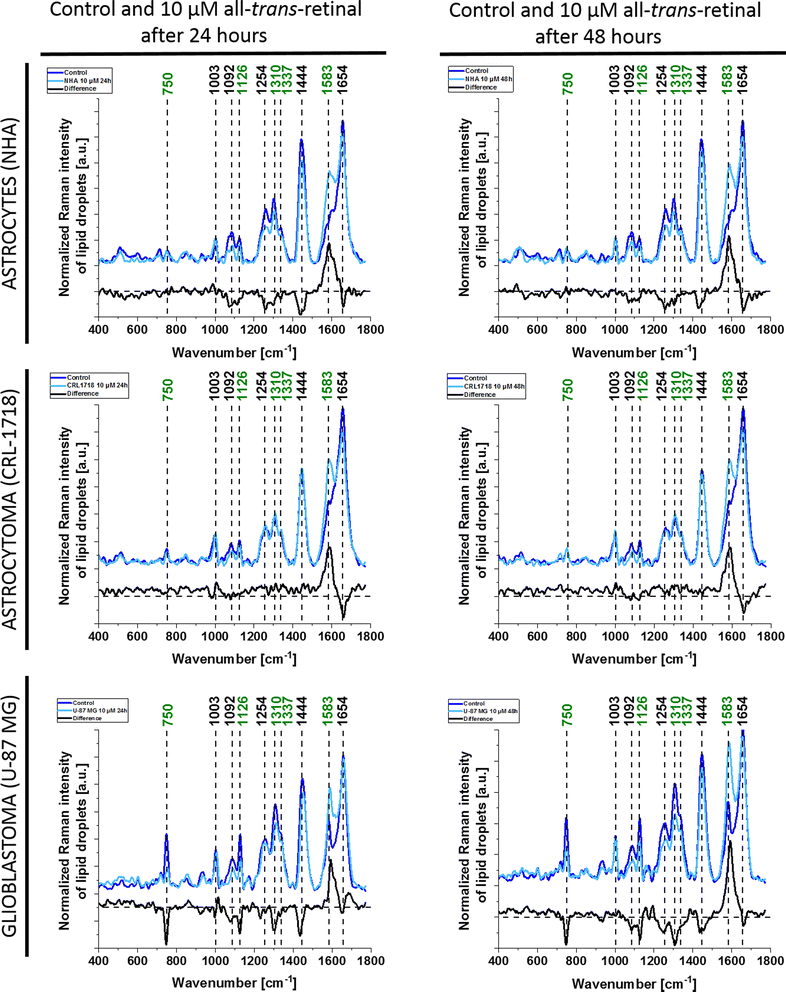
As we can see from Fig. 2 and 3 Raman spectra differ depending on the supplementation. There are differences in the presence of particular bands, for example, the band 750 cm−1 cannot be seen in the cell nucleus and cell membrane. To clarify the differences resulting from cell supplementation we presented the mean and difference spectra of selected organelles in Fig. 4 – lipid droplets/ER, Fig. S1† – mitochondria, Fig. S2† – nucleus and Fig. S3† – cytoplasm. For each line of the human brain cells, a comparison between Raman spectra of control cells and supplemented cells with a concentration of 10 μM all-trans-retinal at two incubation times (24 and 48 hours) is presented.
From Fig. 4 we can see that as a result of supplementation with all-trans-retinal for 24 and 48 hours, we observe an increase of the Raman band at around 1583 cm−1. The band corresponds to the methine bridge vibration of cytochrome c. A detailed analysis of observed Raman bands of cytochrome c has been provided later in this work. For astrocytes (NHA) and glioblastoma (U-87 MG) we observe also an appearance of the Raman bands at 776, 834, 951, 988, 1152, 1218, 1538, 1585, 1610, 1638 cm−1 and 447, 504, 655, 679, 794, 860, 1015, 1143, 1163, 1193, 1276, 1386, 1563, 1592, 1612, 1672–1696 cm−1, respectively. For NHA and U-87 MG we see a clear disappearance of the Raman bands at 712, 873, 930, 1040, 1074, 1112, 1260, 1300, 1338, 1438, 1455, 1660 cm−1 and 694, 747, 922, 971, 996, 1029, 1077, 1124, 1174, 1230, 1256, 1302, 1651, 1736 cm−1, respectively. We do not observe such clear changes for the astrocytoma (CRL-1718) however Raman bands at 768, 823, 851, 956, 1006, 1157, 1190, 1238, 1261, 1289, 1311, 1349, 1391, 1418, 1455, 1475, 1504, 1557, 1590, 1707, 1740 appeared and disappeared at 984, 1056, 1081, 1660 cm−1. The Raman band at around 750 cm−1 is also interesting, its disappearance is most visible in the most aggressive brain cell line (U-87 MG). An analogous analysis was conducted on mitochondria, nucleus and cytoplasm, and the results are presented in Fig. S1–S3,† respectively. Comparable Raman bands changes were observed during our investigation. The results are similar to those in lipid droplets presented in Fig. 4. Incubating brain normal and cancer cells with all-trans-retinal leads to a notable increase in Raman signal for the ν19 vibration mode corresponding to cytochrome c (band at 1583 cm−1).
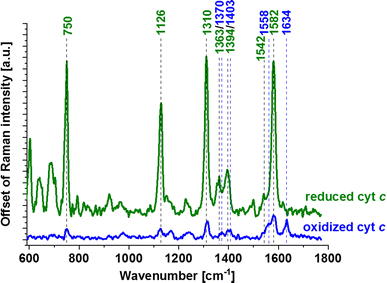
Allow us to provide a clear explanation of the observed shifts in the redox status of cytochrome c within an individual human brain cell. In Fig. 2–4 and S1–S3,† the Raman bands of cytochrome c that undergo resonance Raman enhancement in brain cell lines are depicted in green. Four prominent peaks of cytochrome at 750 (symmetric vibrations of pyrrole rings), 1126 (vibrations of Cb–CH3 side radicals), 1310 (vibrations of all heme bonds), 1363 (mode ν4) and 1583 cm−1 (ν19 mode, vibrations of methine bridges (CαCμ, CαCμH bonds) and the CαCβ bond) are discernible (Fig. 5). Other Raman bands at 1248, 1363 and 1634 cm−1, corresponding to methine bridges (bonds CαCμ, CαCμH), also exhibit lower intensities. The Raman signals of the reduced form of cytochrome c exhibit increased intensities (presented in Fig. 5). In our analysis of the brain cell lines, we utilized the 1583 cm−1 vibrational mode (ν19) as an indicative Raman band for ferrous cytochrome c, as shown in Fig. 2–4 and S1–S3.† Despite the existence of several overlapping bands in that specific region: ν19 of ferric heme c (1582 cm−1), ν19 of ferrous heme c (1582 cm−1), ν2 of ferric heme c (1585 cm−1), ν19 of ferrous heme b (1586 cm−1) and ν2 of ferrous heme b (1583 cm−1) we can eliminate from our discussion all ferric modes because the absolute resonance Raman intensities of the ferric modes are very weak in comparison to the ferrous bands except the band 1634 cm−1 corresponding to the ferric cytochrome c. Consequently, the Raman bands at 1583 cm−1 (associated with the reduced form) and at 1634 cm−1 (associated with the oxidized form) of cytochrome c can serve as pivotal factors for monitoring the reduction level in brain cells.
Summarising the analysis of the presented difference spectra so far, we concluded that the most significant differences are observed for the U-87 MG cell line and the least for the NHA. The main differences occurred for the Raman bands at 750, 1254, 1310, 1444, 1583 and 1654 cm−1. These bands correspond as follows: 750 cm−1 – cytochrome c and b, 1254 cm−1 – amide III in proteins, 1310 cm−1 – amide III/lipids, 1444 cm−1 – CH deformations/lipids, 1583 cm−1 – cytochrome c and 1654 cm−1 – amide I in proteins.21,31 It may indicate that the supplementation of all-trans-retinal results in cellular changes in the level of lipids and proteins. Moreover, a significant difference in the amount of cytochrome c has been observed for each analyzed cell line, which means that all-trans-retinal influences the cytochrome c redox status in cells. Our presented Raman data shows that the biochemical composition of normal brain cells (astrocytes) is different than astrocytoma and glioblastoma both without and supplemented with all-trans-retinal. It means that depending on the aggressiveness, cells use all-trans-retinal in different ways in their physiology.
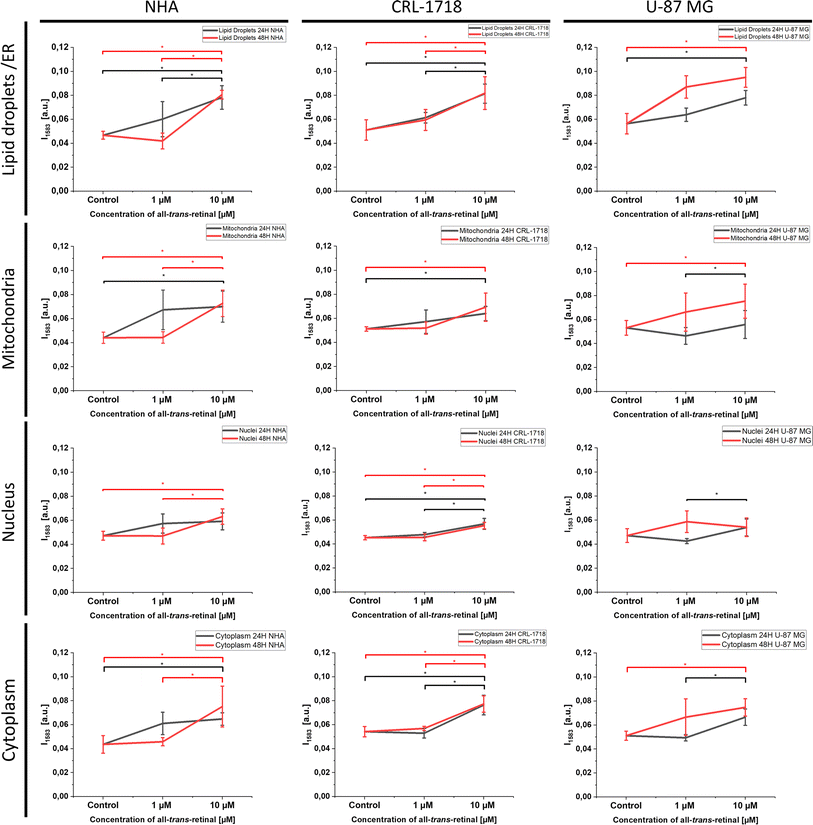
For a deeper understanding of alterations post-supplementation, ANOVA analysis was employed to discern whether the analyzed Raman data exhibited significant differences. Statistically significant changes have been seen for the cell lines after 24 and 48 hours of supplementation (Fig. 6). We believe that the observations of biomolecule variation over time that were formed after supplementation with all-trans-retinal might be utilized in metabolic processes and removed from the cell or transformed into other compounds.
Fig. 4 and S1–S3† highlight the most prominent differences in mitochondria, nucleus, lipid droplets and cytoplasm, prompting their selection for subsequent ANOVA analysis. Fig. 6 illustrates the ANOVA results for NHA, CRL-1718, and U-87 MG cell lines for the 1583 cm−1 band. The depicted results encompass control (unsupplemented cells), 1 μM, and 10 μM of all-trans-retinal for 24 hours (black line) and 48 hours (red line).
As we can see in Fig. 6 an increase of Raman band intensity of reduced form of cytochrome c (1583 cm−1) is observed with increasing concentration of all-trans-retinal. Most observations are statistically significant.
Our results of the current study demonstrated that treated brain tumor cells with all-trans-retinal deregulate cell cycle and these changes might be monitored by Raman imaging. Our previous studies17,18 reported that retinoids such as retinoic acid, retinol and retinyl palmitate have an impact on the redox status of cytochrome c in cancers, particularly in breast and lung cancers. Notably, all-trans-retinoic acid plays an important role in differentiation and apoptosis with the activation of TNF-a and caspase-8 pathways.33 Karmakar et al. showed that combination therapy (all-trans-retinoic acid with paclitaxel) of human glioblastoma (U-87 MG) xenografts induced the mitochondria-mediated pathway of apoptosis with an increase in the Bax![[thin space (1/6-em)]](https://www.rsc.org/images/entities/char_2009.gif) :
:![[thin space (1/6-em)]](https://www.rsc.org/images/entities/char_2009.gif) Bcl-2 ratio and mitochondrial release of cytochrome c and Smac/Diablo into the cytosol. In addition, combination therapy promoted phosphorylation of Bcl-2 for its inactivation and down-regulated NF-kB and BIRC proteins, indicating suppression of several cell survival factors.33 Our results of glioblastoma (mitochondria) presented in Fig. S1† confirm a release of cytochrome c (negative contributions in the difference spectrum) at the first 24 hours of supplementation with all-trans-retinal, which is consistent with Karmakar's observation. It is also interesting that the increase of Raman bands intensity at approximately 1580–1590 cm−1 may indicate not only the level of redox status of cytochrome c18 but also the increase in protein phosphorylation20 or metabolism of all-trans-retinal to retinol (retinol is characterized by a strong Raman band at 1590 cm−1, Fig. 1B). A visible Raman shift to 1590 cm−1 is observed in the difference Raman spectra of glioblastoma lipid droplets and cytoplasm after 48 hours of supplementation. We should also consider the second scenario where the presence of cytochrome results in the conversion of retinal to retinoic acid, which is required for growth and development in the human body.12 Altucci and Gronemeyer have proven that retinoids express antitumour activity due to retinoic acid interruption of particular steps in carcinogenesis.34 The findings align with our XTT results (data not shown), indicating that once a specific threshold of all-trans-retinal concentration (around 25 μM) is surpassed, cell death occurs. According to Bushe and Wan's results, fenretinide and isotretinoin as an isomer of retinoic acid are considered as an agents which generate reactive oxygen species (ROS) and decrease cyclin B1 and Bcl-2 expressions in brain cancer.31 It indicates that all-trans-retinal as a compound from retinoid group might be an anti-cancer agent. Differences in cytochrome c levels point to the possibility that the presence of all-trans-retinal may influence different metabolic pathways, potentially playing a role in the inhibition of cancer development and progression. This manuscript presents an original study by using Raman imaging to track changes in the redox status of mitochondrial cytochromes, proposing it as a competitive clinical diagnostic tool for cancer diseases associated with mitochondrial dysfunction. A thorough understanding of how cytochromes influence metabolic dysregulation requires future analyses involving biological validation assays.
Bcl-2 ratio and mitochondrial release of cytochrome c and Smac/Diablo into the cytosol. In addition, combination therapy promoted phosphorylation of Bcl-2 for its inactivation and down-regulated NF-kB and BIRC proteins, indicating suppression of several cell survival factors.33 Our results of glioblastoma (mitochondria) presented in Fig. S1† confirm a release of cytochrome c (negative contributions in the difference spectrum) at the first 24 hours of supplementation with all-trans-retinal, which is consistent with Karmakar's observation. It is also interesting that the increase of Raman bands intensity at approximately 1580–1590 cm−1 may indicate not only the level of redox status of cytochrome c18 but also the increase in protein phosphorylation20 or metabolism of all-trans-retinal to retinol (retinol is characterized by a strong Raman band at 1590 cm−1, Fig. 1B). A visible Raman shift to 1590 cm−1 is observed in the difference Raman spectra of glioblastoma lipid droplets and cytoplasm after 48 hours of supplementation. We should also consider the second scenario where the presence of cytochrome results in the conversion of retinal to retinoic acid, which is required for growth and development in the human body.12 Altucci and Gronemeyer have proven that retinoids express antitumour activity due to retinoic acid interruption of particular steps in carcinogenesis.34 The findings align with our XTT results (data not shown), indicating that once a specific threshold of all-trans-retinal concentration (around 25 μM) is surpassed, cell death occurs. According to Bushe and Wan's results, fenretinide and isotretinoin as an isomer of retinoic acid are considered as an agents which generate reactive oxygen species (ROS) and decrease cyclin B1 and Bcl-2 expressions in brain cancer.31 It indicates that all-trans-retinal as a compound from retinoid group might be an anti-cancer agent. Differences in cytochrome c levels point to the possibility that the presence of all-trans-retinal may influence different metabolic pathways, potentially playing a role in the inhibition of cancer development and progression. This manuscript presents an original study by using Raman imaging to track changes in the redox status of mitochondrial cytochromes, proposing it as a competitive clinical diagnostic tool for cancer diseases associated with mitochondrial dysfunction. A thorough understanding of how cytochromes influence metabolic dysregulation requires future analyses involving biological validation assays.
Conclusions
In this study, we investigated the hypothesis on impact of reduction–oxidation pathways induced by all-trans-retinal associated with cytochrome c in the progression of brain cancer. We have used Raman imaging as a label-free method for tracking the metabolism of all-trans-retinal in human normal astrocytes and cancerous brain cells of different aggressiveness. Raman microspectroscopy can track changes at the level of specific cellular organelles. We have shown that the biochemical composition of normal brain cells (astrocytes) is different than that of astrocytoma and glioblastoma both without and supplemented with all-trans-retinal. It means that depending on aggressiveness, cells use all-trans-retinal in different ways in their biological activity. It was evident from our study that all-trans-retinal has a profound impact on the mitochondrial functional activity (redox status) of the brain cancer cells that was monitored using Raman imaging. Our results confirmed that the human brain cancer cells demonstrate alterations in redox status compared to normal cells. The correlation has been established between the intensity of reduced form of cytochrome c Raman band at 1583 cm−1 and the malignancy grade in brain cancer cells. Further research using advanced molecular biology techniques is needed to fully support the hypothesis confirmed by Raman results presented in this paper that the shift from the oxidized Fe3+ to the reduced Fe2+ form carries notable implications in electron transport chain, oxidative phosphorylation and apoptosis.Author contributions
Conceptualization: K. J., J. S., M. K., H. A.; investigation: K. J.; methodology: J. S.; writing – original draft: K. J., J. S.; manuscript editing: J. S., K. J.; manuscript revision: J. S., M. K., K. J.; funding: H. A. All authors have read and agreed to the published version of the manuscript.Conflicts of interest
There are no conflicts of interest to declare.Acknowledgements
This work was supported by the National Science Centre of Poland (OPUS, UMO-2021/43/B/ST4/01547). This paper has been completed while the first author was the Doctoral Candidate in the Interdisciplinary Doctoral School at the Lodz University of Technology, Poland.References
- Worldwide cancer data | World Cancer Research Fund International, https://www.wcrf.org/cancer-trends/worldwide-cancer-data/, accessed February 28, 2024.
- M. Bredel, Lancet Oncol., 2003, 4, 257–258 CrossRef.
- S. Marie, Clinics, 2011, 66(Suppl 1), 33–43 CrossRef PubMed.
- Y.-E. L. Koo, G. R. Reddy, M. Bhojani, R. Schneider, M. A. Philbert, A. Rehemtulla, B. D. Ross and R. Kopelman, Adv. Drug Delivery Rev., 2006, 58, 1556–1577 CrossRef CAS PubMed.
- K. H. Dragnev, J. R. Rigas and E. Dmitrovsky, Oncologist, 2000, 5, 361–368 CrossRef CAS PubMed.
- R. Rühl, Proc. Nutr. Soc., 2007, 66, 458–469 CrossRef PubMed.
- C. Aleksandra, Proc. Nutr. Soc., 2018, 7, 371 Search PubMed.
- J. von Lintig, J. Biol. Chem., 2012, 287, 1627–1634 CrossRef CAS PubMed.
- G. H. Travis, M. Golczak, A. R. Moise and K. Palczewski, Annu. Rev. Pharmacol. Toxicol., 2007, 47, 469–512 CrossRef CAS PubMed.
- J. L. Napoli and K. R. Race, J. Biol. Chem., 1988, 263, 17372–17377 CrossRef CAS PubMed.
- A. Lindqvist and S. Andersson, J. Biol. Chem., 2002, 277, 23942–23948 CrossRef CAS PubMed.
- H. Marona, A. Gunia and E. Pękala, Retinoidy – rola w farmakoterapii w aspekcie komórkowego mechanizmu działania, Terapia i leki, 2010, vol. 66, issue 3, https://ptfarm.pl/pub/File/Farmacja%20Polska/2010/03-2010/06%20%20Retinoidy.pdf Search PubMed.
- S. Stewart, R. J. Priore, M. P. Nelson and P. J. Treado, Annu. Rev. Anal. Chem., 2012, 5, 337–360 CrossRef CAS PubMed.
- S. P. Mulvaney and C. D. Keating, Anal. Chem., 2000, 72, 145–158 CrossRef CAS PubMed.
- L. A. Lyon, C. D. Keating, A. P. Fox, B. E. Baker, L. He, S. R. Nicewarner, S. P. Mulvaney and M. J. Natan, Anal. Chem., 1998, 70, 341R–361R CrossRef CAS PubMed.
- J. Surmacki, B. Brozek-Pluska, R. Kordek and H. Abramczyk, Analyst, 2015, 140, 2121–2133 RSC.
- H. Abramczyk and J. M. Surmacki, Cancers, 2023, 15, 4535 CrossRef CAS PubMed.
- J. M. Surmacki and H. Abramczyk, Sci. Rep., 2023, 13, 15049 CrossRef CAS PubMed.
- H. Abramczyk, B. Brozek-Pluska and M. Kopeć, Sci. Rep., 2022, 12, 2120 CrossRef CAS PubMed.
- H. Abramczyk, A. Imiela, B. Brożek-Płuska, M. Kopeć, J. Surmacki and A. Śliwińska, Cancers, 2019, 11, 2017 CrossRef CAS PubMed.
- A. Rygula, K. Majzner, K. M. Marzec, A. Kaczor, M. Pilarczyk and M. Baranska, J. Raman Spectrosc., 2013, 44, 1061–1076 CrossRef CAS.
- M. Kopeć, K. Beton, K. Jarczewska and H. Abramczyk, Sci. Rep., 2022, 12, 18561 CrossRef PubMed.
- J. M. Surmacki, I. Quiros-Gonzalez and S. E. Bohndiek, Antioxidants, 2022, 11, 573 CrossRef CAS PubMed.
- P. T. W. Jr, C. Zhang, F. Vesuna, J. W. Kang, J. Garry, R. R. Dasari, I. Barman and V. Raman, Oncotarget, 2017, 8, 20266–20287 CrossRef PubMed.
- H. N. Banerjee, A. Banerji, A. N. Banerjee, E. Riddick, J. Petis, S. Evans, M. Patel, C. Parson, V. Smith, E. Gwebu and S. Voisin, J. Cancer Sci. Ther., 2015, 7, 44–47 CAS.
- Z. Movasaghi, S. Rehman and I. U. Rehman, Appl. Spectrosc. Rev., 2007, 42, 493–541 CrossRef CAS.
- H. Georg Schulze, S. O. Konorov, J. M. Piret, M. W. Blades and R. F. B. Turner, Analyst, 2013, 138, 3416–3423 RSC.
- H. Abramczyk, J. M. Surmacki, B. Brozek-Pluska and M. Kopec, Cancers, 2021, 13, 2599 CrossRef CAS PubMed.
- H. Abramczyk and A. Imiela, Spectrochim. Acta, Part A, 2018, 188, 8–19 CrossRef CAS PubMed.
- N. Stone, C. Kendall, J. Smith, P. Crow and H. Barr, Faraday Discuss., 2004, 126, 141–157 RSC.
- N. Bushue and Y.-J. Y. Wan, Adv. Drug Delivery Rev., 2010, 62, 1285–1298 CrossRef CAS PubMed.
- J. De Gelder, K. De Gussem, P. Vandenabeele and L. Moens, J. Raman Spectrosc., 2007, 38, 1133–1147 CrossRef CAS.
- S. Karmakar, N. L. Banik and S. K. Ray, Cancer, 2008, 112, 596–607 CrossRef CAS PubMed.
- L. Altucci and H. Gronemeyer, Nat. Rev. Cancer, 2001, 1, 181–193 CrossRef CAS PubMed.
Footnote |
| † Electronic supplementary information (ESI) available. See DOI: https://doi.org/10.1039/d4ra01542h |
| This journal is © The Royal Society of Chemistry 2024 |

