 Open Access Article
The engineering of defect-modified boron nitride ribbons: an effective adsorbent to rapid capture for tetracycline
Xi Chenab,
Yufei Tang *a,
Zhangwen Xiea,
Wanxing Zhenga,
Xiuying Lina,
Yang Tiea,
Qian Lianga,
Zhuangzhuang Zhanga,
Zhaowei Liua and
Kang Zhao
 a
a
aDepartment of Materials Science and Engineering, Xi'an University of Technology, China
bSchool of Material Science and Engineering, Xi'an University of Technology, China
First published on 15th April 2024
Abstract
Antibiotics, the persistent organic pollutants, have brought serious pollution to the aquatic environment. Therefore, it is necessary to select rapid adsorbents to remove them from their long-term threat. Herein, the introduction of defects in BN was employed to enhance its surface chemical activity for rapid capture of tetracycline via hydrothermal and calcination methods. The defect content in BN can be controlled by adjusting the volume ratio of ethanol to water. Among them, when the volume ratio of H2O/ethanol is 4/1 (BN-3), BN-3 has the most N defects at 33%, which increases the adsorption rate of h-BN for TC and promotes the adsorption capacity to 302.15 mg g−1, which is due to the introduction of nitrogen defects significantly regulates the electronic structure of BN. The corresponding theoretical calculations confirm that BN with N defects decreases the absorption energy of BN for TC. Additionally, the adsorption removal rate of tetracycline still reached 95.5% after 5 cycles of TC adsorption by BN-3, indicating that the defect-modified BN has good reusability and is beneficial for its use in pollutant adsorption.
Introduction
Antibiotics, as highly effective antimicrobial agents, growth additives in animal husbandry, and aquaculture agents in the control of human and animal disease, have wide applications.1 However, as antibiotics enter the organisms, most of them drain the ecosystem in the form of prodrugs or metabolites.2 Among them, tetracycline (TC) has been applied in large quantities as a typical antibiotic due to its high antimicrobial activity, low cost, and few side effects, which has caused great harm to human health, and ecological balance.Adsorption is widely used for the removal of antibiotic contaminants due to its significant advantages such as ease of operation, high recoverability, and high removal capacity.3–6 Commonly used adsorption materials mainly include activated carbon,7 MOFs,8 metallic materials,9 Natural clay minerals,10 polymers,11 and covalent organic frameworks (COFs)12 The adsorption capacity of these materials is mainly related to their structural and physicochemical properties, among them, hexagonal boron nitride (h-BN), as a graphite-like layered structural material, consists of layers of BN hexagonal units that interact with each other through van der Waals forces.13–17 It can effectively adsorb antibiotics containing aromatic ring structures through mechanisms such as π–π stacking18 and hydrogen bonding interactions.19 However, the lack of active sites on the h-BN surface slowed down the reaction rate of the adsorbed substances on its surface, which led to the desorption of the adsorbed substances on its surface, seriously affecting the final adsorption effect. It has been shown that the introduction of defects in BN can increase the chemical activity of its surface and contribute to a rapid increase in the adsorption rate in the early stages of adsorption.20 For example, Xiong, et al.21 fabricated boron-containing defective BN, and the adsorption capacity of dibenzothiophene (DBT) reached 43.6 mg S g−1 within 40 min. In addition, Chao, et al.22 controllably synthesized h-BN with N vacancies by using di-boron trioxide and urea as reactants, and the base potassium hydroxide as a defect guide. Compared to that of pure BN, the adsorption efficiency of TCs by BN with N defects increased by 18%, which was due to the variable electronic structure of BN. However, the influence of defect content on BN adsorption performance in these studies is absent, and there is a significant decrease in adsorption performance after cyclic adsorption.
Therefore, the defective BN was prepared using a two-step method combining hydrothermal and calcination methods using boric acid, polyvinylpyrrolidone (PVP), and melamine as co-reaction sources to rapidly capture TC and improve reusability. The defect content of the BN could be adjusted by changing the volume ratio of ethanol and water. Among them, when the ratio of water/ethanol was 4/1 (BN-3), which had the most nitrogen (N) defects (33%), the adsorption rate of h-BN on TC was effectively increased, which in turn led to an adsorption capacity of 302.15 mg g−1. In addition, theoretical calculations and experimental results confirmed that the introduction of N defects significantly modulated the electronic structure of BN, which improved the efficiency of its charge separation and migration. The adsorption removal of tetracycline using BN-3 was still as high as 95.5% after 5 TC cycles, which indicates that the defect-modified BN has good reusability and facilitates its use in pollutant adsorption.
Experimental section
Materials
Melamine (C3N6H6), boric acid (H3BO3), and anhydrous ethanol (CH3CH2OH) were procured from Tianjin Shengao Chemical Reagent Co., Ltd. Polyvinylpyrrolidone (PVP) and tetracycline (TC) were all obtained from Tianjin Damo Chemical Reagent Factory. All chemicals used were of analytical reagent grade and were utilized without any further purification before use.Experimental method
Firstly, 0.35 g of boric acid, 0.31 g of melamine and 0.133 g of polyvinylpyrrolidone (PVP) were mixed and dissolved in a mixture of 30 mL of deionized water and ethanol, in which the volume ratios of water and ethanol were (0![[thin space (1/6-em)]](https://www.rsc.org/images/entities/char_2009.gif) :
:![[thin space (1/6-em)]](https://www.rsc.org/images/entities/char_2009.gif) 5, 1
5, 1![[thin space (1/6-em)]](https://www.rsc.org/images/entities/char_2009.gif) :
:![[thin space (1/6-em)]](https://www.rsc.org/images/entities/char_2009.gif) 4, 4
4, 4![[thin space (1/6-em)]](https://www.rsc.org/images/entities/char_2009.gif) :
:![[thin space (1/6-em)]](https://www.rsc.org/images/entities/char_2009.gif) 1, 5
1, 5![[thin space (1/6-em)]](https://www.rsc.org/images/entities/char_2009.gif) :
:![[thin space (1/6-em)]](https://www.rsc.org/images/entities/char_2009.gif) 0), and then the mixed solution was transferred to a polytetrafluoroethylene liner in a hydrothermal reaction at 160 °C for 12 h. The white products were obtained by naturally cooling, vacuum filtration, and drying at 90 °C for 12 h. Finally, the defective boron nitride was successfully prepared by calcination at 1100 °C for 2 h under N2 atmosphere. The samples obtained with different volume ratios of water and ethanol were labeled by BN-1, BN-2, BN-3, and BN-4, respectively.
0), and then the mixed solution was transferred to a polytetrafluoroethylene liner in a hydrothermal reaction at 160 °C for 12 h. The white products were obtained by naturally cooling, vacuum filtration, and drying at 90 °C for 12 h. Finally, the defective boron nitride was successfully prepared by calcination at 1100 °C for 2 h under N2 atmosphere. The samples obtained with different volume ratios of water and ethanol were labeled by BN-1, BN-2, BN-3, and BN-4, respectively.
Adsorption measurements
5–300 mg L−1 of TC solution was fabricated and was kept in the shade. Then, 10 mg adsorbent was added into 50 mL TC solution and stood for 3 days to reach adsorption equilibrium. During the adsorption, more than 1 mL solution then was separated by a 0.22 μm microporous filter and measured by the UV-vis spectrophotometer (TC: λ = 358 nm). During the cyclic experiment, 40 mg adsorbent was used and dispersed into 200 mL TC solution (40 mg L−1). Then, the mixed solution was stirred at 25 °C for 120 min for absorption. After absorption, the adsorbent was separated by vacuum filtration. Finally, the obtained product was dried for further use.Characterization
The phase structures and morphologies of the samples were characterized in detail by X-ray diffraction (XRD, Bruker D8) and scanning electron microscopy (SEM; JSM 6700F, Japan), respectively. The chemical state of the surface elements and their functional groups were analyzed in depth by X-ray photoelectron spectroscopy (XPS, EscaLab 250) and Fourier transform infrared spectroscopy (FTIR, Vatar 360). The specific surface areas and pore distributions were evaluated by an automated physicochemical adsorption isothermometer (iQ-1900, Quantachrome, USA). In addition, the residual concentration of the adsorbed contaminants was determined using a UV-visible spectrophotometer (UV-8000S, Hitachi, Japan) to assess the adsorption performance of the samples. To understand the interaction between TC molecule and N defect-modified BN, a series of theoretical models based on Density Functional Theory (DFT) were carried out. Gaussian 16 software was implemented to realize the geometry optimization, static total energy calculations, and electron density difference calculations. Spin-unrestricted DFT calculations were performed using the DMol3 code, employing the generalized gradient approximation (GGA)-based Perdue–Burke–Ernzerhof (PBE) as the exchange–correlation generalized function. Dual numerical plus polarisation (DNP) was used for isotropic electron calculations.Results and discussions
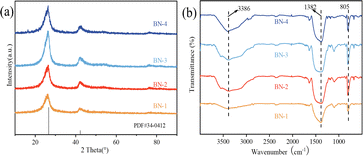
Firstly, the physical phase compositions and surface groups of the defective BN with different H2O/ethanol volume ratios were investigated, in Fig. 1. As can be seen from Fig. 1(a), all the samples showed obvious characteristic diffraction peaks at 2θ = 25.4° and 42.5°, which corresponded to the (002) and (100) crystal planes of h-BN (JCPDS: 34-0412), respectively, and no other impurity peaks were found. The intensity of the characteristic diffraction peaks increases and then decreases with the increase of water content, and the BN-3 has the strongest (002) crystal plane diffraction peak. This is because the water molecules can participate in the formation process of the BN crystal structure when water is used as a solvent, which is beneficial to the growth and alignment of the crystals. However, when only ethanol is involved in the synthesis of BN as a solvent, it will change the solvent environment of the reaction system, which will lead to an uneven rate of crystal growth or an increase in the number of lattice defects, and thus reduce the crystallinity of the BN. Compared with BN obtained from pure water, when ethanol and water are used as a mixed solvent, its crystallinity is relatively high due to the mixed solvent of ethanol and water can regulate the polarity and solubility of the solvent, which is beneficial for controlling the crystal growth rate, lattice arrangement, and crystal morphology, and thus improve the crystallinity. The main peak of BN-3 is shifted to the lowest angle in contrast to the standard PDF card, which may be attributed to the increase in defects caused by the moderate introduction of ethanol.All the samples were further analyzed for functional groups, as shown in Fig. 1(b). Significant absorption peaks at 3368 cm−1, and 1382 cm−1 correspond to the –OH group; and the stretching vibration of the B–N bond. The 805 cm−1 belongs to the bending vibration of B–N–B.23 In addition, the OH groups increase significantly with the increase in the proportion of water, indicating that the synthesis of BN is affected by the polarity and solubility of the mixed solution.
Fig. 2 shows the microscopic morphologies of BN with different water and ethanol volume ratios. From Fig. 2(a), it can be seen that the microscopic morphology of BN-1 consists of many disordered, interlaced, and aggregated nanoribbons. When the volume ratio of H2O/ethanol is 1![[thin space (1/6-em)]](https://www.rsc.org/images/entities/char_2009.gif) :
:![[thin space (1/6-em)]](https://www.rsc.org/images/entities/char_2009.gif) 4 (BN-2) (Fig. 2(b)), the nanoribbons gradually broaden and self-assemble to form bouquets. When the ratio of H2O/ethanol is further adjusted to 4
4 (BN-2) (Fig. 2(b)), the nanoribbons gradually broaden and self-assemble to form bouquets. When the ratio of H2O/ethanol is further adjusted to 4![[thin space (1/6-em)]](https://www.rsc.org/images/entities/char_2009.gif) :
:![[thin space (1/6-em)]](https://www.rsc.org/images/entities/char_2009.gif) 1 (BN-3) (Fig. 2(c)), the nanoribbons begin to curl, and the bouquets are still present. However, when the solvent is entirely water (BN-4) (Fig. 2(d)), the nanoribbons are severely agglomerated and become smaller in the radial direction, and the bouquets disappear. It can be seen that the volume ratio of ethanol and water has a greater effect on the morphology of BN nanoribbons. This is due to the formation of supramolecular material (C3N6H6·2H3BO3) through hydrogen bonding of boron nitride precursor molecules in the hydrothermal reaction. In pure ethanol, the relatively small polarity of the solvent cannot effectively dissociate and stabilize the C3N6H6·2H3BO3 supramolecule, and the interactions between the nanoribbons are weak, making it difficult to form an ordered structure. The polarity of the solvent increases with the increase of water content. Water molecules are more polar than ethanol24 and can more obviously interact with C3N6H6·2H3BO3 molecules. And the formed hydrogen bonds between water molecules and C3N6H6·2H3BO3, further promote the aggregation and orderly arrangement of the nanoribbon structures. The polarity of water is greatest when the solvent is entirely water. The interaction between the water molecules and the boron nitride precursor molecules becomes very strong, leading to severe aggregation of the nanoribbons.
1 (BN-3) (Fig. 2(c)), the nanoribbons begin to curl, and the bouquets are still present. However, when the solvent is entirely water (BN-4) (Fig. 2(d)), the nanoribbons are severely agglomerated and become smaller in the radial direction, and the bouquets disappear. It can be seen that the volume ratio of ethanol and water has a greater effect on the morphology of BN nanoribbons. This is due to the formation of supramolecular material (C3N6H6·2H3BO3) through hydrogen bonding of boron nitride precursor molecules in the hydrothermal reaction. In pure ethanol, the relatively small polarity of the solvent cannot effectively dissociate and stabilize the C3N6H6·2H3BO3 supramolecule, and the interactions between the nanoribbons are weak, making it difficult to form an ordered structure. The polarity of the solvent increases with the increase of water content. Water molecules are more polar than ethanol24 and can more obviously interact with C3N6H6·2H3BO3 molecules. And the formed hydrogen bonds between water molecules and C3N6H6·2H3BO3, further promote the aggregation and orderly arrangement of the nanoribbon structures. The polarity of water is greatest when the solvent is entirely water. The interaction between the water molecules and the boron nitride precursor molecules becomes very strong, leading to severe aggregation of the nanoribbons.
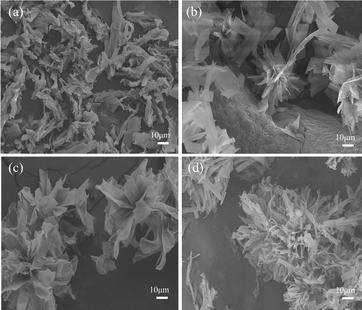 | ||
| Fig. 2 The morphologies of BN with different H2O/ethanol volume ratio: (a) BN-1; (b) BN-2; (c) BN-3; and (d) BN-4. | ||
Besides them, the impact of PVP on the morphologies of BN at different H2O/ethanol volume ratios was also observed, as shown in Fig. 3. Many disordered, interlaced, and aggregated nanoribbons in all samples can be observed due to the absence of dispersivity, which suggests PVP also plays an important to the morphologies of BN nanobelts.
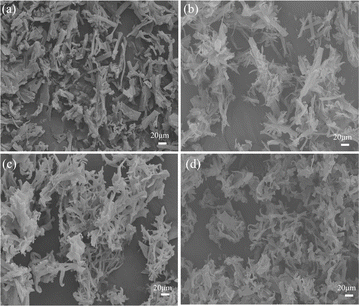 | ||
| Fig. 3 The morphologies of BN obtained at different H2O/ethanol volume ratios without PVP (a) BN-1; (b) BN-2; (c) BN-3; and (d) BN-4. | ||
The chemical compositions and surface morphological states of the four samples were further investigated by XPS analysis. As shown in Fig. 4(a), it can be seen that all the prepared samples have the presence of four elements of B, N, C, and O elements, indicating the successful preparation of BN. From the B 1s spectra in Fig. 4(b), it can be seen that the peak at 189.82–190.4 eV corresponds to the B–N bond in BN-1, BN-2, BN-3, and BN-4. Meanwhile, the peaks at 191.47–192.18 eV suggest the presence of B2O3. However, the locations of the B–N bond are shifted to the lower binding energy with the increase in water content. Among them, BN-2 has the largest shift, which suggests that the structural defects of the N atoms lead to an increase in the electron density of the B atoms and the largest increase in electron density at BN-3. By splitting the peak area, we estimated the content of N defects,25 which were 10.4%, 21.6%, 33.2%, and 28.1% for N 1s spectra of BN-1, BN-2, BN-3, and BN-4. Combined with the XRD and SEM results, it can be seen that the lattice arrangement and crystal morphology of BN are affected by the different solvent mixtures of ethanol and water and the presence of PVP. When the proper H2O/ethanol volume ratio and PVP were added, the lattice arrangement of the BN precursor can be influenced, and there is a carbothermal reduction reaction during calcination due to the presence of PVP, which in turn induces the formation of defects in h-BN.26 Therefore, the defect content of BN can be regulated by different H2O/ethanol volume ratios. Among them, BN-3 has the largest N defect content, which is due to the largest degree of lattice defects at an H2O/ethanol ratio of 4![[thin space (1/6-em)]](https://www.rsc.org/images/entities/char_2009.gif) :
:![[thin space (1/6-em)]](https://www.rsc.org/images/entities/char_2009.gif) 1.
1.
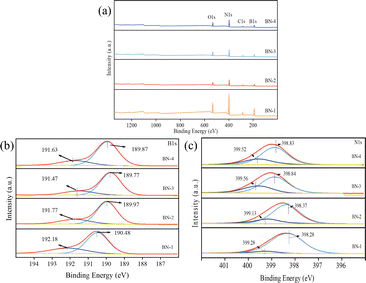 | ||
| Fig. 4 XPS of BN obtained at different H2O/ethanol volume ratios (a) full spectrum, (b) B 1s spectrum, and (c) N 1s spectrum. | ||
The specific surface area of the material usually plays a significant influence on the adsorption performance. Therefore, N2 adsorption–desorption isothermal curves were used to study the specific surface area and pore size distribution of all samples, as shown in Fig. 5. It can be seen that the specific surface areas of BN gradually increase with the increase of water content from Fig. 5(a). All samples show typical class IV isothermal curves, with the isotherm starting to increase at P/P0 = 0, and showing an obvious hysteresis in the range of P/P0 from 0.45 to 1.0, which indicates that there is a mesoporous structure on the surface of the material, and that the BN-4 has the largest specific surface area of 132.52 m2 g−1, which may lead to the inhibition of the self-assembly process of the nanoribbon structure and fast growth due to a smaller polarity, thus limiting the increase of the specific surface area (Table 1).
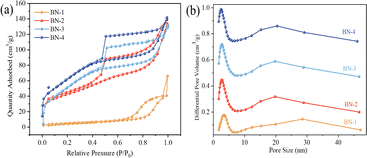 | ||
| Fig. 5 (a) N2 adsorption–desorption isotherm and (b) pore diameter distribution of BN with different H2O/ethanol volume ratios. | ||
| Sample | Specific surface area/m2 g−1 | Total pore volume/cm3 g−1 | Average pore size/nm |
|---|---|---|---|
| BN-1 | 72.23 | 0.15 | 7.79 |
| BN-2 | 104.22 | 0.21 | 5.73 |
| BN-3 | 127.46 | 0.22 | 5.52 |
| BN-4 | 132.52 | 0.23 | 5.57 |
Adsorption isotherms are an important means of characterizing the surface properties and affinities of adsorbents.27 To investigate the absorption relationship between BN and TC, three common isotherm models, Langmuir,28 Freundlich,29 and Temkin,30 were used to fit the experimental data for the calculation in the experiment. From the Langmuir model in Fig. 6(a), the saturated adsorption capacity of BN on TC changed significantly with the addition of the H2O/ethanol volume ratio. The saturated adsorption capacity of BN-1, BN-2, BN-3, and BN-4 was 229.72 mg g−1, 261.04 mg g−1, 302.15 mg g−1, and 279.52 mg g−1. Among them, BN-3 has the largest saturated adsorption capacity, which is attributed to the increase of the specific area and the N defect content in contrast to those of BN-1 and BN-2. Interestingly, although BN-4 has a higher specific area than that of BN-3, it exhibited a decreased absorption capacity, which is obviously due to the decrease of the N defect content. Therefore, N defect content plays a positive part in the adsorption of TC by decreasing the absorption energy.31–33 The relevant model parameters are presented in Table 2. All three adsorption isotherm models simulated the adsorption process of the four BN samples adsorbed with TC better. Comparing the adsorption capacities of the four samples at different TC concentrations, the adsorption capacities of the samples increased gradually and non-linearly with the increase of the initial TC concentration. The fitting results in Table 3 show that the fitting coefficients of the three models are above 0.98, and the fitting coefficients of the Langmuir model are slightly higher than those of the other two models, which indicates that the Langmuir model can better describe the process of TC adsorption by BN. In the Freundlich model, 1/n is less than 1 for all three samples, indicating that the adsorption process is favorable and the adsorption of BN on TC is non-homogeneous surface adsorption. R2 in the Temkin model is less than 1, which suggests that the TC with adsorbed BN has strong chemisorption properties.
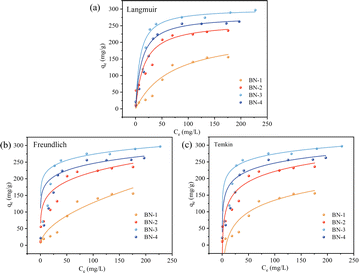 | ||
| Fig. 6 (a) Langmuir model, (b) Freundlich model, and (c) Temkin model for BN with different H2O/ethanol volume ratios. | ||
| BN-1 | BN-2 | BN-3 | BN-4 | ||
|---|---|---|---|---|---|
| Langmuir | qm (mg g−1) | 229.72 | 261.04 | 302.15 | 279.52 |
| KL (L mg−1) | 0.014 | 0.062 | 0.12 | 0.088 | |
| R2 | 0.989 | 0.996 | 0.998 | 0.997 | |
| Freundlich | KF | 11.09 | 88.13 | 173.39 | 136.36 |
| 1/n | 0.203 | 0.412 | 0.436 | 0.439 | |
| R2 | 0.980 | 0.989 | 0.997 | 0.994 | |
| Temkin | KT (L mg−1) | 3.81 | 74.34 | 145.49 | 91.52 |
| R2 | 0.987 | 0.993 | 0.997 | 0.995 | |
| BN-1 | BN-2 | BN-3 | BN-4 | ||
|---|---|---|---|---|---|
| Qe,exp (mg g−1) | 54.53 | 108.07 | 130.73 | 75.21 | |
| Pseudo-first order | Qe,cal (mg g−1) | 48.71 | 75.78 | 108.65 | 62.29 |
| K1 (min−1) | 0.007 | 0.012 | 0.015 | 0.003 | |
| R2 | 0.978 | 0.985 | 0.992 | 0.997 | |
| Pseudo-second-order | qe (mg g−1) | 48.97 | 99.81 | 140.98 | 74.89 |
| K2 (mg g−1 min−1) | 2.91 | 10.80 | 14.453 | 8.915 | |
| R2 | 0.981 | 0.987 | 0.993 | 0.998 | |
| Intra-particle diffusion | Kd1 (mg g−1 min−1) | 1.430 | 3.152 | 6.513 | 7.877 |
| I1 | −0.024 | −0.076 | −0.048 | 0.017 | |
| R12 | 0.998 | 0.998 | 0.9923 | 0.997 | |
| Kd2 (mg g−1 min−1) | 1.740 | 5.127 | 6.348 | 5.811 | |
| I2 | 7.560 | 20.057 | 25.231 | 35.13 | |
| R22 | 0.998 | 0.982 | 0.812 | 0.966 | |
| Kd3 (mg g−1 min−1) | 1.065 | 1.526 | 3.619 | 1.267 | |
| I3 | 16.64 | 49.604 | 57.711 | 58.575 | |
| R32 | 0.982 | 0.781 | 0.875 | 0.949 | |
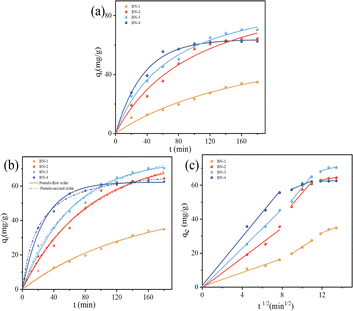
To further investigate the TC adsorption rate and adsorption characteristics of all samples, Fig. 7 showed the fitting results of three kinetic models, and the corresponding parameters are listed in Table 3. In contrast to the pseudo-first-order model, the results of the pseudo-second-order model are closer to the experimental values. This indicates that the adsorption process is dominated by chemisorption. To further investigate the potential rate-controlling steps, an intra-particle diffusion model was carried out in Fig. 7(c). It can be seen that three processes of external mass transfer, intra-particle diffusion, and adsorption of the adsorbate onto the active sites on the inner and outer surfaces of the adsorbent can be divided in the absorption.18,34 It can be seen that at the beginning of the adsorption, the adsorption capacity rises linearly and the adsorption reaction proceeds faster, with the fastest adsorption rate of BN-4. However, intra-particle diffusion plays a positive part in controlling the rate step. The continued adsorption requires more time for transferring the TC to the interior to bind with the internal sites. At the same time, the TC molecules adhered to the surface of BN, and the adsorption force in the solution produced a repulsive force, so the adsorption rate began to become slow, and BN-4 gradually tended to the equilibrium of the reaction in 60 min. The adsorption rate increases with the increase of ethanol content, the adsorption rate increases with the increase of ethanol content this is because of the high specific surface area and defects provide more adsorption sites. Among them, BN-3 has the fastest adsorption rate. This is because the highest defect content can promote the diffusion and transport of TC molecules inside the material, which makes it easier for the adsorbed molecules to diffuse to the active sites inside the material and improves the adsorption efficiency. Compared to BN-4, BN-with a lower specific area has a greater adsorption capacity and absorption rate than BN-4 due to the higher number of defects, which can increase the effective surface area of BN.
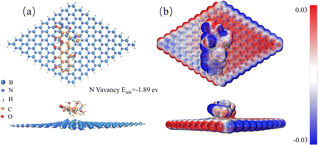
To validate the defect-modified BN to enhance the adsorption of TC molecules, a theoretical study on the defect-modified BN was carried out. It was reported that the charge transfer of TC molecules to the BN becomes more pronounced when nitrogen vacancies are present in the BN.35 Therefore, we mainly simulated the optimized geometries, the electron density difference, and the adsorption energies of the BN with N vacancies, as shown in Fig. 8. The adsorption energy of BN with N vacancies is −1.89 eV, which is lower than that previously reported in the literature,36 confirming that N vacancies are favorable for BN to adsorb TC molecules. According to Fig. 8(b), it can be seen that the charge transfer of TC molecules to BN becomes more pronounced, suggesting the presence of the dominated chemisorption.
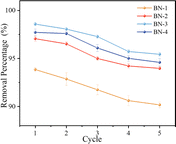
In addition, the adsorption cycle performances of all adsorbents were investigated as shown in Fig. 9. It can be seen that all samples still showed good adsorption performance (more than 90.5%) after three cycles of adsorption. However, the removal rate decreased significantly after the fourth cycle. This decrease may be attributed to the fact that the adsorption sites of BN were gradually saturated after performing four cycles and could not bind more TC molecules. However, BN-3 maintained the removal rate above 95.5% after five cycles with a smaller decrease in the removal rate, indicating that the increase in defect density improved the stability and regeneration of BN.
In natural water systems, various foreign cations and anions commonly coexist, necessitating consideration of the competition between these ions and TC during absorption processes. Given that BN-3 exhibited the highest absorption capacity among the four samples, it was chosen to investigate the impacts of ionic strength and pH on TC adsorption. As shown in Fig. 10, it can be observed that there is no significant competition between cations and TC adsorption, which could be due to that the BN-3 surface with the defects has a positive charge that repels cations, so there are no competing adsorption sites. In contrast, the negatively charged anion will rapidly adsorb to the BN surface, thereby significantly inhibiting the adsorption of TC molecules by BN-3.37 At the same time, pH also has a large effect on the ability to adsorb TC, as shown in Fig. 10(c). Its adsorption capacity will be significantly reduced in strong acid and alkali environments because H+ or OH− ions in solution will competitively adsorb with TC molecules, resulting in the weakening of the interaction between TC molecules and the adsorbent surface, thereby reducing the adsorption performance.
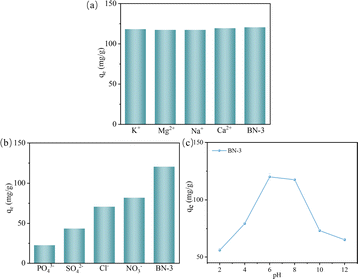 | ||
| Fig. 10 The effects of (a) 1 mmol cation ions, (b) 1 mmol anion ions, and (c) pH values on the adsorption of TC by BN-3 (T = 25 °C, C(TC) initial = 40 mg L−1). | ||
Conclusion
The defective BN was successfully synthesized by a facile hydrothermal and calcination method and the adsorption properties for TC were explored. The N defect was regulated by adjusting the volume ratio of water and ethanol. In particular, the resulting product had the highest N defect content at an H2O/ethanol ratio of 4![[thin space (1/6-em)]](https://www.rsc.org/images/entities/char_2009.gif) :
:![[thin space (1/6-em)]](https://www.rsc.org/images/entities/char_2009.gif) 1 (BN-3), resulting in a rapid adsorption capacity. Theoretical calculations and experimental results further verified that the introduction of nitrogen defects had a modulating influence on the electronic BN structure, improving its charge separation and migration efficiency. After five TC cycles of adsorption, BN-3 still maintained a high TC adsorption removal rate of 95.5%, which demonstrated that the defect-modified BN had excellent reusability and provided strong support for its application in pollutant adsorption.
1 (BN-3), resulting in a rapid adsorption capacity. Theoretical calculations and experimental results further verified that the introduction of nitrogen defects had a modulating influence on the electronic BN structure, improving its charge separation and migration efficiency. After five TC cycles of adsorption, BN-3 still maintained a high TC adsorption removal rate of 95.5%, which demonstrated that the defect-modified BN had excellent reusability and provided strong support for its application in pollutant adsorption.
Author contributions
Xi Chen: visualization, data curation, formal analysis, writing-original draft preparation. Yufei Tang: conceptualization, methodology, writing-reviewing and editing, funding acquisition. Zhangwen Xie: verification, investigation. Wanxing Zheng: investigation. Xiuying Lin: investigation. Yang Tie: investigation. Qian Liang: investigation. Zhuangzhuang Zhang: investigation. Zhaowei Liu: investigation. Kang Zhao: supervision.Conflicts of interest
There are no conflicts to declare.Acknowledgements
This work was supported by National Natural Science Foundation of China (Program No. 52172073) and Scientific Research Program Funded by Education Department of Shaanxi Provincial Government (Program No. 23JC058).References
- G. Tan, Y. Mao, H. Wang and N. Xu, Chem. Eng. Res. Des., 2020, 159, 582–591 CrossRef CAS.
- J. He, F. Ni, A. Cui, X. Chen, S. Deng, F. Shen, C. Huang, G. Yang, C. Song, J. Zhang, D. Tian, L. Long, Y. Zhu and L. Luo, Sci. Total Environ., 2020, 701, 134363 CrossRef CAS PubMed.
- Y. Liang, Q. Zhang, S. Li, J. Fei, J. Zhou, S. Shan, Z. Li, H. Li and S. Chen, J. Hazard. Mater., 2022, 423, 127181 CrossRef CAS PubMed.
- Z. Zhao, B. Liang, M. Wang, Q. Yang, M. Su and S. Liang, Chem. Eng. J., 2022, 427, 130943 CrossRef CAS.
- J. Chen, J. He, Z. Yin, T. Wang, S. Liu and S. Cao, Ceram. Int., 2023, 49, 22139–22148 CrossRef CAS.
- P. Arabkhani and A. Asfaram, J. Hazard. Mater., 2022, 429, 128289 CrossRef CAS PubMed.
- W. Ding, G. Zhou, S. Wen, J. Yin, C. Liu, Y. Fu and L. Zhang, Bioresour. Technol., 2022, 360, 127544 CrossRef CAS PubMed.
- Z.-Y. Zeng, D.-D. Zhou, S.-T. Yang, M.-M. Su and Z.-H. Yang, J. Environ. Chem. Eng., 2023, 11, 111336 CrossRef CAS.
- Y. Wang, D. Han, Z. Wang and F. Gu, ACS Appl. Mater. Interfaces, 2023, 15, 22085–22100 CrossRef CAS PubMed.
- L. Wang, J. Cheng, Z. Jin, Q. Sun, R. Zou, Q. Meng, K. Liu, Y. Su and Q. Zhang, Fuel, 2023, 344, 127919 CrossRef CAS.
- R. S. Bangari and N. Sinha, J. Mol. Liq., 2019, 293, 111376 CrossRef CAS.
- Y. Zhao, H. Gu, Y. Zhou, C. Wen, X. Liu, S. Wang, Z. Chen, H. Yang and X. Wang, J. Environ. Sci., 2024, 141, 63–89 CrossRef PubMed.
- E. Janzen, H. Schutte, J. Plo, A. Rousseau, T. Michel, W. Desrat, P. Valvin, V. Jacques, G. Cassabois, B. Gil and J. H. Edgar, Adv. Mater., 2023, 2306033 Search PubMed.
- C. Martínez-Jiménez, A. Chow, A. D. Smith McWilliams and A. A. Martí, Nanoscale, 2023, 15, 16836–16873 RSC.
- J. S. Algethami, K. K. Yadav, A. Gacem, I. H. Ali, S. Rezania, M. S. O. Alhar, A. Mezni, B.-H. Jeon and S. Chaiprapat, Environ. Sci. Pollut. Res., 2023 DOI:10.1007/s11356-023-28134-3.
- R. Han, J. Ren, Z. Zhou, G.-X. Chen and Q. Li, ACS Appl. Mater. Interfaces, 2023, 15, 34064–34074 CrossRef CAS PubMed.
- M. Shakourian-Fard and G. Kamath, Phys. Chem. Chem. Phys., 2017, 19, 4383–4395 RSC.
- Q. Song, J. Liang, Y. Fang, Z. Guo, Z. Du, L. Zhang, Z. Liu, Y. Huang, J. Lin and C. Tang, Chem. Eng. J., 2020, 394, 124985 CrossRef CAS.
- Z. Liu, K. Zhao, D. Li and Y. Tang, J. Am. Ceram. Soc., 2021, 104, 1601–1610 CrossRef CAS.
- Y. Li, L. Liu, H. Yu, Y. Zhao, J. Dai, Y. Zhong, Z. Pan and H. Yu, Sci. Total Environ., 2022, 811, 151384 CrossRef CAS PubMed.
- J. Xiong, J. Di, W. Zhu and H. Li, J. Energy Chem., 2020, 40, 99–111 CrossRef.
- Y. Chao, J. Zhang, H. Li, P. Wu, X. Li, H. Chang, J. He, H. Wu, H. Li and W. Zhu, Chem. Eng. J., 2020, 387, 124138 CrossRef CAS.
- Z. F. Wu, L. Guo, K. Cheng, F. Zhang and R. F. Guan, Ceram. Int., 2016, 42, 4171–4175 CrossRef CAS.
- J. Zhu, X. Cao and J. Li, Langmuir, 2022, 38, 13910–13915 CrossRef CAS PubMed.
- G. Azuara-Tuexi, E. Muñoz-Sandoval and R. A. Guirado-López, Phys. Chem. Chem. Phys., 2023, 25, 3718–3736 RSC.
- Z. Tian, K. Chen, S. Sun, J. Zhang, W. Cui, Z. Xie and G. Liu, J. Adv. Ceram., 2019, 8, 72–78 CrossRef CAS.
- S. Hosseini, F. Eghbali Babadi, S. Masoudi Soltani, M. K. Aroua, S. Babamohammadi and A. Mousavi Moghadam, Process Saf. Environ. Prot., 2017, 109, 387–399 CrossRef CAS.
- X. Dao, H. Hao, J. Bi, S. Sun and X. Huang, Ind. Eng. Chem. Res., 2022, 61, 6028–6036 CrossRef CAS.
- L. Zhang, Z. Xin, X. Fei, H. Luo, H. Li, B. Lu, Z. Li and G. Wei, J. Water Supply: Res. Technol.–AQUA, 2019, 68, 39–50 CrossRef.
- H. Wang, C. Fang, Q. Wang, Y. Chu, Y. Song, Y. Chen and X. Xue, RSC Adv., 2018, 8, 16260–16268 RSC.
- S. S. Dindorkar, R. V. Patel and A. Yadav, Colloids Surf., A, 2022, 643, 128795 CrossRef CAS.
- W. Gao, Z. Lin, H. Chen, S. Yan, H. Zhu, H. Zhang, H. Sun, S. Zhang, S. Zhang and Y. Wu, J. Anal. Appl. Pyrolysis, 2022, 167, 105700 CrossRef CAS.
- C. Chen, Y. Hang, H. S. Wang, Y. Wang, X. Wang, C. Jiang, Y. Feng, C. Liu, E. Janzen, J. H. Edgar, Z. Wei, W. Guo, W. Hu, Z. Zhang, H. Wang and X. Xie, Adv. Mater., 2023, 35, 2303198 CrossRef CAS PubMed.
- Q. Song, Y. Fang, Z. Liu, L. Li, Y. Wang, J. Liang, Y. Huang, J. Lin, L. Hu, J. Zhang and C. Tang, Chem. Eng. J., 2017, 325, 71–79 CrossRef CAS.
- M. Shakourian-Fard, S. Maryamdokht Taimoory, H. R. Ghenaatian, G. Kamath and J. F. Trant, J. Mol. Liq., 2022, 349, 118122 CrossRef CAS.
- L. Li, X. Yu, X. Yang, Y. Fang, X. Zhang, X. Xu, P. Jin and C. Tang, J. Mater. Chem. A, 2016, 4, 15631–15637 RSC.
- S. Wang, M. Hao, D. Xiao, T. Zhang, H. Li and Z. Chen, Chin. J. Chem. Eng., 2023, 59, 200–209 CrossRef.
| This journal is © The Royal Society of Chemistry 2024 |

