 Open Access Article
Ecological assessment and development of analytical methods for concurrent quantification of valsartan and sacubitril: whiteness comparative study based on relative scoring †
Ahmed K. Kammouna,
Mostafa A. Afify b,
Rasha M. Youssef
 b,
Sara A. El-Nahassc and
Sameh E. Younis*d
aDepartment of Pharmaceutical Chemistry, Faculty of Pharmacy, King Abdulaziz University, P.O. Box 80260, Jeddah 21589, Saudi Arabia
bDepartment of Pharmaceutical Analytical Chemistry, Faculty of Pharmacy, Alexandria University, Alexandria, Egypt
cHealthy Care Clinics, Alexandria/INTRAWOOD, International Trading of Wood, Alexandria, Egypt
dDepartment of Pharmaceutical Chemistry, Faculty of Pharmacy, Pharos University in Alexandria, Alexandria, Egypt. E-mail: smhyones@yahoo.com; sameh.yones@pua.edu.eg
First published on 21st May 2024
Abstract
Sustainable analytical chemistry is gaining great interest in global environmental pollution control. In addition, valsartan (VAS) and sacubitril (SAB) have been recently approved by the FDA as a fixed-dose combination “LCZ696”. It showed efficacy and safety enough to extend its application from heart failure to hypertension control. VAS/SAB dual therapy is considered expensive; however, its prescription has increased significantly worldwide. This prescription increased the demand for developing sustainable analytical methods that simultaneously analyze VAS and SAB. Highly sensitive and selective spectrofluorimetric methods have been developed for this purpose. A synchronous spectrofluorimetric technique was applied. In one method, it was followed by spectral derivatization at the first-order level. The signals were recorded at 230 and 211 nm for VAS and SAB, respectively. Synchronous spectrofluorimetry was coupled to a dual-wavelength mathematical approach in the second method. Signals were derived by subtracting synchronous responses at 241 nm, 226 nm, and 239 nm from the response at 208 nm for VAS and SAB, respectively. Method validation was carried out following ICH guidelines. VAS showed linear calibration curves spanning the range of 60–200 and 80–600 ng mL−1 for the derivative and dual wavelength-assisted approaches, respectively. SAB achieved linear responses in the range of 17–190 and 30–350 ng mL−1 for the first and second methods, respectively. The green profile of the proposed methods was confirmed using the analytical eco-scale (AES), green analytical procedure index (GAPI), and analytical greenness metric (AGREE) tools. The proposed hybrid methods proved highly sustainable through the whiteness RGB 12 algorithm evaluation approach. Whiteness was comparatively assessed for the proposed and reported methods based on relative scoring depending on the parameters of each method. Despite this scoring approach being accurate as a relative score for comparative purposes, it gave rise to underestimated absolute scores. Therefore, to obtain a proper conclusion from the comparative whiteness study, all the methods were ranked according to their whiteness score, illustrating the excellent whiteness ranks of the proposed methods. Upon complete comparison with the reported methods, the suggested ones showed several advantages concerning analytical performance and the greenness level. The proven affordability and simplicity encourage their wide industrial application in developing countries.
1. Introduction
Heart failure (HF) is a disease in which the mortality rate increases by six to nine times more than the normal population.1 This mortality rate makes ongoing efforts to develop new HF therapies a necessity; one of these therapies is LCZ696. However, it was used as a late-line treatment owing to its high commercial price. However, its role was highly considerable to improve the HF therapy and avoid the toxic “digoxin” use or even heart replacement.2 LCZ696 is a valsartan (VAS)/sacubitril (SAB) complex; Fig. 1.3 Thus, it has a dual pharmacological action. VAS blocks the angiotensin II receptor, and SAB prevents the degradation of vasoactive peptides via neprilysin inhibition. SAB did not succeed as a single HF therapy. On the contrary, the use of the VAS/SAB complex presented a significant improvement for HF patients, even more than that attained by VAS alone.4LCZ696 was rapidly introduced into all HF guidelines and became essential in the treatment protocols for developed and developing countries.5,6 This required establishing reliable analytical methods to analyze this combined therapy. Two spectrophotometric7,8 and three HPTLC9–11 methods have been reported for this purpose. In addition, LCZ696 was assayed by HPLC using many approaches.9,10,12–24 In addition, VAS and SAB were simultaneously analyzed via spectrofluorometric technique.25–27 Very recently, a MEKC method was developed for the same purpose.28
Although synchronous spectrofluorimetry (SF) provides better selectivity and sensitivity than the traditional approach, SF needs further coupling with another analytical method for complete spectral resolution in some cases. Derivative-mathematical and dual-wavelength treatments are the most widely coupled techniques with SF.29 On the other hand, green chemistry has become crucial in developing analytical procedures. There are various qualitative and quantitative metric systems. However, using them together is preferred for the complete picture of the method of greenness.
Current work aims to develop green, reliable, and affordable analytical approaches for the simultaneous analysis of VAS and SAB in their raw materials and LCZ696 tablets. They couple SF with first-derivative and dual-wavelength manipulations. No tedious pretreatment steps were needed. All ICH validation parameters were fulfilled. The green profile was confirmed via the eco-scale penalty points, GAPI, and AGREE tools to avoid any hazardous and risky exposure to the analyst or environment while applying the proposed methods.
Moreover, the AGREE assessment was employed to compare the greenness level between the suggested and reported methods. In addition, the methods' whiteness was comparatively investigated via the RGB 12 model proposed by Nowak et al. that was applied in recent publications for comparative purposes.30,31 A complete comparative study of sustainability was performed for the proposed and reported methods based on relative scoring depending on the parameters of each method.
2. Experimental
2.1. Materials, reagents and pharmaceutical formulations
VAS raw material was obtained free of charge from the Egyptian International Pharmaceutical Industries Company (Egypt). SAB authentic powder was purchased from Beijing Mesochem Technology Co. Ltd, China. Lobachemie Pvt. Ltd (India) and El-Nasr Chemical Company (Egypt) were the suppliers of analytical-grade methanol and sulfuric acid. The distilled water was filtered through 0.45 μm disposable filters before use. A commercial product (Entresto 50®, batch number TDW73) was studied.2.2. Instrumentation
The spectrofluorometer used was the G9800A Cary Eclipse fluorescence spectrophotometer (Agilent Technologies, USA). Its light source was a long-life Xenon flash lamp. Samples were placed in a 1 cm quartz cell. The grating monochromators were adjusted at 5 nm slit width for both excitation and emission. The operation voltage was 600 volts.2.3. Standard solutions
Individual VAS and SAB stock solutions were prepared in methanol at a concentration of 100 μg mL−1. They were appropriately diluted with methanol to 5 μg mL−1 working solutions.2.4. Construction of calibration graphs
Various volumes from VAS and SAB working standard solutions were poured into separate 10 mL volumetric flasks. Each flask was completed to the mark with 0.1 M sulfuric acid to obtain the concentration ranges of 60–200 and 17–190 ng mL−1 for VAS and SAB, respectively, in the SF-D1 coupled approach. The concentration ranges of 80–200 and 30–350 ng mL−1 for VAS and SAB were also prepared for the SF-Δλ coupled approach. Spectrofluorimetric measurements were carried out in triplicates, using synchronous mode at constant wavelength Δλ of 130 nm between excitation and emission wavelengths. The zero-order synchronous spectrofluorimetric spectra were recorded and corrected by subtracting the blank spectrum.The measured amplitudes in each method were correlated to the corresponding concentrations, and regression equations for VAS and SAB were acquired.
2.5. Procedure for tablet analysis
VAS and SAB were determined in their combined commercial tablets (Entresto 50®, batch number TDW73). A part of the powdered ground tablets containing 8.5 and 8.0 mg VAS and SAB, respectively, were used. It was placed in a 100 mL volumetric flask. The flask was filled with methanol up to half its volume and placed in the sonicator for 30 minutes. The solution was completed with methanol till it reached the volume mark. One hundred μL of this filtrate was appropriately diluted with 0.1 M sulfuric acid to 100 mL volume. Finally, a clear tablet extract containing 85 and 80 ng mL−1 VAS and SAB was obtained. Then, the steps in the “Generation of regression equations” were followed for both hybrid approaches.3. Results and discussions
3.1. Method optimization
In SF, the excitation and emission wavelengths are scanned at the same time. A wavelength difference (Δλ) is determined and set between λem and λex throughout all measurements, resulting in a significantly narrower band. Consequently, a simpler spectrum is obtained, and the resolution and selectivity are enhanced. Thus, SF represents a sensitive approach for concurrently analyzing multicomponent samples. However, SF may not achieve the required resolution for all components in a mixture. In such cases, coupling it with various mathematical treatments will be beneficial to obtain enhanced performance. As a coupled technique, the derivative approach presents a synergistic role in enhancing SF signals concerning resolution and sensitivity. In addition, dual-wavelength presents another coupled technique that is coadjuvant to SF. Its signal arises from the difference in SF amplitude at two wavelengths, and the correct choice for the measured analyte is the most important step in this technique to reach a difference signal for the co-existing analyte at a non-significant level.Regarding the proposed methods, VAS has a proven native fluorescence.32,33 For SF spectra generation, Δλ (λem–λex) of 130 nm was chosen as the best compromise between peak separation, peak integrity, and signal intensities. As a diluting solvent, 0.1 M sulfuric was chosen for the highest synchronous response for both drugs (Fig. 2). Also, the synchronous spectra of VAS and SAB were not well separated. Based on these results, we employed two hybrid approaches to resolve VAS and SAB completely, resulting in high assay reliability.
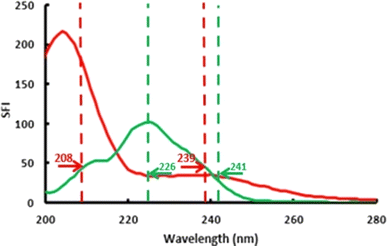 | ||
| Fig. 2 Dual wavelength points on the synchronous fluorescence spectra (Δλ = 130 nm) of 200 ng mL−1 VAS (green line) and 190 ng mL−1 SAB (red line) in 0.1 M H2SO4. | ||
In the first approach, spectrofluorimetric synchronous spectra were derivatized. Derivatization at the first order was enough to achieve optimum resolution between VAS and SAB. Higher-order derivatives did not provide better performance. Derivative wavelength increment (Δλ) is critical to control spectral resolution, sensitivity, and background noise.34–36 Δλ of 5 nm was selected as it achieved the most acceptable compromise between these items. To eliminate cross-interference, SF-D1 amplitudes of each drug were measured at the zero-crossing of the other component. Thus, VAS and SAB were measured at 230 and 211 nm, respectively (Fig. 3).
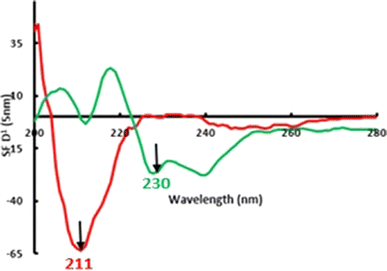 | ||
| Fig. 3 Zero-crossing points on the first derivative synchronous spectra (Δλ = 5 nm) of 200 ng mL−1 VAS (green line) and 190 ng mL−1 SAB (red line) in 0.1 M H2SO4. | ||
Regarding the second approach, the simple dual wavelength method was coupled.37 For VAS determination, the interference of SAB was eliminated by recording the difference in VAS synchronous values at wavelengths where SAB has the same contribution (226 and 241 nm). For SAB quantification, the interference of VAS was eliminated by subtracting synchronous values at 239 nm from the response at 208 nm where VAS has the same signal intensity (Fig. 2).
3.2. Validation of the proposed methods
ICH guidelines were followed to validate the suggested SF-D1 and SF-Δλ methods.38| Parameters | SF-D1 | SF-Δλ | ||
|---|---|---|---|---|
| VAS | SAB | VAS | SAB | |
| a Calculated as mean % recovery from synthetic mixtures of three different ratios (n = 9).b Calculated as (mean % recovery ± RSD%) from standard addition method synthetic mixtures at three concentration levels (n = 9).c Calculated as mean RSD% from synthetic mixtures of three different ratios (n = 9).d Concentration in ng mL−1.e Sa is the standard deviation of intercept, Sb is the standard deviation of the slope, and Sy/x is the standard deviation of residuals. | ||||
| Selectivitya | 100.88 | 101.13 | 101.52 | 99.04 |
| Accuracyb | 101.58 | 99.60 | 99.81 | 100.74 |
| Intra-day precisionc | 1.10 | 0.81 | 1.37 | 0.53 |
| Inter-day precisionc | 1.34 | 1.07 | 0.94 | 0.79 |
| Linearity ranged | 60–200 | 17–190 | 80–600 | 30–350 |
| LODd | 7.03 | 5.06 | 14.39 | 8.91 |
| LOQd | 23.44 | 16.87 | 47.96 | 29.72 |
| Intercept (a) | 2.31 | −0.81 | −0.99 | 7.28 |
| Slope (b) | 3.47 × 10⁻² | 0.41 | 5.95 × 10⁻² | 1.17 |
| Correlation coefficient (r) | 0.9995 | 0.9984 | 0.9996 | 0.9993 |
| r2 | 0.9991 | 0.9968 | 0.9992 | 0.9990 |
| Sae | 8.13 × 10⁻² | 0.69 | 0.29 | 3.46 |
| Sbe | 6.14 × 10⁻⁴ | 8.23 × 10⁻³ | 9.71 × 10⁻⁴ | 2.21 × 10⁻² |
| Sy/x(b,e) | 6.36 × 10⁻² | 1.56 | 0.42 | 6.17 |
| Sb% | 1.77 | 2.01 | 1.63 | 1.89 |
| F | 3189.04 | 946.39 | 3745.824 | 2145.17 |
| Significance F | 1.22 × 10⁻⁵ | 7.55 × 10⁻⁵ | 9.61 10−6 | 2.22 × 10⁻⁵ |
The previous laboratory-prepared VAS/SAB mixtures were analyzed in triplicates. Analysis was performed on the same day or three days to evaluate the intra- or inter-day precision approaches, respectively. RSD% values (<2%) were within the limits that fulfill the precision parameter, Table 1.
3.3. Assay of pharmaceutical tablets
The VAS/SAB solution was prepared by extraction from their commercial combined tablets. Mean% recovery and RSD% were obtained from 5-replicate analysis by the suggested SF-D1 and SF-Δλ methods. Their values were acceptable, so interference from tablet excipients was predicted to be insignificant. The suggested method was statistically compared with the reported one.25 Tht- and F-test outputs were within the acceptable theoretical limits (Table 2). Thus, the methods proved highly reliable with respect to the VAS/SAB fixed-dose combination assay.| Entresto®a | Mean% recovery ± SD | tc | Fc |
|---|---|---|---|
| a Labelled to contain 25.70 mg VAS and 24.30 mg SAB per tablet (batch number TDW73).b First derivative spectrofluorimetry in 0.1 M H2SO4 at 448 and 300 nm for VAS and SAB, respectively.c Theoretical values of t and F at p = 0.05 are 2.31 and 6.39, respectively. | |||
| VAS | |||
| SF-D1 | 100.56 ± 0.98 | 1.06 | 1.43 |
| SF-Δλ | 101.10 ± 1.05 | 1.62 | 1.23 |
| Reported methodb | 99.62 ± 1.17 | ||
| SAB | |||
| SF-D1 | 99.89 ± 0.72 | 2.18 | 1.78 |
| SF-Δλ | 100.63 ± 0.59 | 1.01 | 2.60 |
| Reported method | 101.21 ± 0.96 | ||
3.4. Evaluation of the greenness of the method
Green analytical chemistry (GAC) aims to encourage chemists to consider the effect of their analytical procedures on the environment, personal safety, and health. GAC necessitates implementing dedicated approaches to outline the green profiles of the analytical methods. The analytical eco-scale tool was employed as a preliminary judgment on the greenness of the proposed methods.40–43 It quantifies a method's green parameters. It is based on penalty points (PPs) to reach a total numerical score as an accurate description of greenness. This score is calculated by subtracting penalty points of reagent toxicity, instrument energy consumption, and waste generation from a base of 100. The result is determined by the number of residual points: >75 represents excellent green analysis, >50 indicates acceptable green analysis, and <50 means inadequate green analysis. Table 3 presents the detailed penalty points for each reagent and instrument employed in the suggested hybrid methods. For both methods, the overall penalty points were 14 only. Thus, the total eco-scale score was 86; much higher than 75. This proved the excellent green profile of the proposed hybrid methods.| (a) Analytical eco-scale | ||
|---|---|---|
| Eco-scale parameter | Subtotal penalty points | Total Penalty points |
| a Calculated as (GSH hazard pictograms × degree of hazard).b Calculated as (amount PP × hazard PP).c Calculated as (waste volume PP + waste treatment PP). | ||
| 0.1 M H2SO4 amount (<10 mL) | 1 | 2b |
| 0.1 M H2SO4 hazard | 2a | |
| Methanol amount (<1 mL) | 1 | 6b |
| Methanol hazard | 6a | |
| Spectrofluorimeter (≤0.1 kW h/sample) | 0 | |
| Sonicator (≤0.1 kW h/sample) | 0 | |
| Waste volume (10 mL) | 3 | 6c |
| Waste treatment (none) | 3 | |
| Overall penalty points | 14 | |
| Total eco-scale score | 86 | |
| (b) GAPI | |
|---|---|
| GAPI parameter | Status |
| Sample preparation | |
| (1) Collection | At-line |
| (2) Preservation | None |
| (3) Transport | None |
| (4) Storage | Under none conditions |
| (5) Type of method (direct or indirect) | Filtration |
| (6) Scale of extraction | None |
| (7) Solvents/reagents used | None |
| (8) Additional treatment | None |
![[thin space (1/6-em)]](https://www.rsc.org/images/entities/char_2009.gif) |
|
| Reagents and solvents used (9–11) | |
| (9) Amount | < 10 mL |
| (10) Health hazard | NFPA health hazard score = 3 |
| (11) Safety hazard | NFPA fire hazard score = 0 |
![[thin space (1/6-em)]](https://www.rsc.org/images/entities/char_2009.gif) |
|
| Instrumentation | |
| (12) Energy | ≤ 0.1 kW h/sample |
| (13) Occupational hazard | — |
| (14) Waste | 1–10 mL |
| (15) Waste treatment | No treatment |
| Quantification | Yes |
A green analytical procedure index (GAPI) metric was applied to attain an inclusive greenness evaluation and rational ranking of the applied methods.44–46 This metric offers an ecological assessment of the entire method, from sample preparation to the final determination step. It is represented as a colored pictogram composed of 15 evaluated parameters. These parameters include sample collection, preservation, transportation, solvents and reagents, energy consumed, waste generated, and other instrumental parameters. Each section is colored green, yellow, or red, indicating a low, medium, or high negative environmental impact. After inspection of the developed methods' GAPI pictograms visually, it was found that both proposed hybrid methods are ranked as green since they both obtained six green zones, five yellow zones, and only one red zone (Fig. 4, Table 3).
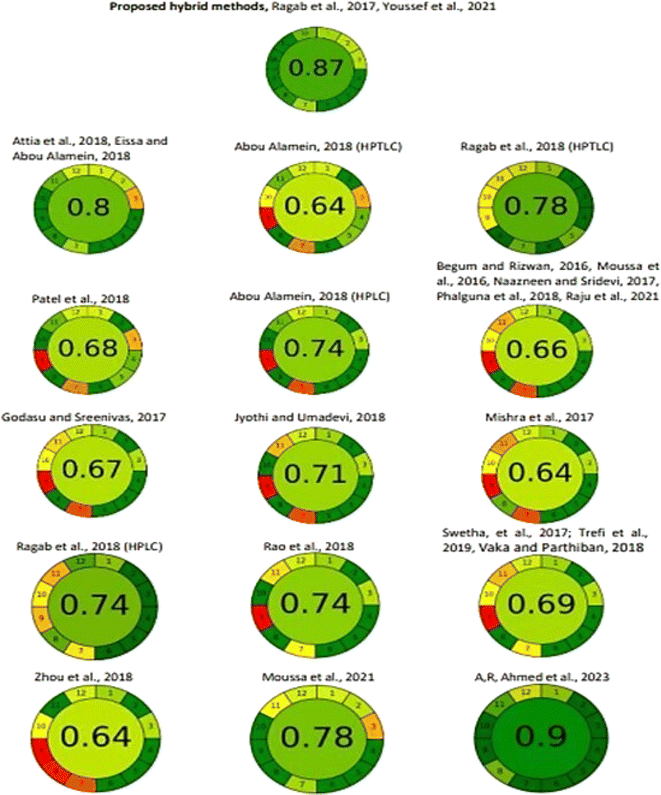
The recent AGREE tool was implemented to provide a more comprehensive and informative appraisal of the methods' greenness.47,48 This downloadable software was used to evaluate the method's greenness based on the 12 GAC principles (SIGNIFICANCE). After inputting the 12 variables of each method, automatically, an output of a clock-like graph was generated. This graph comprises 12 sections, colored from deep green to red, with a total numerical score in the center. The score is a fraction of unity; it ranges from 0 to 1. From the illustrated AGREE chart of the proposed SF-D1 and SF-Δλ methods (Fig. 5), the AGREE score was found to be 0.87, indicating that the developed hybrid methods are green.
In addition, the AGREE tool was applied to the proposed versus all reported methods, in a comparative approach (Fig. 5). The proposed hybrid method revealed an AGREE score much higher than those of almost all the reported methods. Two reported spectrofluorimetrics had the same AGREE score as the suggested ones. Only the recently reported MEKC method showed a slightly higher AGREE score in a non-significant way.
3.5. Comparative evaluation of the method whiteness
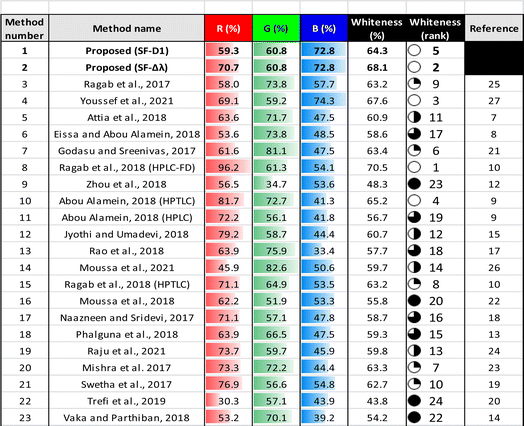
Method whiteness was comparatively evaluated for the proposed method and previously reported methods via the RGB 12 approach, as illustrated in ESI 1† and Table 4. The proposed SF-Δλ and SF-D1 methods showed the second and the fifth rank, respectively.The scoring of R2, R3, R4, G1, G2, G4, B1, B2, and B3 metrics followed relative ranking. Despite this scoring approach being accurate as a relative score for comparative purposes, it gave rise to underestimated absolute scores. Therefore, to obtain the right conclusion from the comparative whiteness study, a whiteness rank was calculated as shown in Table 4, illustrating excellent whiteness ranks of the proposed methods.
3.6. Comparative evaluation of the method performance
While spectrofluorimetric spectra depend on λex and λem, spectrophotometric ones depend on λmax only.49 Hence, the reported spectrophotometric methods7,8 have lower spectral resolution than the proposed methods. In addition, applying the synchronous mode improves their selectivity over the reported traditional spectrofluorimetric ones.25,26 Moreover, one of them26 employs less green and more expensive solvent (acetonitrile). Compared with the reported synchronous-derivative ratio method,27 coupling with derivative and dual-wavelength approaches present much simpler techniques. Thus, the suggested methods do not necessitate the presence of a highly trained operator or highly advanced spectrofluorimeter software.As spectroscopic methods, both proposed methods are much easier, faster and cheaper than the reported chromatographic ones. Moreover, unlike the reported chromatographic methods that consume organic solvents, the proposed hybrid methods are applied in the aqueous phase. As a consequence, they are more eco-friendly than the reported chromatographic ones.9–24,28 Finally, the proposed methods showed more sensitive calibration ranges than most reported methods. Only one reported HPLC-Flu method10 has a linearity scale at slightly lower concentrations. However, it is limited by its chromatographic nature. In addition, the recently reported chromatographic method28 may be subjected to poor reproducibility due to its MEKC nature. This is referred to as the high sensitivity to minor changes in BGE pH and composition. In conclusion, the highly sensitive linearity ranges, using small amounts of green solvents and ease of operation, and the presented highly sustainable profiles provide experimental evidence for the superiority of the proposed methods over the previously reported ones. In addition, the suggested methods experimentally succeeded in assaying VAS/SAB combined tablets with high reliability concerning accuracy and precision (Section 3.3).
4. Conclusions
The present research provides two reliable hybrid assays for simultaneously analyzing VAS and SAB in their combined tablets. It depends on the synchronous spectrofluorimetric measurement, followed by first-derivative or dual-wavelength mathematical treatments. The proposed methods showed several privileges over the reported ones concerning simplicity, analysis time, and sensitivity. Analytical eco-scale, GAPI, and AGREE metrics were used to assess the greenness of the developed methods. The proposed methods are proven to be white, green, economical, with no need for organic solvents, and consume less time. Their high accuracy and precision recommend the methods used in the routine industrial assay of LCZ696 (VAS/SAB) tablets. The affordable cost potentiates their application in all countries, regardless of their economic state.Conflicts of interest
There are no conflicts to declare.Acknowledgements
“This research work was funded by Institutional Fund Projects under grant no. (IFPIP: 841-166-1443). The authors gratefully acknowledge technical and financial support provided by the Ministry of Education and King Abdulaziz University, DSR, Jeddah, Saudi Arabia”.References
- Wellness, Emory Healthcare, Heart Failure Statistics, 2018 Search PubMed.
- M. B. Andersen, U. Simonsen, M. Wehland, J. Pietsch and D. Grimm, Basic Clin. Pharmacol. Toxicol., 2016, 118, 14–22 CrossRef CAS PubMed.
- Z. Qianqian, C. Qixin and Y. H. Lichun, China: Worldwide applications; 105622535A, 2015, p. 15 Search PubMed.
- D. G. Waller and A. P. Sampson, in Medical Pharmacology and Therapeutics, Elsevier Science Publishing Co Inc, 5th edn, 2018, pp. 131–142 Search PubMed.
- P. Ponikowski, A. A. Voors, S. D. Anker, H. Bueno, J. G. F. Cleland, A. J. S. Coats and C. Davies, Eur. Heart J., 2016, 37, 2129–2200 CrossRef PubMed.
- C. Yancy, M. Jessup, B. Bozkurt, J. Butler, D. E. Casey, M. M. Colvin, M. H. Drazner, G. S. Filippatos, G. C. Fonarow, M. M. Givertz, S. M. Hollenberg, J. A. Lindenfeld, F. A. Masoudi, P. E. McBride, P. N. Peterson, L. W. Stevenson and C. Westlake, Circulation, 2017, 136, e137–e161 CrossRef PubMed.
- K. Attia, M. Nassar, A. El-Olemy and S. Ramzy, J. Adv. Res., 2018, 2, 133–141 Search PubMed.
- M. S. Eissa and A. M. Abou Al Alamein, Spectrochim. Acta, Part A, 2018, 193, 365–374 CrossRef CAS PubMed.
- A. Abou Al Alamein, J. Appl. Pharm. Sci., 2018, 8, 011–017 CrossRef CAS.
- M. A. A. Ragab, S. M. Galal, M. A. Korany and A. R. Ahmed, J. Chromatogr. Sci., 2018, 56, 498–509 CAS.
- G. Patel, A. Vohra and S. Shah, International Journal in Pharmaceutical & Nanotechnology, 2018, 11, 4208–4218 Search PubMed.
- S. Trefi, Y. Bitar and V. Gilard, Res. J. Pharm. Technol., 2019, 12, 1017–1022 CrossRef.
- S. K. Godasu and S. A. Sreenivas, Eur. J. Biomed. Pharmaceut. Sci., 2017, 4, 640–645 CAS.
- B. A. Moussa, H. M. A. Hashem, M. A. Mahrouse and S. T. Mahmoud, Chromatographia, 2018, 81, 139–156 CrossRef CAS.
- S. Mishra, C. J. Patel and M. M. Patel, Int. J. Appl. Pharm., 2017, 9, 1–8 CrossRef CAS.
- T. N. Raju, D. R. Kumar and D. Ramachandran, J. Appl. Chem., 2017, 6(5), 1004–1011 CAS.
- L. Zhou, L. Zou, L. Sun, H. Zhang, W. Hui and Q. Zou, Anal. Methods, 2018, 10, 1046–1053 RSC.
- Y. Phalguna, N. Jahan, N. Indraja and G. Satheesh, Asian J. Res. Pharm. Sci. Biotechnol., 2018, 8, 09–16 Search PubMed.
- S. Vaka and P. Parthiban, Int. J. Res., 2018, 4, 17–24 Search PubMed.
- U. Jyothi and P. Umadevi, J. Pharmaceut. Sci. Res., 2018, 10, 2201–2204 CAS.
- F. Begum and Sh. Rizwan, International Journal of Farmacia, 2016, 2, 79–87 Search PubMed.
- B. S. Rao, M. V. Reddy and B. S. Rao, World J. Pharm. Pharm. Sci., 2018, 7, 1435–1451 CAS.
- S. Naazneen and A. Sridevi, Int. J. Appl. Pharm., 2017, 9, 9–15 CrossRef CAS.
- V. Swetha, S. V. U. M. Prasad and M. Indupriya, World Journal of Pharmaceutical and Life Sciences, 2017, 3, 185–191 Search PubMed.
- M. A. A. Ragab, S. M. Galal, M. A. Korany and A. R. Ahmed, Luminescence, 2017, 32, 1417–1425 CrossRef CAS PubMed.
- B. A. Moussa, H. M. A. Hashem, M. Alphonse Mahrouse, M. A. Mahrouse and S. T. Mahmoud, Spectrochim. Acta, Part A, 2021, 253, 119613 CrossRef CAS PubMed.
- R. M. Youssef, S. A. El-Nahass, S. A. Soliman and S. E. Younis, Spectrochim. Acta, Part A, 2021, 256, 119748 CrossRef CAS PubMed.
- A. R. Ahmed, S. M. Galal, M. A. Korany and M. A. A. Ragab, Sustainable Chem. Pharm., 2023, 33, 101066 CrossRef CAS.
- Y.-Q. Li, X.-Y. Li, A. A. F. Shindi, Z.-X. Zou, Q. Liu, L.-R. Lin and N. Li, Synchronous Fluorescence Spectroscopy and Its Applications in Clinical Analysis and Food Safety, Evaluation, 2012, 95–117 Search PubMed.
- P. M. Nowak, R. Wietecha-Posłuszny and J. Pawliszyn, Trends Anal. Chem., 2021, 138, 116223 CrossRef CAS.
- M. A. Korany, R. M. Youssef, M. A. A. Ragab and M. A. Afify, Microchem. J., 2024, 196, 109616 CrossRef CAS.
- R. A. Shaalan and T. S. Bela, Drug Test. Anal., 2010, 2, 489–493 CrossRef CAS PubMed.
- A. M. Zeid, R. Aboshabana and F. A. Ibrahim, Spectrochim. Acta, Part A, 2022, 26, 120591 CrossRef PubMed.
- S. E. Younis, S. A. El-Nahass, R. M. Youssef and S. A. Soliman, Microchem. J., 2020, 1, 156 Search PubMed.
- R. M. Youssef, A. M. Abdelhafez, E. M. Hassan and D. A. Gawad, Spectrochim. Acta, Part A, 2022, 271, 120904 CrossRef PubMed.
- R. M. Youssef, Saudi Pharm. J., 2010, 18, 45–49 CrossRef CAS PubMed.
- K. A. M. Attia, A. El-Olemy, S. Ramzy, A. H. Abdelazim, M. A. Hasan and R. F. Abdel-Kareem, Spectrochim. Acta, Part A, 2021, 248 CrossRef CAS PubMed.
- ICH, Harmonised Tripartite Guideline.: Text and Methodology Q2(R1), Harmon Tripart Guidel, 1995 Search PubMed.
- J. Miller and J. Miller, Statistics and Chemometrics for Analytical Chemistry, 4th edn, 2000 Search PubMed.
- A. F. El-Yazbi, E. F. Khamis, R. M. Youssef, M. A. El-Sayed and F. M. Aboukhalil, Helyion, 2020, 6(9) CAS.
- A. F. El-Yazbi, F. M. Aboukhalil, E. F. Khamis, R. M. Youssef and M. A. El-Sayed, Microchem. J., 2021, 163, 105900 CrossRef CAS.
- M. Tobiszewski, M. Marć, A. Gałuszka and J. Namieśnik, Molecules, 2015, 20, 10928–10946 CrossRef CAS PubMed.
- A. Gałuszka, P. Konieczka, Z. M. Migaszewski and J. Namiesnik, Trends Anal. Chem., 2012, 37, 61–72 CrossRef.
- A. F. El-Yazbi, F. M. Aboukhalil, E. F. Khamis, R. M. Youssef and M. A. El-Sayed, JPC (J. Planar Chromatogr.) - Mod. TLC, 2021, 34, 455–466 CrossRef CAS.
- A. F. El-Yazbi, F. M. Aboukhalil, E. F. Khamis, R. M. Youssef and M. A. El-Sayed, Beni-Suef University Journal of Basic and Applied Sciences, 2022, vol. 11, p. 15 Search PubMed.
- J. Płotka-Wasylka, new tool for the evaluation of the analytical procedure: Green Analytical Procedure Index, Talanta, 2018 Search PubMed.
- A. H. Abo-Gharam and D. S. El-Kafrawy, Sustainable Chem. Pharm., 2022, 29, 14 Search PubMed.
- W. W. Francisco Pena-Pereira and M. Tobiszewski, Anal. Chem., 2020, 92, 10076–10082 CrossRef PubMed.
- A. Nahata, Pharm. Anal. Acta, 2011, 02, 1000107e Search PubMed.
Footnote |
| † Electronic supplementary information (ESI) available. See DOI: https://doi.org/10.1039/d4ra01997k |
| This journal is © The Royal Society of Chemistry 2024 |


