 Open Access Article
AC conductivity study of mechanochemically synthesized solid electrolytes of Li6−aMa/nnPS5Cl (M = Ca, Mg, Ba, Zn, Al, Y)†
Tran Viet Toanab,
Luu Tuan Anhab,
Nguyen Thi Minh Nguyetbc,
Tran Anh Tuabd and
Nguyen Huu Huy Phuc *abd
*abd
aFaculty of Materials Technology, Ho Chi Minh City University of Technology (HCMUT), 268 Ly Thuong Kiet Str., Dist. 10, Ho Chi Minh City, Vietnam. E-mail: nhhphuc@hcmut.edu.vn
bVietnam National University Ho Chi Minh City, Linh Trung Ward, Thu Duc Dist., Ho Chi Minh City, Vietnam
cVNU-HCM Key Laboratory for Material Technologies, Ho Chi Minh City University of Technology (HCMUT), 268 Ly Thuong Kiet Str., Dist. 10, Ho Chi Minh City, Vietnam
dNational Key Laboratory of Polymer and Composite Materials – Ho Chi Minh City, 268 Ly Thuong Kiet, District 10, Ho Chi Minh City, Vietnam
First published on 21st May 2024
Abstract
Argyrodite-type solid electrolytes of Li6PS5Cl doped with multivalent cations (Mg2+, Ba2+, Zn2+, Al3+, Y3+) were prepared via a mechanochemical synthesis method. The lattice constant (a0), interplanar spacing (d220, d311, d222), and micro-strain (ε) showed that the doping elements were incorporated into the crystal structure of Li6PS5Cl. The lattice constant and interplanar spacing of the doped samples were smaller than those of Li6PS5Cl. The prepared samples exhibited a positive lattice strain, and the substituted samples exhibited higher strains than Li6PS5Cl. The doped samples exhibited higher ionic conductivity than Li6PS5Cl at 25 °C. Li5.94Al0.02PS5Cl exhibited the highest σDC of approximately 2.36 × 10⁻³ S cm−1 at 25 °C. The charge carrier movement at the grain boundary changing from long-range diffusion in Li6PS5Cl to short-range diffusion in Li5.94Al0.02PS5Cl enhanced the conductivity.
1. Introduction
All-solid-state Li ion batteries using sulfide-based solid electrolytes (SEs) are candidates for technological applications because of their high energy density, thermal stability, and ease of cell design.1 SEs with high ionic conductivity at 25 °C are important components of all-solid-state Li ion batteries. Li7P3S11, Li10GeP2S12, Li10P3S12I, and argyrodite-type Li6PS5Cl SEs have attracted considerable attention from researchers because of their tunable composition and attractive ionic conductivity at 25 °C.2–5 Argyrodite-type SEs have been intensively studied because they have a wide electrochemical window and exhibit high ionic conductivity.6The ionic conductivity of Li6PS5X (X = Cl, Br, and I) at room temperature ranges from 10−6 to approximately 1–2 × 10⁻³ S cm−1 and could be improved by the aliovalent substitution of S2−, P5+, and Li+. Li5.5PS4.5Cl1.5 exhibited a high conductivity of 9.4 × 10⁻³ S cm−1 at 25 °C,7 whereas Li5.3PS4.3Cl1.0Br0.7 exhibited an ionic conductivity of 16.6 × 10⁻³ S cm−1 at 30 °C.8 High-entropy multicationic substituted Li6.5[P0.25Si0.25Ge0.25Sb0.25]S5I exhibited a high ionic conductivity of approximately 13 × 10−3 S cm−1 at room temperature,9 and Li6.2Si0.2P0.8S5Cl0.5Br0.5 exhibited a high ionic conductivity of 5.12 × 10⁻³ S cm−1 at room temperature.10 The aliovalent substitution of Li+ by a multivalent cation improved the ionic conductivity of Li6PS5Cl. The ionic conductivity of Li5.7Ca0.15PS5Cl at 25 °C was approximately 5.2 × 10⁻³ S cm−1, which exceeded that of Li6PS5Cl (3.1 × 10⁻³ S cm−1).11 Li5.4Al0.2PS5Br exhibited a room temperature ionic conductivity of 2.4 × 10⁻³ S cm−1, which exceeded that of Li6PS5Br (1.0 × 10⁻³ S cm−1).12 These SEs were prepared through solid-state reactions at a high temperature. Therefore, maintaining low oxygen and humidity concentrations will be a barrier to the mass production of these substances because sulfide-based SEs react with oxygen in a dry atmosphere at approximately 270 °C.13 Thus, mechanochemical synthesis, which occurs at room temperature, is a good option, in addition to solid-state reactions at high temperatures. The ionic conductivity of mechanochemically synthesized Li6PS5Cl at room temperature was slightly enhanced because of a multivalent cation at the grain boundary.14
This study enhanced the ionic conductivity of mechanochemically synthesized Li6PS5Cl by the aliovalent substitution of Li+ with multivalent cations (Mg2+, Ba2+, Zn2+, Al3+, Y3+). Data obtained from alternating current (AC) impedance spectroscopy was analyzed using conductivity isotherms and the dielectric constant and dielectric loss. The ionic conductivity of Li5.94Al0.02PS5Cl was approximately 2.36 × 10⁻³ S cm−1 at 25 °C, which was approximately twice that of Li6PS5Cl. Furthermore, this value exceeded the reported ionic conductivity of argyrodite SEs prepared without heat treatment. The activation energy of direct current and Li ion migration suggested that ion movement at the grain boundary was a critical process in the prepared samples.
2. Experimental process
The samples were prepared via a mechanical milling synthesis method. Li2S, P2S5, LiCl, CaCl2, BaCl2, MgCl2, YCl3, AlCl3, and ZnCl2 were obtained from Macklin at 99.9% purity and used without further purification. A typical batch (2.000 g) was prepared by mixing an appropriate amount of each starting material using agar and a mortar for approximately 15 min. The mixture was transferred into a zirconia pot (45 mL) with zirconia balls (approximately 30 g; diameter = 5 mm). The ball-to-powder ratio was approximately 15. The pot was rotated at 550 rpm for 20 h using a Pulverisette 7 (Fritsch Co., Ltd). The samples were recovered and characterized without further heat treatment. All the synthesis experiments were performed in a dry Ar atmosphere.The structure of the samples was characterized by X-ray diffraction (XRD; X8, Bruker), SEM (S4800, Hitachi) and EDS (ULTIM MAX, Oxford Instrument). The samples were prepared in an Ar-filled glove box and loaded into an air-tight sample holder for characterization.
The samples for resistivity measurements were prepared by uniaxially cold pressing the powder under a pressure of 330 MPa to form a pellet (thickness = 1.2–1.4 mm; diameter = 10 mm), as reported.15 AC impedance spectroscopy was conducted using a potentiostat (PGSTAT302N, Autolab, Herisau, Switzerland) from 9 MHz to 10 Hz. The samples for the impedance measurements were prepared by uniaxially pressing the sample (approximately 160 mg) into pellets (approximately 10.0 mm in diameter) under a pressure of 330 MPa at room temperature. The pellet was placed in a holder made of polycarbonate with two stainless steel rods as blocking electrodes. Thereafter, the cell was placed in an N2 flow in a glass tube for temperature dependence measurements. The temperature was gradually increased from room temperature to 110 °C and held at each temperature for 1 h prior to the impedance measurements. The AC applied voltage was 100 mV.
3. Results and discussion
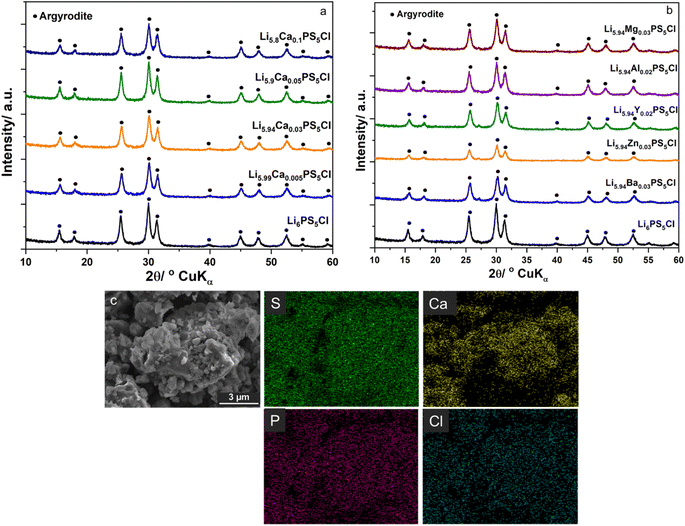
Fig. 1a and b show the XRD patterns of the SEs of Li6−2xCaxPS5Cl and Li5.94M0.06/nnPS5Cl (Mn = Mg2+, Ba2+, Zn2+, Al3+, Y3+), respectively. No impurity was detected, and all the peaks were assignable to the argyrodite phase (JCPDS 34-0688). The lattice constant, interplanar spacing, and micro-strain were calculated using the XRD data to investigate the effect of the multivalent cation substitution on the crystal structure of Li6PS5Cl. The crystal structure of the samples was indexed to cubic Li7PS6 in the F![[4 with combining macron]](https://www.rsc.org/images/entities/char_0034_0304.gif) 3m space group (JCPDS 34-0688). The peaks were assigned to the [111], [200], [220], [311], [222], [420], [422], [511], [440], [600], and [620] planes. The lattice parameters were obtained at each diffraction angle (θ) using the Bragg equation.
3m space group (JCPDS 34-0688). The peaks were assigned to the [111], [200], [220], [311], [222], [420], [422], [511], [440], [600], and [620] planes. The lattice parameters were obtained at each diffraction angle (θ) using the Bragg equation.
nλ = 2d![[thin space (1/6-em)]](https://www.rsc.org/images/entities/char_2009.gif) sin sin![[thin space (1/6-em)]](https://www.rsc.org/images/entities/char_2009.gif) θ. θ.
| (1) |
 | (2) |
The Nelson–Riley equation was employed to determine the lattice constant (a0).
 | (3) |
The a0 was determined from the linear fit equation, which was derived from a plot with a as the y-axis and  as the x-axis.
The Williamson–Hall (WH) analysis is a simple method for estimating the lattice strain (ε) by analyzing the X-ray data and considering the peak width as a function of 2θ.
 | (4) |
![[thin space (1/6-em)]](https://www.rsc.org/images/entities/char_2009.gif) cos
cos![[thin space (1/6-em)]](https://www.rsc.org/images/entities/char_2009.gif) θ against sin
θ against sin![[thin space (1/6-em)]](https://www.rsc.org/images/entities/char_2009.gif) θ.
θ.
Table 1 lists the values of the lattice constant (a0), interplanar spacing (d220, d311, d222), and micro-strain (ε). The a0 of Li6PS5Cl was 9.8401 Å and was consistent with the reported 9.8397(4) Å of Li6PS5Cl prepared via the mechanochemical method.16 The a0 of Li5.99Ca0.005PS5Cl was practically similar to that of Li6PS5Cl, indicating that the doping amount was too small to influence the measurement result. The a0 of Li5.94Ca0.03PS5Cl was 9.8346 Å, which was smaller than that of Li6PS5Cl. The a0 values of Li5.94M0.06/nnPS5Cl (Mn = Mg2+, Ca2+, Ba2+, Zn2+, Al3+, Y3+) were close to each other. Thus, the multivalent cation doping reduced the a0 of Li6PS5Cl; this observation was consistent with reported results.11,12 The values of the interplanar spacing (d220, d311, d222) of the substituted samples were smaller than those of Li6PS5Cl. In crystals, cations are surrounded by anions and vice versa such that the electrostatic interaction among oppositely charged ions strengthens the crystal structure. The substitution of Li ions with multivalent cations resulted in the formation of vacancies. A multivalent cation has a higher positive charge density than a Li ion; therefore, the electrostatic attraction with negative ions will be stronger. Thus, the lattice constant and interplanar spacing will be reduced. The lattice strain (ε) represents the displacement of unit cells about their normal positions. All the prepared samples exhibited a positive lattice strain, and the substituted samples exhibited higher strains than Li6PS5Cl. SEM-EDS results of Li5.8Ca0.1PS5Cl is shown in Fig. 1c. The SEs are in the form of particles with a size of several hundred nanometer. EDS results indicated that Ca was well dispersed in the prepared powder sample. The results suggest that the multivalent cations were successfully incorporated into the crystal structure of Li6PS5Cl.
| Lattice constant a0 (Å) | d220 (Å) | d311 (Å) | d222 (Å) | Microstrain ε | |
|---|---|---|---|---|---|
| Li6PS5Cl | 9.8401 | 3.4790 | 2.9669 | 2.8406 | 0.00330 |
| Li5.99Ca0.005PS5Cl | 9.8400 | 3.4790 | 2.9669 | 2.8406 | 0.00418 |
| Li5.94Ca0.03PS5Cl | 9.8346 | 3.4781 | 2.9661 | 2.8399 | 0.00433 |
| Li5.8Ca0.1PS5Cl | 9.8341 | 3.4779 | 2.9660 | 2.8397 | 0.00390 |
| Li5.94Ba0.03PS5Cl | 9.8347 | 3.4771 | 2.9653 | 2.8390 | 0.00460 |
| Li5.94Zn0.03PS5Cl | 9.8348 | 3.4771 | 2.9653 | 2.8391 | 0.00458 |
| Li5.94Mg0.03PS5Cl | 9.8356 | 3.4774 | 2.9655 | 2.8393 | 0.00488 |
| Li5.94Al0.02PS5Cl | 9.8354 | 3.4778 | 2.9667 | 2.8404 | 0.00418 |
| Li5.94Y0.02PS5Cl | 9.8349 | 3.4772 | 2.9653 | 2.8391 | 0.00445 |
Fig. 2a–d show the frequency dependence of the real part of conductivity, σ′, of Li6PS5Cl, Li5.94Ca0.03PS5Cl, Li5.94Mg0.03PS5Cl, and Li5.94Al0.02PS5Cl obtained from 10 Hz to 9 MHz at different temperatures, respectively, using conductivity isotherms. Fig. S1a–c† show the conductivity isotherms of Li5.96Ca0.002PS5Cl, Li5.9Ca0.05PS5Cl, and Li5.8Ca0.1PS5Cl, respectively. Furthermore, Fig. S2a–c† show the conductivity isotherms of Li5.94Ba0.03PS5Cl, Li5.94Zn0.03PS5Cl, and Li5.94Y0.02PS5Cl, respectively. The isotherms of all the samples comprised three regions: electrode polarization, a plateau-like region, and polarization conductivity at low, intermediate, and high frequencies, respectively. The high-frequency polarization conductivity could be explained by the power law behavior, σω ∝ ωn, where n is a fractional exponent (0 ≤ n ≤ 1) and is associated with the interaction between the ions and environment.17 The accumulation of ions at blocking electrodes caused electrode polarization.18 The isotherms were analyzed using the Jonscher power law to understand the ion dynamics of the prepared electrolytes. The conductivity in the intermediate- and high-frequency regions followed the Jonscher power law equation.
| σ = σDC + Aωn, | (5) |
→ σ − σDC = Aωn → log10(σ − σDC) = n![[thin space (1/6-em)]](https://www.rsc.org/images/entities/char_2009.gif) log10 log10![[thin space (1/6-em)]](https://www.rsc.org/images/entities/char_2009.gif) ω + log10 ω + log10![[thin space (1/6-em)]](https://www.rsc.org/images/entities/char_2009.gif) A, A,
| (6) |
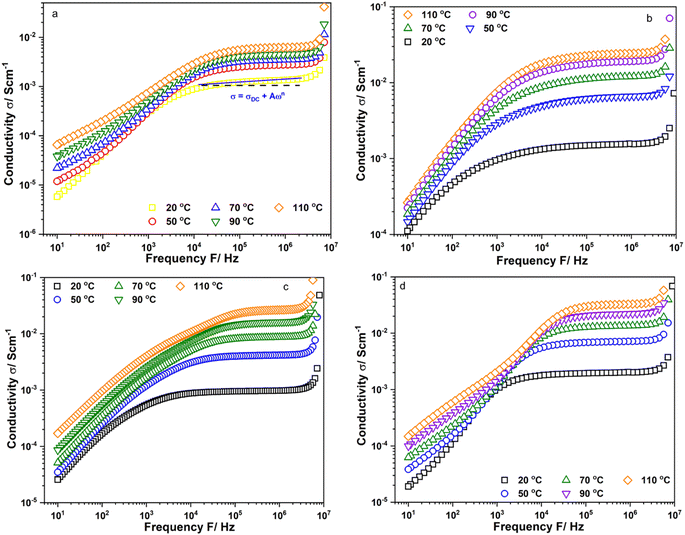 | ||
| Fig. 2 Conductivity isotherms of (a) Li6PS5Cl; (b) Li5.94Ca0.03PS5Cl; (c) Li5.94Mg0.03PS5Cl and (d) Li5.94Al0.02PS5Cl measured from 10 Hz to 9 MHz. | ||
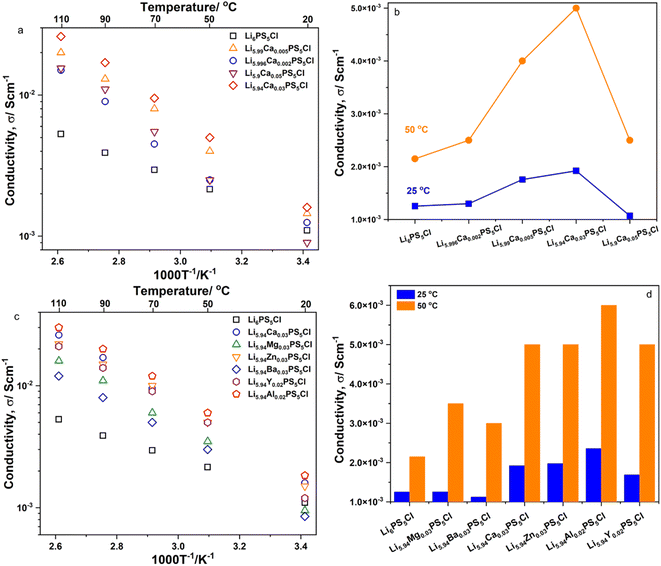
Fig. 3a and c show the temperature dependence of the ionic conductivity, σDC, of the SEs of Li6−2xCaxPS5Cl and Li5.94M0.06/nnPS5Cl (Mn = Mg2+, Ba2+, Zn2+, Al3+, Y3+), respectively. The log10(σDC) satisfied a practically linear dependence on an inverse temperature; therefore, it followed the Arrhenius equation, σ = σ0![[thin space (1/6-em)]](https://www.rsc.org/images/entities/char_2009.gif) exp(−Ea,DC/(kBT)). The DC activation energy, Ea,DC, was calculated and is shown in Table 2. The Ea,DC of Li6PS5Cl was approximately 16 kJ mol−1. The Ea,DC of the doped samples exceeded that of Li6PS5Cl in the range of 28–31 kJ mol−1. Furthermore, the Ea,DC of Li6−3xAlxPS5Br (x = 0.1, 0.15, 0.2, 0.25, 0.3) has been reported to exceed that of Li6PS5Br.12 Thus, the aliovalent substitution of Li ions in argyrodite-type SEs led to an increase in Ea,DC. The ionic conductivity of Li6PS5Cl at 25 °C was approximately 1.25 × 10⁻³ S cm−1. Fig. 3b and d show the ionic conductivity (σDC) of the SEs of Li6−2xCaxPS5Cl and Li5.94M0.06/nnPS5Cl (Mn = Mg2+, Ba2+, Zn2+, Al3+, Y3+) at 25 °C and 50 °C, respectively. At 25 °C, all the doped samples exhibited ionic conductivities higher than that of Li6PS5Cl. Li5.94Al0.02PS5Cl exhibited the highest σDC (approximately 2.36 × 10⁻³ S cm−1) at 25 °C. The σDC of Li6PS5Cl and Li5.94Al0.02PS5Cl were 2.15 × 10⁻³ and 6.00 × 10⁻³ S cm−1 at 50 °C, respectively. The σDC and Ea,DC results confirmed that the multivalent cation was successfully incorporated into the crystal structure of Li6PS5Cl.
exp(−Ea,DC/(kBT)). The DC activation energy, Ea,DC, was calculated and is shown in Table 2. The Ea,DC of Li6PS5Cl was approximately 16 kJ mol−1. The Ea,DC of the doped samples exceeded that of Li6PS5Cl in the range of 28–31 kJ mol−1. Furthermore, the Ea,DC of Li6−3xAlxPS5Br (x = 0.1, 0.15, 0.2, 0.25, 0.3) has been reported to exceed that of Li6PS5Br.12 Thus, the aliovalent substitution of Li ions in argyrodite-type SEs led to an increase in Ea,DC. The ionic conductivity of Li6PS5Cl at 25 °C was approximately 1.25 × 10⁻³ S cm−1. Fig. 3b and d show the ionic conductivity (σDC) of the SEs of Li6−2xCaxPS5Cl and Li5.94M0.06/nnPS5Cl (Mn = Mg2+, Ba2+, Zn2+, Al3+, Y3+) at 25 °C and 50 °C, respectively. At 25 °C, all the doped samples exhibited ionic conductivities higher than that of Li6PS5Cl. Li5.94Al0.02PS5Cl exhibited the highest σDC (approximately 2.36 × 10⁻³ S cm−1) at 25 °C. The σDC of Li6PS5Cl and Li5.94Al0.02PS5Cl were 2.15 × 10⁻³ and 6.00 × 10⁻³ S cm−1 at 50 °C, respectively. The σDC and Ea,DC results confirmed that the multivalent cation was successfully incorporated into the crystal structure of Li6PS5Cl.
| Li6PS5Cl | Li5.96Ca0.002PS5Cl | Li5.94Ca0.03PS5Cl | Li5.9Ca0.05PS5Cl | Li5.8Ca0.1PS5Cl | |
|---|---|---|---|---|---|
| Ea,DC/kJ mol−1 | 16 | 26 | 29 | 28 | 31 |
| Ea,DC/eV | 0.16 | 0.26 | 0.29 | 0.28 | 0.31 |
| Ea,m/kJ mol−1 | 19 | 24 | 28 | 31 | 34 |
| Ea,m/eV | 0.19 | 0.24 | 0.28 | 0.31 | 0.34 |
| τ0,m/s | 5.47 × 10⁻⁷ | 2.56 × 10⁻⁹ | 6.31 × 10⁻⁹ | 1.57 × 10⁻⁹ | 6.79 × 10⁻⁹ |
| Li5.94Ba0.03PS5Cl | Li5.94Zn0.03PS5Cl | Li5.94Mg0.03PS5Cl | Li5.94Al0.02PS5Cl | Li5.94Y0.02PS5Cl | |
|---|---|---|---|---|---|
| Ea,DC/kJ mol−1 | 27 | 28 | 29 | 29 | 29 |
| Ea,DC/eV | 0.27 | 0.28 | 0.29 | 0.29 | 0.29 |
| Ea,m/kJ mol−1 | 31 | 31 | 31 | 33 | 30 |
| Ea,m/eV | 0.31 | 0.31 | 0.31 | 0.33 | 0.30 |
| τ0,m/s | 8.66 × 10⁻⁹ | 1.39 × 10⁻⁹ | 4.42 × 10⁻⁹ | 2.26 × 10⁻⁹ | 1.64 × 10⁻⁹ |
Fig. 4a–d show the frequency dependence of the real part of permittivity, ε′, of Li6PS5Cl, Li5.94Ca0.03PS5Cl, Li5.94Mg0.03PS5Cl, and Li5.94Al0.02PS5Cl obtained from 10 Hz to 9 MHz at different temperatures, respectively. Fig. S3a–c† show the frequency dependence of the ε′ of Li5.96Ca0.002PS5Cl, Li5.9Ca0.05PS5Cl, and Li5.8Ca0.1PS5Cl, respectively. Furthermore, Fig. S4a–c† show the frequency dependence of the ε′ of Li5.94Ba0.03PS5Cl, Li5.94Zn0.03PS5Cl, and Li5.94Y0.02PS5Cl, respectively. The increase in the plots in the low-frequency region was attributable to the electrode–electrolyte interface polarization due to the accumulation of ions near the electrode. This led to the formation of a space-charged layer that blocked the electric field and enhanced the electrical polarization. The ε′ of all the samples increased with an increase in temperature, indicating that charge carrier movement was thermally activated. The ε′ reflects the amount of energy stored in the form of polarization when an electric field is applied.20 In most ion-conducting materials, ε′ decreases with an increase in frequency.21 The plot of Li5.94Mg0.03PS5Cl at room temperature continuously decreased in the intermediate- and high-frequency regions; however, the plots of the other samples obtained at room temperature exhibited maxima at 105–106 Hz. Maxima were observed in all the plots at 50 °C or above. The change in the shape of the plots of Li5.94Mg0.03PS5Cl suggests that a change occurred in the microstructure, and this process was temperature-dependent.
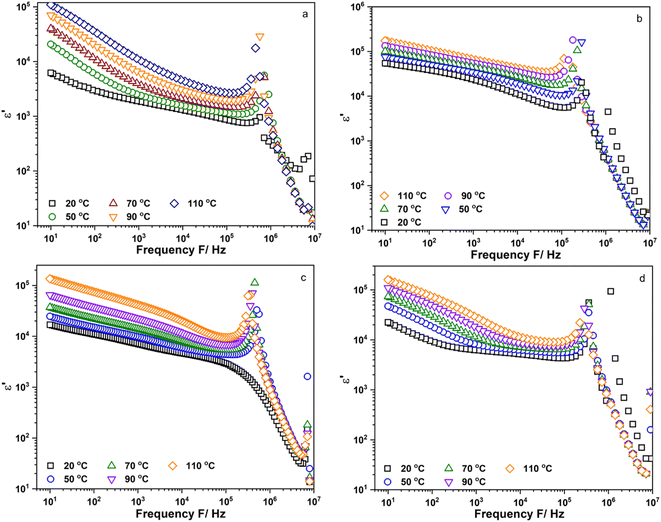 | ||
| Fig. 4 Frequency dependent of the real part of permittivity, ε′, of (a) Li6PS5Cl; (b) Li5.94Ca0.03PS5Cl; (c) Li5.94Mg0.03PS5Cl and (d) Li5.94Al0.02PS5Cl measured from 10 Hz to 9 MHz. | ||
Fig. 5a–d show the frequency dependence of the loss factor, tan![[thin space (1/6-em)]](https://www.rsc.org/images/entities/char_2009.gif) δ, of Li6PS5Cl, Li5.94Ca0.03PS5Cl, Li5.94Mg0.03PS5Cl, and Li5.94Al0.02PS5Cl obtained from 10 Hz to 9 MHz at different temperatures, respectively. Fig. S5a–c† show the frequency dependence of the tan
δ, of Li6PS5Cl, Li5.94Ca0.03PS5Cl, Li5.94Mg0.03PS5Cl, and Li5.94Al0.02PS5Cl obtained from 10 Hz to 9 MHz at different temperatures, respectively. Fig. S5a–c† show the frequency dependence of the tan![[thin space (1/6-em)]](https://www.rsc.org/images/entities/char_2009.gif) δ of Li5.96Ca0.002PS5Cl, Li5.9Ca0.05PS5Cl, and Li5.8Ca0.1PS5Cl, respectively. Fig. S6a–c† show the frequency dependence of the tan
δ of Li5.96Ca0.002PS5Cl, Li5.9Ca0.05PS5Cl, and Li5.8Ca0.1PS5Cl, respectively. Fig. S6a–c† show the frequency dependence of the tan![[thin space (1/6-em)]](https://www.rsc.org/images/entities/char_2009.gif) δ of Li5.94Ba0.03PS5Cl, Li5.94Zn0.03PS5Cl, and Li5.94Y0.02PS5Cl, respectively. Two peaks assignable to ion migration at the grain boundary and bulk were observed in all the plots in the low- and high-frequency regions. The peak in the low-frequency region shifted toward high-frequency with an increase in temperature. Generally, the grain boundary migration resistivity was expected to decrease with an increase in temperature because Li+ diffused from the bulk to the grain boundary. Thus, the intensity of the peak corresponding to the grain boundary resistivity in the loss factor decreased with an increase in temperature. The peak in the high-frequency region was not fully observed at 50 °C or above. The maximum value of the peak in the high-frequency region increased with an increase in the temperature, indicating that the number of charge carriers increased because of thermal activation. The migration energy (Ea,m) and migration characteristic time (τ0,m) of the Li+ moving at the grain boundary could be derived from the temperature dependence of the peak position at low-frequency in the tan
δ of Li5.94Ba0.03PS5Cl, Li5.94Zn0.03PS5Cl, and Li5.94Y0.02PS5Cl, respectively. Two peaks assignable to ion migration at the grain boundary and bulk were observed in all the plots in the low- and high-frequency regions. The peak in the low-frequency region shifted toward high-frequency with an increase in temperature. Generally, the grain boundary migration resistivity was expected to decrease with an increase in temperature because Li+ diffused from the bulk to the grain boundary. Thus, the intensity of the peak corresponding to the grain boundary resistivity in the loss factor decreased with an increase in temperature. The peak in the high-frequency region was not fully observed at 50 °C or above. The maximum value of the peak in the high-frequency region increased with an increase in the temperature, indicating that the number of charge carriers increased because of thermal activation. The migration energy (Ea,m) and migration characteristic time (τ0,m) of the Li+ moving at the grain boundary could be derived from the temperature dependence of the peak position at low-frequency in the tan![[thin space (1/6-em)]](https://www.rsc.org/images/entities/char_2009.gif) δ using the Arrhenius equation, τm = τ0,m
δ using the Arrhenius equation, τm = τ0,m![[thin space (1/6-em)]](https://www.rsc.org/images/entities/char_2009.gif) exp(−Ea,m/(kBT)). Table 2 lists the obtained Ea,m and τ0,m values. The Ea,m of the samples was similar to the Ea,DC, implying that the ion migration at the grain boundary was a critical process. The τ0,m of Li6PS5Cl was approximately 5.47 × 10⁻⁷ s. The τ0,m of the doped samples was approximately 10−9 s, which was almost 102 times faster than that of Li6PS5Cl. Thus, the Li ion moving at the grain boundary changed from long-range diffusion in Li6PS5Cl to short-range diffusion in the doped samples. The results suggested that the substitution of the Li ion with multivalent cations resulted in vacancy formation, which was the new hopping position for the Li ion. The addition of multivalent ions to Li6PS5Cl enhanced the Li ion mobility with a gradual decrease in the migration time; however, the migration energy increased as reflected in the Ea,m. Multivalent cations have a higher positive charge than Li+; thus, Li ions are repelled from their vicinity. From there, an Li ion can be trapped near the multivalent ion site, leading to a high migration barrier. It has been reported that the short inter-cage jump is a critical process in Li5.4Al0.2PS5Br, and this process was associated with an increase in activation energy.12 In addition, the change from short- to long-range diffusion was associated with a decrease and increase in activation energy and migration time, respectively.22 Thus, the results in this section were consistent with the reported results and ionic conductivity of the samples.
exp(−Ea,m/(kBT)). Table 2 lists the obtained Ea,m and τ0,m values. The Ea,m of the samples was similar to the Ea,DC, implying that the ion migration at the grain boundary was a critical process. The τ0,m of Li6PS5Cl was approximately 5.47 × 10⁻⁷ s. The τ0,m of the doped samples was approximately 10−9 s, which was almost 102 times faster than that of Li6PS5Cl. Thus, the Li ion moving at the grain boundary changed from long-range diffusion in Li6PS5Cl to short-range diffusion in the doped samples. The results suggested that the substitution of the Li ion with multivalent cations resulted in vacancy formation, which was the new hopping position for the Li ion. The addition of multivalent ions to Li6PS5Cl enhanced the Li ion mobility with a gradual decrease in the migration time; however, the migration energy increased as reflected in the Ea,m. Multivalent cations have a higher positive charge than Li+; thus, Li ions are repelled from their vicinity. From there, an Li ion can be trapped near the multivalent ion site, leading to a high migration barrier. It has been reported that the short inter-cage jump is a critical process in Li5.4Al0.2PS5Br, and this process was associated with an increase in activation energy.12 In addition, the change from short- to long-range diffusion was associated with a decrease and increase in activation energy and migration time, respectively.22 Thus, the results in this section were consistent with the reported results and ionic conductivity of the samples.
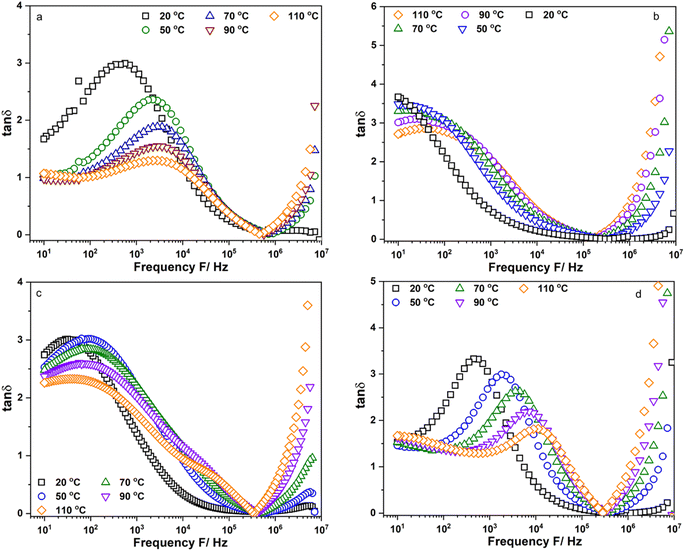 | ||
Fig. 5 Frequency dependent of the loss factor, tan![[thin space (1/6-em)]](https://www.rsc.org/images/entities/char_2009.gif) δ, of (a) Li6PS5Cl; (b) Li5.94Ca0.03PS5Cl; (c) Li5.94Mg0.03PS5Cl and (d) Li5.94Al0.02PS5Cl measured from 10 Hz to 9 MHz. δ, of (a) Li6PS5Cl; (b) Li5.94Ca0.03PS5Cl; (c) Li5.94Mg0.03PS5Cl and (d) Li5.94Al0.02PS5Cl measured from 10 Hz to 9 MHz. | ||
4. Conclusion
Here, the Li ion in the SE of Li6PS5Cl was partially substituted with various multivalent cations (Mg2+, Ba2+, Zn2+, Al3+, Y3+). The a0; d220, d311, d222; ε; and σDC values confirmed that the multivalent cations were successfully incorporated into the crystal structure of Li6PS5Cl. In addition, the charge carrier movement at the grain boundary changed from long-range diffusion in Li6PS5Cl to short-range diffusion in the doped samples.Conflicts of interest
The authors declare that they have no known competing financial interests or personal relationships that could have appeared to influence the work reported in this paper.Acknowledgements
We acknowledge Ho Chi Minh City University of Technology (HCMUT), VNU-HCM for supporting this study. The authors thank Philip K. (Enago; https://www.enago.com/vnuhcm/) for the English language review.References
- Y. Kato, S. Hori, T. Saito, K. Suzuki, M. Hirayama, A. Mitsui, M. Yonemura, H. Iba and R. Kanno, High-power all-solid-state batteries using sulfide superionic conductors, Nat. Energy, 2016, 1, 16030 CrossRef CAS.
- F. Mizuno, A. Hayashi, K. Tadanaga and M. Tatsumisago, New, Highly Ion-Conductive Crystals Precipitated from Li2S–P2S5 Glasses, Adv. Mater., 2005, 17, 918–921 CrossRef CAS.
- N. Kamaya, K. Homma, Y. Yamakawa, M. Hirayama, R. Kanno, M. Yonemura, T. Kamiyama, Y. Kato, S. Hama, K. Kawamoto and A. Mitsui, A lithium superionic conductor, Nat. Mater., 2011, 10, 682–686 CrossRef CAS PubMed.
- Y. Subramanian, R. Rajagopal and K.-S. Ryu, Synthesis of Sb-doped Li10P3S12I solid electrolyte and their electrochemical performance in solid-state batteries, J. Energy Storage, 2024, 78, 2717–2728 Search PubMed.
- L. Zhou, N. Minafra, W. G. Zeier and L. F. Nazar, Innovative Approaches to Li-Argyrodite Solid Electrolytes for All-Solid-State Lithium Batteries, Acc. Chem. Res., 2021, 54, 2717–2728 CrossRef CAS PubMed.
- T. T. Zuo, F. Walther, J. H. Teo, R. Ruess, Y. Wang, M. Rohnke, D. Schroder, L. F. Nazar and J. Janek, Impact of the Chlorination of Lithium Argyrodites on the Electrolyte/Cathode Interface in Solid-State Batteries, Angew Chem. Int. Ed. Engl., 2023, 62, e202213228 CrossRef CAS PubMed.
- P. Adeli, J. D. Bazak, K. H. Park, I. Kochetkov, A. Huq, G. R. Goward and L. F. Nazar, Boosting Solid-State Diffusivity and Conductivity in Lithium Superionic Argyrodites by Halide Substitution, Angew Chem. Int. Ed. Engl., 2019, 58, 8681–8686 CrossRef CAS PubMed.
- Y. Subramanian, R. Rajagopal, S. Kang and K.-S. Ryu, Optimization of high ionic conducting Br-rich and metal (Sb and Zr) substituted Li-argyrodite and their enhanced air stability and compatibility in lithium batteries, Scr. Mater., 2023, 235, 115592 CrossRef CAS.
- J. Lin, G. Cherkashinin, M. Schäfer, G. Melinte, S. Indris, A. Kondrakov, J. Janek, T. Brezesinski and F. Strauss, A High-Entropy Multicationic Substituted Lithium Argyrodite Superionic Solid Electrolyte, ACS Mater. Lett., 2022, 4, 2187–2194 CrossRef CAS.
- Y. Subramanian, R. Rajagopal, B. Senthilkumar, Y. J. Park, S. Kang, Y. J. Jung and K.-S. Ryu, Tuning of Li-argyrodites ionic conductivity through silicon substitution (Li6+xP1-xSixS5Cl0.5Br0.5) and their electrochemical performance in lithium solid state batteries, Electrochim. Acta, 2021, 400, 139431 CrossRef CAS.
- P. Adeli, J. D. Bazak, A. Huq, G. R. Goward and L. F. Nazar, Influence of Aliovalent Cation Substitution and Mechanical Compression on Li-Ion Conductivity and Diffusivity in Argyrodite Solid Electrolytes, Chem. Mater., 2020, 33, 146–157 CrossRef.
- Z. Zhang, J. Zhang, H. Jia, L. Peng, T. An and J. Xie, Enhancing ionic conductivity of solid electrolyte by lithium substitution in halogenated Li-argyrodite, J. Power Sources, 2020, 450, 227601 CrossRef CAS.
- T. Asano, A. Sakai, S. Ouchi, M. Sakaida, A. Miyazaki and S. Hasegawa, Solid Halide Electrolytes with High Lithium-Ion Conductivity for Application in 4 V Class Bulk-Type All-Solid-State Batteries, Adv. Mater., 2018, 30, e1803075 CrossRef PubMed.
- K. Hikima, N. H. Huy Phuc, H. Tsukasaki, S. Mori, H. Muto and A. Matsuda, High ionic conductivity of multivalent cation doped Li6PS5Cl solid electrolytes synthesized by mechanical milling, RSC Adv., 2020, 10, 22304–22310 RSC.
- N. H. H. Phuc, M. Totani, K. Morikawa, H. Muto and A. Matsuda, Preparation of Li3PS4 solid electrolyte using ethyl acetate as synthetic medium, Solid State Ionics, 2016, 288, 240–243 CrossRef CAS.
- S. Boulineau, M. Courty, J.-M. Tarascon and V. Viallet, Mechanochemical synthesis of Li-argyrodite Li6PS5X (X=Cl, Br, I) as sulfur-based solid electrolytes for all solid state batteries application, Solid State Ionics, 2012, 221, 1–5 CrossRef CAS.
- K. P. Padmasree and A. F. Fuentes, Dielectric relaxation studies of Ce0.9-xYxCa0.1O2-δ solid electrolytes, Mater. Chem. Phys., 2019, 223, 466–472 CrossRef CAS.
- F. Preishuber-Pflugl and M. Wilkening, Mechanochemically synthesized fluorides: local structures and ion transport, Dalton Trans., 2016, 45, 8675–8687 RSC.
- A. K. Jonscher, The ‘Universal’ dielectric response, Nature, 1977, 267, 673–679 CrossRef CAS.
- D. M. Abdel Basset, S. Mulmi, M. S. El-Bana, S. S. Fouad and V. Thangadurai, Synthesis and characterization of novel Li-stuffed garnet-like Li5+2xLa3Ta2-xGdxO12 (0 ≤ x ≤ 0.55): structure-property relationships, Dalton Trans., 2017, 46, 933–946 RSC.
- A. A. Ibrahim, D. A. Kospa, O. R. Hayes, A. S. Khder, S. A. El-Hakam and A. I. Ahmed, Cesium salt of tungstophosphoric acid/mesoporous (zirconia-silica) composite for highly efficient synthesis of 7-hydroxy-4-methyl coumarin and removal of methylene blue, RSC Adv., 2023, 13, 15243–15260 RSC.
- T. A. Tu, T. V. Toan, L. T. Anh, L. V. Thang and N. H. H. Phuc, Synergic effect of CaI2 and LiI on ionic conductivity of solution-based synthesized Li7P3S11 solid electrolyte, RSC Adv., 2024, 14, 5764–5770 RSC.
Footnote |
| † Electronic supplementary information (ESI) available. See DOI: https://doi.org/10.1039/d4ra02621g |
| This journal is © The Royal Society of Chemistry 2024 |

