 Open Access Article
Preparation and measurement of a sandwiched Sn atomic beam source for laser resonance ionization mass spectrometry†
Jiangfan Wang *,
Jinlong Fan,
Zhiming Li*,
Wenliang Wang,
Lei Feng,
Pengfei Zhang,
Guowei Chen,
Xiaowei Yi,
Xiangbo Zhang,
Xiaopan Shen and
Jiang Xu
Northwest Institute of Nuclear Technology, Xi'an, Shaanxi 710024, PR China. E-mail: wangjiangfan@163.com; lizhiming@nint.ac.cn
First published on 13th May 2024
Abstract
Isotope analysis of Sn plays a crucial role in geochemical studies and in monitoring nuclear contamination. Nevertheless, prevalent analytical techniques for examining Sn isotopes encounter the issue of isobaric interference, markedly impacting the accuracy of the test results. Laser resonance ionization mass spectrometry (LRIMS) can effectively overcome the difficulties associated with the isobaric interference inherent in commercial mass spectrometry. In this paper, different amounts of Sn were prepared on Re filaments by electrodeposition and tested via LRIMS. The results showed that the average detection efficiency of LRIMS decreased with increasing total Sn content from 1 μg to 4 μg, and the fluctuations in the test results among the samples increased significantly. Therefore, the electrodeposition process, as well as the composition and morphology of the deposits were characterized by SEM, EDS and XPS; results showed that the degradation of the samples with increasing Sn content was attributed to the complexity of the composition, micro-structure, valence of the deposits, and the interference of various elements. To cope with the anomalies encountered above, the deposits were heat-treated at 600 °C in a hydrogen atmosphere to eliminate detrimental impurities, like Cl, and Sn was effectively reduced to an almost singular atomic state. Furthermore, a titanium layer was covered on the surface of the heat-treated deposit by magnetron sputtering. Ultimately, a highly efficient and stable Sn atomic beam source with a sandwiched structure has been successfully developed and exhibits broad application prospect.
Introduction
The isotope analysis and measurement of Sn have important applications in multiple fields. For example, Sn is an important nuclear fission product that produces 23 radioisotopes during the fission process.1 The contents of 121mSn and 126Sn and their contributions to the long-term dose need to be taken into account in the reprocessing process of spent fuel.2 In addition, the difference in isotope ratios of Sn in different geological structures can be used as a fingerprint feature for research on geological genesis.3,4At present, inductively coupled plasma mass spectrometry (ICP-MS)3,5–10 and thermal ionization mass spectrometry (TIMS)11 are the main analytical methods for the isotope analysis of Sn. However, the above methods are susceptible to interference from isobaric and complex ions (such as 121Sb for 121mSn and 126Te for 126Sn), thus affecting the accurate analysis of Sn. Laser resonance ionization mass spectrometry (LRIMS) is an innovative analytical technique developed in recent decades, comprising a tunable laser, an atomic beam source, and a mass spectrometer system.12–14 The tunable laser produces a laser beam at a specific frequency, which crosses the collision with the atomic beam source and induces the atoms to undergo resonance excitation and photoionization. The ions produced are then deflected by the magnetic field and enter the detector, where they are sorted by mass to provide the desired sample information. Therefore, LRIMS integrates the strengths of laser spectroscopy and mass spectrometry, offering enhanced elemental selectivity and sensitivity. This technology effectively addresses the issue of isobaric interference, a significant challenge in traditional mass spectrometry.
The preparation of highly efficient and stable atomization sources is one of the key steps in the LRIMS analysis process. The quality of the atomization source plays a crucial role in the test results of the LRIMS system. Currently, the atomization source generally adopts an electrically heated filament structure, and a high-purity Re or Ta filament of 0.7 mm × 0.045 mm (width × thickness) is pressed and welded on the test bench. The sample to be analyzed was quantitatively transferred to an active area of 1–3 mm × 0.7 mm on the centre of the filament surface (the action area of the laser with an atomic beam). In view of the importance of atomization sources for LRIMS test results, researchers mainly from Mainz University in Germany, and the Paul Scherrer Institute in Switzerland, have carried out many theoretical studies and experimental work to improve the detection efficiency and stability of LRIMS in recent decades.15–19 Actinide radionuclides were usually prepared on the micro-regions of Re/Ta filament by electrodeposition and then covered with a reducing metal layer, thus a sandwich atomization source was obtained and applied to LRIMS measurements. To the best of the authors' knowledge, prior studies have predominantly focused on actinides and technetium,20 with limited exploration into the preparation and analysis of other elements. Currently, Sn sources are typically prepared by directly dropping a mixture of Sn sample solution and graphene oxide.2,21 In this approach, Sn is present in the form of complex ionic compounds, which is not ideal for creating an efficient atomic beam source. Alternatively, through electrodeposition, Sn can be deposited in atomic form on the surface of Re filaments, enhancing atomization efficiency and making it a superior method for preparing LRIMS test sources. In previous work,22 a 1 μg Sn atomic source was prepared on the surface of Re filaments via electrode position, and the optimum parameters were investigated to achieve a satisfactory yield. To be inspirited, the average detection efficiency of LRIMS using the as-deposited Sn samples was found to be about an order of magnitude higher than dropping Sn sample with graphene oxide solution.
Due to the low yield of the 121mSn and 126Sn fission products in the original spent fuel, and the introduction of 120Sn (abundance of 32.85%) background during the separation process, which would cause strong tailing interference to the measurement of 121mSn, the accuracy of the LRIMS measurement must be even higher for real samples. In order to reduce the uncertainty of the final measurement results, it is necessary to further increase the cumulative signal intensity of Sn by improving the detection efficiency or the Sn content. Therefore, in this paper, the preparation and testing of Sn sources with larger sample content were carried out, and methods to improve the detection efficiency and stability of LRIMS were further explored to meet the rigorous requirements of real samples.
Experimental
Electrodeposition of Sn on Re filaments
The apparatus for preparing the Sn sources in a 3 × 0.7 mm spot by electrodeposition have been reported in our previous work.22 Before using, Re filaments (45 μm thick, 0.7 mm wide) were treated with 6 M HCl at 100 °C for 10 min. Subsequently, they were ultrasonically cleaned with deionized water. Afterwards, the Re filaments were modified in a special etchant solution for 10 min and ultrasonically cleaned with deionized water before electrodeposition. The composition of the etchant solution was 10 g K3Fe(CN)6 + 10 g KOH + 100 mL distilled water. The as-treated Re filament was then assembled in the electrodeposition apparatus and the area to be plated was confined to a length of 3 mm. A platinum wire and Re filament served as the anode and cathode, respectively, which were connected to an external power supply that delivered a constant voltage. The electrolyte was composed of 1–4 μg Sn (SnCl2) and 1–10 μgPb (Pb(NO3)2) in 2 M HCl. The Pb was added to promote the electrodeposition of Sn. The apparatus was placed in a water bath to maintain a constant temperature. The primary electrodeposition parameters are listed in Table 1.| Voltage | Deposition time | Sn content | Pb content | Distance between electrodes | Bath temperature |
|---|---|---|---|---|---|
| 2.0 V | 0–4 h | 1–4 μg | 1–10 μg | 5 mm | 60 °C |
Electrodeposition of Sn on Re filaments
The surface morphology of the Sn samples was observed using a scanning electron microscope (SEM, TESCAN MIRA4 and Quanta FEG 250). The chemical composition was examined using energy-dispersive X-ray spectroscopy (EDS) attached to the SEM system. Chemical surface characterization was performed by X-ray photoelectron spectroscopy (XPS), and Al-Kα radiation was used. The X-ray source was operated at an anode voltage of 12 kV and a current of 6 mA. The experimental uncertainty of the binding energies was 0.1 eV, and the spectra were calibrated by a C1s peak at 284.8 eV. To determine the electrodeposition yields under different parameters, the electrolyte containing radioactive 113Sn (113Sn, t1/2 = 115.1 days, Eγ = 391.7 keV) tracer was measured before and after the electrodeposition process via γ-ray spectroscopy. To produce the 113Sn radioactive tracer, condensate 112Sn metallic powder was irradiated with thermal neutrons in the Xi'an Pulsed Reactor and subsequently dissolved in 2 M HCl. The as-electrodeposited samples were pressed, welded on the test bench and determined using the LRIMS device developed in our laboratory. The structure of the LRIMS device was shown in ref. 22 and an efficient three-color three-photo resonance ionization scheme of Sn was confirmed. The laser wavelengths of each excitation/ionization step were optimized as λ1 = 286.4 nm, λ2 = 811.6 nm, λ3 = 823.7 nm and other detailed test parameters were reported in 21. The LRIMS detection efficiency is defined as the ratio of the number of 120Sn ions counted by the detector to the number of atoms originally present on the filament.Results and discussion
Preparation and testing of sources with different contents of Sn
Owing to the low yield of Sn fission products, it is essential to increase the sample amount to enhance the method's reliability and accuracy of the method in order to meet the rigorous requirements in practical applications. This paper extended previous experimental work by preparing electrodeposition sources with varying Sn amounts, ranging from 1 to 4 μg, to augment the signal intensity of electrodeposited samples and diminish the uncertainty in test results. Fig. 1 presented the analysis of deposits with different Sn quantities. As depicted in Fig. 1, a slight increase in total deposit amount corresponded with added Sn, yet the microstructures remained similar, exhibiting small dendritic forms. EDS analysis of the electrodeposition source revealed a notable rise in the proportion of Sn as the added Sn amount increases (see Fig. s1 in ESI†). Electrodeposition experiments utilised various Sn solutions containing 113Sn as a marker, and the yields were also assessed. Fig. 2(a) illustrated that electrodeposition yields exceeded 90% when Sn ranged from 1 to 4 μg, indicating the suitability of the used electrodeposition device and parameters for different Sn quantities. The prepared samples were then compressed, welded onto the test bench, and subjected to LRIMS analysis. During the test, a current was applied to the filament and the photo-induced ion signal of 120Sn was monitored by the Faraday cup. The filament was heated to a temperature where a stable count rate was achieved. Whenever the count rate decreased, the current was increased further until the desired count rate was reached. This was repeated until the signal faded completely. The basic process in LRIMS test has been added in the paper. Uniform test conditions were applied to the electrodeposited Sn sources across the 1 to 4 μg range, and the resulting detection efficiencies are displayed in Fig. 2(b). Surprisingly, as the Sn content in the deposit increased, the detection efficiency of the corresponding samples decreased gradually, but the fluctuations in the test results between the samples increased significantly. The LRIMS detection efficiency includes any loss of Sn ions between the source and detector. With a well-tuned LRIMS setup, the apparative factors should be rather constant. Hence, fluctuations in the detection efficiency from sample to sample largely reflected the reproducibility of the atomic beam source.18 In some cases, the detection efficiency of the electrodeposition source with 4 μg of Sn was 5 times lower than that with 1 μg, i.e., the cumulative signal intensity for the electrodeposition source with 4 μg of Sn tested by LRIMS was even lower than that with 1 μg (as depicted in Fig. 2(c) and (d), each plot represents one individual sample). The results of the above experiments showed that, although the total amount of Sn in the deposits increased proportionally with the addition of Sn in the electrolyte, the excess Sn deposits were not effectively converted into detectable ion signals. Therefore, the above experiments failed to achieve the purpose of increasing the signal intensity of 120Sn ions by simply summing the Sn addition in electrolyte. An in-depth analysis of the electrodeposition process as well as the products was required to explain the causes of the above anomalies and to find a solution.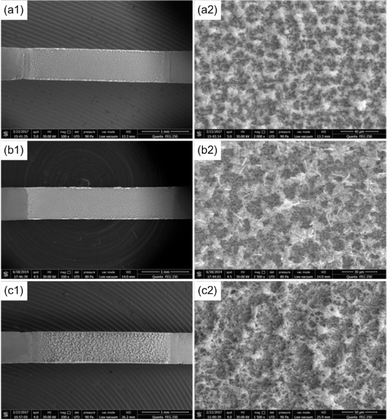 | ||
| Fig. 1 SEM for electrodeposition sources with different Sn contents; (a) 1 μg, (b) 2 μg and (c) 4 μg. | ||
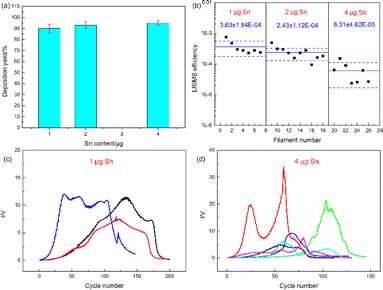 | ||
| Fig. 2 (a) Electrodeposition yields, (b) LRIMS detection efficiency and (c) and (d) signal curves of 120Sn ions from electrodeposition sources with different Sn contents. | ||
Analysis of the electrodeposition process and deposits
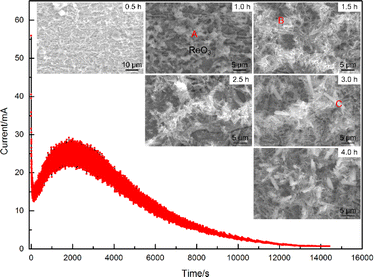
To better understand the composition of the electrodeposition products, the formation process needs to be analyzed first. Fig. 3 showed a typical I–t curve recorded during the electrodeposition process. It can be seen that the current decreased sharply at the very beginning, then raised slowly to an extreme value, and eventually decreased to near zero. The complex trend of the curve suggested that different reactions may occur at different stages of the electrodeposition process. In addition, the fluctuation of the I–t curve also varied at different stages, where the fluctuation of the current was also greatest at the maximum value of the current. According to the I–t curve in Fig. 3, the electrodeposition process can be characterised into different stages, and six electrodeposition experiments were carried out for different durations (for a total amount of Sn added of 4 μg). Fig. 3 also showed the micromorphology of the deposits obtained under different electrodeposition time and it can be seen that the surface morphology of the electrodeposition evolved according to the trend of granular grains → dendritic grains → rod grains with the extension of time.The EDS analysis of various deposit forms indicated significant differences in their elemental compositions. In the initial phase of deposition, the granular grains in area A exhibited the highest content of O, with lower levels of other elements. Micro-area X-ray diffractometry (micro-XRD) analysis of the oxide identified it primarily as ReO3, suggesting that reverse deposition of Re, dissolving from the cathode surface, was predominant during the early stages of the energisation process. The fine dendritic structures (identified as B), which formed as deposition time extended, mainly consisted of Sn, O, Pt, and a trace of Cl. In this area, Pt and Sn were particularly concentrated. Towards the final stage of deposition, the rod-shaped deposits marked as C showed a noticeable increase in the content of Cl and Pb. The deposition yields of Sn at varying deposition durations were measured using an electrolyte containing the 113Sn tracer. It was found that the electrodeposition yield was greater than 90% when the deposition time was over 3 hours. When the deposition time was further extended, the increase in the electrodeposition yield was not significant.
Fig. 1 and 4 showed that the electrodeposition products contained various elements, such as O, Cl, Pt, Sn, Pb and Re. To further study the species of each element in the deposits, the samples obtained at different deposition times were characterised via XPS for Cl, Pt, Sn and Pb, respectively. The element content of XPS analysis was consistent with the EDS results (see Fig. 2s in ESI†). According to the binding energy,23 the of Sn 3d region showed that Sn was consisted of two valence states, namely, 0 and +2 in all of the deposits prepared under different deposition time. This phenomenon was also observed in our previous study with 1 μg Sn samples.22 More specifically, Sn was present as a mixture of Sn0 and Sn2+; the latter was predominant on the deposit surface, whereas the Sn0 component increased with the etching depth of Ar+ and progressively became the primary species in the deposits. Since the laser at a specific wavelength would only resonantly ionize with Sn in the atomic state, but not Sn2+, thus the Sn2+ was actually an ineffective electrodeposition product. It can be reasonably inferred that the different ratios of Sn species in different electrodeposited samples would result in large differences in the LRIMS detection efficiency (larger RSD) even at similar electrodeposition yields. Base on the experimental data in Fig. 2(b), a decrease in average detection efficiency correlated with an increase in Sn content was observed, likely attributable to a rise in the proportion of Sn2+ within the electrodeposits. The variation in the rate of two species Sn among different samples was also more significant for deposits with larger Sn content, leading to larger fluctuation of the detection efficiency. Moreover, no consistent pattern was evident in the shapes of the 120Sn ion signal curves obtained during the LRIMS tests on various samples (see Fig. 2(d)). In certain instances, multiple peaks were discernible, possibly reflecting the evaporation–ionization process of different forms of Sn. Consequently, it can be deduced that the observed fluctuations in detection efficiency across samples and the diversity in the shape of the 120Sn ion signal curves were intrinsically linked to the morphology and composition of Sn in the electrodeposition source.
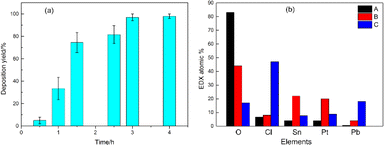 | ||
| Fig. 4 (a) Deposition yields for different deposition times and (b) EDS analysis results corresponding to different species. | ||
Due to the complex composition of electrodeposits, we cannot also ignore the interaction between them during the LRIMS test. The role of each element in the electrodeposition source and its possible effects on the LRIMS test were analyzed below. As mentioned in Section 2.1, the Sn source of microgram scale was electrodeposited in 2 M HCl solution, which was also the usual medium for the purification and separation of Sn from matrix. According to our previous study,22 it was clear that electrodeposition on the ultrasmall surface of Re filaments was a process strongly affected by the hydrogen evolution reaction. To mitigate the interference of hydrogen bubbles generated on the Re surface during the electrodeposition process, the surface of Re filaments was modified to enhance the hydrophilicity. As a result, an increased number of microscopic “grooves” were observed on the surface of Re filaments, providing additional active sites for subsequent electrodeposition. The Sn deposits exhibiting dendritic growth tended to be relatively loose. Throughout the deposition process, localised alkaline regions developed on the electrode surface amidst the microscopic dendrites. This environment facilitated the formation of alkaline stannous chloride, as demonstrated in eqn (1). Consequently, during the electrodeposition of trace amounts of Sn in an HCl system, the presence of some chlorides in the deposit was inevitable.
| SnCl2 + H2O = HCl + Sn(OH)Cl↓ | (1) |
As shown in Fig. 5(a), there were also different chemical states of Cl in the electrodeposition source, but the peak shape did not change remarkably with increasing deposition time. To date, there were no directly related studies on the possible effects of Cl on the LRIMS testing process for Sn. Fortunately, during the measurement of Sn by graphite furnace atomic absorption spectrometry (GFAAS), E. Lundberg et al.24 described the mechanism of action of Cl in the matrix on the ashing-atomization process of Sn, which can provide a reference for this study. In the above-mentioned paper, the loss of Sn on the graphite surface during the drying and ashing stages was monitored via radioactive measurements. The results showed that the Cl present in the matrix caused the volatilization loss of Sn at lower heating temperatures. Based on the previous analysis, Cl could be unavoidable in the deposits prepared from electrolyte containing HCl, and the content of Cl in the deposits also increased with increasing of Sn addition (Fig. 1(a3) vs. Fig. 1(c3)). Despite the fact that EDS is a semi-quantitative analysis method, and results of element content fluctuate among different samples and even different test areas. This conclusion was reasonable in the EDS analysis based on a large number of samples with different Sn contents. During the LRIMS test, the surface temperature of the Re filament generally raised to 800–900 °C by electric heating within 10–20 min in a high vacuum. Therefore, it can be inferred that the Cl present in the deposits firstly reacted with part of the Sn at lower temperatures during the heating process, volatilizing in the form of chloride, and resulting in an ineffective loss of Sn and lower detection efficiency of LRIMS. Therefore, the electrodeposition of Sn in HCl electrolyte seemed to be inadequate.
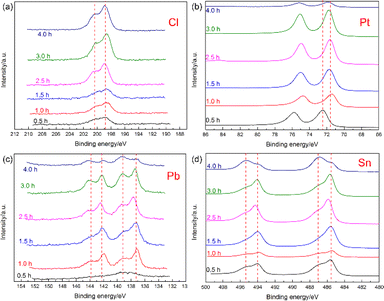 | ||
| Fig. 5 XPS analysis results of (a) Cl, (b) Pt, (c) Pb and (d) Sn prepared under different deposition times. | ||
Previous experimental results showed that the deposition yield of 1 μg Sn sample increased from 37% to 90% when the lead content increased from 1 μg to 5 μg in the electrolyte.22 However, as the lead content continued to increase to 10 μg, the deposition yield gradually decreased to 82%, indicating that the addition of lead should be controlled to a certain extent. In addition, the excess of Pb would also lead to the complications in composition at the late stage of electrodeposition, which may have an adverse effect on the subsequent LRIMS testing. The results of XPS analysis showed that Pb in the deposit was also composed of two valence states: 0 and +2. When co-deposited with Sn, Pb was generally 0-valent, and when co-deposited with Cl, it was +2. Although the electrodeposition time was found to significantly affect the yield for micro-electrodeposition,25,26 based on a comprehensive analysis of the above results, it could be concluded that it was not advisable to prolong the deposition time without any limitations in pursuing a higher yield. In contrast, the deposition time should be strictly controlled. After electrodeposition for 3 h, the increase in the electrodeposition yield was not obvious and rod-like deposits (marked C in Fig. 3) were gradually introduced, which complicated the deposition and the LRIMS test process.
The presence of Pt in the deposits was a result of anodic dissolution, predominantly located within the nanoscale dendritic crystals, paralleling the elemental distribution pattern of Sn. The XPS analysis in Fig. 5(b) showed that the Pt in samples obtained at different deposition times largely remained in the atomic state. Given the significant catalytic impact of nanoscale Pt on the hydrogen evolution reaction, a gradual increase in current (the main reaction) was observed following an initial sharp decline in the I–t curve. This also leaded to a noticeable rise in the fluctuation of the corresponding curve. Since the elemental distribution of Pt aligns with Sn in the dendritic crystals, it can be tentatively concluded that Pt significantly enhanced the Sn deposition process. The carrier effect of Pt on trace or microscale elements during the electrodeposition process has also been documented in the electrodeposition of actinide elements.27,28 Although chlorine, an undesired element, was inevitably introduced during Sn electrodeposition, it also facilitates the anodic dissolution of Pt in the HCl system, indirectly aiding Sn electrodeposition. To minimise chlorine's interference in the deposits, electrodeposition of Sn in a sulfuric acid system was also conducted for comparison. However, the resulting Sn and Pt content in these deposits was found to be notably low.
Although we succeeded in enriching most of the Sn in solution in the ultrasmall region of the Re filament, the detection efficiency of the LRIMS test was significantly improved compared to that of the original method. However, the electrodeposition of microgram Sn on an ultrasmall surface heavily interfered with the hydrogen evolution reaction. Due to the complexity of the composition, microstructure, and valence of the deposits, the LRIMS tests were inevitably accompanied by a complex atomization process, leading to large sample-to-sample fluctuations in the test results. Therefore, electrodeposits must be reprocessed appropriately before the LRIMS test to obtain a relatively homogeneous composition that was conducive to subsequent testing and to minimizing possible interactions between elements.
Heat treatment of the electrodeposited sources
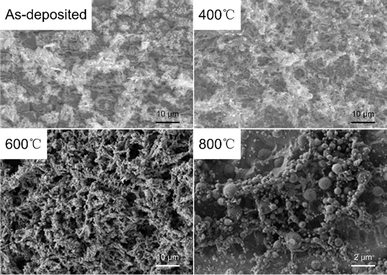
The EDS results in Fig. 1 showed that Sn may exist in the form of oxides, chlorides, alkali chlorides, etc., in the deposits. To obtain a monomorphic state, it was necessary to transform the futile oxides and chlorides of Sn to the atomic state before LRIMS measurement. Currently, high-purity Sn powder was often prepared by hydrogen reduction at high temperatures,29 therefore, this paper also explored the use of this effective method for the post-treatment of the electrodeposition products. Prior to experimental action, the results of the Gibbs free energy calculations for the reduction of some of the Sn oxides and chlorides to Sn by hydrogen at different temperatures were presented in Fig. 6, which indicated that the reduction of Sn oxides and chlorides to metallic Sn by hydrogen was thermodynamically feasible below 850 °C.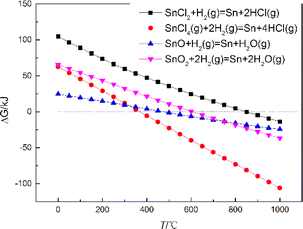 | ||
| Fig. 6 Gibbs free energy for the reduction of several oxides and chlorides to Sn metal by hydrogen at different temperatures. | ||
First, four group samples were prepared by electrodeposition with a total of 4 μg Sn, and then heat-treated in a quartz tube furnace at different temperatures for 1 h in hydrogen atmosphere, respectively. The microscopic morphology of the samples after heat treatment was shown in Fig. 7. It can be seen that the dendritic crystals of the electrodeposited products did not change significantly after heat treatment below 600 °C. However, after heat treatment at 900 °C, the microscopic morphology changed from dendrites to spherical particles, indicating that the deposits showed obvious signs of melting after heat treatment. To avoid a large amount of volatilization of Sn during the post-treatment, the temperature should be kept below 900 °C, which was recommended to be 600 °C. It was worth noting that the deposits still maintained intact dendrites after heat treatment at 600 °C, and a melting phenomenon was observed after heat treatment at 900 °C, regardless of the fact that the melting point of Sn metal is only 232 °C. From the discussion in Section 3.2, we can conclude that the Pt originated from anodic dissolution significantly promoted the electrodeposition of Sn, and the elemental distributions of Sn and Pt were mainly concentrated in the microscopic dendritic region. According to the phase diagram of the Sn–Re system, Re does not form any intermetallic compound with Sn.30 Among other elements present in the deposits, only Pt has the potential to increase the melting point of Sn. Therefore, the phase diagram of Sn–Pt binary alloys was analyzed, and it can be seen from Fig. 8(a) that two thermodynamically stable intermetallic compounds (PtSn2 and Pt2Sn3) may form between Sn and Pt from 600 °C to 900 °C. To verify the above hypothesis, micro-XRD analysis of the deposits showed that the PtSn2 phase was formed after heat treatment at 600 °C for 1 h.
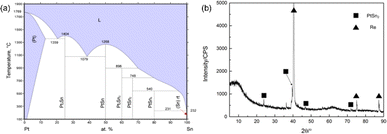 | ||
| Fig. 8 (a) Phase diagram of the Pt–Sn system; (b) micro-XRD analysis of the deposits after heat treatment at 600 °C for 1 h. | ||
To examine the effect of heat treatment in hydrogen atmosphere, the sample after heat treatment at 600 °C was further characterized and analyzed via XPS. Fig. 9 showed that the Cl and Pb peaks had basically disappeared after heat treatment, and Sn mostly transformed to an atomic state. Therefore, heat treatment of the electrodeposits under a hydrogen atmosphere effectively reduced the complexity of the composition and essentially yielded a Sn source close to monomorphic state. The formation of PtSn2 after heat treatment was favorable for improving the thermal stability of Sn during the subsequent LRIMS test.
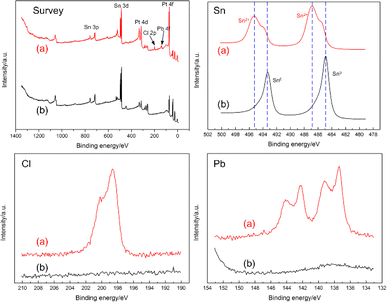 | ||
| Fig. 9 XPS analysis of (a) the as-electrodeposited sample and (b) after heat treatment at 600 °C for 1 h. | ||
Preparation and testing of the sandwiched source
The LRIMS test was performed on the electrodeposition source after heat treatment at 600 °C for 1 h, and the signal curves of the 120Sn ions were recorded as shown in Fig. 10(a). Although the maximum signal intensity of the 120Sn ions was high enough, the fluctuations were relatively severe. Due to the volatility of Sn, the evaporation process of Sn was rather rapid and it was difficult to effectively control the evaporation rate of Sn by adjusting the heating current of the Re filament, which was very unfavorable for subsequent measurement of the isotope ratio of 121mSn/126Sn. Therefore, the question of how to effectively control the stability of the 120Sn ion signal during LRIMS measurement must be addressed. In response to the above problem, 1 μm-thick titanium coating was prepared on the surface of the heat-treated deposited layer by magnetron sputtering, thus converting the evaporative atomization source into a diffusive atomization source. During the LRIMS test, Sn passed through the titanium barrier by diffusion instead of direct volatilization. As a result, the stability and repeatability of the final signal curves of the 120Sn ion were significantly improved, as shown in Fig. 10(b). The optimized preparation flowchart of a highly efficient and stable Sn atomic beam source with a sandwich structure for the LRIMS test is shown in Fig. 11.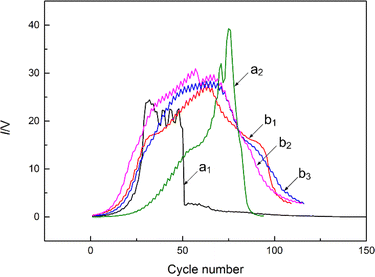 | ||
| Fig. 10 Signal curves of 120Sn ions recorded with different sources: (a) without titanium coating; (b) and with titanium coating. | ||
The detection efficiencies of different Sn samples were summarized in Table 2 for comparison. The detection efficiency of LRIMS is defined as the ratio of the total number of ions counted by the detector to the number of atoms initially present on the Re filament (assuming an electrodeposition efficiency of 100%). Observations revealed that when the electrodeposited samples were directly subjected to LRIMS testing, the detection efficiency progressively declined as the Sn content increased, leading to a marked rise in the variability of test results. Samples containing 2 μg and 4 μg of Sn were also prepared using the improved method depicted in Fig. 11 and subsequently tested by LRIMS for comparison. The test results indicated that, for the 2 μg Sn sample, although the average detection efficiency was marginally lower than before treatment, the stability of the test results across samples showed slight improvement. For the 4 μg Sn sample, there was a notable enhancement in average detection efficiency. However, due to the inevitable loss of Sn during heat treatment, the detection efficiency values obtained in the final tests would be lower than the actual scenario. The results in Table 2 also indicated that as the Sn content increased, the matrix interference effect on the test results was more significant than that of the other methods. At the same time, the optimized preparation method proposed in this paper was more effective in eliminating the matrix interference effect for samples with higher Sn contents.
| Sample no. | 1 μg Sn | 2 μg Sn | 2 μg Sn with sandwich structure | 4 μg Sn | 4 μg Sn with sandwich structure |
|---|---|---|---|---|---|
| 1 | 7.40 × 10⁻⁴ | 4.97 × 10⁻⁴ | 2.4 × 10⁻⁴ | 6.33 × 10⁻⁵ | 3.76 × 10⁻⁴ |
| 2 | 4.7 × 10⁻⁴ | 3.05 × 10⁻⁴ | 3.1 × 10⁻⁴ | 1.52 × 10⁻⁴ | 7.83 × 10⁻⁴ |
| 3 | 3.0 × 10⁻⁴ | 2.98 × 10⁻⁴ | 2.34 × 10⁻⁴ | 8.90 × 10⁻⁵ | 5.96 × 10⁻⁴ |
| 4 | 2.8 × 10⁻⁴ | 2.30 × 10⁻⁴ | 1.18 × 10⁻⁴ | 2.37 × 10⁻⁵ | 5.81 × 10⁻⁵ |
| 5 | 2.3 × 10⁻⁴ | 1.55 × 10⁻⁴ | 1.73 × 10⁻⁴ | 2.58 × 10⁻⁵ | 3.87 × 10⁻⁴ |
| 6 | 2.8 × 10⁻⁴ | 2.3 × 10⁻⁴ | 2.11 × 10⁻⁴ | 6.10 × 10⁻⁵ | 1.42 × 10⁻⁴ |
| 7 | 2.4 × 10⁻⁴ | 2.8 × 10⁻⁴ | 1.47 × 10⁻⁴ | 2.69 × 10⁻⁵ | 5.40 × 10⁻⁵ |
| 8 | — | 9.5 × 10⁻⁵ | 1.92 × 10⁻⁴ | — | — |
| 9 | — | 1.6 × 10⁻⁴ | 1.58 × 10⁻⁴ | — | — |
| 10 | — | 1.8 × 10⁻⁴ | 1.27 × 10⁻⁴ | — | — |
| Average values | 3.63 × 10⁻⁴ | 2.43 × 10⁻⁴ | 1.91 × 10⁻⁴ | 6.31 × 10⁻⁵ | 3.42 × 10⁻⁴ |
| RSD/% | 50.8 | 46.9 | 31.0 | 73.3 | 81.4 |
Conclusions
To meet the rigorous requirements of LRIMS test for real samples, the preparation and measurement of Sn sources with different sample contents were carried out in this paper. Methods for improving the detection efficiency and stability of LRIMS were further explored, and the following conclusions were mainly drawn:(1) The electrodeposition efficiency was maintained above 90% as the Sn content increased from 1 to 4 μg. However, the detection efficiency of the LRIMS gradually decreased with increasing Sn content, and the fluctuations in the test results increased significantly.
(2) The analysis and characterization of the electrodeposition process, composition, morphology and valence of the deposits showed that the fluctuations in the detection efficiency results could be attributed to the complexity of the elements, the composition and valence of the deposits and the interference between each other. Among all the constituent elements, Cl played a very special role: on the one hand, during the electrodeposition process, the HCl was more conducive to the anodic dissolution of platinum, which in turn promoted the co-deposition of Pt–Sn; however, during the heating process of the LRIMS test, Cl promoted the low-temperature volatilization of Sn, which reduced the detection efficiency.
(3) The harmful impurity in deposits, such as Cl, could be effectively removed and the Sn sources close to monomorphic was obtained after heat treatment in a hydrogen atmosphere. The optimal heat treatment temperature was 600 °C. The micro-XRD analysis showed that a PtSn2 intermetallic compound was formed after heat treatment at 600 °C.
(4) The LRIMS test was performed directly on the Sn source after heat treatment, and the signal intensity of the obtained 120Sn ions was high but fluctuating. After a titanium coating with a thickness of 1 μm was covered on the surface of the deposit by magnetron sputtering, the signal stability of the sandwiched sample could be significantly improved during the LRIMS test.
(5) As the Sn content increased, the matrix interference effect on the test results was more significant. At the same time, the optimized preparation method proposed in this paper was more effective in eliminating the matrix interference effect for samples with higher Sn contents.
Finally, a highly efficient and stable Sn atomic beam source with a sandwiched structure has been successfully developed in this paper and the next step will be focused on applications in geochemical research and nuclear pollution monitoring.
Author contributions
Jiangfan Wang: conceptualization, writing – original draft preparation. Jinlong Fan: methodology (electrodeposition). Zhiming Li: conceptualization, supervision. Wenliang Wang: methodology (measurement of LRIMS). Lei Feng: methodology (measurement of LRIMS). Pengfei Zhang: methodology (measurement of LRIMS). Guowei Chen: methodology (measurement of electrodeposition yield by γ-ray). Xiaowei Yi: formal analysis and validation. Xiangbo Zhang: methodology (the preparation of 113Sn tracer). Xiaopan Shen: writing – reviewing and editing. Jiang Xu: writing – reviewing and editing.Conflicts of interest
The authors declare that they have no known competing financial interests or personal relationships that could have influenced the work reported in this study.Acknowledgements
The author would like to thank Xiaoyi Sun (China Institute of Atomic Energy) for her beneficial introduction to the micro-electrodeposition experiments.References
- B. H. Liang, J. S. Zhang, Y. C. Li, Y. M. Chen, G. Zhang and W. H. Du, J. Chin. Mass Spectrom. Soc., 2012, 33, 349–352 CAS.
- X. P. Shen, Z. M. Li, W. L. Wang, L. H. Zhai, H. Deng, J. Xu, G. Y. Wei and W. Wang, Chin. J. Anal. Chem., 2017, 45, 342–347 CAS.
- J. B. Creech, F. Moynier and N. Badullovich, Chem. Geol., 2017, 457, 61–67 CrossRef CAS.
- A. Mason, PhD thesis, Dissertation of City University of New York, 2020.
- C. Gillis, R. Clayton and P. Andersson, Abstract from 33rd Archaeometric Conference, 2002 Search PubMed.
- G. Brüegmann, D. Berger and E. Pernicka, Geostand. Geoanal. Res., 2017, 41, 437–448 CrossRef.
- X. Wang, C. Fitoussi, B. Bourdon and Q. Amet, J. Anal. At. Spectrom., 2017, 32, 1009–1019 RSC.
- P. Liu, J. Mao, B. Lehmann, S. Weyer, I. Horn, R. Mathur, F. Wang and Z. Zhou, Am. Mineral., 2021, 106, 1980–1986 CrossRef.
- J. X. She, W. Li, S. An, T. Yang and R. Zhang, J. Anal. At. Spesctrom., 2023, 38, 1043–1056 RSC.
- D. Zhang, Z. Bao, P. Liu, G. Brüegmann, W. Yang, K. Chen, P. liang and H. Yuan, J. Anal. At. Spectrom., 2023, 38, 204–211 RSC.
- F. Oberli, P. Gartenmann, M. Meier, W. Kutschera, M. Suter and G. Winkler, Int. J. Mass Spectrom., 1999, 184, 145–152 CrossRef CAS.
- S. A. Crowther, R. K. Mohapatra, A. G. Turner, D. J. Blagburn, K. Kehm and J. D. Gilmour, J. Anal. At. Spectrom., 2008, 23, 938–947 RSC.
- Y. Iwata, C. Ito, H. Harano and T. Aoyama, Int. J. Mass Spectrom., 2010, 296, 15–20 CrossRef CAS.
- T. Stephan, R. Trappitsch, A. M. Davis, M. J. Pellin, D. Rost, M. R. Savina, R. Yokochi and N. Liu, Int. J. Mass Spectrom., 2016, 407, 1–15 CrossRef CAS.
- H. Rimke, G. Herrmann, C. Muhleck, N. Sattelberger, N. Trautmann, F. Ames and W. Ruster, Inorg. Chim. Acta, 1987, 140, 277–278 CrossRef CAS.
- W. Ruster, F. Ames, H. J. Kluge, E. Wotten, D. Rehklau, F. Scheerer, G. Herrmann, C. Muhleck, J. Riegel, H. Rimke, P. Sattelberger and N. Trautmann, Nucl. Instrum. Methods Phys. Res., Sect. A, 1989, 281, 547–558 CrossRef.
- H. Wendeler, R. Deissenberger, F.-J. Urban, N. Trautmann and G. Herrmann, Nucl. Instrum. Methods Phys. Res., Sect. A, 1993, 334, 93–95 CrossRef CAS.
- B. Eichler, S. Hübener, N. Erdmann, K. Eberhardt, H. Funk, G. Herrmann, S. Köhler, N. Trautmann, G. Passler and F.-J. Urban, Radiochim. Acta, 1997, 79, 221–234 CrossRef CAS.
- S. Köhler, R. Deibenberger, K. Eberhardt, N. Erdmann, G. Herrmann, G. Huber, J. V. Kratz, M. Nunnemann, G. Passler, P. M. Rao, J. Riegel, N. Trautmann and K. Wendt, Spectrochim. Acta, Part B, 1997, 52, 717–726 CrossRef.
- P. Schönberg, C. Mokry, J. Runke, D. Schönenbach, N. Stöbender, P. Thöle-Pospiech, N. Trautmann and T. Reich, Anal. Chem., 2017, 89, 9077–9082 CrossRef PubMed.
- W. L. Wang, X. P. Shen, L. H. Zhai, H. Deng and Z. M. Li, International Mass Spectrometry Conference, 2018, https://www.imsc2018.it/images/IMSC2018_Abstract_Book.pdf Search PubMed.
- J. Wang, J. Fan, W. Wang, X. Zhang, L. Feng, X. Zhai, X. Shen and Z. Li, RSC Adv., 2023, 13, 10433–10439 RSC.
- J. W. Wells, G. Cabailh, D. A. Evans and S. Evans, J. Electron Spectrosc. Relat. Phenom., 2004, 141, 67–72 CrossRef CAS.
- E. Lundberg, B. Bergmark and W. Frech, Anal. Chim. Acta, 1982, 142, 129–142 CrossRef CAS.
- A. Plionis, J. Rim, E. Hastings and S. Lamont, J. Radioanal. Nucl. Chem., 2009, 282, 905–908 CrossRef CAS.
- X. Y. Sun, K. Huang, L. Yang, Y. Yue, G. Mao, S. Yang and Y. Ding, Chinese. J. Nucl. Radiochem., 2020, 42, 366–370 CAS.
- K. I. Ota, S. Nishigori and N. Kamiya, J. Electroanal. Interfacial Electrochem., 1988, 257, 205–215 CrossRef CAS.
- A. M. Beesley, M. T. Crespo, N. Weiher, N. Tsapatsaris, J. Scozar, H. Esparza, C. G. Mendez, P. Hill, S. L. Schroeder and M. E. Montero-Cabrera, Appl. Radiat. Isot., 2009, 67, 1559–1569 CrossRef CAS PubMed.
- J. H. Hu, A method for the preparation of high-purity Tin powder [P], Chinese Pat., 201110238630.9, 2011 Search PubMed.
- H. Okamoto, Re-Sn Phase Diagram, ASM Alloy Phase Diagrams Center, ed. P. Villars, H. Okamoto and K. Cenzual, ASM International, Materials Park, OH, 2006 Search PubMed.
Footnote |
| † Electronic supplementary information (ESI) available. See DOI: https://doi.org/10.1039/d4ra02689f |
| This journal is © The Royal Society of Chemistry 2024 |

