 Open Access Article
Effects of crack–γ/γ′ interface relative distributions on the deformation and crack growth behaviors of a nickel-based superalloy
Xinmao Qin abcd,
Wanjun Yan
 b,
Yilong Liang*acd and
Fei Liacd
aCollege of Materials and Metallurgy, Guizhou University, Guiyang 550025, China. E-mail: ylliang@gzu.edu.cn
bSchool of Electronic and Information Engineering, Anshun University, Anshun 561000, China
cGuizhou Key Laboratory for Mechanical Behavior and Microstructure of Materials, Guiyang 550025, China
dNational & Local Joint Engineering Laboratory for High-Performance Metal Structure Material and Advanced Manufacturing Technology, Guiyang 550025, China
First published on 16th May 2024
Abstract
Using the molecular dynamics (MD) method, we investigated the effects of crack distributions on the deformation and crack growth of a nickel (Ni)-based superalloy. The results indicated that as the distance between two cracks increased, both tensile strength and plasticity decreased, while the crack growth rate significantly increased. In systems with short crack distances, strong interactions occurred between the dislocations that emitted from two cracks and the γ/γ′ interface mismatched dislocation network. These interactions led to an overlap in the plastic zones ahead of the crack tips at the γ/γ′ interface, which resulted in significant passivation at the front and middle regions of the cracks. Consequently, the two cracks merged in the X-direction to form a wide crack. The cracks coalescence consumed a lot of external deformation work, resulting in the highest tensile strength and plasticity. In this study, we proposed a potential approach to simultaneously enhance the strength and plasticity of multidefect systems, providing a theoretical basis for explaining deformation mechanisms and crack growth in these systems.
1. Introduction
Nickel-based superalloys, a type of aging strengthened alloy widely used at present, contain numerous coherent precipitates, such as the γ′ (Ni3Al) and γ′′ (Ni3Nb) phases. These precipitates significantly enhance the strength of the alloy at room and elevated temperature. Because of their excellent properties, such as corrosion resistance and high strength, these superalloys are commonly used in components, for example, oil slinger drum shafts and turbine disk connection bolts for aircraft engines, as well as wind power connection bolts, and key components for marine engineering.1–3 The plastic deformation and fracture failure of mechanical components occur primarily during service. The fracture of a mechanical component consists of crack initiation and crack growth at the macroscopic level. The microscopic mechanism of fracture refers to the chemical bond constantly broken between atoms, which determines the crack initiation and growth process of mechanical components on a macroscopic scale, and ultimately determines their mechanical properties. The mechanical components inevitably contain microscopic voids, cracks, and other defects, which alter the microstructure evolution during deformation and the corresponding mechanical properties. Therefore, it is necessary to study the effects of internal microscopic defects, such as micro-cracks, micro-voids, and grain boundaries, on the deformation and fracture. However, it is difficult to experimentally study the microstructure evolution of the deformation system in real time. The atomic-scale molecular dynamics (MD) simulation provides a feasible way for the investigation of deformation and fracture of materials. The MD method treat atoms as classical particles whose motion follows Newton's equations of motion. And the Newton's equation of motion was solved by integral algorithm to obtain the evolution of atomic position and velocity with time. So, the corresponding relationship between the microstructure of the system and its physical and mechanical properties was obtained. During deformation, the MD simulation can be used to record the atomic motion trajectory of the system in real time and to further analyze the microstructure evolution through corresponding visualization software.To date, MD methods have been widely used to study the deformation and fracture of pure metals, including Ni,4–11 Cu,12,13 Al,14–17 Ag,18 Fe,19–22 Mg,23 and Ti.24,25 In addition to pure metals, the deformation and fracture of binary nickel/nickel aluminide (Ni/Ni3Al) alloy have been investigated using the MD method. Yashiro26 et al. studied the dislocation behavior of the tip and edge of the rectangular precipitate (Ni3Al) in the Ni matrix. Zhu,27 Wu,28 Li29 and Yang30 further investigated stability mechanism of mismatched dislocation networks at different γ (Ni)/γ′ (Ni3Al) interfaces of Ni-based superalloys. Li31 and Chen32 discussed the deformation behaviors and microstructure evolution of the γ/γ′ system under shock loading. Kohler33 et al. performed MD simulation of the interaction between edge dislocation of the Ni matrix phase and spherical precipitate. It was found that the interaction between dislocation and precipitate was related to the size of precipitate. Cui34 et al. explored the effect of microscopic defects on the interaction between dislocation and Ni3Al precipitate. Liu,35 Ma,36 Yu,37 and Ben38 studied the crack growth behavior of the γ/γ′ system and found that the defects (e.g., vacancy, dislocation), γ/γ′ interface, and grain boundary had a significant impact on the crack growth. The effects of different stress states, crack locations, and orientations on fatigue crack growth in Ni-based superalloys were studied in our previous work.39 The influence of relative distributions of multiple microscopic defect (holes or cracks) on the deformation and fracture of γ/γ′ alloy is rarely studied.
In this study, we used the MD method to systematically examine the influence of the two cracks distributions relative to the γ/γ′ interface on the deformation and crack growth behavior of the deformation system. The different distributions of two cracks relative to the γ/γ′ interface mainly refers to the difference of the distance between the two cracks (which distributed at the two side of the γ/γ′ interface) in the width (X-direction in our simulation model) and length (Y-direction in our simulation model) direction. So, we primarily investigate the distance between the two cracks in the width (X-direction in our simulation model) and length (Y-direction in our simulation model) direction on the deformation and crack propagation behavior of the Ni/Ni3Al superalloy. By calculated the tensile strength, accumulated plastic strain, and the relationship between the crack length and strain of the deformation system with different cracks distributions, the deformation and crack propagation behavior of the Ni/Ni3Al superalloy with different distributions of two cracks relative to the γ/γ′ interface were analyzed. And further provided the microscopic mechanism of the deformation and crack growth of the system in terms of the microstructure evolution characterization of the system and fracture mechanics theory analysis. Our research provides a potential way to improve the strength and plasticity of multidefect systems (e.g., internal nanopore, cracks) at the same time and provides a theoretical basis for explaining the deformation mechanism and crack growth of multidefect systems.
2. Simulation method and details
2.1 Simulation method and model
In this work, we used the Large-Scale Atomic/Molecular Massively Parallel Simulator (LAMMPS)40 software to investigate the deformation and crack growth behaviors in Ni-based superalloy. The simulation model was composed of the γ phase (Ni) and γ′ phase (Ni3Al), as shown in Fig. 1. The dimensions of the model were 514, 257, and 257 Å for the X ([100]), Y ([010]), and Z ([001]) direction, respectively. To relax the mismatched stress that originated from the lattice mismatch of the γ phase and γ′ phase, we selected the size of two phases of the model as naγ ≈ maγ′ (the n and m are positive integer numbers; aγ = 3.524 Å and aγ′ = 3.573 Å). By remove some atoms of the corresponding regions in the system, we created a model with two cracks for specified distributions. It should be noted that the initial crack shape is rectangular, and its length and width is 15aγ and 3aγ (aγ = 3.524 Å), respectively. At present, the deformation system with rectangular crack has been extensively applied to study the deformation and crack propagation behavior of the metals.5,8,18,38,41,42 In this simulation, the different distributions of two cracks relative to the γ/γ′ interface mainly refers to the difference of the distance between the two cracks (which distributed at the two side of the γ/γ′ interface) in the width (X-direction in our simulation model) and length (Y-direction in our simulation model) direction. Therefore, we divided the model with various cracks distributions (relative to the γ/γ′ phase interface) into two cases: (1) two cracks were distributed symmetrically relative to the interface, and the distance between crack1 and crack2 (dx) in the X-direction was 20, 40, 60, 80, 120, 160, 200, and 240 Å (as shown in Fig. 1(b)); and (2) two cracks were distributed asymmetrically relative to the interface, and the distance dy in the Y-direction was 0, 30, 60, 90, and 120 Å (as shown in Fig. 1(c)).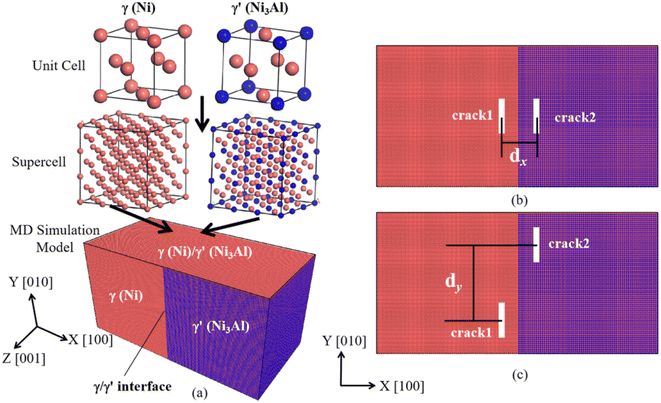 | ||
| Fig. 1 The MD simulation tensile model, (a) the structure of the (Ni)/(Ni3Al) alloy, (b) the loading condition I, (c) the loading condition II. | ||
We applied the three-dimensional periodic boundary conditions to the simulation. Before loading, using an isothermal–isobaric ensemble (NPT), the simulation system relaxed 10 ps at a temperature of 300 K and a pressure of 0 bar. Then we performed the uniaxial tensile loading along the X-direction, and we used the microcanonical ensemble (NVE) in this loading stage (strain rate ![[small epsi, Greek, dot above]](https://www.rsc.org/images/entities/i_char_e0a1.gif) = 1 × 10⁹ s−1, it should be noted that this strain rate is commonly used in molecular dynamics simulations investigation of deformation and fracture of metal systems). To verify the repeatability of the calculation results, we conducted three calculations for each model. The results showed that the calculation data obtained by the same model with different random number parameters were fundamentally consistent, which indicated that our calculation results were reliable.
= 1 × 10⁹ s−1, it should be noted that this strain rate is commonly used in molecular dynamics simulations investigation of deformation and fracture of metal systems). To verify the repeatability of the calculation results, we conducted three calculations for each model. The results showed that the calculation data obtained by the same model with different random number parameters were fundamentally consistent, which indicated that our calculation results were reliable.
2.2 The atomic interactions potential
In this work, the Ni–Ni and Ni–Al atomic interactions of the deformation system was described by eam/alloy potential,43 which was extensively used to simulate mechanical properties of Ni/Ni3Al superalloy. And these results shows that the eam/alloy potential can be described successfully the relationship between the microstructure evolution and mechanical properties of Ni/Ni3Al superalloy with crack.32,38,44 The eam/alloy potential consists of the terms:
 | (1) |
2.3 The analysis method of the microstructure
To characterize the deformation and crack growth behaviors of these systems, we analyzed the evolution of microstructure and dislocations of the model using common neighbor analysis (CNA)45,46 and the dislocation extraction algorithm (DXA) of the Open Visualization Tool (OVITO)47,48 software.3. Results
3.1 Deformation behaviors
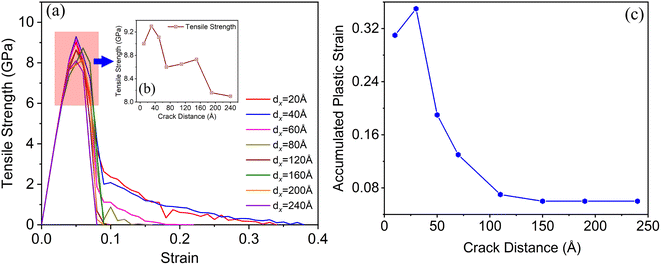
Based on the stress–strain curve, we further calculated the accumulated plastic strain of the deformation system, as shown in Fig. 2(c). The accumulated plastic strain of the deformation system, which was defined as the total tensile strain at the fracture subtracting the elastic strain of the deformation system. As the distance between crack1 and crack2 increased from 20 to 240 Å, the accumulated plastic strain of the tensile system decreased. When the distance increased to 120 Å, the accumulated plastic strain of the tensile system remained almost unchanged. From these results, we found that the distance between crack1 and crack2 in the X-direction obviously affected the deformation behaviors of tensile system.
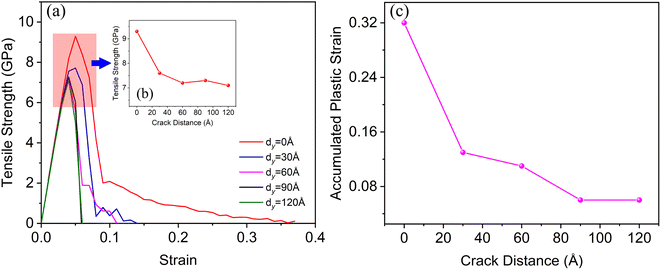
Based on these results, as the distance between crack1 and crack2 increased, both the tensile strength and plasticity of the tensile system notably weakened. This indicated that the strength and plasticity of the multicrack system could be improved simultaneously by reducing the distance between cracks in the system.
3.2 Crack growth behaviors
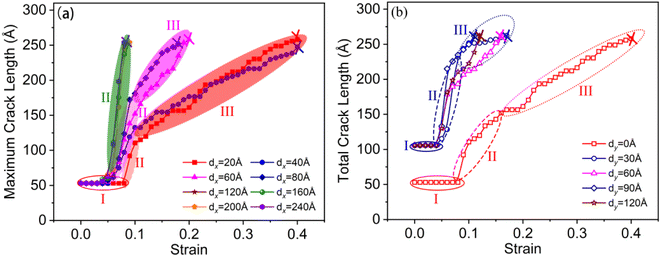
Fig. 4 shows the crack length versus strain relationship of the tensile model with various distances between two cracks. The crack growth in the tensile process had three typical stages—namely, the crack growth incubation stage (I), the crack growth rapid stage (II), and the crack growth stable stage (III). As dx increased from 20 Å to 240 Å, the strain consumed in the crack growth decreased, and the crack growth rate increased significantly. When dx = 20 Å, the crack growth mainly occurred during the crack growth stable stage (III), which consumed about 30% total tensile strain, whereas the crack growth stages I and II consumed 7 and 3% total strain, respectively. When dx increased to 60 Å, the strain consumed by the crack growth stable stage (III) accounted for about 10%, and the strain consumed in the crack growth incubation stage (I) and the rapid growth stage (II) was 5%. When dx = 120 Å, the system completely broke at the end of stage (II) of crack growth, and there was no stable crack growth stage. For the system (dx = 40 Å) with different dy, as crack distance increased, the crack growth rate increased, and the plastic work consumed in the crack growth process decreased. When dy > 30 Å, crack1 and crack2 began to propagate when the tensile strain of the system was 5%. Compared to the system when dy = 0 Å, the crack growth rate in stage (II) obviously increased. These results showed that the distance between two cracks on both sides of the γ/γ′ interface had a significant effect on crack growth.4. Discussion
4.1 Microstructure evolution
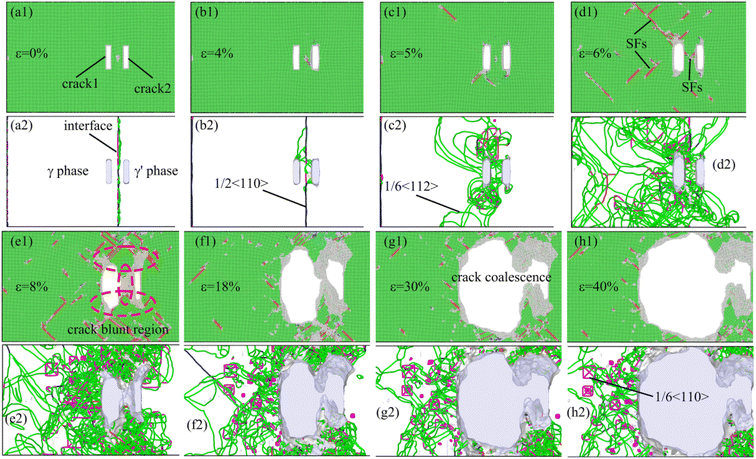
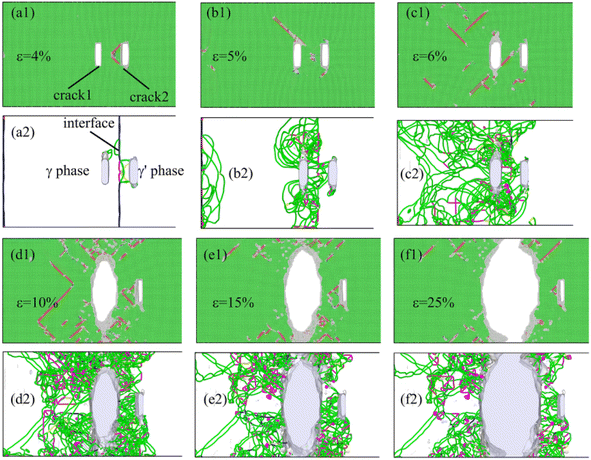
Fig. 5 shows the microstructure evolution Fig. 5(a1)–(h1) and dislocation configuration Fig. 5(a2)–(h2) of the system, which two cracks are distributed symmetrically relative to the interface and dx = 40 Å. Note that the green, red, and gray atoms represent face-centered cubic, hexagonal closest packed, and amorphous structure atoms in this figure, respectively. The area represented by the red atoms is the stacking fault during the deformation process. During the relaxation of the system before deformation, a quadrilateral mismatched dislocation network consisting of four dislocations formed at the γ/γ′ phase (as shown in Fig. 5(a2)), which was consistent with the results of Wu27–29 et al. Because of the symmetric distribution of crack1 and crack2 relative to the γ/γ′ interface and their small distance from the interface in the deformation system, the dislocations that emitted from two cracks interacted with the mismatched dislocation network at the γ/γ′ interface (Fig. 5(b2)). When the tensile strain was 5%, the interaction between the dislocations that emitted from two cracks and the γ/γ′ interface mismatched dislocation was more pronounced. As shown in Fig. 5(c2), the γ/γ′ interface mismatched dislocation network almost completely disappeared, mainly because the mismatched dislocation
  first decomposed into two Shockley partial dislocations
  and then interacted with the dislocations emitted from two cracks. As the strain increased to 8%, a high-density dislocation concentration zone appeared at the vicinity of the crack as a result of the strong interaction of the dislocations between the two cracks. At the same time, the crystal structure of the area between the two cracks was significantly blunted (Fig. 5(e1) and (f1)), causing the two cracks to propagate in the X-direction and merge into a broad crack. Then, as the loading continued, the merged wide crack slowly propagated until the deformation system completely fractured. During the growth process of cracks along the X-direction (similar secondary crack formation and growth), a large amount of plastic deformation work was consumed, which resulted in the system having the highest tensile strength and the best plasticity, whereas cracks slowly propagated in a typical plastic manner.
For the deformation system when dx = 60 Å (Fig. 6), the interaction between the crack emitting dislocations and the γ/γ′ interface mismatched dislocation network also occurred at the beginning of deformation. Compared with the system when dx = 40 Å, however, the number of dislocations emitted from crack2 was relatively small, and the interaction between crack2 and the γ/γ′ interface mismatched dislocation network was relatively weak. Because the motion and interaction of dislocations that emitted from crack1 played a major role in the deformation, most of the external plastic deformation work was used for crack1 growth along the Y-direction. Ultimately, the tensile strength and plasticity of the system were lower than those of the system when dx = 40 Å, and the crack growth rate was higher.
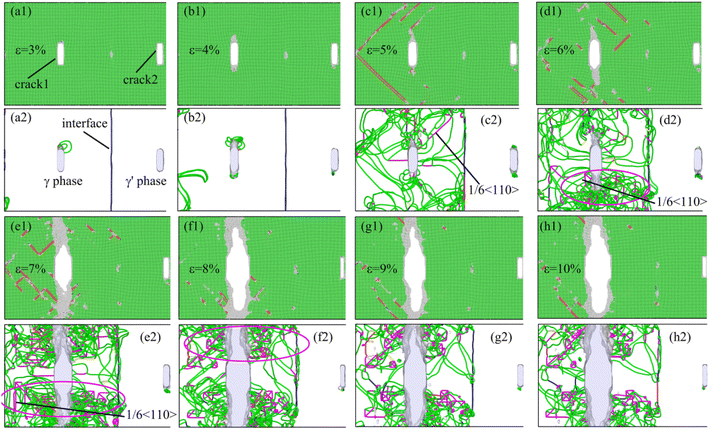
When the distance between two cracks in the system was dx = 240 Å (Fig. 7), the crack tip first emitted dislocations during the deformation. Because of the excellent plastic deformation ability of the γ phase, the number of emission dislocations for crack1 was large, whereas the number of emission dislocations for crack2 was small. When the strain was 5%, the dislocation emitted from crack1 interacted with the γ/γ′ interface mismatched dislocation network, which resulted in an obvious passivation zone formation at the tip of crack1. As the strain increased, the interaction between the dislocations at the crack1 tip and the γ/γ′ interface mismatched dislocation network was enhanced, and a large number of pinned dislocations formed near the crack tip (the magenta ellipse region shown in Fig. 7(e2) and (f2)). These pinned dislocations hindered the plastic deformation of the system and led to the crack1 brittle growth. Note, however, that crack2 did not have any interaction with crack1 and the γ/γ′ interface. Ultimately, the deformation work was almost entirely used for crack1 growth, which resulted in a high crack growth rate and minimized the tensile strength and plasticity of the system.
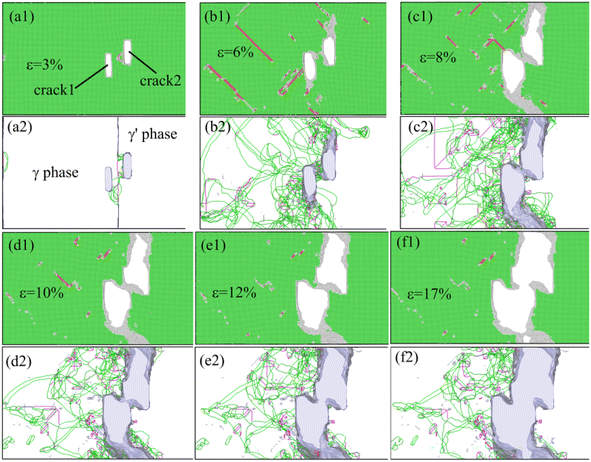
Fig. 8 shows the microstructure and dislocation evolution during the deformation of the system with two cracks distributed asymmetrically relative to the γ/γ′ interface and a distance of dy = 30 Å in the Y-direction. Compared with the deformation system when dy = 0 Å (Fig. 5), when the strain of the system was 6%, the dislocations emitted from the tip of the cracks interacted strongly with the γ/γ′ interface mismatched dislocation network, so that the interface dislocation network almost disappeared. At the same time, the dislocation entanglement zone formed at the region of the right-hand upper corner of crack1 and the left-hand lower corner of crack2 (Fig. 8(b2)), because of the interaction between crack1 and crack2. The dislocation interaction further led to the microstructure passivation of this zone, and then crack1 and crack2 merged to form a long crack (Fig. 8(c1)–(f1)). Hence, the tensile strength and plasticity of this system was weaker than the system when dy = 0 Å.
4.2 Dislocation analysis
Fig. 9 shows that the dislocation density versus strain of the deformation system with different distances, (a) and (b) is the variation curve for the total dislocation density and proportion of pinned dislocation, respectively. During deformation, the dislocation density of the system first rapidly increased to its maximum value, then gradually decreased, and finally remained almost unchanged. Based on this analysis, we found that the significantly growth process of dislocation density corresponded to stages (I) and (II) of crack growth (i.e., the crack growth incubation stage and rapid crack growth stage). The interaction between the dislocations that emitted from the crack tip and the γ/γ′ interface mismatched dislocation network was significant. After the crack growth entered stage (III) (crack growth stable stage), the dislocation density gradually decreased because of the formation of a fracture surface within the system caused by crack growth. The dislocations were annihilated after they moved to the fracture surface. We compared the dislocation density versus strain curves of these systems with different dx and found that as dx increased, the total dislocation density of the system decreased during deformation. When dx was very small, both cracks strongly interacted with the interface mismatched dislocation network, which caused a large number of dislocations to proliferate. The proportion of pinned dislocations in the proliferated dislocations was relatively small (see the red curve in Fig. 9(b)), which increased the plastic deformation ability and tensile strength of the system. The crack slowly propagated in a plastic manner. When the dx was large, only crack1 interacted with the interface mismatched dislocation network during the deformation, whereas crack2 hardly participated in any of the deformations, which inhibited the total dislocation density proliferation at a certain degree. The dislocation proliferation process produced a large number of immovable dislocations (accounting for about 25% of the total dislocations), which suppressed the deformation of the system. Thus, the crack propagated rapidly in a brittle manner, reducing the tensile strength and plasticity of the system.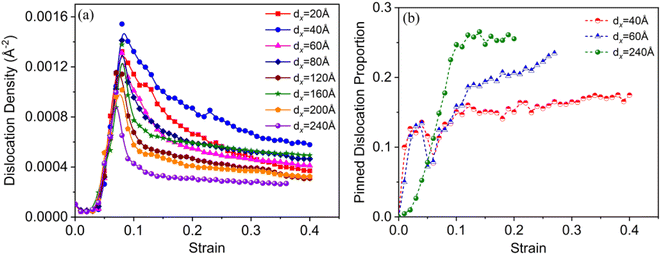 | ||
| Fig. 9 Dislocation density versus tensile strain of the model with various crack distances: (a) the total dislocation variation, and (b) the variation of pinned dislocation proportion. | ||
4.3 Mechanical mechanisms
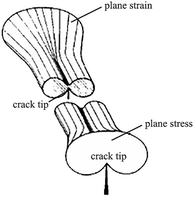
During the deformation of a metal system with cracks, a large or small plastic deformation zone (called the crack tip plastic zone) first appeared near the crack tip.49 The shape and size of the plastic zone of the crack tip was obtained from the boundary curve equation of the crack tip:49,50
 | (2) |
 | (3) |
 | (4) |
Based on the relevant theories of fracture mechanics mentioned earlier, we provided the distribution maps of plastic zones at the crack tips in different crack distribution systems (dx = 40 and 240 Å), as shown in Fig. 11(a1) and (b1), respectively. When two cracks were distributed symmetrically and the dx was very small (dx = 40 Å), at the beginning of the deformation, the plastic zone at the tips of crack1 and crack2 overlapped at the γ/γ′ interface (red and blue shaded areas in Fig. 11(a1)). The dislocations that emitted from the tips of crack1 and crack2 interacted strongly with the γ/γ′ interface mismatched dislocation network in the crack tip plastic zone, thereby passivating the area at the front of crack1 and crack2. In addition, the dislocations that emitted from the cracks slipped toward the γ/γ′ interface in the core region, which interacted with the γ/γ′ interface mismatched dislocation network and caused passivation in the area between crack1 and crack2 (the magenta elliptical area in Fig. 11(a1)). Because of the overlapping mechanism of the plastic zone at the crack tip, crack1 and crack2 merged to form a wide crack in the X-direction. The process of crack merging consumed a large amount of external deformation work, which ultimately resulted in the system having high tensile strength and good plasticity. The crack propagated slowly in a plastic manner, as shown in Fig. 11(a2) and (a3).
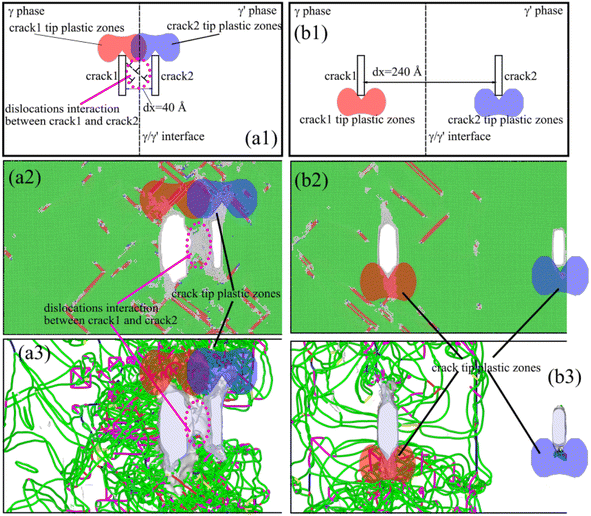 | ||
| Fig. 11 Differences in the deformation and crack growth mechanism in the system with different crack distributions: (a) dx = 40 Å, and (b) dx = 240 Å. | ||
For a system with two cracks distributed symmetrically and dx = 240 Å, because both cracks were far away from the γ/γ′ interface, there was no overlap between the plastic zones of two cracks during deformation. Only the dislocation that emitted from the crack1 tip interacted with the γ/γ′ interface mismatched dislocation network. A large number of pinned dislocations in the γ phase hindered the plastic deformation of the system. While crack2 hardly participated in the deformation behavior of the system, almost all of the applied deformation work was used for the crack1 growth, and the system had low tensile strength and plasticity.
5. Conclusion
In this study, we used the MD method to conduct a comprehensive analysis of the Ni/Ni3Al superalloy system, focusing on the impact of different crack distributions on deformation and crack growth behaviors. Our findings revealed that an increase in the distance between two cracks led to a significant decrease in the tensile strength and plasticity of the system. Concurrently, the crack growth rate within the system experienced a notable increase. According to the underlying mechanism, when the distance between two cracks was small, the plastic zones at their tips overlapped during deformation. This overlap resulted in strong crack interactions, which could be attributed to the interaction between dislocations that emitted from the crack tip or core with the γ/γ′ interface mismatched dislocation network. This interaction caused significant passivation in the front and middle regions of the crack tips, ultimately leading to the merging of the two cracks in the X-direction to form a wider crack. The emergence of two cracks consumed a considerable amount of external deformation work, resulting in the highest tensile strength and plasticity of the system.Our study offered a potential approach to simultaneously enhance the strength as well as plasticity of multidefect systems, such as those containing internal voids and cracks. Furthermore, we provided a theoretical framework for explaining the deformation and crack growth mechanisms of systems with multiple defects. For example, by understanding and manipulating crack distributions, it may be possible to design materials with superior mechanical properties that can withstand harsh environments and loading conditions.
Data availability
All relevant data are within the paper.Author contributions
Xinmao Qin: writing original manuscript, Wanjun Yan: computational method and analysis, Yilong Liang: review and editing manuscript, Fei Li: visualization.Conflicts of interest
The authors declare no conflict of interest.Acknowledgements
This work was finally funded by the Engineering Technology Research Center (No. [2019]5303), the Central Government Guides Local Science and Technology Development (No. [2019]4011) and the Project of the Education Department of Guizhou Province (No. [2021]315).References
- T. M. Pollock and S. Tin, Nickel-Based Superalloys for Advanced Turbine Engines: Chemistry, Microstructure and Properties, J. Propul. Power, 2006, 22(2), 361–374 CrossRef CAS.
- A. Chamanfar, L. Sarrat, M. Jahazi, M. Asadi, A. Weck and A. K. Koul, Microstructural characteristics of forged and heat treated Inconel-718 disks, Mater. Des., 2013, 52, 791–800 CrossRef CAS.
- D. McAllister, D. Lv, B. Peterson, H. Deutchman, Y. Wang and M. J. Mills, Lower temperature deformation mechanisms in a γ′′-strengthened Ni-base superalloy, Scr. Mater., 2016, 115, 108–112 CrossRef CAS.
- M. Karimi, T. Roarty and T. Kaplan, Molecular dynamics simulations of crack propagation in Ni with defects, Modell. Simul. Mater. Sci. Eng., 2006, 14(8), 1409–1420 CrossRef CAS.
- W.-P. Wu and Z.-Z. Yao, Molecular dynamics simulation of stress distribution and microstructure evolution ahead of a growing crack in single crystal nickel, Theor. Appl. Fract. Mech., 2012, 62, 67–75 CrossRef CAS.
- J. Zhang and S. Ghosh, Molecular dynamics based study and characterization of deformation mechanisms near a crack in a crystalline material, J. Mech. Phys. Solids, 2013, 61(8), 1670–1690 CrossRef CAS.
- P.-H. Sung and T.-C. Chen, Studies of crack growth and propagation of single-crystal nickel by molecular dynamics, Comput. Mater. Sci., 2015, 102, 151–158 CrossRef CAS.
- Y. Zhang, S. Jiang, X. Zhu and Y. Zhao, A molecular dynamics study of intercrystalline crack propagation in nano-nickel bicrystal films with (0 1 0) twist boundary, Eng. Fract. Mech., 2016, 168, 147–159 CrossRef.
- Y. Zhang and S. Jiang, Investigation on dislocation-based mechanisms of void growth and coalescence in single crystal and nanotwinned nickels by molecular dynamics simulation, Philos. Mag., 2017, 97(30), 2772–2794 CrossRef CAS.
- Y. Qi, W.-P. Wu, Y.-B. Chen and M.-X. Chen, Crystal orientation dependence of crack growth and stress evolution in single crystal nickel: a molecular dynamics simulation-based cohesive zone model, RSC Adv., 2018, 5(81), 65942–65948 RSC.
- X. Qin, Y. Liang, J. Gu and G. Peng, The Effect of Interatomic Potentials on the Nature of Nanohole Propagation in Single-Crystal Nickel: A Molecular Dynamics Simulation Study, Crystals, 2023, 13(4), 585 CrossRef CAS.
- G. P. Potirniche and M. F. Horstemeyer, On the growth of nanoscale fatigue cracks, Philos. Mag. Lett., 2006, 86(3), 185–193 CrossRef CAS.
- C. B. Cui and H. G. Beom, Molecular dynamics simulations of edge cracks in copper and aluminum single crystals, Mater. Sci. Eng., 2014, 609, 102–109 CrossRef CAS.
- S. Xu and X. Deng, Nanoscale void nucleation and growth and crack tip stress evolution ahead of a growing crack in a single crystal, Nanotechnology, 2008, 19(11), 115705 CrossRef PubMed.
- O. Nejadseyfi and A. Shokuhfar, Molecular Dynamics Simulation of the Effects of Crystal Orientation and Grain Boundary Misorientation Angle on the Nano-Crack Growth, J. Comput. Theor. Nanosci., 2014, 11(10), 2199–2207 CrossRef CAS.
- W. Fang, H. Xie, F. Yin, J. Li, D. F. Khan and Q. Fang, Molecular dynamics simulation of grain boundary geometry on crack propagation of bi-crystal aluminum, Mater. Sci. Eng., 2016, 666, 314–319 CrossRef CAS.
- X. R. Zhuo, J. H. Kim and H. G. Beom, Atomistic investigation of crack growth resistance in a single-crystal Al-nanoplate, J. Mater. Res., 2016, 31(9), 1185–1192 CrossRef CAS.
- X. F. Liu, J. B. Wang, L. G. Sun, Y. Y. Zhang, M. L. Tian and X. Q. He, Investigation on crack propagation in single crystal Ag with temperature dependence, J. Mater. Res., 2015, 30(22), 3553–3563 CrossRef CAS.
- P. A. Gordon, T. Neeraj, M. J. Luton and D. Farkas, Crack-Tip Deformation Mechanisms in α-Fe and Binary Fe Alloys: An Atomistic Study on Single Crystals, Metall. Mater. Trans. A, 2007, 38(13), 2191–2202 CrossRef.
- G. Sainath and B. K. Choudhary, Atomistic simulations on ductile-brittle transition in 〈111〉 BCC Fe nanowires, J. Appl. Phys., 2017, 122(9), 095101 CrossRef.
- S. K. Paul, S. Kumar and S. Tarafder, Orientation-dependent crack-tip blunting and crack propagation in a single crystal BCC iron, Bull. Mater. Sci., 2018, 41(6), 148 CrossRef.
- Z. Wang, X. Shi, X.-S. Yang, W. He, S.-Q. Shi and X. Ma, Atomistic simulation of martensitic transformations induced by deformation of α-Fe single crystal during the mode-I fracture, J. Mater. Sci., 2020, 56(3), 2275–2295 CrossRef.
- T. Tang, S. Kim and M. F. Horstemeyer, Molecular dynamics simulations of void growth and coalescence in single crystal magnesium, Acta Mater., 2010, 58(14), 4742–4759 CrossRef CAS.
- L. Chang, T. Kitamura and C.-Y. Zhou, Atomic simulation of the orientation effects on crack tip behavior in titanium single crystal, Theor. Appl. Fract. Mech., 2020, 110, 102791 CrossRef CAS.
- J. Li, L. Dong, X. Zang, X. Zhang, W. Zhao and F. Wang, Study on micro-crack propagation behavior of single-crystal α-Ti under shear stress based on molecular dynamics, Mater. Today Commun., 2020, 25, 101622 CrossRef CAS.
- K. Yashiro, M. Naito and Y. Tomita, Molecular dynamics simulation of dislocation nucleation and motion at γ/γ’ interface in Ni-based superalloy, Int. J. Mech. Sci., 2002, 44, 1845–1860 CrossRef.
- T. Zhu and C.-Y. Wang, Misfit dislocation networks in the γ/γ′phase interface of a Ni-based single-crystal superalloy: Molecular dynamics simulations, Phys. Rev. B: Condens. Matter Mater. Phys., 2005, 72(1), 014111 CrossRef.
- W.-P. Wu, Y.-F. Guo, Y.-S. Wang, R. Mueller and D. Gross, Molecular dynamics simulation of the structural evolution of misfit dislocation networks at γ/γ′ phase interfaces in Ni-based superalloys, Philos. Mag., 2011, 91(3), 357–372 CrossRef CAS.
- N.-L. Li, W.-P. Wu and K. Nie, Molecular dynamics study on the evolution of interfacial dislocation network and mechanical properties of Ni-based single crystal superalloys, Phys. Lett. A, 2018, 382(20), 1361–1367 CrossRef CAS.
- H. Yang, L. Zhu, R. Zhang, J. Zhou and Z. Sun, Influence of high stacking-fault energy on the dissociation mechanisms of misfit dislocations at semi-coherent interfaces, Int. J. Plast., 2020, 126, 102610 CrossRef.
- B. Li, C. Dong, J. Yu, Q. Zhang, H. Zhou and R. Liu, Mechanical behaviour and microstructural evolution of Ni-based single crystal alloys under shock loading, RSC Adv., 2018, 8(39), 22127–22135 RSC.
- B. Chen and W.-P. Wu, Molecular dynamics simulations of dynamics mechanical behavior and interfacial microstructure evolution of Ni-based single crystal superalloys under shock loading, J. Mater. Res. Technol., 2021, 15, 6786–6796 CrossRef CAS.
- C. Kohler, P. Kizler and S. Schmauder, Atomistic simulation of the pinning of edge dislocations in Ni by Ni3Al precipitates, Mater. Sci. Eng., 2005, 400–401, 481–484 CrossRef.
- C. Cui, X. Gong, L. Chen, W. Xu and L. Chen, Atomic-scale investigations on dislocation-precipitate interactions influenced by voids in Ni-based superalloys, Int. J. Mech. Sci., 2022, 216, 106945 CrossRef.
- Z.-G. Liu, C.-Y. Wang and T. Yu, Influence of Re on the propagation of a Ni/Ni3Al interface crack by molecular dynamics simulation, Modell. Simul. Mater. Sci. Eng., 2013, 21(4), 045009 CrossRef.
- L. Ma, S. Xiao, H. Deng and W. Hu, Tensile mechanical properties of Ni-based superalloy of nanophases using molecular dynamics simulation, Phys. Status Solidi B, 2016, 253(4), 726–732 CrossRef CAS.
- J. Yu, Q. Zhang, R. Liu, Z. Yue, M. Tang and X. Li, Molecular dynamics simulation of crack propagation behaviors at the Ni/Ni3Al grain boundary, RSC Adv., 2014, 4(62), 32749 RSC.
- L. Ben, Z. Shiming, F. A. Essa, D. Chao, Y. Jingui and Z. Qiaoxin, Crack Propagation and Microstructural Evolution of Ni-based Single Crystal Alloy Under Shear Loads, Rare Met. Mater. Eng., 2018, 47(5), 1370–1376 CrossRef.
- X. Qin, Y. Liang and J. Gu, Effects of Stress State, Crack—γ/γ′ Phase Interface Relative Locations and Orientations on the Deformation and Crack Propagation Behaviors of the Ni-Based Superalloy—A Molecular Dynamics Study, Crystals, 2023, 13(10), 1446 CrossRef CAS.
- A. P. Thompson, H. M. Aktulga, R. Berger, D. S. Bolintineanu, W. M. Brown, P. S. Crozier, P. J. in 't Veld, A. Kohlmeyer, S. G. Moore, T. D. Nguyen, R. Shan, M. J. Stevens, J. Tranchida, C. Trott and S. J. Plimpton, LAMMPS - a flexible simulation tool for particle-based materials modeling at the atomic, meso, and continuum scales, Comput. Phys. Commun., 2022, 271, 108171 CrossRef CAS.
- L. Ma, S. Xiao, H. Deng and W. Hu, Atomic simulation of fatigue crack propagation in Ni3Al, Appl. Phys. A, 2014, 118(4), 1399–1406 CrossRef.
- Y. Zhang, S. Jiang, X. Zhu and Y. Zhao, Mechanisms of crack propagation in nanoscale single crystal, bicrystal and tricrystal nickels based on molecular dynamics simulation, Results Phys., 2017, 7, 1722–1733 CrossRef.
- G. P. Purja Pun and Y. Mishin, Development of an interatomic potential for the Ni-Al system, Philos. Mag., 2009, 89(34–36), 3245–3267 CrossRef CAS.
- B. Chen, W.-P. Wu and M.-X. Chen, Orientation-Dependent Morphology and Evolution of Interfacial Dislocation Networks in Ni-Based Single-Crystal Superalloys: A Molecular Dynamics Simulation, Acta Mech. Solida Sin., 2020, 34(1), 79–90 CrossRef.
- J. D. Honeycutt and H. C. Andersen, Molecular dynamics study of melting and freezing of small Lennard-Jones clusters, J. Phys. Chem., 1987, 91(19), 4950–4963 CrossRef CAS.
- D. Faken and H. Jónsson, Systematic analysis of local atomic structure combined with 3D computer graphics, Comput. Mater. Sci., 1994, 2(2), 279–286 CrossRef CAS.
- A. Stukowski, Visualization and analysis of atomistic simulation data with OVITO–the Open Visualization Tool, Modell. Simul. Mater. Sci. Eng., 2010, 18(1), 015012 CrossRef.
- A. Stukowski, V. V. Bulatov and A. Arsenlis, Automated identification and indexing of dislocations in crystal interfaces, Modell. Simul. Mater. Sci. Eng., 2012, 20(8), 085007 CrossRef.
- P. Lopez-Crespo, D. Camas, F. V. Antunes and J. R. Yates, A study of the evolution of crack tip plasticity along a crack front, Theor. Appl. Fract. Mech., 2018, 98, 59–66 CrossRef CAS.
- J. M. Vasco-Olmo, M. N. James, C. J. Christopher, E. A. Patterson and F. A. Díaz, Assessment of crack tip plastic zone size and shape and its influence on crack tip shielding, Fatigue Fract. Eng. Mater. Struct., 2016, 39(8), 969–981 CrossRef.
| This journal is © The Royal Society of Chemistry 2024 |

