DOI:
10.1039/D4RA02757D
(Paper)
RSC Adv., 2024,
14, 19795-19805
Preparation of HMn2O4 lithium-ion sieves with low manganese dissolution loss for improved cycling stability
Received
13th April 2024
, Accepted 15th May 2024
First published on 19th June 2024
Abstract
Manganese-based lithium-ion sieves have become some of the promising adsorbents for extracting Li+ from brines. However, manganese dissolution loss (MDL) severely impairs the stability and cyclicity of ion sieves. A novel ozone eluent was first developed to extract Li+ from lithium manganese oxides, which decreased MDL decreased from 5.89% to 0.11%, and after ten regeneration cycles, the adsorption capacity retained 85.39% of the initial value, which was better than 55.15% when only hydrochloric acid (HCl) was used as the eluent. Based on these phenomena, the mechanism for the O3 lowering of MDL was investigated. First, the catalytic decomposition reaction of O3 competed with the disproportionation reaction, and the involvement of O3 inhibited the occurrence of the disproportionation reaction. Additionally, the presence of O3 and reactive oxygen species provided a preferential electron acceptor compared to Mn3+ during the migration of electrons from the bulk phase to the surface. In this study, MDL was greatly reduced with a very simple strategy, and the cycling stability of the adsorbent was improved.
1 Introduction
Owing to the strong competition in the new energy field1,2 and bright prospects in the nuclear energy field,3 the demand for lithium is high and continues to grow.4 Although it is currently mainly extracted from ores, the rapid depletion of nonrenewable ores calls for an urgent need to draw on seawater and salt lake brine resources, which account for around 60% of the global reserves. Over the past few decades, plenty of approaches have been proposed for the extraction of lithium from salt lake brines, such as evaporative precipitation,5 solvent extraction,6,7 electrochemistry,8,9 membrane process10–13 and adsorption.14,15 Among these choices, lithium-ion sieves have emerged as promising adsorbents for lithium recovery, especially for salt lake brines with low-grade and high Mg2+/Li+ ratio, owing to the exceptional lithium selectivity and large uptake capacity.16
Among the inorganic metal-based adsorbents for lithium extraction, Al-based adsorbents have been utilized industrially but are generally unsatisfactory owing to their low adsorbing capacities (2–8 mg g−1).17,18 Ti-based and Mn-based adsorbents exhibit competitive working capacities (20–40 mg g−1).19 In comparison, Mn-based adsorbents are more cost-effective. Hence, a series of spinel-type lithium manganese oxides, including LiMn2O4,20 Li4Mn5O12 (ref. 21) and Li1.6Mn1.6O4,22 were extensively studied. Notwithstanding this, the applications were hindered owing to the non-negligible manganese dissolution loss (MDL), and tremendous efforts were directed toward improvements. Doping with cations (Fe, Co, Ni and Mg) was attempted to reduce the disproportionation of Mn3+.23–25 The loss thus decreased to as low as approximately 0.51%, which is encouraging for further developments. Surface coating with oxides,26,27 fluorides28 and carbonaceous materials29 have also been explored. The coating impeded Mn loss, but the adsorption capacity also decreased simultaneously from 28.88 mg g−1 to 25.96 mg g−1 because of the large interfacial impedance.30
Similarly, persulfates such as K2S2O8, Na2S2O8 and (NH4)2S2O8 were separately investigated previously as eluents for the desorption of Li+. MLD decreased from approximately 13% to 0.2%.31 However, for K2S2O8 and Na2S2O8 eluents, the concentration of H+ produced by the hydrolysis reaction was low at a temperature of less than 60 °C; therefore, H+ and Li+ cannot be exchanged adequately. Thus, the elution rate of Li+ was less than 10%. Due to the dual hydrolysis characteristic of (NH4)2S2O8, the elution rate of Li+ in (NH4)2S2O8 can reach 80% at 20 °C. However, the MDL is higher than 25%. The MDL decreased significantly (below 0.5%) when the temperature was increased to 60 °C. This was due to the fact that the SO4˙− generated by the activation of S2O82− by heat during electron migration from the interior of particles to the surface32 replaces Mn3+ as the electron acceptor, and thus inhibits the reaction Mn3+ → Mn2+.33 The above eluents are only effective at high temperatures, and the cost of the above treatment is too high to be employed industrially. The approaches may also bring huge environmental problems, against which a breakthrough is urgently needed.
It is supposed that the lithium manganese oxides are treated with a certain oxidizing eluent, which is pollution-free, effective and cheap to restrain MDL. O3, featured with excellent oxidizing ability, is expected herein as a better electron acceptor to restrain manganese reduction. Unlike persulfate, ozone also has a strong oxidizing ability at room temperature, and does not require high-temperature activation. In contrast to hydrogen peroxide, a commonly used oxidant, the preliminary investigations verified that ozone does not damage the lithium manganese oxide structure.
In the present work, the regeneration of lithium manganese oxides with the ozone eluent was first developed. The ozone eluent, consisting of 0.05 mol L−1 HCl combined with O3, not only provided a large amount of H+ to ensure that Li+ and H+ can be fully exchanged, but also limited MDL. The structure of the precursor and the manganese lithium-ion sieve with different elution agents were studied comprehensively by various techniques. The mechanisms of action of ozone were further evaluated to promote a new competitive approach for controlling the MDL.
2 Materials and methods
2.1 Materials and reagents
Lithium hydroxide monohydrate (LiOH H2O, 99.0%), manganese acetate tetrahydrate (MnC4H6O4·4H2O, 99.0%), magnesium chloride (MgCl2, 99.0%), potassium iodide (KI, 99.0%), potassium bromide (KBr, 99.0%), and potassium bromate (KBrO3, 99.8%) were all purchased from the Shanghai Aladdin Biochemical Technology Co., Ltd. Sodium chloride (NaCl, 97.0%), potassium chloride (KCl, 97%), calcium chloride (CaCl2, 97%), sodium thiosulfate (Na2S2O3, 90%), potassium dichromate (K2Cr2O7, 99.98%) sodium bicarbonate (NaHCO3, 98%), amylum ((C6H10O5)n, 90.0%), and indigo carmine (C16H8N2Na2O8S2, 90.0%) were all purchased from the Sinopharm Chemical Reagent Co., Ltd. Phosphoric acid (H3PO4, 85%), hydrochloric acid (HCl, 36.0%), and high-purity oxygen (O2, 99.999%) were purchased from the Nanjing Special Gas Company Co., Ltd. All reagents were directly used without any further purification or treatment.
2.2 Synthesis of the LiMn2O4 precursor and preparation of the HMn2O4 ion sieves
The precursor LiMn2O4 (LMO) was synthesized according to the solid-state synthesis method.23 MnCO3, LiNO3, and LiOH H2O were added to the 95% ethanol solution in a molar ratio of 2![[thin space (1/6-em)]](https://www.rsc.org/images/entities/char_2009.gif) :
:![[thin space (1/6-em)]](https://www.rsc.org/images/entities/char_2009.gif) 0.63
0.63![[thin space (1/6-em)]](https://www.rsc.org/images/entities/char_2009.gif) :
:![[thin space (1/6-em)]](https://www.rsc.org/images/entities/char_2009.gif) 0.39. The mixture was magnetically stirred at 500 rpm for 2 h at 25 °C to form a uniform solution. After being dried at 80 °C, the mixture was ground. The obtained powder was then placed on the corundum ceramic sheet, and calcined in the muffle furnace under the atmosphere of flowing air to gain LMO. During the calcination, the powder was first rapidly heated to 200 °C and held for 2 h, then calcined at 600 °C for 10 h.
0.39. The mixture was magnetically stirred at 500 rpm for 2 h at 25 °C to form a uniform solution. After being dried at 80 °C, the mixture was ground. The obtained powder was then placed on the corundum ceramic sheet, and calcined in the muffle furnace under the atmosphere of flowing air to gain LMO. During the calcination, the powder was first rapidly heated to 200 °C and held for 2 h, then calcined at 600 °C for 10 h.
LMO (0.15 g) was then dispersed in 150 mL of 0.05 mol L−1 HCl solution, where the specifically rated O3 was continuously fed in. The mixture was continuously stirred at 25 °C for 2 h. The solid was obtained through filtration and further washed three times with 200 mL deionized water, and then dried at 80 °C. The products obtained were denoted as O3-HMO. For comparison, the product thus obtained without O3 participation was labeled as HMO.
2.3 Characterization
The crystal structure was analyzed via an X-ray diffractometer (XRD, Rigaku Miniflex 600, Japan) with Cu Kα radiation at 40 kV, 15 mA, a scanning rate of 10° min−1, and the diffraction angle from 10° to 80°. Fourier transform infrared spectroscopy (FT-IR, Thermo Nicolet8700, USA) was used to analyze the chemical bonds and structure of materials. The surface morphology and microstructure were characterized using the scanning electron microscope (SEM, Hitachi S4800, Japan) and the transmission electron microscope (TEM, JEOL JEM-2100 Plus, Japan). The elemental composition in eluted and digested samples was measured using the inductively coupled plasma optical emission spectrometer (ICP-OES, PerkinElmer Optima 3000DV, USA). X-ray photoelectron spectroscopy (XPS, Kratos AXIS Supra, Japan) was carried out to analyze the chemical composition and valence state. The specific surface area, pore size and pore volume were analyzed using the Brunauer–Emmett–Teller method (BET, Micromeritics ASAP2460, USA). Nitrogen adsorption/desorption isotherms were measured in a relative pressure range (p/p0) between 0 and 1.0 to clarify the adsorption properties. The indigo method was used to determine the concentration of O3 in solution.
2.4 Characterization of the adsorption behavior
2.4.1 Adsorption property. The adsorption property of HMO and O3-HMO was evaluated respectively through the Li+ adsorption test. The lithium-ion sieve (0.1 g) was soaked in 100 mL of the LiOH solution buffered with NaHCO3 (pH = 11.5, CLi+ = 100 mg L−1). The mixture was stirred at 25 °C (298 K) for 24 h to ensure equilibrium. The adsorption capacity was determined according to eqn (1):where qe refers to the adsorption capacity at equilibrium (mg g−1); C0 and Ce are the initial and equilibrium concentrations of Li+ (mg L−1), respectively; V is the volume of solution (L); and m is the mass of the adsorbent applied (g).LMO (0.1 g) was dissolved in the digestion solution constituted by ten drops of 30% H2O2 and 20 mL of 2 mol L−1 HCl solution. Then, the digestion solution was diluted for the mass fractions test of Li+ and Mn2+, as shown in eqn (2):
where
Wx is the mass fractions;
CD represents the mass concentration of the Li
+ or Mn
2+ (mg L
−1);
VD is the volume of digestion (L); and
mD is the mass of the LMO applied (g).
2.4.2 Desorption experiment. In the lithium desorption experiment, LMO was eluted using O3 aerating 0.05 mol L−1 HCl solution in a self-made tubular reactor. The reactor was equipped with a quartz sand core plate at the bottom, and O3 was generated by an O3 generator (Tonglin 3S-T15). Samples were collected at various time intervals, and a comparative analysis of MDL and the Li+ extraction rate under different O3 concentrations was investigated according to batch experiments. The equation for these calculations is shown as eqn (3):| |
 | (3) |
where Rx is the mass ratio of leaching x element (Mn2+ or Li+) to total x element of LMO (%); Cx is the mass concentration of x in the eluent (mg L−1); V is the volume of the eluent (L); and m is the mass of the LMO (g).The amount of dissolved O3 was determined using the indigo method. After the addition of LMO, the eluent composed of hydrochloric acid-ozone (HCl-O3) was sampled at different time points, and added to a 25 mL volumetric flask containing 1 mL of standard indigo solution and 5 mL of NaH2PO4·H3PO4 buffer (pH = 2). The eluent was added until the blue color had clearly decolorized and then diluted to 25 mL, recording the volume of deionized water used. Samplers, along with one blank without O3, were collected for absorbance measurement. The O3 concentration of the eluent can be described as follows in eqn (4):
| |
 | (4) |
where
CO3 is the concentration of dissolved O
3 in the HCl-O
3 eluent (g mL
−1); 25 is the volume of the volumetric flask (mL);
MO3 is the molar mass of O
3 (g mol
−1); Δ
A is difference absorbance between sample and blank (L mol
−1 cm
−1);
b is the thickness of the cuvette (cm); and
V is the volume of the eluent (mL).
2.4.3 Adsorption selectivity. To test the selectivity of the prepared adsorbent towards Li+, a concentrated artificial brine system was utilized, as shown in Table 1. In the competitive adsorption process, 0.15 g of adsorbent was dispersed in 150 mL of the concentrated artificial brine with a pH of 10.5. The mixture was subjected to magnetic stirring for 24 hours to reach adsorption equilibrium. Following this, the saturated adsorbed O3-HMO was filtered, washed, and dried. Then, the saturated adsorbed O3-HMO and O3-HMO were each separately dissolved in H2O2-HCl digestion solution. The resulting solutions were then diluted for elemental analysis. To evaluate the selectivity performance, the distribution coefficient (Kd) and separation factor (αLiM) were calculated according to eqn (5) and (6), respectively:| |
 | (5) |
| |
 | (6) |
where Kd is the distribution coefficient of metal ions in solution (mL g−1); αLiM is the separation factor; C0 and Ce represent the mass concentrations of HMO digestion solution and adsorbed saturated HMO digestion solution (mg L−1), respectively; V denotes the volume of the adsorption solution (L); and m signifies the mass of adsorption-saturated HMO (g).
Table 1 Composition of the artificial brine used in this work
| Cation |
Li+ |
Na+ |
K+ |
Mg2+ |
Ca2+ |
| Concentration |
682 |
27![[thin space (1/6-em)]](https://www.rsc.org/images/entities/char_2009.gif) 855 855 |
9239 |
71![[thin space (1/6-em)]](https://www.rsc.org/images/entities/char_2009.gif) 013 013 |
879 |
2.5 Cyclic performance
As illustrated in Fig. 1, the adsorption-saturated O3-HMO was eluted using O3-aerating 0.05 mol L−1 HCl solution for regeneration. The regenerated O3-HMO was used in the subsequent adsorption step. Continuous, repetitive adsorption–desorption experiments were conducted to evaluate the cyclic performance.
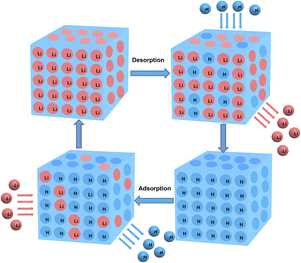 |
| | Fig. 1 Schematic diagram of the cyclic application of ion sieves. | |
3 Results and discussion
3.1 Characterization of LMO, HMO and O3-HMO
The XRD patterns of LMO, HMO and O3-HMO are illustrated in Fig. 2a The characteristic peaks of LMO match well with JCPDS 35-0782, which corresponds to the spinel-structured LiMn2O4. Both HMO and O3-HMO retained the spinel structure after desorption, indicating that the addition of O3 aeration did not affect the crystalline nature. In addition, since the ionic radius of H+ is smaller than Li+, all of the peaks shifted to a higher degree after elution. Moreover, the intensity of the (111) peak, which correlates positively with the amount of crystalline lithium,34 was weaker after elution. This result verifies that the ion exchange reaction between H+ and Li+ occupying the tetrahedral (8a) sites proceeds topotactically.
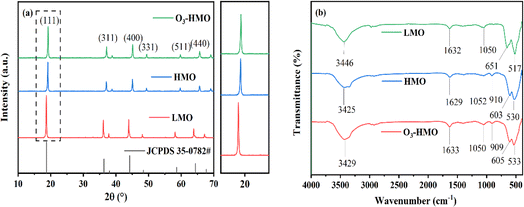 |
| | Fig. 2 The powder XRD patterns of (a) LMO, HMO and O3-HMO; (b) FT-IR spectra of LMO, HMO and O3-HMO. | |
The FT-IR spectra of LMO HMO and O3-HMO are shown in Fig. 2b. The absorption bands occurring at 3446 cm−1 and 1632 cm−1 in LMO correspond to the stretching and bending vibrations of –OH, respectively, which also occur in HMO and O3-HMO at similar positions. Compared to LMO, a new peak appeared at 910 cm−1 for HMO and 909 cm−1 for O3-HMO, which is attributed to the asymmetric conjugate vibration of H+. This further confirmed the occurrence of the ion exchange reaction between H+ and Li+, and is consistent with the results of the XRD diffraction spectra. After elution, the absorption bands in the 400–700 cm−1 range caused by the asymmetric stretching vibrations of the Mn(III)–O bond and Mn(IV)–O bond in the manganese-oxygen octahedra were shifted due to the disproportionation of Mn3+. However, the shift of the peaks was not significant, indicating that the skeletal structure of the [MnO6] octahedron is still stable after acid treatment.33
The crystal structures and morphologies of LMO, HMO and O3-HMO collected by SEM and TEM characterization are shown in Fig. 3. No marked differences were observed between the morphologies of LMO, HMO and O3-HMO (Fig. 3a–c), indicating that the acid treatment did not destroy the spinel structure of LMO, but weakened the agglomeration of ion sieves for better dispersion. All three samples exhibited clumped structures with sharp-edged grains, suggesting that the O3-aerated delithiation process had little impact on the structure. As shown in Fig. 3d–f, 0.478 nm, 0.476 nm and 0.475 nm are associated with the interplanar crystal spacing of the (311) planes in LMO, HMO and O3-HMO, respectively. The regular and conspicuous lattice fringes manifest that HMO and O3-HMO possess good crystallinity, which is consistent with the XRD results.
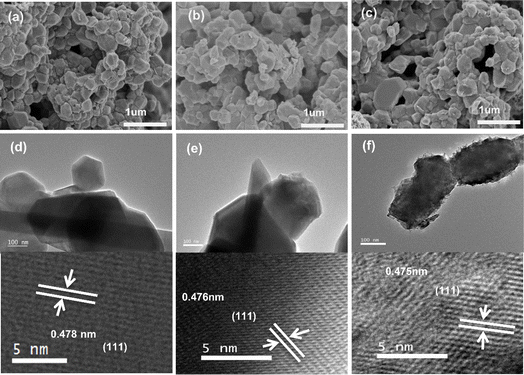 |
| | Fig. 3 SEM images of (a) LMO, (b) HMO and (c) O3-HMO; TEM images of (d) LMO, (e) HMO, and (f) O3-HMO. | |
Fig. 4 depicts the nitrogen adsorption–desorption isotherm curve and pore size distribution curve of the precursor (Fig. 4a) and ion sieves (Fig. 4b–c). The adsorption–desorption isotherm curve of the precursor and ion sieves belong to the type III and type II isotherms classified by IUPAC, respectively. Since there is a significant reduction of the 30–60 nm pores caused by the agglomeration phenomenon, the pore size after elution was mainly below 10 nm, which coincides with the results of the SEM analysis. This is the main reason for the reduction in the average pore size. Furthermore, this decrease resulted from the lattice contraction, which is consistent with the fact that all of the XRD peaks were shifted to a higher degree. The surface area, average pore diameter and pore volume of LMO, HMO and O3-HMO were analyzed and are summarized in Table 2. It can be observed that the BET surface area and pore volume of HMO and O3-HMO are all larger than LMO. The increase in the pore volume is due to Li+ being discharged from the three-dimensional channels of the spinel structure, and this is also the reason for the increase in the specific surface area of the ion sieve. In addition, the agglomeration of the sample is weakened and the dispersion is better after elution. Thus, HMO and O3-HMO have a larger specific surface area compared to LMO, which is consistent with the SEM results.
 |
| | Fig. 4 Nitrogen adsorption–desorption isotherms and pore volume distribution insets: (a) LMO, (b) HMO and (c) O3-HMO. | |
Table 2 Pore structure parameters of LMO, HMO and O3-HMO
| Samples |
BET surface area (m2 g−1) |
Average pore diameter (nm) |
Pore volume (cm3 g−1) |
| LMO |
10.220 |
22.899 |
0.0585 |
| HMO |
40.628 |
8.430 |
0.0856 |
| O3-HMO |
48.101 |
7.371 |
0.0886 |
The XPS spectra of LMO, HMO and O3-HMO were recorded to ascertain the surface chemical states and content changes of Mn O and Li before and after delithiation. Fig. 5a and b show the Li 1 s spectra and O 1s spectra of LMO, HMO and O3-HMO, respectively. The characteristic peaks of Li 1s that appeared in LMO were not detected in HMO and O3-HMO. As depicted in Fig. 5b, the intensity of [MnO6] decreases compared to the peaks before the ion exchange reaction, while the peak of –OH is enhanced and shifted by 0.2–0.3 eV. These observations indicate that the Li+/H+ exchange delithiation process was completed, and H+ existed on the surface in the form of –OH groups.35 The Mn 2p3/2 results are presented in Fig. 5c. The peaks at 642.7 eV and 641.3 eV, assigned to Mn(IV) and Mn(III), respectively, were found in all three samples. Slight shifts were observed in the delithiated samples. This suggests that the structural transformation of Li–Mn–O to H–Mn–O alters the chemical environment of Mn. An increase in the proportion of surface Mn(IV) and the corresponding decline in surface Mn(III) were observed in the fitting curve of HMO. This result followed the disproportionation reaction of Mn(III). In the fitting curve of O3-HMO, the proportion of Mn(III) also decreased compared to LMO. Whereas only a tiny portion of Mn(II) was detected after elution with 0.05 mol L−1 HCl solution containing O3 dosages, this finding indicates that there are other reasons for the decrease in the Mn(III) content.
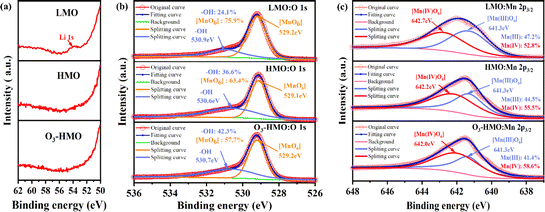 |
| | Fig. 5 The XPS fitted splitting for LMO, HMO and O3-HMO: (a) Li 1s, (b) O 1s, (c) Mn 2p3/2. | |
3.2 Desorption performance of LMO with a new type of eluent
3.2.1 Effect of eluents with different O3 concentrations on MDL. The relationship between the MDL of LMO and different O3 concentrations during the delithiation process is depicted in Fig. 6. The results from the desorption experiments reveal that MDL exhibited a rapid upward trend, reaching 5% and then gradually increasing until the end (5.89%) with no O3 aeration. However, when the O3 concentration was controlled within the range of 1.67–5.00 g mg L−1, the MDL remained below 0.4%. Notably, when the concentration of O3 was 2.50 mg L−1, the MDL was the lowest, measuring less than 0.12%. Conversely, the MDL with an O3 concentration of 5.83 mg L−1 was unsatisfactory, showing an accelerated rising trend along with the delithiation process. An interesting observation was the pink coloration of the eluent during this process. Further analysis via UV-Vis spectroscopy of the filtered eluent confirmed the presence of an adsorption band at 460–580 nm with a maximum adsorption at 525 nm, corresponding to the permanganate ion. The generation of permanganate ions was further identified through literature investigation, which indicated that many elements, including manganese, can be oxidized to their highest oxidation state. Therefore, we concluded that a lower O3 concentration of 1.67–5 mg L−1 significantly reduces MDL, and a high O3 concentration can lead to the formation of soluble permanganate ions, but can still reduce MDL.
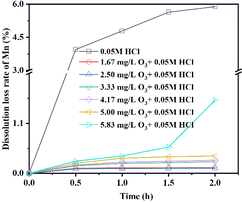 |
| | Fig. 6 The MDL of LMO under 0.05 mol L−1 HCl + R mg L−1 O3 (R = 0, 1.67, 2.50, 3.33, 4.17, 5.00, and 5.83). | |
Table 3 summarizes the final lithium extraction and MDL of LMO obtained with different O3 concentrations. As discussed, the variation of the O3 concentration had a significant effect on inhibiting MDL. The comparison of the adsorption properties and MDL using eluents consisting of HCl and O3 with other modification methods is shown in Table 4. Based on the table, it can be seen that LMO retains low MDL and excellent adsorption capacity by using the eluent consisting of HCl and O3.
Table 3 The adsorption and MDL performance of products after using the eluent with different O3 fluxes
| O3 concentration (mg L−1) |
Manganese dissolution rate (%) |
Lithium extraction rate (%) |
| 0 |
5.89 |
98.2 |
| 1.67 |
0.126 |
97.9 |
| 2.50 |
0.113 |
99.2 |
| 3.33 |
0.257 |
99.7 |
| 4.17 |
0.289 |
99.1 |
| 5.00 |
0.383 |
98.9 |
| 5.83 |
1.61 |
98.3 |
Table 4 The comparison of the MDL using the eluent in this work with other modification methods
| Adsorbent |
Modified mode |
CLi (mg L−1) |
Eluted temperature (°C) |
Eluent |
qe (mg g−1) |
Mn (%) |
Ref. |
| LiMn2O4 |
SiO2 coating |
100 |
— |
HCl |
33.9 |
3.9% |
36 |
| Li1.6Mn1.6O4 |
Surface fluorination |
350 |
25 |
HCl |
31.86 |
1.58% |
37 |
| Li1.6Mn1.6O4 |
Zirconium coating |
150 |
25 |
HCl |
25.96 |
0.349% |
30 |
| Li1.6Mn1.6O4 |
Mg doping |
600 |
— |
HCl |
45.8 |
4.32% |
38 |
| LiMn2O4 |
Fe doping |
50 |
25 |
HCl |
34.8 |
0.51% |
23 |
| Li1.6Mn1.6O4 |
Al and S co-doping |
42 |
25 |
HCl |
33.7 |
3% |
39 |
| LiMn2O4 |
— |
347 |
80 |
Na2S2O8 |
25.72 |
0.18% |
31 |
| LiMn2O4 |
— |
174 |
80 |
Na2S2O8 |
— |
0.5% |
34 |
| LiMn2O4 |
— |
100 |
25 |
HCl + O3 |
33.2 |
0.11% |
This work |
3.2.2 The mode of action of O3. In order to systematically verify the key role of O3 in reducing MDL, under the condition of the O3 concentration being set to 2.50 mg L−1, the change in dissolved O3 concentration after adding LMO powder was explored by the indigo method. As depicted in Fig. 7, there was a sudden decrease in the dissolved O3 concentration when the LMO powder was introduced into the O3-saturated eluent, and then it finally approached zero. Meanwhile, the MDL initially increased and then stabilized at 0.15% throughout the desorption process. The above results indicate that O3 reduces MDL significantly.
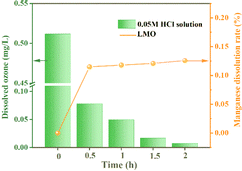 |
| | Fig. 7 Dissolved O3 concentration and MDL after adding LMO. | |
3.3 Mechanism exploration
Based on the finding that the addition of O3 significantly reduced the MDL, the following explanations were provided. The sharp decrease in the concentration of dissolved O3, as depicted in Fig. 7, discloses that the addition of the LMO led to the decomposition of O3, and the crystal structure of the LMO remained unchanged after extraction. This process is closely similar to the catalytic decomposition reaction of O3 on the surface of transition metal oxides. Transition metal oxides with multiple oxidation states, such as manganese, iron, copper, cobalt, nickel, etc., especially manganese oxides, exhibit good catalytic properties for O3 decomposition.40 Ma et al.41 found that the electron conduction between coexisting Mn(IV) and Mn(III) oxygen vacancies in the M-OMS-2 catalyst is crucial for the catalytic decomposition of O3. According to their findings, the decomposition reaction of O3 on the surface of LMO proceeded according to the following formulas:42| | |
O3 + [Mn(III)] → O2 + O−ads [Mn(IV)]
| (7) |
| | |
O3 + O−ads [Mn(IV)] → 2O2 + [Mn(III)]
| (8) |
The proportion of Mn(III) on the surface of synthesized LMO was as high as 47.2%, indicating an abundance of surface oxygen vacancies. This high proportion led to a significant catalytic degradation effect on O3. The adsorption of O3 on the Mn(III) oxygen vacancies on the LMO surface occurred rapidly, and decomposed to oxygen and active oxygen species O−ads [Mn(IV)]. Then, O3 reacted with active oxygen species O−ads [Mn(IV)] to generate oxygen and Mn(III).43 At the same time, Mn(III) inside the spinel structure was forced to release an electron to become Mn(IV) due to the exchange of H+ and Li+. The electron freely migrated to the crystal surface and was captured by the surface Mn to dissolve as Mn(II).32,44 Thus, on the surface, the conversion of Mn(III) → O−ads [Mn(IV)] → Mn(III) and the disproportionation reaction 2Mn(III) →Mn(II) competed with each other.
According to formulas (7) and (8), the ratio of Mn(III) in O3-HMO should be the same as in LMO. However, the peak splitting results of Mn 2p3/2 indicate that the ratio of Mn(III) in O3-HMO (Mn(III): 41.4%) greatly decreases compared to LMO(Mn(III): 47.2%). This observation suggests that other reactions besides formulas (7) and (8) also take place. The catalytic reaction mentioned above illustrates that the content of Mn(III) is closely related to the density of oxygen vacancies. Therefore, the decrease in Mn(III) content also implies a decrease in oxygen vacancies after the reaction, which aligns with the XPS results. Hence, we hypothesize that during the reaction, a portion of the formed oxygen vacancies adsorb oxygen without further reacting with O3 to generate oxygen, but instead convert into lattice oxygen. The proposed reaction mechanism is as follows:
| | |
O−ads [Mn(IV)] + [Mn(III)] → O2−ads [Mn(IV)] + [Mn(IV)]
| (9) |
| | |
O2−ads [Mn(IV)] → O2−latt + [Mn(IV)]
| (10) |
In addition to the aforementioned speculations, the delithiation process is accompanied by electron transfer. When electrons migrate from the interior of the particle to the surface, Mn(
III) accepts the electrons and triggers a disproportionation reaction that results in the MDL. The emergence of O
3 and reactive oxygen species O
−ads provides a preferential option as electron acceptors. We hypothesize that the following reactions occur:
| | |
O3− + [Mn(III)] → O−ads [Mn(III)] + O2
| (12) |
| | |
O−ads [Mn(III)] + 2H+ → [Mn(IV)] + H2O
| (13) |
| | |
O−ads [Mn(III)] + e− → O2−ads [Mn(III)]
| (14) |
| | |
O2−ads [Mn(III)] + 2H+ → [Mn(III)] + H2O
| (15) |
The overall role of O3 in the desorption process can be summarized as follows: during the ion exchange process, O3 undergoes catalytic decomposition and replaces the surface Mn as the electron group on the LMO surface, which is simultaneously accompanied by partial oxidation of Mn(III) to Mn(IV). The mechanism is shown in Fig. 8.
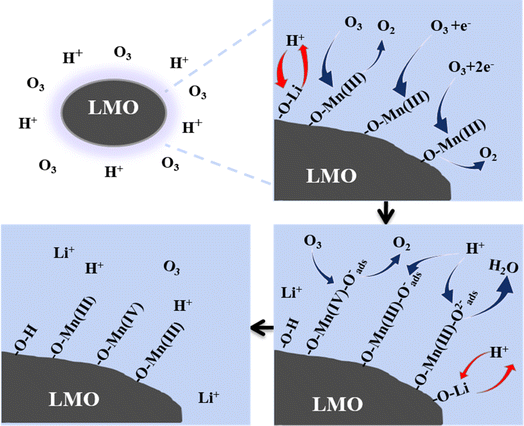 |
| | Fig. 8 Mechanism of the Li+ extraction process using the HCl-O3 eluent. | |
3.4 Static adsorption behavior of lithium-ion sieves
The pH of the solution has a vital influence on the adsorption properties. As shown in Fig. 9a, the adsorption capacity of O3-HMO at different initial pH solutions was investigated. The adsorption capacity of O3-HMO gradually increased with increasing alkalinity. The enhancement of alkalinity was accompanied by the increase of OH− concentration, which was conducive to neutralizing the released H+, and further facilitated ion exchange between Li+/H+. Another crucial reason was that the adsorbent surface possessed more negative charges at a high pH.45 Therefore, the electrostatic attraction between Li+ and the surface of the adsorbent increased with initial pH, which resulted in a greater adsorption affinity for Li+ and could further enhance the adsorption capacity. The temperature of the solution also has a vital influence on the adsorption properties. As shown in Fig. 9b, the adsorption capacity of O3-HMO was investigated at different initial temperature solutions. The increase of solution temperature would enhance the adsorption capacity, indicating that the adsorption process is an endothermic reaction.
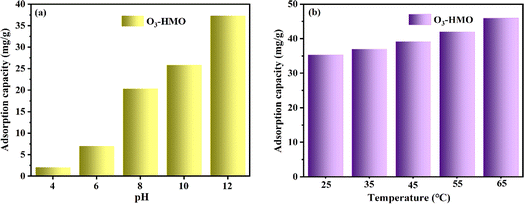 |
| | Fig. 9 Effects of different conditions on the adsorption capacity of O3-HMO: (a) pH (CLi+ = 100 mg L−1, T = 25 °C), (b) temperature (CLi+ = 100 mg L−1, pH = 11.5). | |
As shown in Fig. 10a, HMO and O3-HMO were immersed in a NaHCO3 buffered LiOH solution (pH = 11.5, CLi+ = 100 mg L−1) at 25 °C for adsorption. Within the initial 2 h, the adsorption capacity reached about 85% of the saturated adsorption capacity, and equilibrium was achieved within 24 hours. To investigate the adsorption kinetics, the adsorption data in Fig. 10a were fitted by pseudo-first-order and pseudo-second-order kinetic models,46,47 represented by eqn (16) and (17), respectively. The results in Fig. 10b and c show that the corresponding fitting parameters obtained from the pseudo-second-order kinetic model were superior to those from the pseudo-first-order kinetic model, indicating that the pseudo-second-order kinetic model provides a more accurate description of Li+ adsorption, which belongs to the chemisorption process. Table 5 lists the specific fitting parameters of the adsorption isotherms.
| |
ln(qe − qt) = ln![[thin space (1/6-em)]](https://www.rsc.org/images/entities/char_2009.gif) qe − k1t qe − k1t
| (16) |
| |
 | (17) |
where
qe is the adsorption capacity (mg g
−1);
qt is the adsorption capacity at different times (mg g
−1);
t is the adsorption time;
k1 (h
−1) and
k2 (g mg
−1 h
−1) are the rate constants of the pseudo-first-order and pseudo-second-order kinetic models, respectively.
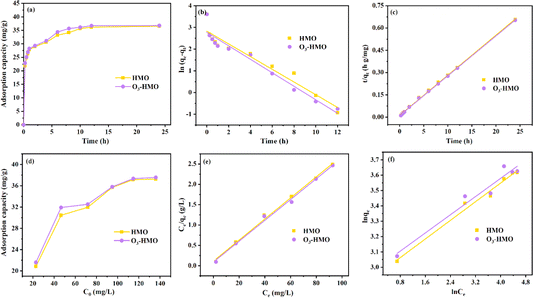 |
| | Fig. 10 (a) Variation in the adsorption capacity with time. (b) Pseudo-first-order kinetic model and (c) pseudo-second-order kinetic model. (d) Variation in the adsorption capacity with different initial lithium concentrations. (e) Langmuir isothermal model and (f) Freundlich isothermal model. | |
Table 5 Pseudo-first-order kinetic and pseudo-second-order kinetic parameters
| Material |
qe,exp |
Pseudo-first-order |
Pseudo-second-order |
| k1 (h−1) |
qe,cal (mg g-1) |
R2 |
k2 (g mg−1 h−1) |
qe,cal (mg g−1) |
R2 |
| HMO |
36.54 |
0.2931 |
16.91 |
0.92442 |
0.06 |
37.05 |
0.9989 |
| O3-HMO |
36.78 |
0.3112 |
16.05 |
0.9401 |
0.07 |
37.30 |
0.9994 |
As shown in Fig. 10d, HMO and O3-HMO were immersed in different lithium concentration solutions (pH = 11.5, C0 = 20–135 mg L−1) at 25 °C for adsorption to investigate the effect of C0 on the equilibrium adsorption capacity. The results indicate that the equilibrium adsorption capacity increased sharply with the increase of C0, but the adsorption capacity was close to saturation when C0 reached about 110 mg L−1. The adsorption data in Fig. 10d were fitted by Langmuir and Freundlich models48,49 to examine the uptake behavior, presented as eqn (18) and (19), respectively. The fitted curves in Fig. 10e and f demonstrate that the Li+ adsorption process aligns well with a monolayer Langmuir-type adsorption with a correlation coefficient. This indicates that the adsorption behavior of Li+ on the HMO particles hinges on the completion of the chemisorption monolayer.
| |
 | (18) |
| |
 | (19) |
where
Ce denotes the equilibrium concentration of Li
+ (mg L
−1);
qe is the equilibrium adsorption capacity (mg g
−1);
qm is the theoretical maximum adsorption capacity (mg g
−1);
kL represents the constant of the Langmuir isotherm (L mg
−1); and
kF and
n are the parameters of the Freundlich equation (L g
−1).
3.5 Selectivity and cyclic performance
The selective adsorption results are depicted in Fig. 11a. The equilibrium adsorption capacity of O3-HMO for highly concentrated competing cations in artificial brine water did not exceed 1.5 mg g−1. However, the adsorption capacity of Li+ reached 27.2 mg g−1. Although it was below the adsorption capacity in the NaHCO3-buffered LiOH solution owing to the lower pH,50 it still exhibited a much higher qe than the other coexisting cations. The high selectivity of the lithium-ion sieve for Li+ originates from the “ion sieve effect”, which is the three-dimensional channel that theoretically only allows Li+ and ions with a smaller radius to pass through. Thus, the lithium-ion sieve can screen and memorize the target Li+ ions. Although the ionic radius of Mg2+ (0.072 nm) is similar to that of Li+ (0.076 nm), the separation factor of Li+ to Mg2+ is still as high as 2367. This is because the hydration energy of Mg2+ (−1830 kJ mol−1) is much larger than the hydration energy of Li+ (−475 kJ mol−1), resulting in a higher dehydration barrier for entry into the 16c–8a–16c channel. This further demonstrates that O3-HMO exhibits excellent selectivity for lithium recovery in high Mg2+/Li+ ratio saline systems.
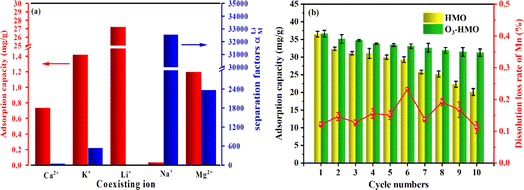 |
| | Fig. 11 Recovery of Li+ from artificial brine via O3-HMO: (a) adsorption selectivity towards Li+, Na+, K+, Mg2+ and Ca2+; (b) dissolution loss of Mn and Li+ adsorption capacity in the cycling process. | |
Regenerability and excellent structural stability are crucial for further industrial applications. Fig. 11b presents the cyclic performance of LMO treated with O3-HCl or HCl. The MDL of LMO eluted with O3-HCl was consistently lower than 0.3%, far below the 5.89% observed for the HCl-treated sample in this article. Although there was a gradual decrease in the Li+ uptake, the tenth adsorption capacity remained at about 85.39% of the original capacity. The good cyclic stability and low MDL prove that O3 in combination with HCl is a better method than using HCl alone.
4 Conclusions
In this study, a novel eluent consisting of 0.05 mol L−1 HCl combined with O3 was used to address the issue of MDL. Notably, the introduction of this eluent did not alter the spinel crystal structure of the material. By optimizing the O3 concentration of 2.50 mg L−1, the MDL of LMO fell from 5.89% (without O3 dosage) to a mere 0.11%. The material also exhibited excellent stability during cyclic tests. Even after 10 adsorption–desorption cycles, the adsorption capacity of LMO remained above 31.27 mg g−1 and the MDL remained below 0.3%, owing to the beneficial effects of O3 on the LMO. Furthermore, the HMO demonstrated remarkable selectivity for Li+ even in the presence of various coexisting ions. The application of the HCl-O3 eluent represents a promising strategy to prevent MDL and improve the cycling stability. In addition, LMO has the problem of high loss and difficult recovery, as it exists in the form of a powder. Therefore, further work needs to be carried out to select suitable composite materials and form technologies to immobilize the powdery material into different forms to facilitate its industrial application.
Author contributions
Longyan Song: experimental design, conceptualization, methodology, formal analysis, writing – original draft. Minxia Liu: methodology, formal analysis, investigation. Min Nian: investigation. Gang Yang: conceptualization, writing – review & editing.
Conflicts of interest
The authors declare that they have no known competing financial interests or personal relationships that could have appeared to influence the work reported in this paper.
Acknowledgements
This research was funded by the Prospective Joint Research Project of Industry, University and Research in Jiangsu Province (BY2016005-11) and the National Science and Technology Support Plan (No. 2013BAE111B03).
References
- S. Chen, F. Dai and M. Cai, ACS Energy Lett., 2020, 5, 3140–3151 CrossRef CAS.
- X. H. Zhang, Z. Li, L. A. Luo, Y. L. Fan and Z. Y. Du, Energy, 2022, 238 CAS.
- Y. Yin, Z. Yuan, B. Pang, Y. Xiao and Y. Deng, Front. Energy Res., 2023, 10, 78–92 Search PubMed.
- C. Liu, J. Lin, H. Cao, Y. Zhang and Z. Sun, J. Cleaner Prod., 2019, 228, 801–813 CrossRef CAS.
- Y. Zhang, Y. Hu, L. Wang and W. Sun, Miner. Eng., 2019, 139, 105868 CrossRef CAS.
- R. Coterillo, L. E. Gallart, E. Fernández-Escalante, J. Junquera, P. García-Fernández, I. Ortiz, R. Ibañez and M. F. San-Román, Desalination, 2022, 532, 115704 CrossRef CAS.
- D. Shi, B. Cui, L. Li, M. Xu, Y. Zhang, X. Peng, L. Zhang, F. Song and L. Ji, Desalination, 2020, 479, 114306 CrossRef CAS.
- D. Perez-Antolin, C. Irastorza, S. Gonzalez, R. Moreno, E. García-Quismondo, J. Palma, J. J. Lado and E. Ventosa, Desalination, 2022, 533, 115764 CrossRef CAS.
- D. Liu, Z. Zhao, W. Xu, J. Xiong and L. He, Desalination, 2021, 519, 115302 CrossRef.
- Y. Xu, H. Peng, H. Luo, Q. Zhang, Z. Liu and Q. Zhao, Desalination, 2022, 526, 115519 CrossRef CAS.
- R. He, C. Dong, S. Xu, C. Liu, S. Zhao and T. He, Desalination, 2022, 525, 115492 CrossRef CAS.
- C. Zhang, Y. Mu, S. Zhao, W. Zhang and Y. Wang, Desalination, 2020, 496, 114710 CrossRef CAS.
- G. Yang, H. Shi, W. Liu, W. Xing and N. Xu, Chin. J. Chem. Eng., 2011, 19, 586–591 CrossRef CAS.
- K. Zhao, B. Tong, X. Yu, Y. Guo, Y. Xie and T. Deng, Chem. Eng. J., 2022, 430, 131423 CrossRef CAS.
- H. Wang, J. Cui, M. Li, Y. Guo, T. Deng and X. Yu, Chem. Eng. J., 2020, 389, 124410 CrossRef CAS.
- Y. Sun, Q. Wang, Y. Wang, R. Yun and X. Xiang, Sep. Purif. Technol., 2021, 256, 117807 CrossRef CAS.
- J. Chen, S. Lin and J. Yu, J. Hazard. Mater., 2020, 388, 122101 CrossRef CAS.
- R. Zhang, Y. Guo, J. Yu and S. Lin, Appl. Surf. Sci., 2023, 639, 158241 CrossRef CAS.
- H. Yu, G. Naidu, C. Zhang, C. Wang, A. Razmjou, D. S. Han, T. He and H. Shon, Desalination, 2022, 539, 115951 CrossRef CAS.
- K. R. Morgan, S. Collier, G. Burns and K. Ooi, J. Chem. Soc. Chem. Commun., 1994, 1719–1720 RSC.
- T. Takada, H. Hayakawa and E. Akiba, J. Solid State Chem., 1995, 115, 420–426 CrossRef CAS.
- R. Chitrakar, H. Kanoh, Y. Miyai and K. Ooi, Chem. Mater., 2000, 12, 3151–3157 CrossRef CAS.
- J. Gao, Z. Du, Q. Zhao, Y. Guo and F. Cheng, J. Mater. Res. Technol., 2021, 13, 228–240 CrossRef CAS.
- F. Qian, B. Zhao, M. Guo, Z. Qian, N. Xu, Z. Wu and Z. Liu, Hydrometallurgy, 2020, 193, 105291 CrossRef CAS.
- L. Bao, J. Zhang, J. Wu, G. Zhang, Y. Yang, W. Tang and M. Xue, Hydrometallurgy, 2022, 209, 105772 CrossRef CAS.
- L. Li, W. Qu, F. Liu, T. Zhao, X. Zhang, R. Chen and F. Wu, Appl. Surf. Sci., 2014, 315, 59–65 CrossRef CAS.
- J. Kim, S. Oh and S. Kwak, Chem. Eng. J., 2015, 281, 541–548 CrossRef CAS.
- A. Tron, Y. D. Park and J. Mun, J. Power Sources, 2016, 325, 360–364 CrossRef CAS.
- J. Hwang, K. Do and H. Ahn, Chem. Eng. J., 2021, 406, 126813 CrossRef CAS.
- L. Wang, L. Wang, J. Wang and X. Wang, Sep. Purif. Technol., 2022, 303, 121933 CrossRef CAS.
- Z. Ji, M. Zhao, J. Yuan, J. Wang, J. Zhou, H. Yin and B. Sun, Solvent Extr. Ion Exch., 2016, 34, 549–557 CrossRef CAS.
- A. Gao, Z. Sun, S. Li, X. Hou, H. Li, Q. Wu and X. Xi, Dalton Trans., 2018, 47, 3864–3871 RSC.
- J. S. Yuan, H. B. Yin, Z. Y. Ji and H. N. Deng, Ind. Eng. Chem. Res., 2014, 53, 9889–9896 CrossRef CAS.
- R. Chitrakar, Y. Makita, K. Ooi and A. Sonoda, Ind. Eng. Chem. Res., 2014, 53, 3682–3688 CrossRef CAS.
- W. Ding, J. Zhang, Y. Liu, Y. Guo, T. Deng and X. Yu, Chem. Eng. J., 2021, 426, 131689 CrossRef CAS.
- H. Li, J. Pan, Y. Ping, J. Su, M. Fang, T. Chen, B. Pan and Z. Lu, Nano Lett., 2023, 23, 10458–10465 CrossRef CAS.
- G. T. Zhang, J. Z. Zhang, J. B. Zeng, Y. X. Sun, Y. Shen, X. Li, X. F. Ren, C. X. Hai, Y. Zhou and W. P. Tang, Colloids Surf., A, 2021, 629, 127465 CrossRef CAS.
- Z. Liu, K. Chen, J. Ding, W. Wang and J. Lu, Hydrometallurgy, 2023, 219, 106078 CrossRef CAS.
- G. Zhang, C. Hai, Y. Zhou, W. Tang, J. Zhang, J. Zeng, Y. Liu, S. Dong and G. Peng, Chem. Eng. J., 2022, 450, 137912 CrossRef CAS.
- Y. J. Shu, S. M. Liang, J. Y. Xiao, Z. L. Tu and H. B. Huang, Acta Phys.-Chim. Sin., 2021, 37, 122967 Search PubMed.
- J. B. Jia, P. Y. Zhang and L. Chen, Appl. Catal., B, 2016, 189, 210–218 CrossRef CAS.
- J. Z. Ma, C. X. Wang and H. He, Appl. Catal., B, 2017, 201, 503–510 CrossRef CAS.
- W. Li, G. V. Gibbs and S. T. Oyama, J. Am. Chem. Soc., 1998, 120, 9041–9046 CrossRef CAS.
- Q. Feng, Y. Miyai, H. Kanoh and K. Ooi, Langmuir, 1992, 8, 1861–1867 CrossRef CAS.
- L. Wang, C. G. Meng and W. Ma, Colloids Surf., A, 2009, 334, 34–39 CrossRef CAS.
- S. Wang, S. Zheng, Z. Wang, W. Cui, H. Zhang, L. Yang, Y. Zhang and P. Li, Chem. Eng. J., 2018, 332, 160–168 CrossRef CAS.
- A. Benhammou, A. Yaacoubi, L. Nibou and B. Tanouti, J. Colloid Interface Sci., 2005, 282, 320–326 CrossRef CAS.
- S. Chen, J. Hu, J. Shi, M. Wang, Y. Guo, M. Li, J. Duo and T. Deng, J. Hazard. Mater., 2019, 371, 694–704 CrossRef CAS.
- Y. Wei, H. Liu, C. Liu, S. Luo, Y. Liu, X. Yu, J. Ma, K. Yin and H. Feng, Water Res., 2019, 150, 182–190 CrossRef CAS.
- J. Xiao, X. Nie, S. Sun, X. Song, P. Li and J. Yu, Adv. Powder Technol., 2015, 26, 589–594 CrossRef CAS.
|
| This journal is © The Royal Society of Chemistry 2024 |
Click here to see how this site uses Cookies. View our privacy policy here.  Open Access Article
 *
*
![[thin space (1/6-em)]](https://www.rsc.org/images/entities/char_2009.gif) :
:![[thin space (1/6-em)]](https://www.rsc.org/images/entities/char_2009.gif) 0.63
0.63![[thin space (1/6-em)]](https://www.rsc.org/images/entities/char_2009.gif) :
:![[thin space (1/6-em)]](https://www.rsc.org/images/entities/char_2009.gif) 0.39. The mixture was magnetically stirred at 500 rpm for 2 h at 25 °C to form a uniform solution. After being dried at 80 °C, the mixture was ground. The obtained powder was then placed on the corundum ceramic sheet, and calcined in the muffle furnace under the atmosphere of flowing air to gain LMO. During the calcination, the powder was first rapidly heated to 200 °C and held for 2 h, then calcined at 600 °C for 10 h.
0.39. The mixture was magnetically stirred at 500 rpm for 2 h at 25 °C to form a uniform solution. After being dried at 80 °C, the mixture was ground. The obtained powder was then placed on the corundum ceramic sheet, and calcined in the muffle furnace under the atmosphere of flowing air to gain LMO. During the calcination, the powder was first rapidly heated to 200 °C and held for 2 h, then calcined at 600 °C for 10 h.


![[thin space (1/6-em)]](https://www.rsc.org/images/entities/char_2009.gif) 855
855![[thin space (1/6-em)]](https://www.rsc.org/images/entities/char_2009.gif) 013
013


![[thin space (1/6-em)]](https://www.rsc.org/images/entities/char_2009.gif) qe − k1t
qe − k1t


