 Open Access Article
A sulfonate ligand-defected Zr-based metal–organic framework for the enhanced selective removal of anionic dyes†
Ha V. Leab,
Nhi T. Voab,
Hoan T. Phanab,
Thu M. Daoab,
Bao G. Nguyenab,
Tung T. Nguyen ab,
Phuoc H. Ho
 c and
Khoa D. Nguyen
 *ab
*ab
aFaculty of Chemical Engineering, Ho Chi Minh City University of Technology (HCMUT), 268 Ly Thuong Kiet Street, District 10, Ho Chi Minh City, 70000, Vietnam. E-mail: khoand1989@hcmut.edu.vn
bVietnam National University Ho Chi Minh City, Linh Trung Ward, Ho Chi Minh City, 70000, Vietnam
cChemical Engineering, Competence Centre for Catalysis, Chalmers University of Technology, Gothenburg, SE-412 96, Sweden
First published on 21st May 2024
Abstract
In this work, we introduce a novel defective analogue of the representative 6-connected zirconium-based metal–organic framework (MOF-808), by employing 5-sulfoisophthalic acid monosodium salt (H2BTC-SO3Na) as a defect inducer via a mixed-linker approach. The structural integrity and different physicochemical properties were investigated by various characterization techniques, including powder X-ray diffraction (PXRD), scanning electron microscopy (SEM), thermogravimetric analysis (TGA), and nitrogen physisorption at 77 K. Additionally, proton nuclear magnetic resonance (1H-NMR), energy-dispersive X-ray (EDX), and inductively coupled plasma optical emission spectroscopy (ICP-OES) were employed to confirm the presence of 6.9 mol% of the 5-sulfoisophthalate ligand within the highly crystalline MOF-808 structure. The defective material exhibited significant enhancements in the removal efficiency of various organic dyes, including approximately 64% and 77% for quinoline yellow and sunset yellow, and 56% and 13% for rhodamine B and malachite green, compared to its pristine counterpart. Importantly, the defective MOF-808 showed a remarkable selectivity toward anionic species in binary-component dyes comprising both anionic and cationic dyes.
1 Introduction
Water is a fundamentally crucial element for the survival and development of living organisms. However, the rapid industrialization of many sectors has caused the increased discharge of synthetic organic dyes in wastewater.1–4 These dyes have intrinsic toxicity, low biodegradability, and hinder sunlight penetration, leading to numerous detrimental impacts on both aquatic ecosystems and living bodies.5,6 Hence, the need for effective treatment of wastewater effluent containing dye molecules has drawn considerable attention in science and technology.7,8 Among the available remediation techniques, adsorption stands out as a simple operation and cost-effective method to remove organic dyes from water as compared with other pathways such as chemical coagulation, membrane separation, electrolysis, biological methods, and advanced oxidation.9–11 One of the key factors responsible for the efficacy of the adsorption process is the rational design of novel adsorbents with high sorption capacities and selectivity.8,12Metal–organic frameworks (MOFs), as inorganic–organic hybrid materials characterized by a remarkable internal surface area and high porosity, have been intensively investigated in a myriad of fields, including adsorption, catalysis, and gas storage.13–15 Recently, many attempts have been focused on using water-stable MOFs to remove hazardous contaminants from aqueous solutions.16,17 The adsorption capacity of MOFs is associated with their specific surface area and functional group density. In addition to their large specific surface area, incorporating modified organic ligands at the molecular level to introduce functional groups into the pore channels of MOFs is recognized as an effective approach to design the functionalities of channels and pore sizes. These modifications can enhance the adsorption capability by maximizing functional density on a finite surface area.15,18,19 Notably, MOF-808, a Zr(IV)-carboxylate-based MOF, possesses intriguing properties, namely remarkable water stability, high surface area, and large pore aperture. MOF-808 is constructed based on Zr6 oxo-clusters which acquires six active nodes to link with 1,3,5-benzenetricarboxylic acid (H3BTC) ligands. This coordination mode results in six unsaturated metal sites accessible for interactions with targeted guest molecules, along with its versatile functionalization capabilities tailored to specific needs, making MOF-808 a promising candidate for environmental purposes.20–23 Several studies have explored its selective adsorption properties in both aqueous and gaseous phases, including CO2 capture from off-gas using ethylamine-functionalized analogues,24 recovery of Pd(II) ions in acidic solutions,25 and Hg(II) removal from wastewater with thiol-functionalized MOF-808.26 The selective adsorption of organic dyes has been also reported in several studies, in which MOF-808 showed clear affinity towards anionic dyes.12,17,27 Additionally, a recent study has highlighted the effectiveness of defect-engineered MOF-808 derivatives, functionalized with –NH2 and –OH groups, as adsorbents for the uptake of anionic dye molecules in aqueous solutions, exhibiting a substantial improvement up to 60% compared to pristine MOF-808, while showing negligible enhancement in the case of cationic molecules.12
Although MOF-808 and its derivatives have demonstrated efficacy as selective adsorbents for anionic species, the investigation concerning their utilization in binary dye mixtures remains limited. Therefore, in the present work, we introduced a functionalized variant of MOF-808 material, denoted as MOF-808-S, by directly introducing 5-sulfoisophthalic acid sodium salt (H2BTC-SO3Na) into the MOF-808 structure via a one-pot solvothermal approach. This method aimed to integrate more positively-charged binding centers in the MOF-808 structure to enhance the dye adsorption process. We investigated the adsorption performance of the sulfonate ligand-defected MOF-808 for both cationic and anionic dyes by screening the influence of the exposure time and initial dye concentration. Additionally, the selective adsorption of the defective material in binary dye mixtures was evaluated in comparison to pristine MOF-808.
2 Materials and methods
2.1 Materials and reagents
All chemicals including zirconium(IV) oxychloride octahydrate (ZrOCl2·8H2O – 97.0%), 1,3,5-benzenetricarboxylic acid (H3BTC – 98.0%), 5-sulfoisophthalic acid sodium salt (H2BTC-SO3Na – 98%), N,N-dimethylformamide (DMF – 99.8%), formic acid (HCOOH – 88% in water), acetone (C2H6O – 99.7%), acetic acid (CH3COOH – 99.5%), ammonia (NH3 – 25% in water), quinoline yellow (denoted as QY, C18H9NNa2O8S2 – 95.0%), sunset yellow (denoted as SY, C16H10N2Na2O7S2 – 90.0%), malachite green (denoted as MG, C23H25ClN2 – 90.0%), and rhodamine B (denoted as RhB, C28H31ClN2O3 – 90.0%) were purchased from commercial suppliers (Sigma-Aldrich, Acros Organics, and Fisher Scientific) and utilized in their original form without further purification.2.2 Synthesis of the sulfonate ligand-defected MOF-808
The synthesis of sulfonate ligand-defected MOF-808 was conducted according to the previous report.12 In a typical procedure, 1,3,5-benzenetricarboxylic acid (H3BTC; 0.135 g, 0.645 mmol) 5-sulfoisophthalic acid sodium salt (H2BTC-SO3Na; 0.058 g, 0.215 mmol) and ZrOCl2·8H2O (0.81 g, 2.51 mmol) were dissolved using 75 mL of the mixture of dimethyl formamide (DMF) and formic acid (1![[thin space (1/6-em)]](https://www.rsc.org/images/entities/char_2009.gif) :
:![[thin space (1/6-em)]](https://www.rsc.org/images/entities/char_2009.gif) 1 v/v) in total. The mixture was then mixed and put in the oven for 72 h at 80 °C. The solid was collected and washed with DMF (3 × 30 mL) and acetone (3 × 30 mL), respectively at room temperature. The obtained product was eventually activated at 120 °C for 5 h under a reduced pressure, yielding a white powder, which was denoted as MOF-808-S.
1 v/v) in total. The mixture was then mixed and put in the oven for 72 h at 80 °C. The solid was collected and washed with DMF (3 × 30 mL) and acetone (3 × 30 mL), respectively at room temperature. The obtained product was eventually activated at 120 °C for 5 h under a reduced pressure, yielding a white powder, which was denoted as MOF-808-S.
To compare defective material in the capture of organic dyes, the original MOF-808 was synthesized by employing the modified procedure.17,23 A mixture of ZrOCl2·8H2O (0.81 g, 2.51 mmol) and 1,3,5-benzenetricarboxylic acid (0.18 g, 0.86 mmol) was dissolved in 75 mL of the mixture of DMF and formic acid (1![[thin space (1/6-em)]](https://www.rsc.org/images/entities/char_2009.gif) :
:![[thin space (1/6-em)]](https://www.rsc.org/images/entities/char_2009.gif) 1 v/v). The resulting mixture was kept at 80 °C. A white powder of MOF-808 was observed after 72 h. The product was collected and washed with DMF (3 × 30 mL) and acetone (3 × 30 mL), respectively. MOF-808 was activated under a reduced pressure at 120 °C for 48 h before employing as an adsorbent.
1 v/v). The resulting mixture was kept at 80 °C. A white powder of MOF-808 was observed after 72 h. The product was collected and washed with DMF (3 × 30 mL) and acetone (3 × 30 mL), respectively. MOF-808 was activated under a reduced pressure at 120 °C for 48 h before employing as an adsorbent.
2.3 Characterization of the prepared materials
Powder X-ray diffraction (PXRD) analyses were conducted on a Bruker Advance D8 diffractometer (Bruker AXS, Germany), which was equipped with monochromatized Cu-Kα radiation (λ = 1.5418 Å), operated at 40 kV and 40 mA, room temperature. The data were collected in the 2θ range of 2–30° with a scan rate of 0.5° min−1 and a step size of 0.01°. The cell parameters and crystallite size were determined based on five reflections (1 1 1), (3 1 1), (2 2 2), (4 0 0), and (3 3 1) from the obtained XRD patterns.12,23Prior to scanning electron microscopy/energy-dispersive X-ray spectroscopy analysis (SEM/EDX), the sample was prepared on holey carbon grids. The measurements were performed on a Hitachi SU 8010 FESEM with a magnification of 250![[thin space (1/6-em)]](https://www.rsc.org/images/entities/char_2009.gif) 00× at an accelerating voltage of 10 kV.
00× at an accelerating voltage of 10 kV.
Nitrogen physisorption measurements were conducted on a Micromeritics ASAP 2020 volumetric adsorption analyzer system. The sample was activated at 120 °C under vacuum for 5 h before the isotherm adsorption/desorption was carried out at 77 K using high-purity nitrogen gas. Surface area of the sample was determined based on the Brunauer–Emmett–Teller (BET) model within the relative pressure range of 0.01–0.10 p/p0. And, the density functional theory (DFT) method was employed to investigate the pore size distribution of the prepared materials.
Thermalgravimetric analysis (TGA) was investigated using a Mettler Toledo TGA/DSC Stare System that was interfaced with a PC through Stare software. The sample was placed in an alumina pan and heated at a rate of 5 °C min−1 in an air environment from 30 to 850 °C.
The UV-Vis absorbance was measured using a Thermo Scientific G10S UV-Vis instrument. The standard curves were used to determine the dye concentration in aqueous solutions. These curves showed the correlation between concentration and absorbance measured at the maximum absorbance wavelength of the organic dyes.
For proton nuclear magnetic resonance (1H-NMR) analysis, the activated sample was digested using 5 drops of deuterated hydrochloric acid (DCl, 20 wt% in D2O) and 15 mg of CsF in a 5-mL polypropylene vial at room temperature for 6 h. Deuterated DMSO (DMSO-d6) was added to the obtained solution prior to each NMR measurement. A Bruker spectrometer was employed to record 1H-NMR spectra at 600 MHz. Chemical shifts (ppm) were referenced to tetramethyl silane.
2.4 Adsorption studies
The MOF-808-S was used for the adsorptive removal of cationic dyes (rhodamine B and malachite green) and anionic dyes (quinoline yellow and sunset yellow) (Table S1†). In a typical procedure, 10 mg of activated MOF-808-S was added to 15 mL of a single-dye solution. The resulting mixture was stirred at room temperature for 300 min. After centrifugation, the pH of the obtained solution was adjusted to the initial value by adding a diluted acetic acid or ammonia solution to avoid the effect of pH on the UV-Vis absorbance data. To investigate the factors affecting the performance of the MOF-808-S material, the adsorption conditions, including time and concentration of organic dyes, were varied. Furthermore, the adsorption capacities and selectivity of MOF-808 and MOF-808-S in an aqueous mixture of organic dyes were compared upon time-dependent UV-Vis analysis for the solution.For the recycling test, the adsorption experiment was carried out in the single-dye solution with an initial concentration of 1000 ppm. The MOF adsorbent was separated from the mixture by centrifugation, washed three times with pure ethanol and acetone containing 5 vol% HCl, and subsequently rinsed three times with pure acetone. The activation procedure was performed at 100 °C in 5 h before the material was reused for the next adsorption cycle.
Based on the results of the time-dependent adsorption, the adsorption kinetics was investigated using first-order and second-order kinetic models (eqn (1) and (2), respectively). The first-order model describes the physical adsorption process and the diffusion stage, which governs the adsorption rate. In contrast, the quadratic model is based on the assumption that chemisorption is the primary step determining the rate of the adsorption process.28
ln(Qe − Qt) = ln![[thin space (1/6-em)]](https://www.rsc.org/images/entities/char_2009.gif) Qe − k1t Qe − k1t
| (1) |
 | (2) |
The design of adsorption systems depends on the adsorption isotherm. The data provide helpful information on the interactions between solutes and adsorbents as well as the quantity of adsorbent required to remove a unit mass of a pollutant under specific circumstances. The empirical Langmuir isotherm is acceptable when the surface adsorption takes place in a monolayer and a homogenous state. It is stated mathematically as eqn (3).29,30
 | (3) |
Adsorption of adsorbents on heterogeneous surfaces, which is considered to involve multilayer and reversible adsorption on the active sites of the adsorbent, is the foundation of the Freundlich isotherm model.31 The linear Freundlich equation is expressed by eqn (4).
 | (4) |
3 Results and discussion
3.1 Material synthesis and characterization
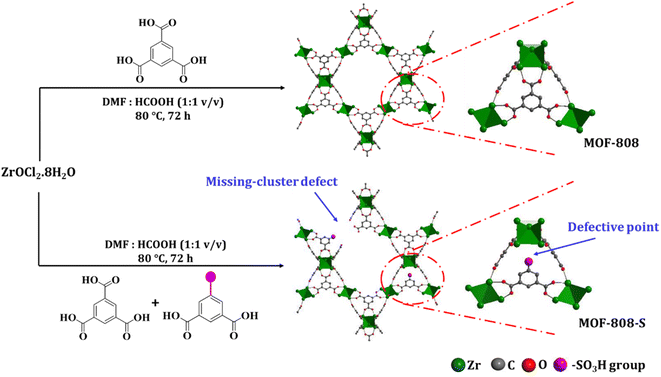
In this study, the synthesis of MOF-808 and its defective analogue (MOF-808-S) was carried out using the solvothermal method at 80 °C in 72 h. The reaction scheme for the formation of these materials is presented in Fig. 1. The procedure proved high effectiveness in forming high-quality MOF-808 crystals and enhancing the accessibility of guest linkers into MOF-808.12,17 The recorded XRD patterns of the pristine and sulfonate-defected MOF-808 materials provided insight into the crystalline structure (Fig. 2). The XRD patterns of the pristine MOF-808 are similar to the previously reported MOF-808 structure with the peaks at 2θ = 4.34, 8.35, 8.6, 10.1, and 10.9°, corresponding to the crystal planes of (111), (311), (222), (400), and (331), respectively. Sharp and well-defined shape of these peaks indicated the high crystallinity and phase purity of the MOF-808 framework, in good accordance with the literature.23,32 The PXRD patterns of the sulfonate-defected MOF-808 are similar to that of the pristine counterpart, suggesting that this defective MOF-808 also possessed high crystallinity. However, a slight left shift to lower angles about 0.1° was observed on the PXRD pattern of the defective MOF-808 in comparison to the pristine material. This reflected a cell expansion from 35.28 to 35.36 Å for the cell parameter and 43![[thin space (1/6-em)]](https://www.rsc.org/images/entities/char_2009.gif) 912 to 44
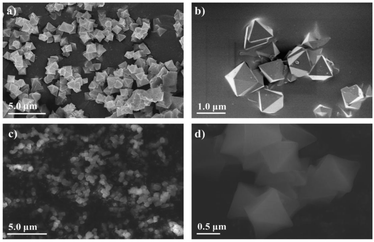
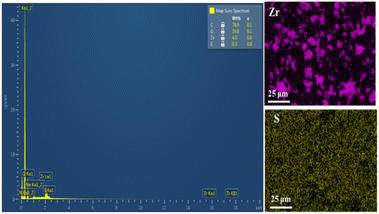
912 to 44![[thin space (1/6-em)]](https://www.rsc.org/images/entities/char_2009.gif) 212 Å3 for the cell volume (Table 1), which could be caused by the introduction of functionalized ligands in the framework.12,33,34 In fact, the cell expansion by the appearance of defect inducers located close to Zr6-clusters might lead to a significant crystallinity decrease for the material. However, the observed sharp and high-intensity peaks in the PXRD profile of the defective sample could imply that the presence of sulfonate groups with a modest amount just gave a negligible effect on the crystallinity of the MOF-808 framework. On the other hand, the steric effect of the sulfonate groups could also result in missing-cluster defects to remain a highly ordered and stable structure in the framework (Fig. 1). SEM images of the pristine and defective MOF-808 materials (Fig. 3) revealed a similar morphology. Both samples involved well-defined octahedral crystals, which is a morphological result of the formic acid-modulated synthesis procedure.35,36 In fact, simple monocarboxylic acids, including formic acid, acetic acid, and benzoic acid are commonly utilized to slow down the nucleation rate and facilitate the framework self-repair, thereby leading to the formation of high-quality MOF-808 crystals.37,38 The average crystal size was observed to be around 1000 nm for the pristine MOF-808 and 950 nm for the defective one. Evidently, introducing the sulfonate linker in the synthesis procedure did not significantly alter the octahedral morphology of MOF-808 crystals, consistent with previous reports employing various mixed linkers at low quantities.12,39 The additional EDX analysis showed the presence of S (0.2 to 0.4 wt%), confirming the incorporation of the sulfonate group with the content of 4.3–8.6 mol% in the defective MOF-808 structure (Fig. 4).This obtained content was generally low, leading to the absence of sulfonate based signals in the FT-IR spectra of the defective sample (Fig. S1†).
212 Å3 for the cell volume (Table 1), which could be caused by the introduction of functionalized ligands in the framework.12,33,34 In fact, the cell expansion by the appearance of defect inducers located close to Zr6-clusters might lead to a significant crystallinity decrease for the material. However, the observed sharp and high-intensity peaks in the PXRD profile of the defective sample could imply that the presence of sulfonate groups with a modest amount just gave a negligible effect on the crystallinity of the MOF-808 framework. On the other hand, the steric effect of the sulfonate groups could also result in missing-cluster defects to remain a highly ordered and stable structure in the framework (Fig. 1). SEM images of the pristine and defective MOF-808 materials (Fig. 3) revealed a similar morphology. Both samples involved well-defined octahedral crystals, which is a morphological result of the formic acid-modulated synthesis procedure.35,36 In fact, simple monocarboxylic acids, including formic acid, acetic acid, and benzoic acid are commonly utilized to slow down the nucleation rate and facilitate the framework self-repair, thereby leading to the formation of high-quality MOF-808 crystals.37,38 The average crystal size was observed to be around 1000 nm for the pristine MOF-808 and 950 nm for the defective one. Evidently, introducing the sulfonate linker in the synthesis procedure did not significantly alter the octahedral morphology of MOF-808 crystals, consistent with previous reports employing various mixed linkers at low quantities.12,39 The additional EDX analysis showed the presence of S (0.2 to 0.4 wt%), confirming the incorporation of the sulfonate group with the content of 4.3–8.6 mol% in the defective MOF-808 structure (Fig. 4).This obtained content was generally low, leading to the absence of sulfonate based signals in the FT-IR spectra of the defective sample (Fig. S1†).
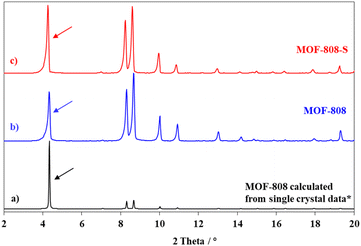 | ||
| Fig. 2 PXRD patterns of calculated MOF-808 (a); as-prepared MOF-808 (b) and as-prepared MOF-808-S (c). * The single crystal data was referred from ref. 23. | ||
| Sample | Cell parametera (Å) | Cell volumea (Å3) | Crystal sizea (nm) | Surface areab (m2 g−1) | Pore volumec (cm3 g−1) | Pore diameterc (Å) |
|---|---|---|---|---|---|---|
| a Cell parameters were calculated for five reflections (1 1 1), (3 1 1), (2 2 2), (4 0 0), and (3 3 1) on the XRD patterns.b Surface area was based on the BET formula and N2 adsorption data in the range of P/Po from 0.08 to 0.24.c Pore volume and pore diameter were determined via the DFT method. | ||||||
| MOF-808 | 35.28 ± 0.02 | 43![[thin space (1/6-em)]](https://www.rsc.org/images/entities/char_2009.gif) 912 ± 75 912 ± 75 |
1065 ± 5 | 1411 | 14.2 | 17 |
| MOF-808-S | 35.36 ± 0.02 | 44![[thin space (1/6-em)]](https://www.rsc.org/images/entities/char_2009.gif) 212 ± 75 212 ± 75 |
952 ± 5 | 1628 | 16.2 | 17 |
To further confirm the presence of sulfur derived from the defective inducer in the MOF-808 structure, ICP-OES analysis was conducted. As expected, the sulfur element, indicative of the presence of 5-sulfoisophthalic acid sodium salt ligand in the digested defective sample, was recorded at approximately 7.7 mol% (0.36 wt%) consistent with the EDX-based sulfur content while the sodium element was detected at a negligible percentage (below 0.01 wt%). This observation can be explained by the fact that despite the use of the defective linker in a monosodium salt form (H2BTC-SO3Na), the acidic environment in the synthetic phase might promote the protonation of the sulfonate linker, yielding its acid form.
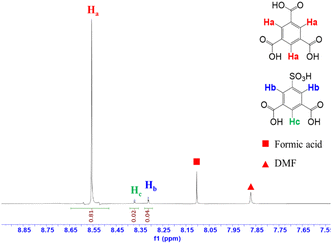
The appearance of the defective inducers in the MOF-808 framework was also investigated by 1H-NMR spectroscopy. The amount of the defective linker was determined upon the signal assigned to protons directly attached to the specific positions of the benzene ring.12,40 In the 1H-NMR spectrum for the MOF-808-S sample (Fig. 5), additional proton signals were observed due to the asymmetrical structure of H2BTC-SO3H compared to that of MOF-808, which contained only the symmetrical tricarboxylate linker (Fig. S2†). The largest signal (δHa ∼8.63 ppm) represented the three aromatic protons (Ha) of H3BTC while other two signals were assigned to those of H2BTC-SO3H. Namely, two protons denoted as Hb (δHb ∼8.32) were attached to the ortho-carbons while the last proton denoted as Hc (δHc ∼8.38) was linked to the para-carbon of H2BTC-SO3H. The Hb![[thin space (1/6-em)]](https://www.rsc.org/images/entities/char_2009.gif) :
:![[thin space (1/6-em)]](https://www.rsc.org/images/entities/char_2009.gif) Hc integration ratio of 1
Hc integration ratio of 1![[thin space (1/6-em)]](https://www.rsc.org/images/entities/char_2009.gif) :
:![[thin space (1/6-em)]](https://www.rsc.org/images/entities/char_2009.gif) 2 completely matched with the corresponding proton number in its molecular formula. Notably, based on the integration of characteristic proton peaks in H3BTC and H2BTC-SO3H species, it was determined that the sulfonate linker incorporated into the defective MOF-808 occupied 6.9 mol%. It should be noted that the number of defects remained nearly unchanged in the case of further increasing the sulfonated linker amount during the synthesis phase. This result closely resembled previous reports involving the introduction of additional detective sites into MOF-808 and other Zr-based MOFs by mixed-linker methods, where achieving higher defect levels was proven to be challenging and could potentially result in the structural collapse.12,40 In fact, the MOF-808 was built from typical 6-connected Zr-clusters, which could be considered as a reduced connectivity form of the idealized 12-connected Zr-nodes. In other words, introducing additional defects by employing bidentate linkers instead of tritopic ligands (H3BTC) could further decrease the coordination of Zr-clusters, leading to the formation of less stable frameworks.
2 completely matched with the corresponding proton number in its molecular formula. Notably, based on the integration of characteristic proton peaks in H3BTC and H2BTC-SO3H species, it was determined that the sulfonate linker incorporated into the defective MOF-808 occupied 6.9 mol%. It should be noted that the number of defects remained nearly unchanged in the case of further increasing the sulfonated linker amount during the synthesis phase. This result closely resembled previous reports involving the introduction of additional detective sites into MOF-808 and other Zr-based MOFs by mixed-linker methods, where achieving higher defect levels was proven to be challenging and could potentially result in the structural collapse.12,40 In fact, the MOF-808 was built from typical 6-connected Zr-clusters, which could be considered as a reduced connectivity form of the idealized 12-connected Zr-nodes. In other words, introducing additional defects by employing bidentate linkers instead of tritopic ligands (H3BTC) could further decrease the coordination of Zr-clusters, leading to the formation of less stable frameworks.
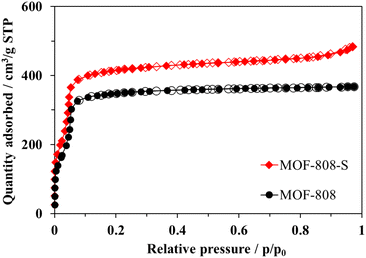
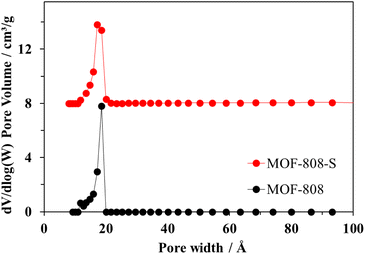
Both pristine MOF-808 and MOF-808-S showed the typical type-I nitrogen physisorption isotherms, characterized by the rapid adsorption of N2 at p/p0 < 0.1 followed by a plateau at p/p0 > 0.1 (Fig. 6). This behavior indicates highly microporous structures, with an average pore size of 17 Å for the samples (Fig. 7). While the partial replacement of the original H3BTC linker with an asymmetric one had no notable impact on the pore size distribution, the presence of defective sites significantly enhanced the nitrogen uptake and surface area of the MOF-808 material. Particularly, the BET surface area of sulfonate-defected MOF-808 was determined to be 1628 m2 g−1, showing a 15% increase compared to that of the pristine MOF-808 (1411 m2 g−1). Moreover, the total pore volume was improved by approximately 10% (from 14.7 cm3 g−1 in pristine MOF-808 to 16.2 cm3 g−1 in MOF-808-S). These findings were in line with recent reports on the incorporation of linkers of lower connectivity in MOFs,12,40 and the increase in pore volumes may contribute to the generation of more accessible open sites within the material, enhancing its efficiency in removing organic dyes from aqueous solutions.
Thermogravimetric analysis (TGA) was conducted to investigate the thermal behavior of MOF-808 and MOF-808-S (Fig. S3†). An approximately 5% weight loss below 100 °C was due to the removal of free solvent molecules (formic acid, acetone, and water) caused by air humidity and potentially suboptimal evacuation during the activation step. Subsequently, the removal of the bound solvent molecules from the framework pores was completed up to 300 °C. Gradual decomposition of the organic components of both MOF-808 and MOF-808-S was observed from around 350 °C, leaving ZrO2 as a residue at 550 °C.17,41 Interestingly, the final residual weights in the case of MOF-808-S were determined to be approximately 47.7%, it was higher than that value of the MOF-808 sample by about 2.5%, which can be assigned to the presence of the sulfate salt-based residues, which could be formed from the oxidation of the defective inducer. In a recent study, incorporating defective linkers could be also observed by changes in TGA profiles as there was a clear difference in the nature and molecular weights of the used linkers.42 In general, the generated defects in this work had no major impacts on the thermal behavior of the material due to only a small amount of the defective inducer incorporated into the MOF-808 structure.
3.2 Adsorption studies
The adsorption behavior of MOF-808-S was investigated by adding 10 mg of the material into 15 mL of the 500-ppm aqueous solution containing either a cationic or anionic dye (Table S1†). The experiment was first carried out at 25 °C in different interval contacting times from 5 to 300 min. The adsorption capacity increased rapidly within the initial 5 min, then slowed down and reached the equilibrium at approximately 120 min afterwards, indicating the efficient removal of the organic dyes from the aqueous solution (Fig. 8). It could be explained by the vast availability of adsorptive sites promoting the rapid uptake process. Once those binding centers were occupied by dye molecules, the diffusion into the internal channels of the material was required, which resulted in a slower adsorption rate until an equilibrium was reached. The trapping capacity for anionic dyes was significantly dominant as compared with those of cationic dyes. In particular, the uptake capacities with respect to quinoline yellow (QY), sunset yellow (SY), rhodamine B (RhB), and malachite green (MG) were 722, 650, 182, and 259 mg g−1, respectively. No further improvements in the adsorption capacity were achieved with the extension of time. It should be noted that the defective materials exhibited outstanding selectivity towards removing anionic species versus cationic ones. This could be rationalized that the presence of engineered acidic sites contributed to the enhanced attraction between MOF-808-S and negatively-charged dye molecules. The observations were in good agreement with the results of selective adsorption using acid-modified UiO-66,32,43 as well as our recent report on MOF-808 analogues incorporated with amino- and hydroxyl-functionalized linkers.12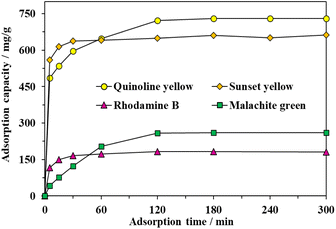 | ||
| Fig. 8 Effect of contact time on adsorption capacity of MOF-808-S (Experimental conditions: activated MOF-808-S 10 mg, dye solution 500 ppm 15 mL, pH 6.5). | ||
The impact of initial dye concentrations on the dye adsorption performance of MOF-808-S varied from 0 to 2000 ppm was carried out. As can be seen in Fig. 9, the uptake efficiency significantly enhanced, particularly approx. up to 5 times from 150 to 722 mg g−1 in the case of QY, with the increase of initial dye concentration, indicating the dependence of the adsorption performance on the dye concentration. The concentration gradient was the driving force for the mass transfer of the organic dyes to proceed from the solution towards the adsorbent framework. However, there was no significant improvement in the trapping capacity for QY and MG at concentrations higher than 500 ppm or for SY and RhB at concentrations higher than 1000 ppm, suggesting that the binding sites could possibly no longer be available and the adsorption process reached a plateau. The maximum values of 722 and 259 mg g−1 for QY and MG, respectively, were obtained at the initial dye concentration of 500 ppm while the maximum uptakes of 755 and 247 for SY and RhB, respectively, were reached at the initial dye concentration of 1000 ppm.
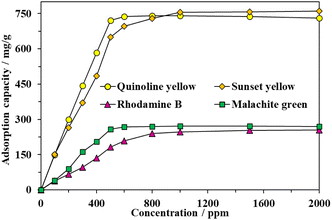 | ||
| Fig. 9 Effect of initial dye concentration on adsorption capacity of MOF-808-S (experimental condition: activated MOF-808-S 10 mg, contact time 120 min, dye solution 15 mL, pH 6.5). | ||
The adsorption interaction between MOF-808-S and organic dye molecules adsorption data was investigated by applying the time-dependent adsorption results to the pseudo-first-order and second-order kinetic models (eqn (1) and (2)). The determination coefficients (R2) of the pseudo-second-order model of the adsorption experiments were calculated to be higher than 0.99, whereas those of the pseudo-first-order model were in the range of 0.57–0.88 (Fig. S4 and S5†). Furthermore, the equilibrium uptake capacity (Qe,cal) estimated by the pseudo-second-order model closely matched the experimental data compared to predictions by the pseudo-first-order one (Table S2†). Therefore, it could be concluded that the adsorption of the dyes onto MOF-808-S proceeded in the pseudo-second-order model and the rate-limiting step involved a combination of physical and chemical adsorption mechanisms. This might be related to not only physical adsorption and penetration of dye molecules into the porous structure but also other adsorption mechanisms, such as π–π stacking interactions between aromatic structures of dye molecules and the ligand backbones, hydrogen bonding interactions between the polar functional groups of dye molecules and the surface of MOF-808-S, and electrostatic attraction, which could be significantly enhanced by the presence of positively or negatively charged centers in the frameworks (Fig. 10).32,35,44 The addition of sulfonate-functionalized linker in the preparation of MOF-808, thereby introducing more acidic sites into the structure, facilitated higher uptake and faster adsorption rate in anionic compounds than cationic ones.
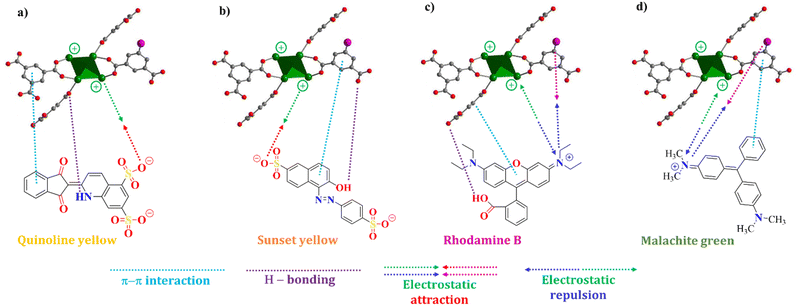 | ||
| Fig. 10 Proposed interactions between defective MOF-808-S and quinoline yellow (a); sunset yellow (b); rhodamine B (c); malachite green (d). | ||
Besides, the concentration-dependent adsorption results were fit to the Langmuir and Freundlich models (eqn (3) and (4)) to investigate the distribution of adsorbates in the MOF-808-S structure. While the Langmuir isotherm describes monolayer adsorption on a uniform surface, the Freundlich isotherm is associated with the adsorption on a heterogeneous surface with multilayer adsorbate distribution.29,31 The experimental data was found to have higher determination coefficients (R2) upon fitting with the Langmuir model (Fig. S6 and S7†). This result suggested that the Langmuir model was more suitable to describe the interaction between dye molecules and the defective MOF material, in which the adsorptive sites of MOF-808-S could be located on a uniform surface and the trapped dye molecules formed a monolayer. According to the Langmuir model, the maximum adsorption capacities were calculated to be 770, 784, 301, and 383 mg g−1 for QY, SY, RhB, and MG, respectively (Table S3†), which were only slightly higher than the experimental data. Besides, the Langmuir binding constant KL indicates interaction between the adsorbates and the adsorptive surface.45 These values were significantly higher for QY and SY in comparison to RhB and MG, suggesting stronger interaction between anionic dye molecules and MOF-808-S, which was in line with the fact that MOF-808 has positively charged centers and the formation of additional acidic defective sites would lead to increased affinity to anions and repulsive force towards cations.
The adsorption capacity of MOF-808-S was compared to that of MOF-808 under the same conditions (solution volume, adsorbent dosage, and time). It can be seen from Fig. 11 that the defective analogue performed better than its pristine form, especially with anionic dyes. MOF-808-S showed improvements of around 66 and 74% in the uptake of the anionic dyes QY (742 mg g−1) and SY (755 mg g−1), respectively. It should be noted that MOF-808, being a 6-connected Zr-MOF, has inherent positively charged centers and therefore is more attracted to anionic than cationic species.27,45 By introducing additional defects through ditopic linker substitution, hence further increasing the positive charge of the material, a significant improvement in anionic dye removal was expected.46 This performance of defective MOF-808 with sulfonate ligand was better than those of the analogues employed –NH2 and –OH groups as defect inducers which were previously reported.12 Furthermore, a notable enhancement in adsorption result was also observed in the case of RhB, with an increased capacity of up to 56% (247 mg g−1), while this value was small at about 13% (271 mg g−1) for MG uptake. It can be suggested that two types of adsorptive sites involved in the defective MOF-808-S might be responsible for the interaction with the dye molecules. This material exhibited remarkably enhanced uptakes for anionic dyes but only minor adsorption improvements for cationic ones. The favorable affinity to negatively-charged dyes such as QY and SY can be related to the increasing open Zr-centers by incorporating an asymmetric inducer in the framework. On the other hand, the electron-rich oxygen atoms in the sulfonate groups potentially attracted positively-charged dye species, for example, RhB and MG (Fig. 10). Furthermore, the increases in both surface area and pore volume via the introduction of missing-linker defects could contribute to the boosted performances for the adsorption of dye molecules.12,46–48 Notably, in terms of cationic dyes, the trapping improvement for RhB was much more significant as compared to the case of MG. It should be noted that unlike a typical cationic dye, RhB includes acid and amine groups, thereby existing in both the neutral and cationic form depending on the solution pH condition.49,50 This feature might be an advantage for promoting the interaction of the RhB species with the defective MOF-808 possessing different adsorptive sites, which was not observed in the case of MG.51
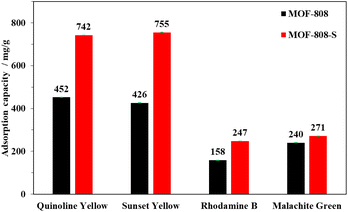 | ||
| Fig. 11 Comparison of dye adsorption capacities of MOF-808 and MOF-808-S (experimental condition: adsorbent 10 mg, contact time 120 min, dye solution 15 mL, initial concentration 1000 ppm, pH 6.5). | ||
To further demonstrate the practical application of MOF-808-S as an efficient adsorbent, its reusability was tested over 4 cycles. It should be noted that the recovery of the spent material was challenging due to chemisorption between dyes and the MOF. In fact, a single solvent, such as water, ethanol, or acetone exhibited poor removal of the dye species from the MOF framework. To improve the washing efficiency, a minor amount of HCl (5 vol%) was added to acetone. The flexible protons from the acid source could not only force the anionic dye species to migrate from the adsorbent but also competitively replace the cations in binding with the negatively-charged site in the MOF framework. In addition, the proton-rich environment was able to prevent the sulfonate groups and metal sites from the re-adsorption of the dyes during the washing step.12,52 Subsequently, the material was re-activated under a reduced pressure at 100 °C before being utilized in the next adsorption cycle. As can be seen in Fig. 12, the adsorption capacity of the recovered MOF-808-S for the tested dyes exhibited minor decreases (0.5–3%) in the second cycle and the activity loss was more significant (5–15%) in the subsequent cycles, which was possibly attributed to the incomplete removal of the dye species from the material and the collapse of the MOF framework.12,27 The presence of these dye molecules could be detected on the FTIR spectra of the recovered MOF-808-S (Fig. S8†).
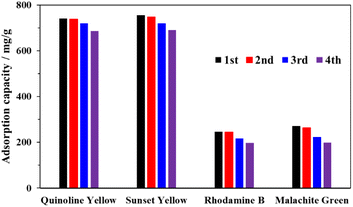 | ||
| Fig. 12 Recycling test of MOF-808-S (experimental conditions: adsorbent 10 mg, contact time 120 min, dye solution 15 mL, initial concentration 1000 ppm). | ||
Furthermore, a substantial decrease in the nitrogen adsorbed amount at 77 K was observed for the material after the forth use (Fig. 13a); therefore, the surface area of MOF-808-S declined from 1351 to 764 m2 g−1. However, the XRD patterns (Fig. 13b) showed that the crystallinity of the reused materials only experienced a modest decline, evidenced by the slight broadening of diffraction signals, while the average pore width remained in the range 17–18 Å (Fig. S9†). These results indicated that the structure of MOF-808-S analogue remained sufficiently stable for at least three recycling times.
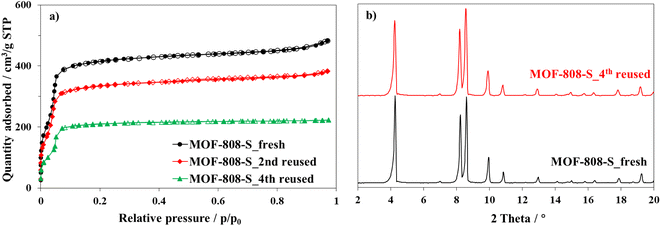 | ||
| Fig. 13 Nitrogen physisorption isotherms at 77 K (a) and PXRD patterns (b) of fresh and reused MOF-808-S. | ||
To further investigate the selectivity, adsorption experiments with binary anionic-cationic dye mixtures, including quinoline yellow and rhodamine B were carried out. At a low concentration (200 ppm of each dye), pristine MOF-808 just showed a slight selectivity towards the anionic dye, with the removal of 53% and 31% of QY and RhB after 15 min, respectively. The equilibrium was achieved after 120 min, affording 94% QY and 68% RhB removal (Fig. S10a†). In the case of MOF-808-S, approximately 99% of QY was rapidly trapped while 51% of RhB was remained in the solution after 5 min of the adsorption course (Figure S10b†). It was clear that at this concentration, where the pore accessibility of MOF-808-S was capable of trapping all the dye molecules, including both QY and RhB molecules (Fig. 9), the adsorption took place with a high selectivity to the anionic species. This result could be rationalized based on the increased positive sites derived from the substitution of sulfonate linkers playing as barriers to limit the accessibility of cationic species into the pore. Consequently, MOF-808-S would tend to prioritize trapping negative counterparts of quinoline yellow and only capture cations of rhodamine B after all the anions were adsorbed. This also meant that if the number of QY molecules was enough to fulfill the pore space, the RhB could not be trapped in the MOF-808-S structure. To confirm this hypothesis, a specific experiment employing higher concentrations of QY and RhB (500 ppm of each dye) was investigated. Expectedly, while the pristine analogue showed poor selectivity as both anionic and cationic chromophores tended to adsorb almost simultaneously and reach the removal efficiency of 53 and 67% for QY and RhB, respectively, after 420 min (Fig. 14), MOF-808-S, in contrast, showed clear preference towards QY, as 90% QY and just 20% RhB was removed after only 120 min. And the capture efficiency of QY reached approximately 95% while this value was only 23% for RhB after 420 min (Fig. 15). Obviously, the appearance of additional positive centers in the MOF-808 structure delayed the adsorption of RhB molecules, thereby significantly promoting the selectivity toward QY compounds. Nevertheless, it can be seen from the obtained results that MOF-808-S demonstrated superior selective adsorption of anionic dye molecules over cationic ones. This not only proved the higher adsorption efficiency of MOF-808-S in dye mixtures but also the stronger selectivity towards anionic species, which were in good agreement with some previous literature employing MOF-808 for selective adsorption of dye mixtures.12,27,32
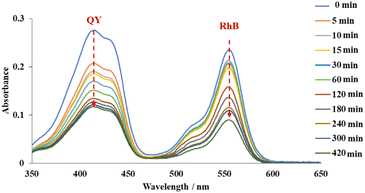 | ||
| Fig. 14 UV-Vis spectra of quinoline yellow-rhodamine B mixtures in the presence of 500 ppm for each dye at various time intervals employing MOF-808 as adsorbents. | ||
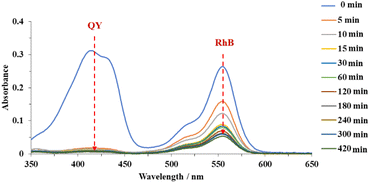 | ||
| Fig. 15 UV-Vis spectra of quinoline yellow-rhodamine B mixtures in the presence of 500 ppm for each dye at various time intervals employing MOF-808-S as adsorbents. | ||
4 Conclusions
In summary, a defect-engineered analogue of MOF-808 was successfully prepared via the mixed-linker strategy. The ditopic defect-inducing linker 5-sulfoisophthalic acid was incorporated into the framework at an approx. 6.9 mol% content. The obtained material showed a specific surface area of 1628 m2 g−1 with a 15% improvement compared to pristine MOF-808. The introduction of defect sites significantly enhanced the adsorption capacity of MOF-808-S, with increases of up to 64% (SY), 77% (QY), 56% (RhB), and 13% (MG) observed in the single-dye removal experiments. When utilized as an adsorbent in binary dye mixtures containing quinoline yellow and rhodamine B, the defective material exhibited the notable selectivity for anionic dyes, especially at a high dye concentration (500 ppm for each dye). The study demonstrated that the incorporation of the sulfonate linker even in a small quantity could generate additional positively charged sites in MOF-808, thereby significantly improving the affinity of the material towards anionic species. This approach was proved to be straightforward and effective in enhancing the efficiency and selectivity of MOF-808 in anionic dye removal, highlighting its potential for the application in the water purification.Author contributions
Conceptualization, K. D. N., H.·V.·L., and P.·H.·H.; data curation, K.·D.·N., H.·V.·L., P.·H.·H., T.·M.·D., B.·G.·N.; methodology, P.·H.·H., K.·D.·N. and H.·V.·L.; analysis, K.·D.·N., H.·V.·L., P.·H.·H., N.·T.·T.; writing – original draft, K.·D.·N., P.·H.·H., N.·T.·V., H.·T.·P., and H.·V.·L., writing – review and editing, K.·D.·N., P.·H.·H., N.·T.·V., H.·T.·P., and H.·V.·L., supervision, K.·D.·N., H.·V.·L., and P.·H.·H. All authors have read and agreed to the published version of the manuscript.Conflicts of interest
The authors declare no competing financial interest.Acknowledgements
This research is funded by Vietnam National University HoChiMinh City (VNU-HCM) under grant number C2023-20-07. We acknowledge Ho Chi Minh City University of Technology (HCMUT), VNU-HCM for supporting this study.References
- L. Cheng, Y. Dang, Y. Wang and K.-J. Chen, Mater. Chem. Front., 2024, 8, 1171–1194 RSC.
- B. Garai, D. Shetty, T. Skorjanc, F. Gándara, N. Naleem, S. Varghese, S. K. Sharma, M. Baias, R. Jagannathan, M. A. Olson, S. Kirmizialtin and A. Trabolsi, J. Am. Chem. Soc., 2021, 143, 3407–3415 CrossRef CAS PubMed.
- J. C. Maxwell, B. C. Baker and C. F. J. Faul, ACS Appl. Polym. Mater., 2023, 5, 662–671 CrossRef CAS PubMed.
- W. Xu and O. M. Yaghi, ACS Cent. Sci., 2020, 6, 1348–1354 CrossRef CAS PubMed.
- R. Al-Tohamy, S. S. Ali, F. Li, K. M. Okasha, Y. A. G. Mahmoud, T. Elsamahy, H. Jiao, Y. Fu and J. Sun, Ecotoxicol. Environ. Saf., 2022, 231, 113160 CrossRef CAS PubMed.
- T. Islam, M. R. Repon, T. Islam, Z. Sarwar and M. M. Rahman, Environ. Sci. Pollut. Res., 2023, 30, 9207–9242 CrossRef CAS PubMed.
- L. Jiang, Y. Wen, Z. Zhu, X. Liu and W. Shao, Chemosphere, 2021, 265, 129169 CrossRef CAS PubMed.
- G. T. Tee, X. Y. Gok and W. F. Yong, Environ. Res., 2022, 212, 113248 CrossRef CAS PubMed.
- F. Ahmadijokani, A. Ghaffarkhah, H. Molavi, S. Dutta, Y. Lu, S. Wuttke, M. Kamkar, O. J. Rojas and M. Arjmand, Adv. Funct. Mater., 2023, 2305527 CrossRef.
- K. Suresh, M. S. Surendra Babu and P. Jagasia, Sep. Purif. Technol., 2024, 335, 126052 CrossRef CAS.
- N. Prasetya and C. Wöll, RSC Adv., 2023, 13, 22998–23009 RSC.
- K. D. Nguyen, N. T. Vo, K. T. M. Le, K. V. Ho, N. T. S. Phan, P. H. Ho and H. V. Le, New J. Chem., 2023, 47, 6433–6447 RSC.
- S. Yuan, L. Feng, K. Wang, J. Pang, M. Bosch, C. Lollar, Y. Sun, J. Qin, X. Yang, P. Zhang, Q. Wang, L. Zou, Y. Zhang, L. Zhang, Y. Fang, J. Li and H.-C. Zhou, Adv. Mater., 2018, 30, 1704303 CrossRef PubMed.
- S. H. Goh, H. S. Lau and W. F. Yong, Small, 2022, 18, 2107536 CrossRef CAS PubMed.
- J. D. Evans, B. Garai, H. Reinsch, W. Li, S. Dissegna, V. Bon, I. Senkovska, R. A. Fischer, S. Kaskel, C. Janiak, N. Stock and D. Volkmer, Coord. Chem. Rev., 2019, 380, 378–418 CrossRef CAS.
- N. Yuan, X. Gong, W. Sun and C. Yu, Chemosphere, 2021, 267, 128863 CrossRef CAS PubMed.
- K. D. Nguyen, P. H. Ho, P. D. Vu, T. L. D. Pham, P. Trens, F. Di Renzo, N. T. S. Phan and H. V. Le, Nanomaterials, 2021, 11, 1398 CrossRef CAS PubMed.
- I. Senkovska, V. Bon, L. Abylgazina, M. Mendt, J. Berger, G. Kieslich, P. Petkov, J. Luiz Fiorio, J.-O. Joswig, T. Heine, L. Schaper, C. Bachetzky, R. Schmid, R. A. Fischer, A. Pöppl, E. Brunner and S. Kaskel, Angew. Chem., Int. Ed., 2023, 62, e202218076 CrossRef CAS PubMed.
- L. Abylgazina, I. Senkovska, R. Engemann, N. Bönisch, T. E. Gorelik, C. Bachetzky, U. Kaiser, E. Brunner and S. Kaskel, Small, 2024, 2307285 CrossRef PubMed.
- J.-S. Qin, S. Yuan, C. Lollar, J. Pang, A. Alsalme and H.-C. Zhou, Chem. Commun., 2018, 54, 4231–4249 RSC.
- H.-Q. Zheng, C.-Y. Liu, X.-Y. Zeng, J. Chen, J. Lü, R.-G. Lin, R. Cao, Z.-J. Lin and J.-W. Su, Inorg. Chem., 2018, 57, 9096–9104 CrossRef CAS PubMed.
- R. Paz, H. Viltres, N. K. Gupta, A. Romero-Galarza and C. Leyva, Environ. Sci.: Adv., 2022, 1, 182–191 CAS.
- J. Jiang, F. Gándara, Y.-B. Zhang, K. Na, O. M. Yaghi and W. G. Klemperer, J. Am. Chem. Soc., 2014, 136, 12844–12847 CrossRef CAS PubMed.
- H. J. Jun, D. K. Yoo and S. H. Jhung, J. CO2 Util., 2022, 58, 101932 CrossRef CAS.
- S. Lin, Y. Zhao, J. K. Bediako, C.-W. Cho, A. K. Sarkar, C.-R. Lim and Y.-S. Yun, J. Chem. Eng., 2019, 362, 280–286 CrossRef CAS.
- C. Ji, Y. Ren, H. Yu, M. Hua, L. Lv and W. Zhang, J. Chem. Eng., 2022, 430, 132960 CrossRef CAS.
- S. Jia, S. Song and X. Zhao, Appl. Organomet. Chem., 2021, 35, e6314 CrossRef CAS.
- J. Wang and X. Guo, J. Hazard. Mater., 2020, 390, 122156 CrossRef CAS PubMed.
- S. Kalam, S. A. Abu-Khamsin, M. S. Kamal and S. Patil, ACS Omega, 2021, 6, 32342–32348 CrossRef CAS PubMed.
- I. Langmuir, J. Am. Chem. Soc., 1918, 40, 1361–1403 CrossRef CAS.
- J. Debord, K. H. Chu, M. Harel, S. Salvestrini and J.-C. Bollinger, Langmuir, 2023, 39, 3062–3071 CrossRef CAS PubMed.
- H. Su, J. Hou, J. Zhu, Y. Zhang and B. Van der Bruggen, Sep. Purif. Technol., 2024, 333, 125957 CrossRef CAS.
- S. Marx, W. Kleist, J. Huang, M. Maciejewski and A. Baiker, Dalton Trans., 2010, 39, 3795–3798 RSC.
- M. Taddei, D. Tiana, N. Casati, J. A. van Bokhoven, B. Smit and M. Ranocchiari, Phys. Chem. Chem. Phys., 2017, 19, 1551–1559 RSC.
- R. Hardian, S. Dissegna, A. Ullrich, P. L. Llewellyn, M.-V. Coulet and R. A. Fischer, Chem.–Eur. J., 2021, 27, 6804–6814 CrossRef CAS PubMed.
- L. Han, X. Liu, X. Zhang, M. Li, D. Li, P. Qin, S. Tian, M. Lu and Z. Cai, J. Hazard. Mater., 2022, 424, 127559 CrossRef CAS PubMed.
- K. D. Nguyen, S. Ehrling, I. Senkovska, V. Bon and S. Kaskel, J. Catal., 2020, 386, 106–116 CrossRef CAS.
- G. Wißmann, A. Schaate, S. Lilienthal, I. Bremer, A. M. Schneider and P. Behrens, Microporous Mesoporous Mater., 2012, 152, 64–70 CrossRef.
- I. Abánades Lázaro, C. J. R. Wells and R. S. Forgan, Angew. Chem., Int. Ed., 2020, 59, 5211–5217 CrossRef PubMed.
- H. H. Mautschke, F. Drache, I. Senkovska, S. Kaskel and F. X. Llabrés i Xamena, Catal. Sci. Technol., 2018, 8, 3610–3616 RSC.
- K. Xuan, Y. Pu, F. Li, J. Luo, N. Zhao and F. Xiao, Chin. J. Catal., 2019, 40, 553–566 CrossRef CAS.
- W. Kleist, F. Jutz, M. Maciejewski and A. Baiker, Eur. J. Inorg. Chem., 2009, 2009, 3552–3561 CrossRef.
- J. Qiu, Y. Feng, X. Zhang, M. Jia and J. Yao, J. Colloid Interface Sci., 2017, 499, 151–158 CrossRef CAS PubMed.
- M. J. Uddin, R. E. Ampiaw and W. Lee, Chemosphere, 2021, 284, 131314 CrossRef CAS PubMed.
- H. Molavi, A. Hakimian, A. Shojaei and M. Raeiszadeh, Appl. Surf. Sci., 2018, 445, 424–436 CrossRef CAS.
- U. Patel, B. Parmar, A. Dadhania and E. Suresh, Inorg. Chem., 2021, 60, 9181–9191 CrossRef CAS PubMed.
- B. Parmar, K. K. Bisht, G. Rajput and E. Suresh, Dalton Trans., 2021, 50, 3083–3108 RSC.
- U. Patel, B. Parmar, P. Patel, A. Dadhania and E. Suresh, Mater. Chem. Front., 2021, 5, 304–314 RSC.
- H. Du, Y. Zhang, H. Jiang and H. Wang, Environ. Technol. Innovation, 2022, 27, 102495 CrossRef CAS.
- Y. Xia, S. Niu and J. Yu, Sci. Total Environ., 2023, 887, 164008 CrossRef CAS PubMed.
- K. M. V. Nguyen, A. V. N. Phan, N. T. Dang, T. Q. Tran, H. K. Duong, H. N. Nguyen and M. V. Nguyen, Mater. Adv., 2023, 4, 2636–2647 RSC.
- H. V. Le, N. T. Dao, H. T. Bui, P. T. Kim Le, K. A. Le, A. T. Tuong Tran, K. D. Nguyen, H. H. Mai Nguyen and P. H. Ho, ACS Omega, 2023, 8, 33412–33425 CrossRef CAS PubMed.
Footnote |
| † Electronic supplementary information (ESI) available: Table S1: basic information of employed organic dyes; Fig. S1–S3: FT-IR, 1H-NMR, and TGA profiles of MOF-808 and its defective derivative; Fig. S4–S7: adsorption models of the adsorption processes; Tables S2 and S3: coefficients of adsorption models; Fig. S8: UV-Vis spectra of quinoline yellow-rhodamine B mixtures in the presence of 200 ppm for each dye at various time intervals employing MOF-808 and MOF-808-S as adsorbents. See DOI: https://doi.org/10.1039/d4ra02803a |
| This journal is © The Royal Society of Chemistry 2024 |

