 Open Access Article
Synergistic effects (adsorption and biodegradation) of Streptomyces hydrogenans immobilization on nano-reed biochar for further application in upflow anaerobic sludge blanket
Aya Mohameda,
Sahar EL-Shatoury b,
Ahmed Aboulfotohc,
Khaled A. Abd El-Rahemd and
Abeer El Shahawy
 *a
*a
aDepartment of Civil Engineering, Faculty of Engineering, Suez Canal University, P.O. Box 41522, Ismailia, Egypt. E-mail: aya_mohamed@eng.suez.edu.eg; abeer_shahawi@eng.suez.edu.eg
bBotany and Microbiology Dept, Faculty of Science, Suez Canal University, Box 41522, Ismailia, Egypt. E-mail: sahar_hassan@science.suez.edu.eg
cEnvironmental Engineering Department, Faculty of Engineering, Zagazig University, Box Number 44519, Egypt. E-mail: Asalem@zu.edu.eg; aseaf_1@yahoo.com
dChemistry Department, Faculty of Science, Al-Azhar University, Assiut Branch P.O. Box 71524, Egypt. E-mail: khaledali_npp@yahoo.com
First published on 19th July 2024
Abstract
Water pollution due to wastewater is a serious issue that needs to be studied as many organic compounds are released from wastewater, affecting the ecosystem. Therefore, appropriate treatment methods should be used to prevent these effects. Phragmites australis biochar immobilized with bacteria was prepared in this study for use as an adsorbent in a pilot-scale up-flow anaerobic sludge blanket (UASB) to remove organic matter from wastewater in a buffalo farm. Combining reed biochar and immobilized Streptomyces hydrogenans introduces a synergistic effect: reed biochar serves as a substrate for microbial colonization and provides a conducive environment for microbial growth while Streptomyces hydrogenans, immobilized on the biochar, enhances the degradation of organic matter through its metabolic activities. Suitable techniques were employed, including infrared spectroscopy (FTIR) to determine the functional groups before and after adsorption, scanning electron microscopy (SEM) to determine the morphology of the composite before and after adsorption, X-ray diffraction (XRD) to examine the mineralogical changes through reflectometry, high-resolution diffraction and Brunauer–Emmett–Teller (BET) analyses to determine the surface area that always carried out by nitrogen adsorption/desorption technique based on the BET isotherm. Two-level factorial design experiments optimized using biochar, immobilized with bacteria, were employed to enhance the UASB performance. Chemical oxygen demand (COD) removal and biogas production were studied as a function of four experimental parameters: biochar dose, buffalo sludge dose, pH, and bacteria type. The buffalo sludge (manure) dose negatively affected the model's performance. The results showed better COD removal with Streptomyces hydrogenans S11 inoculation. The optimum biochar dose, buffalo sludge dose, and pH were 20 g L−1, 0%, and 7.5, respectively. The COD removal efficiency under these experimental conditions reached 92.70% with a biogas production of 5.0 mL. The experimental results of a validated point from the model were 90.80% for COD removal ratio and 4.80 mL for biogas production at 2 g L−1 biochar dose, 0% buffalo sludge dose, and pH 7.5 using Streptomyces hydrogenans S11 bacteria. A buffalo wastewater (BWW) anaerobic digestion experimental model was best fitted to the data under optimal conditions. This study aligns with the United Nations Sustainable Development Goals (SDGs), specifically SDG 6 (clean water and sanitation) and SDG 12 (responsible consumption and production). The implications of our work extend to large-scale applications, promising a greener and more sustainable future for wastewater treatment.
1. Introduction
In the past two decades, with global population growth, the demand for water for both human consumption and industrial use have increased, leading to higher wastewater volumes being discharged into the aquatic environment.1,2 Household sewage is a complicated wastewater type that includes solid particles and dissolved organic matter. Organic polymers such as carbohydrates, lipids, and proteins account for 30–70% of domestic sewage's particulate chemical oxygen demand (CODP). These organic particles have slow kinetic degradation and can reduce the effectiveness of treatment methods.Sewage treatment using conventional methods, such as primary sedimentation and secondary aerobic biological treatment, is highly efficient. This efficiency, however, necessitates high initial investment, ongoing maintenance, and cutting-edge technology.3,4 If discharged into the receiving waters, domestic wastewater's environmental impact is significant enough to warrant the extensive documentation of domestic sewage treatment.5,6 In addition, there is a severe lack of potable water.5,7 Wastewater can be treated in several ways including coagulation–flocculation,8,9 infiltration-percolation,10,11 bentonite treatments,12 aerobic treatment,13 and anaerobic treatment.14,15 Based on the above, it is clear that anaerobic digestion is an appropriate and cost-effective solution for domestic wastewater treatment in most developing countries.16 Several reasons, like the anaerobic process, have some advantages over the more common aerobic ones.17,18 The ability to perform the process in a decentralized manner means that this application has the potential to significantly reduce the investment costs of sewage treatment plants.1,19 The majority of recent research on anaerobic treatment has centered on adsorption processes.20 For developing regions, adsorption works well as it is simple to use, can be regenerated, and produces little toxic sludge.7 It is generally agreed that the lower investment cost and smaller environmental impact of the processes based on naturally occurring, locally available adsorbents make them more accessible for developing countries according to the release of carbon dioxide.20
Solid adsorbent captures pollutants via adsorption at its surface's active sites. Previous studies have utilized clays, zeolites, and activated carbon, with activated carbon being especially popular for removing micro-pollutants from water during purification.6,7,21 Sustainable substrates, such as biochar, can be produced locally using residual biomass and carefully managed pyrolysis conditions. Biochar is considered economical and environmentally friendly due to its large surface area, high porosity, functional groups, high cation exchange capacity, stability, and reusability.1,21 Phragmites australis (Pa) biomass is a prevalent and dominant plant species in many aquatic ecosystems, known for its high concentrations of lignin and cellulose. As an abundant and renewable non-food resource, lignocellulosic biomass like Pa is ideal for biochar production. The major components of lignocellulosic biomass cellulose (38.1%), hemicellulose (30.6%), and lignin (21.3%) result in biochar with varying properties, such as specific surface area and pore size, due to differences in the thermal decomposition behaviors. In the North Delta, Egypt, Pa grows aggressively and invasively around lakes, ponds, riverbanks, and canals.22 Since it has no economic value as food or animal feed, it is considered a low-value resource.
The goal of microbial wastewater treatment is to decompose the organic material in wastewater via the metabolic activity of microorganisms. However, there are certain drawbacks to microbial bioremediation employing free cells, including (a) the potential for high contaminant concentrations to be harmful to microorganisms, (b) competition with native microbiota, (c) a lack of nutrition in the polluted medium, (d) and microbial survival and multiplication.23 Microorganisms can be immobilized in a variety of solid matrices, including polyvinyl alcohol, silica, diatomite, bentonite, alginate, nanoparticles, zeolite, and biochar, to get around these problems. These matrices increase the process operational stability and increase the ability to recover and reuse microorganism materials.24 Microbial immobilization technology uses physicochemical methods to permanently attach microorganisms to designated carriers, extending their viability and maintaining cell activity.20 One particularly interesting potential transport material for microbes is biochar, a highly stable and carbon-rich product obtained from the pyrolysis of different biomasses.23 Biochar's high porosity and good adsorption effect make it a useful carrier for immobilizing microorganisms.25 Treatment with bacteria and biochar was more effective than with bacteria alone or biochar only for removing polycyclic aromatic hydrocarbons.19,26 Sludge biochar immobilized Enterobacter sp., which removed 60.85% of COD.27 It was discovered that the Pseudomonas hibiscicola L1 strain immobilized on peanut shell biochar (PBC) could efficiently remove both metals and organic matter from wastewater.
Because of its capacity to adsorb and biodegrade a variety of pollutants through the material's and microorganisms' synergistic effects, biochar thus emerges as a superior microbial carrier for bioremediation applications, enhancing the decontamination efficiency.28,29 This study endeavours to assess the effectiveness of a newly introduced natural bio-adsorbent in eliminating COD from wastewater through an experimental design for modelling and enhancing the process. To investigate the separation and combined effects of four crucial parameters on COD removal, we used a full 24-factorial design that included both low and high level doses of biochar, inoculum amounts, pH levels, and different types of bacteria. In alignment with the United Nations Sustainable Development Goals (SDGs), this study supports SDG 6 (Clean Water and Sanitation) and SDG 12 (Responsible Consumption and Production) by developing sustainable methods for wastewater treatment and organic matter removal.
2. Materials & methods
2.1. Water source
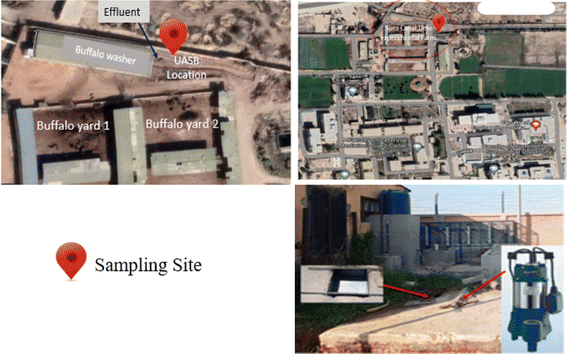
Daily, a huge number of buffaloes were brought to be cleaned before being milked in a buffalo washer placed at the farm of the Faculty of Veterinary at Suez Canal University, Ismailia, Egypt (as shown in Fig. 1). The effluent wastewater was collected on an underground tank (capacity 8 m3). Selected parameters were assessed at Suez Canal University's Centre for Environmental Studies and Consultants in Ismailia, Egypt. The received wastewater grab samples were taken from a depth of one meter in the Centre of the ground tank in a clean, colourless, sterilized bottle with a plastic stopper.2.2. Preparation of Phragmites australis biochar
Phragmites australis was collected at the Suez Canal University Veterinary Experimental Farm in Ismailia, Egypt. The collected Phragmites australis were cut into 5–10 cm pieces, followed by rinsing with clean water several times until the filtered water was clear. Then, the pieces were rinsed again with distilled water three times and put in an oven (WHL-25A, TAISITE, Tianjin, China) to dry at 105 °C for 12 h. The dried reed biomass was fully ground and sieved (100 mesh sieve with an aperture of 0.15 mm), placed in a sample bag, and moved into a desiccator for use. Slow pyrolysis accomplished biochar preparation because it yields more biochar and has a greater carbon content overall.30 The temperature was held at 300 °C for two hours after the heating rate was adjusted to 10 °C min−1. These samples were heated and then allowed to cool naturally to room temperature. The selection of low-temperature biochar (300 °C) was based on two primary considerations: firstly, temperatures exceeding 300 °C impeded the ability of Gram-negative bacteria to communicate with one another, and secondly, high-temperature biochar increased the production of persistent free radicals (PFR).312.3. Preparation of manure
Animal manure of animal origin is a source of methanogenic microbial consortia. A fresh sample of buffalo droppings was collected from a buffalo yard with a 2-in-1 litter closed clean jar from a farm for veterinary research at Suez Canal University, Ismailia, Egypt. To create an anaerobic digester, we used two plastic containers, each of which was initially charged with 500 g of buffalo dung slurry diluted to 4![[thin space (1/6-em)]](https://www.rsc.org/images/entities/char_2009.gif) :
:![[thin space (1/6-em)]](https://www.rsc.org/images/entities/char_2009.gif) 5 (w/v) with tap water to 8–10% total solids.32
5 (w/v) with tap water to 8–10% total solids.32
Manure was prepared by incubating it at 37 °C in an airtight plastic container for three weeks before use in lab batch experiments.33,34
2.4. Media preparation
10 g soluble starch, 0.3 g casein, 2 g KNO3, 2 g NaCl, 2 g K2HPO4, 0.05 g MgSO4·7H2O, 0.02 g CaCO3, 0.01 g FeSO4·7H2O, and 15 g agar were dissolved in 1000 mL of distilled water to make starch casein agar medium (for Streptomyces sp. cultivation). For Pseudomonas sp. 1 cultivation, a nutrient agar medium was prepared by dissolving 28 g of nutrient agar in 1000 mL of distilled water. The pH of both the media was adjusted with a digital pH meter (Adwa AD 1030 pH Benchtop Meter) to 7.0 ± 0.5. There, 15 minutes were spent sterilizing the media at 121 °C. Finally, 20–25 mL of the sterile starch casein agar medium was poured onto sterile Petri plates in the microbiological hood and allowed to solidify at room temperature.2.5. Cultivation of the bacterial strains
Bacterial strains were chosen for this study based on their history of being isolated from industrial effluent and their demonstrated capacity for degradation.35 Both strains, Streptomyces hydrogenans S11 and Pseudomonas sp. 1, were provided as freeze-dried cultures from the Actinomycetes' Lab, Faculty of Science, Suez Canal University. Aliquots of 0.01 mL were inoculated onto the appropriate medium using the spread plate method and incubated until complete maturity in FISHER ISOTEMP 200 ERIES incubators. The incubation conditions were 28 °C, 14 days and 37 °C, 1 day for the Streptomyces hydrogenans S11 and Pseudomonas sp. 1 strains, respectively.2.6. Physiochemical analysis of wastewater
As shown in Table 1, a wastewater grab sample was analyzed for the physiochemical–biological parameters like pH, COD, BOD, TDS, TSS, NH3, color, turbidity, and alkalinity using the methods outlined in “standard methods for the examination of water and wastewater” by the American Public Health Association (APHA, 2017).36,37 Daily, the liquid displacement method would estimate the methane volume produced.38,39| Wastewater quality | Standard method |
|---|---|
| pH | pH meter (Adwa AD 1030 pH Benchtop meter) |
| NH3 | Multiparameter-Photometer (Hanna HI83303) |
| COD | Closed reflux, colorimetric method |
| BOD | 5 days incubation at 20 °C |
| Total dissolved solid | Dissolved solids dried at 103–105 °C |
| Total suspended solid | Suspended solids dried at 103–105 °C |
| Colour | Digital colorimeter (HI8424 Portable pH/ORP Meter) |
| Turbidity | Digital Nephelometer (Orbeco-Hellige® USA) |
2.7. Physiochemical analysis of Phragmites australis biochar
The elemental chemistry analysis of Phragmites australis biochar was carried out by the UATRS division of the National Center for Scientific Research using an “Axion” X-ray fluorescence spectrometer with a 1 kW wavelength dispersion. A Bruker Co. model D8 X-ray diffraction (XRD) instrument was used to examine the mineralogical changes (through reflectometry, high-resolution diffraction, in-plane grazing incidence diffraction (IP-GID), small-angle X-ray scattering (SAXS), and residual stress and texture analyses). A scanning electron microscope (SEM) equipped with an energy-dispersive X-ray (EDX) spectrometer was used to characterize the pre- and post-adsorption morphologies of the Phragmites australis biochar.The microscope was a Philips XL 30 that was run under low vacuum and 30 kV. Using a Brunner–Emmett–Teller (BET) analyzer made by the American firm Quanta Chrome Company, we determined the surface area, pore size, and pore volume of the sample both before and after adsorption. Standard volumetric methods involving nitrogen adsorption at 77 K were used to take the readings. Functional groups in Phragmites australis biochar were determined using Fourier-transformed infrared spectroscopy on a PerkinElmer 1720-x spectrometer (FTIR). The spectra were scanned between 4000 and 400 cm−1 with a resolution of 2.00 cm−1 on potassium bromide pelletized samples containing 1 mg of product per 100 mg of KBr.
2.8. Modeling and optimization
The experimental designs used a full-factorial design 24 to maximize the effective independent variables on COD removal efficiency and biogas production while minimizing the experimental error. As the influencing variables, two levels of biochar dose (2 and 20 g L−1), buffalo sludge dose (0 and 5%), pH (5.5 and 7.5), and bacteria type (Pseudomonas sp. 1 and Streptomyces hydrogenans S11) were chosen. Minitab 18 was used to statistically analyze the data and produce graphical representations of the effect and interaction of the specified independent variables.2.9. Experimental set-up
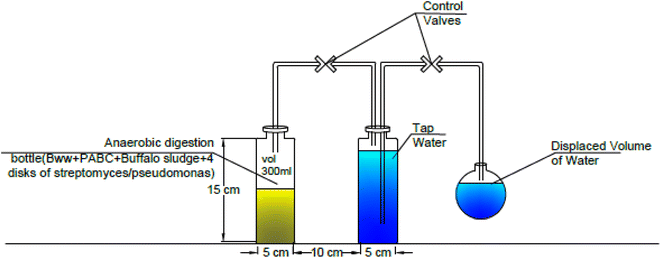
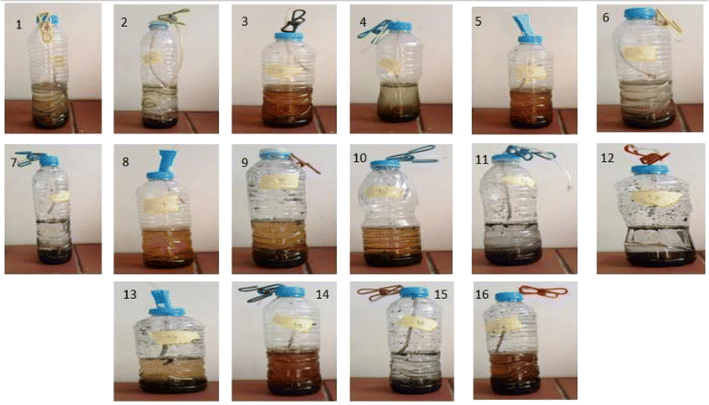
A lab-scale experiment was performed using sixteen plastic container digesters under static conditions, with 600 mL of each digester. At the same time, the working volume was 300 mL of buffalo wastewater mixed with Phragmites australis biochar immobilized with four disks of Streptomyces hydrogenans S11 with 5.5 × 10⁶ CFU, Pseudomonas sp. 1 with 5.5 × 10⁶ CFU, and buffalo sludge. The immobilization of the bacteria onto the biochar was done by simply mixing the bacterial culture with the biochar, allowing the bacteria to adhere to the surface of the biochar particles through physical adsorption. This can be facilitated by incubating the biochar and bacterial suspension together under gentle agitation. Bacteria naturally form biofilms on the solid surfaces (biochar). Biofilms are communities of bacteria encased in a self-produced matrix of extracellular polymeric substances (EPS), which can adhere to the biochar surface and provide a stable immobilization matrix.29 The volume of produced biogas was measured by the water displacement method, as shown in Fig. 2. A plastic pipe (biogas pipe) connected each digester to the water chamber (made of plastic bottles). This lets the biogas flow into the water chamber. Another plastic hose collected the biogas in a tightened balloon fitted with an M-seal air seal. The gas pipe was put in from both ends, just above the digester and the water chamber. It was also put in from the top of the balloon collector to the water chamber (Fig. 3). The experiments were run at room temperature (37 °C). All studies were conducted under distinct settings with two levels of relevant parameters, including biochar dose, buffalo sludge dose, pH, and bacteria types (Fig. 4). | ||
| Fig. 2 (a) Gram stained Pseudomonas sp. 1, (b) pyrolysis reactor, and (c) Streptomyces hydrogenans S11. | ||
3. Results and discussion
3.1. Wastewater characterization
Table 2 displays the most important characteristics of buffalo wastewater (BWW). Both ref. 40 and 41 came to the same conclusion. The pH value of the sample was very high in the alkaline range (8.15). As a result of the microorganisms' ability to proliferate at such alkaline pH, the biological therapy of BWW is particularly effective. According to numerous publications,1,42 BWW is high in organic matter, as measured by COD (2050 g L−1). Because of the high organic load, biological filtration is extremely difficult.| Parameters | A | B | C |
|---|---|---|---|
| a (A) Suez Canal Farm BWW; (B); ref. 40 (C) ref. 41. | |||
| pH | 8.15 ± 0.10 | 6.89 | 7.3 |
| TSS (mg L−1) | 1388 ± 0.21 | 3100 | — |
| TDS (mg L−1) | 1060 ± 0.11 | — | — |
| BOD (mg L−1) | 980 ± 0.15 | — | 1454 |
| COD (mg L−1) | 2050 ± 0.20 | 2648 | 5065 |
| TN (mg L−1) | — | 26.39 | — |
| TP (mg L−1) | 5.7 ± 0.01 | 11.27 | 886 |
| Alkalinity (mg L−1) | 317 ± 0.12 | — | — |
| Color, PCU | 380 ± 0.03 | — | — |
| Turbidity, NTU | 45 ± 0.05 | — | — |
3.2. Phragmites australis biochar characterization
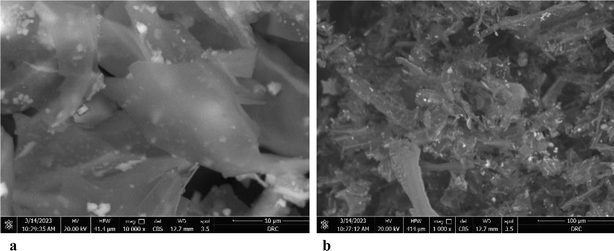 | ||
| Fig. 6 (a) SEM of Phragmites australis biochar before adsorption. (b) SEM of Phragmites australis biochar after adsorption. | ||
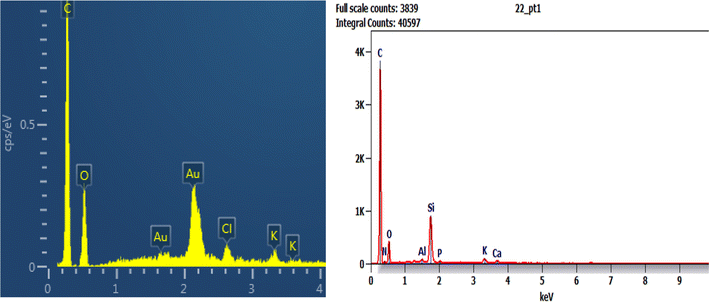
The EDX result of Phragmites australis biochar before adsorption (Fig. 7a) shows that it contains C, O & Cl wt% of 75.61, 18.31, and 2.9, respectively. After adsorption is shown in Fig. 7b for buffalo wastewater, C 55.2 was reduced, O 21.1 increased, and N, Al, Si, P, K, and Ca were found. The nitrogen and oxygen were reduced, and Al, Si, phosphorous, calcium, K, S, and Cl were found as a component in water that was used for treatment.
| Constituents | (wt%) |
|---|---|
| Na2O (wt%) | 0.0 |
| MgO (wt%) | 1.41 |
| Al2O3 (wt%) | 4.32 |
| SiO2 (wt%) | 21.40 |
| P2O5 (wt%) | 1.44 |
| Cl (wt%) | 2.81 |
| Br (wt%) | 0.00 |
| K2O (wt%) | 5.86 |
| CaO (wt%) | 1.52 |
| Fe2O3tot. (wt%) | 0.826 |
| SO3 (wt%) | 2.19 |
| Zn (wt%) | 0.0674 |
| Sr (wt%) | 0.0123 |
| L. O. I. (wt%) | 58.10 |
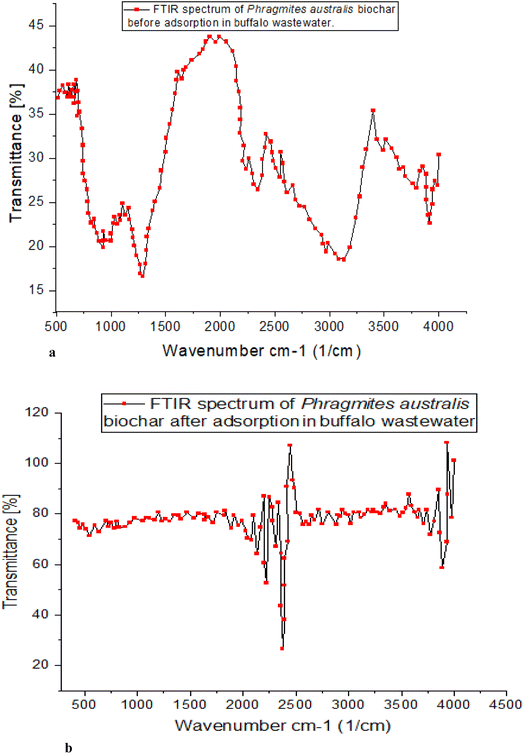
![[double bond, length as m-dash]](https://www.rsc.org/images/entities/char_e001.gif) O and C–O bonds and the carboxylate group's other interactions. The 744 cm−1 peak represents the angular deformation of C
O and C–O bonds and the carboxylate group's other interactions. The 744 cm−1 peak represents the angular deformation of C![[double bond, length as m-dash]](https://www.rsc.org/images/entities/char_e001.gif) C, while the 1107 cm−1 peak represents the axial deformation of C–O. The adsorption process is driven by interactions between the phenolic O–H bonds and the unsaturated aliphatic structures, both functional groups.
C, while the 1107 cm−1 peak represents the axial deformation of C–O. The adsorption process is driven by interactions between the phenolic O–H bonds and the unsaturated aliphatic structures, both functional groups.
Similar bands between 1393 and 1107 cm−1 (C–O) were found in the study employing peanut shell adsorbent. The study also discovered intense bands at 1107 cm−1 (due to the elongation of phenolic compounds) and thin bands in the 1393 cm−1 range. Carboxylate groups, if present, could increase the efficiency with which various contaminants are adsorbed, as indicated by the FTIR spectrum. The bands at 3415 cm−1 represent vibrations in cellulose's O–H groups. The absorption bands in the spectra at 2920 cm−1 were used to identify methylcellulose as these bands are characteristic of the (C–H) and (C–H), highly electronegative in the ortho position, both of which are present in the raw material. A new peak at 875 cm−1 was discovered following carbonization, corresponding to angular distortion outside the plane of C–H, most likely due to cellulose degradation. In the adsorbent, the band shift was measured to be from 1618 to 1417 cm−1. Their interactions with the carboxyl group and lignin's C![[double bond, length as m-dash]](https://www.rsc.org/images/entities/char_e001.gif) O and C–O bonds are related.
O and C–O bonds are related.
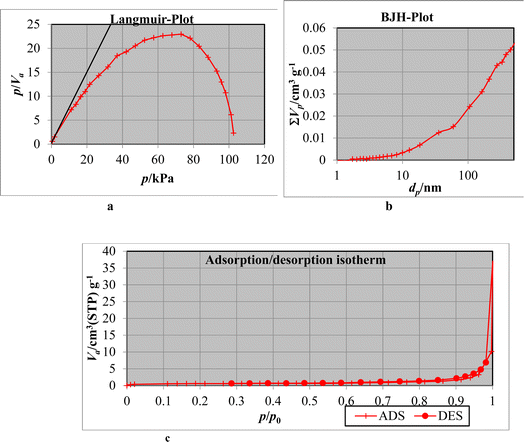 | ||
| Fig. 9 (a) Langmuir plot after adsorption. (b) BJH-plot after adsorption. (c) N2 adsorption/desorption isotherm of Phragmites australis biochar. | ||
| Surface area SBET, m2 g−1 | Pore volume, cc g−1 | Pore size, nm | |
|---|---|---|---|
| Before adsorption | 3.22 | 211.58 | 28.55 |
| After adsorption | 2.1153 | 198.81 | 25.62 |
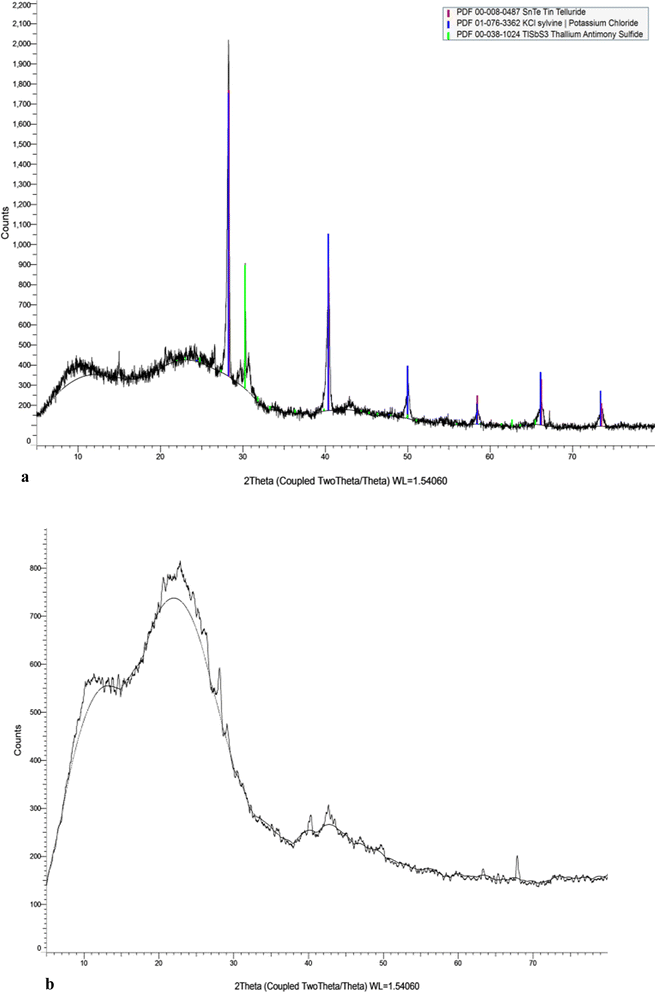
On the contrary, after ions adsorption, the surface area (2.1153 m2 g−1), pore volume (198.81 cc g−1), and pore size (25.62 nm), the results are decreased because of pore-blocking with phosphate ions. The results showed that the Phragmites australis powerfully absorb phosphate ions and metals. Biochar's negatively charged surface promotes the adsorption of positively charged molecules, making it useful in water and wastewater purification.
3.3. Optimization of organic matter biodegradation
In this study, 16 separate experiments were conducted, each involving two levels of four different variables: Biochar dose “A” (2 and 20 g L−1), buffalo sludge dose “B” (0 and 5%), pH “C” (5.5 and 7.5), and type of bacteria “D” (Pseudomonas sp. 1 and Streptomyces sp.). Table 5 displays the average COD removal efficiency for the real and coded factors design.| Run | Real values | Coded value | Response (%) | ||||||
|---|---|---|---|---|---|---|---|---|---|
| Biochar dose (A) | Buffalo sludge dose (B) | pH (C) | Type of bacteria (D) | A | B | C | D | COD | |
| 1 | 2 | 0 | 7.5 | Pseudomonas | — | + | + | + | 79.46% |
| 2 | 2 | 0 | 5.5 | Streptomyces | + | — | — | — | 88.65% |
| 3 | 2 | 5 | 5.5 | Streptomyces | — | — | — | — | 81.35% |
| 4 | 2 | 0 | 7.5 | Streptomyces | — | — | + | — | 90.81% |
| 5 | 2 | 5 | 5.5 | Pseudomonas | + | + | — | + | 42.97% |
| 6 | 2 | 0 | 5.5 | Pseudomonas | + | + | — | — | 37.84% |
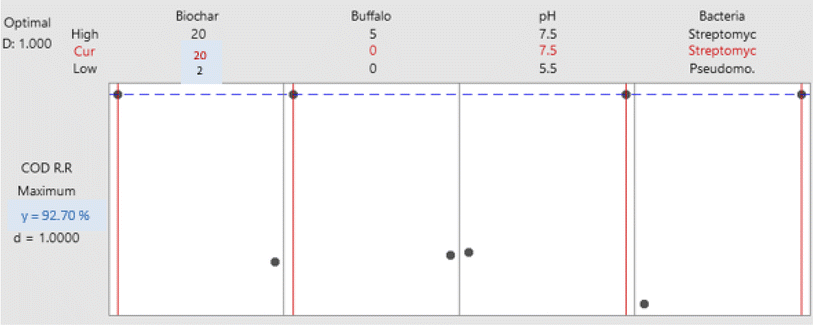
| 7 | 20 | 0 | 7.5 | Streptomyces | + | — | + | + | 92.70% |
| 8 | 2 | 5 | 7.5 | Streptomyces | — | — | — | + | 87.03% |
| 9 | 20 | 5 | 5.5 | Streptomyces | + | + | + | — | 45.68% |
| 10 | 20 | 5 | 7.5 | Streptomyces | + | + | + | + | 42.97% |
| 11 | 20 | 0 | 5.5 | Streptomyces | + | — | + | — | 45.95% |
| 12 | 20 | 0 | 7.5 | Pseudomonas | — | — | + | + | 35.00% |
| 13 | 20 | 5 | 5.5 | Pseudomonas | + | — | — | + | 22.97% |
| 14 | 2 | 5 | 7.5 | Pseudomonas | — | + | + | — | 40.27% |
| 15 | 20 | 0 | 5.5 | Pseudomonas | — | + | — | + | 26.22% |
| 16 | 20 | 5 | 7.5 | Pseudomonas | — | + | — | — | 27.00% |
| Source | DF | Seq SS | Contribution | Adj S.S. | Adj MS | F-value | P-value |
|---|---|---|---|---|---|---|---|
| Model | 5 | 0.90326 | 88.91% | 0.90326 | 0.18065 | 16.03 | 0.000 |
| Linear | 4 | 0.84682 | 83.35% | 0.84682 | 0.21170 | 18.79 | 0.000 |
| Biochar dose | 1 | 0.27534 | 27.10% | 0.27534 | 0.27534 | 24.43 | 0.001 |
| Buffalo sludge dose | 1 | 0.07073 | 6.96% | 0.07073 | 0.07073 | 6.28 | 0.031 |
| pH | 1 | 0.06711 | 6.61% | 0.06711 | 0.06711 | 5.95 | 0.035 |
| Type of bacteria | 1 | 0.43364 | 42.68% | 0.43364 | 0.43364 | 38.48 | 0.00001 |
| 2-way interactions | 1 | 0.05644 | 5.56% | 0.05644 | 0.05644 | 5.01 | 0.049 |
| Buffalo sludge dose *pH | 1 | 0.05644 | 5.56% | 0.05644 | 0.05644 | 5.01 | 0.049 |
| Error | 10 | 0.11270 | 11.09% | 0.11270 | 0.01127 | ||
| Total | 15 | 1.01595 | 100.00% |
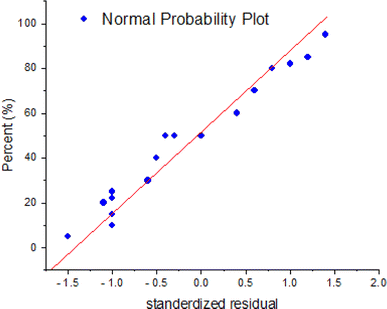
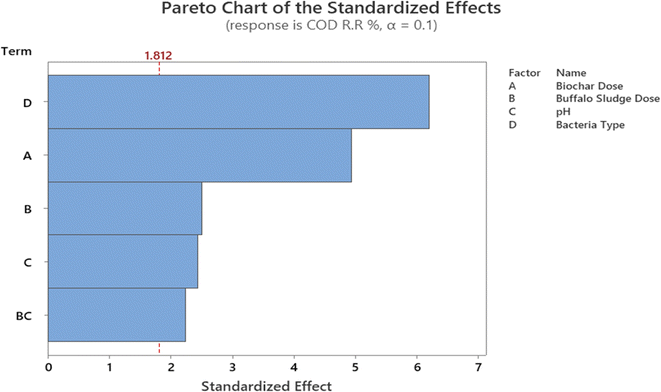
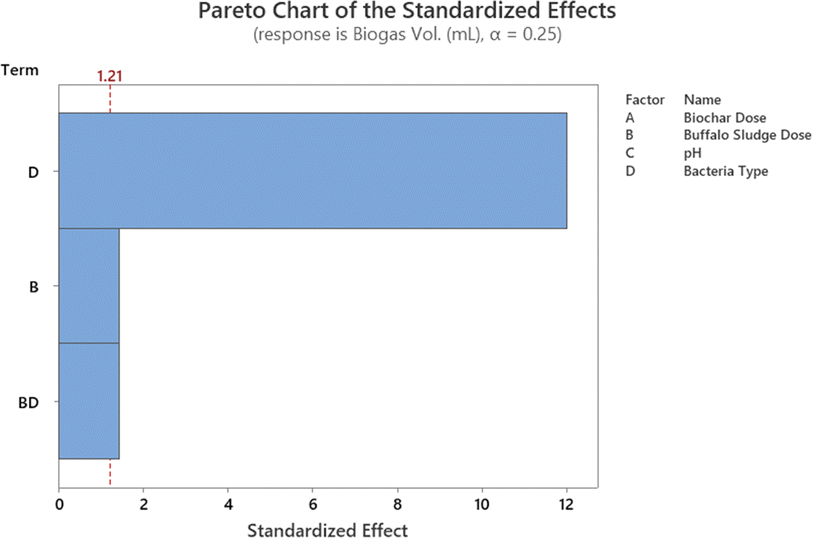
In addition, the Pareto chart provides a visual representation of these findings (Fig. 11). The Pareto chart revealed that the parameters D, A, B, C, and B. C are significant because they have an absolute value that is greater than 1.812; this can be observed (dashed line). Similar findings have been reported by ref. 47. The findings are comparable with ref. 47. Everything in the model works as it should (R2 is higher than 85.0%).
In eqn (1), the obtained mathematical model portrayed the COD removal as a function of these parameters and their associated coefficients.
| COD (%) = −0.026 − 0.01458A − 0.1278B + 0.1242C + 0.00001646D − 0.0238B × C | (1) |
Streptomyces sp. tend to grow better at a slightly alkaline pH (about 7.5) compared to an acidic pH (about 5.5) due to factors such as optimal enzyme activity, pH stability, improved nutrient availability, reduced competition with other microorganisms and minimized stress on cell membranes.48 However, it is crucial to consider the unique pH preferences of different Streptomyces sp. species and strains when applying this knowledge to large-scale applications in the future as these preferences can vary significantly.
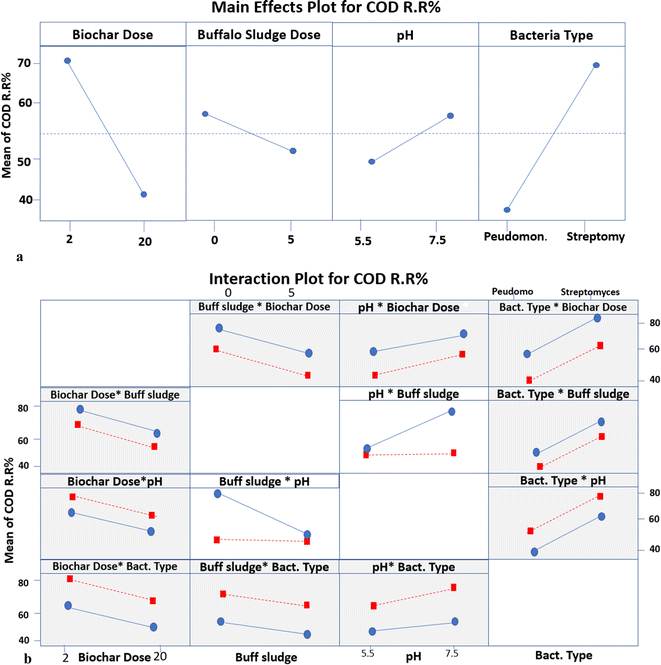 | ||
| Fig. 12 (a) The main effects plot for different parameters of COD RR. (b) Interaction plot for different parameters of COD RR. | ||
Meanwhile, the mean COD RR makes no difference because it is a horizontal line at 50% with an increase in the pH value from 5.5 to 7.5 at 5% buffalo sludge feed. Still, the difference in the buffalo sludge dose affects the removal of the chemical oxygen demand, as illustrated in Fig. 12a and b. The present results of this study are supported by the results obtained by ref. 50; the use of livestock manure in anaerobic digestion led to a decrease in the percentage of chemical oxygen demand up to 38%.
3.4. Optimization of biogas production
| Source | DF | Seq SS | Contribution | Adj S.S. | Adj MS | F-Value | P-Value |
|---|---|---|---|---|---|---|---|
| Model | 10 | 41.8750 | 96.40% | 41.8750 | 4.1875 | 13.40 | 0.005 |
| Linear | 4 | 39.9375 | 91.94% | 39.9375 | 9.9844 | 31.95 | 0.001 |
| BC dose | 1 | 0.2500 | 0.58% | 0.2500 | 0.2500 | 0.80 | 0.412 |
| Buffalo sludge dose | 1 | 0.5625 | 1.29% | 0.5625 | 0.5625 | 1.80 | 0.237 |
| pH | 1 | 0.0625 | 0.14% | 0.0625 | 0.0625 | 0.20 | 0.673 |
| Type of bact. | 1 | 39.0625 | 89.93% | 39.0625 | 39.0625 | 125.00 | 0.00001 |
| 2-way interactions | 6 | 1.9375 | 4.46% | 1.9375 | 0.3229 | 1.03 | 0.496 |
| BC dose × buffalo sludge dose | 1 | 0.2500 | 0.58% | 0.2500 | 0.2500 | 0.80 | 0.412 |
| BC dose × pH | 1 | 0.2500 | 0.58% | 0.2500 | 0.2500 | 0.80 | 0.412 |
| BC dose × type of bact. | 1 | 0.2500 | 0.58% | 0.2500 | 0.2500 | 0.80 | 0.412 |
| Buffalo sludge dose × pH | 1 | 0.5625 | 1.29% | 0.5625 | 0.5625 | 1.80 | 0.237 |
| Buffalo sludge dose × type of bact. | 1 | 0.5625 | 1.29% | 0.5625 | 0.5625 | 1.80 | 0.237 |
| pH × type of bact. | 1 | 0.0625 | 0.14% | 0.0625 | 0.0625 | 0.20 | 0.673 |
| Error | 5 | 1.5625 | 3.60% | 1.5625 | 0.3125 | ||
| Total | 15 | 43.4375 | 100.00% |
Biogas production was modelled mathematically as a function of several parameters and their associated coefficients, as shown in eqn (2).
| Biogas vol. = 2.62 − 0.090A + 0.501B + 0.097C + 2.309D + 0.00556A × B + 0.0139A × C − 0.0139A × D − 0.0750B × C − 0.0750B × D − 0.062C × D | (2) |
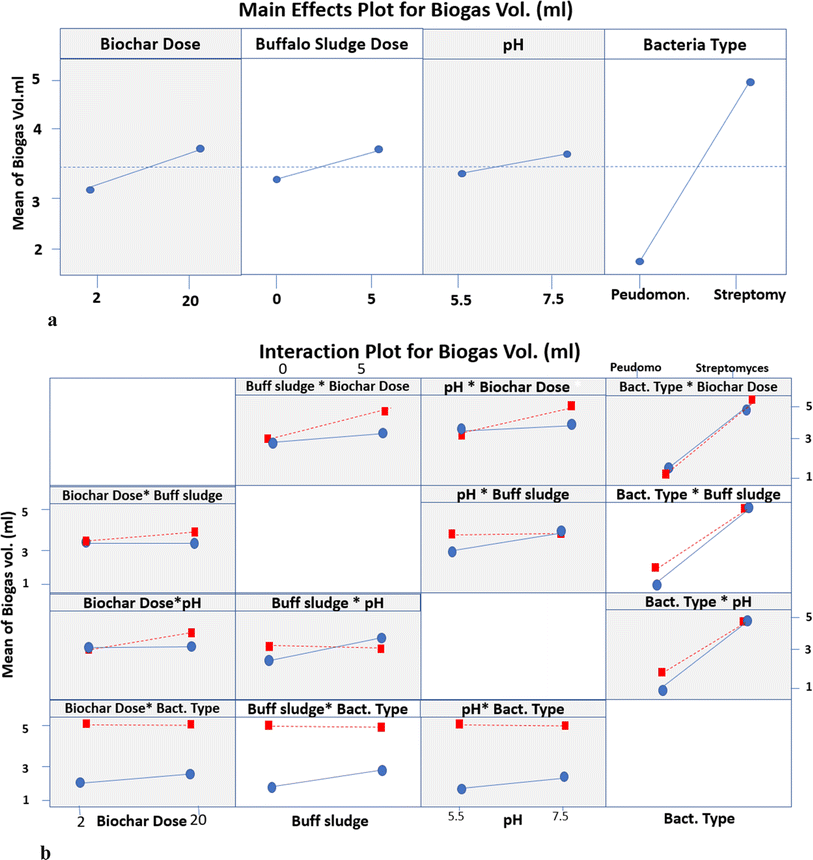 | ||
| Fig. 15 (a) The main effects plot for biogas volume. (b) Interaction plot for different parameters of biogas production. | ||
3.4.2.1. Interaction between biochar dose and buffalo sludge dose. The mean biogas volume makes no difference because it is a horizontal line at 3.33 mL with 0% buffalo sludge feed at a biochar dose ranging from 2 to 20 g L−1. The biogas volume increased from 3.33 to 4.13 mL with a buffalo sludge feed of 5% at a biochar dose of 20 g L−1. This can be attributed to the increase in the surface area due to increased biochar dose and buffalo sludge feed. This allowed anaerobic degradation to increase the organic matter and increase biogas volume production.
3.4.2.2. Interaction between biochar dose and pH. The mean biogas volume makes no difference because it is a horizontal line at 3.33 mL with a biochar dose increase from 2 to 20 g L−1 at pH 5.5. Meanwhile, the biogas volume increased from 3.33 to 3.50 mL with a biochar dose increase from 2 to 20 g L−1 at pH 7.5. It was a nearly constant value with no change with biochar increase. It can be interpreted that the indigenous bacteria survive at the normal pH of the wastewater source.
3.4.2.3. Interaction between biochar dose and type of bacteria. The mean biogas volume for Pseudomonas was 1.75 mL and 2.00 mL at Phragmites australis biochar doses of 2 g L−1 and 20 g L−1, respectively. It was a nearly constant value with no change with the increase in biochar dose. Meanwhile, the mean biogas volume of Streptomyces makes no difference because it is a horizontal line at 5.0 mL with a biochar dose increase from 2 to 20 g L−1. The biochar immobilized with the oxidizing bacterium (Streptomyces violarus strain SBP1) effectively removed the chemical oxygen demand (COD), which was attributed to the synergistic effects of biochar adsorption and biodegradation activities of the immobilized Streptomyces.
Streptomyces hydrogenans immobilization on nano-reed biochar improves the adsorption and biodegradation processes via a number of methods. The biochar's high porosity and surface area make it the perfect substrate for microbial colonization, which increases the biomass and activity. By shielding bacteria from external stimuli and concentrating the enzymatic activity, this structure promotes the creation of biofilms, improving the stability of biodegradation and effectiveness.20 By means of adsorption processes like hydrogen bonding and electrostatic attractions, functional groups on the surface of the biochar, such as hydroxyl, carboxyl, and phenolic groups, engage with contaminants and position them close to the bacteria for improved breakdown.29 Streptomyces hydrogenans produces extracellular enzymes that further break down complex chemicals, increasing the system's efficiency in removing pollutants.23,52
The maximum daily gas yield for the Phragmites australis biochar group was 9.15 ± 0.32 mL g−1 TS1, suggesting a 13.58% increase in the total gas production over the control group. The cumulative gas production of the group using Phragmites australis biochar increased by 13.58% on average.53
3.4.2.4. Interaction between buffalo sludge dose and pH. The mean biogas volume increased from 3.00 to 4.13 mL with an increase in the buffalo sludge feed from 0 to 5% at pH 5.5. Meanwhile, the mean biogas volume makes no difference because it is a horizontal line at 4.13 mL with increased buffalo sludge feed from 0 to 5% at pH 7.5. It can be interpreted that the indigenous bacteria survive at the normal pH of the wastewater source.
3.4.2.5. Interaction between buffalo sludge dose and type of bacteria. The mean biogas volume increased from 1.75 to 5.0 mL with 0% buffalo sludge feed and the type of bacteria ranging from Pseudomonas to Streptomyces, respectively. Meanwhile, the mean biogas volume increased from 2.70 to 5.0 mL with 5% buffalo sludge feed and the type of bacteria ranging from Pseudomonas to Streptomyces, respectively. Both Pseudomonas and Streptomyces bacteria contribute to biogas production, with Streptomyces showing a higher volume than Pseudomonas. The differences in biogas production are attributed to the microbial activities associated with the bacteria used and buffalo sludge, which likely provides additional organic material for anaerobic digestion, leading to increased biogas production. The present investigation results are supported by the results stated in ref. 54. It investigated the impact of adding Pseudomonas bacteria on biogas production from animal dung at an ambient temperature. Pseudomonas cells increased the methane production from 24.90 to 44.33%. Pseudomonas also helps in methane formation by forming biosurfactants that help better degrade fatty molecules in the anaerobic digester.
3.4.2.6. Interaction between pH and type of bacteria. The mean biogas volume increased from 1.75 to 5.0 mL with a 5.5 pH value and the types of bacteria ranging from Pseudomonas to Streptomyces, respectively. Meanwhile, the mean biogas volume increased from 1.80 to 5.0 mL with a 7.5 pH value at types of bacteria ranging from Pseudomonas to Streptomyces. This suggests that Streptomyces exhibit a pH-dependent response, with higher biogas production observed at a higher pH of 7.5. It can be interpreted that the indigenous bacteria survive at the normal pH of the wastewater source.
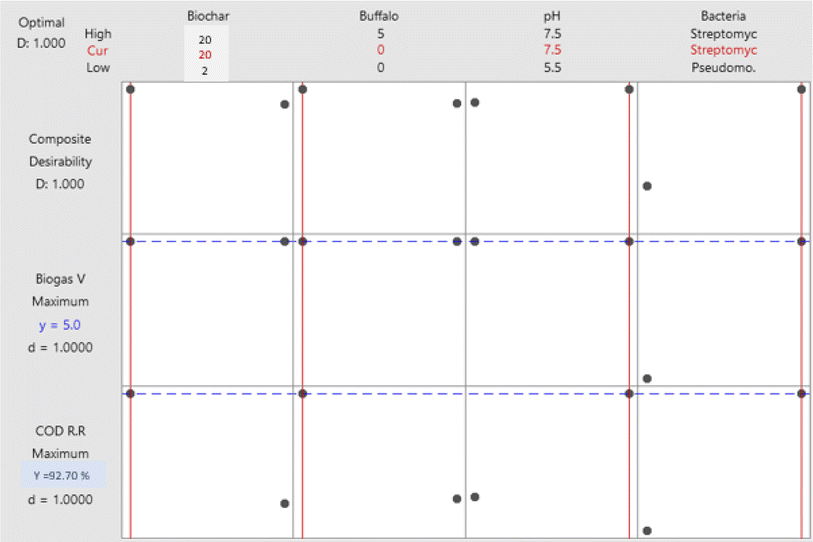
The biogas produced was tested for its methane content after the end of the batch operation. The total amount of biogas produced and the percentage of methane in the biogas are 5.0 mL and 50% CH4, respectively.
4. Conclusion
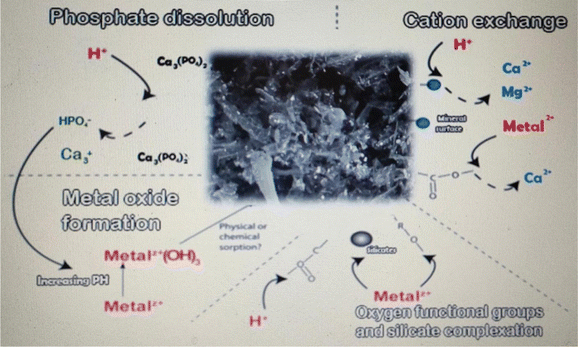
The focus of this study was to use the experimental design methodology to model the biodegradation of organic matter and the production of biogas from anaerobic digestion by the statistical analysis of data gathered regarding the impact of biochar dose, buffalo sludge dose, pH, and bacterial type. Both organic matter degradation and biogas productivity were statistically significant regarding the bacterial type. Optimized biochar dose, buffalo sludge dose, pH value, and type of bacteria were equal to 20 g L−1, 0%, 7.5, and Streptomyces hydrogenans S11, respectively. Under these test conditions, 92.7% was the most organic matter removed (COD removal%). The highest biogas yield (5.0 mL) was achieved with a biochar dose of 20 g L−1, a buffalo sludge dose of 0%, a pH of 7.5, and Streptomyces hydrogenans S11 as the predominant bacterial species. Buffalo wastewater (BWW) anaerobic digestion experimental model was best fitted to the data under the optimal conditions. BET analysis documented the nano range of Phragmites australis. The findings will be used widely in the development of continuous UASB reactors. XRD analysis recorded the high phosphate adsorption capacity of Phragmites australis, which needs further investigation. The diagrammatic representation of four processes were hypothesized to be significant in Phragmites australis biochar's acid neutralization and metal removal capacities. Direct binding to oxygen-containing functional groups and silicates, as well as cation exchange and the formation of metal oxides, are likely to play important roles in the removal of dissolved metals (Fig. 17: The authors have modified the figure documented in ref. 57 according to this study's findings). An increase in the pH appears to occur primarily through the dissolution of solid carbonate.Data availability
The datasets used and/or analyzed during the current study are available from the corresponding author upon reasonable request. All data generated or analyzed during this study are included in this published article.Author contributions
A. M., S. S., and A. S. initiated the study. A. M., S. S., A. A., K. R., and A. S. collected the materials and drafted the manuscript, which was critically commented on by A. M., S. S., A. A., K. R., and A. S. and further thoroughly revised by A. S. All the authors reviewed the manuscript.Conflicts of interest
There are no conflicts of interest to declare.Acknowledgements
This research was funded by The Science, Technology &Innovation Funding Authority (STDF). Grant supported this work from The STDF Fund within the framework of the “Egyptian American Cooperation Grant” call 20, Egypt (Project ID 45898, C1130, 2021). The authors thank the Centre of Environmental Studies and Consultations, Suez Canal University, Ismailia, Egypt.References
- H. Zeghioud, L. Fryda, H. Djelal, A. Assadi and A. J. J. Kane, A comprehensive review of biochar in removal of organic pollutants from wastewater: Characterization, toxicity, activation/functionalization and influencing treatment factors, J. Water Proc. engineering, 2022, 47, 102801 CrossRef.
- A. El Shahawy, I. A. Ahmed, R. Wagdy, A. H. Ragab and N. H. J. M. Shalaby, Phragmites australis (Reed) as an efficient, eco-friendly adsorbent for brackish water pre-treatment in reverse osmosis: A kinetic study, Molecules, 2021, 26(19), 6016 CrossRef CAS PubMed.
- S. Chong, T. K. Sen, A. Kayaalp and H. M. J. Ang, The performance enhancements of upflow anaerobic sludge blanket (UASB) reactors for domestic sludge treatment–a state-of-the-art review, Water Res., 2012, 46(11), 3434–3470 CrossRef CAS.
- R. Rajagopal, M. R. Choudhury, N. Anwar, B. Goyette and M. S. J. W. Rahaman, Influence of pre-hydrolysis on sewage treatment in an Up-Flow Anaerobic Sludge BLANKET (UASB) reactor: A review, Water, 2019, 11(2), 372 CrossRef CAS.
- S. Aiyuk, I. Forrez and A. van Haandel, Verstraete WJBt. Anaerobic and complementary treatment of domestic sewage in regions with hot climates—A review, Bioresour. Technol., 2006, 97(17), 2225–2241 CrossRef CAS.
- G. Heikal and A. J. D. El-Shahawy, Biosorption of phosphorus, total suspended and dissolved solids by dried Phragmites australis: isotherm, kinetic and interactive response surface methodology (IRSM) in oil and soap-derivatives industrial wastewater, Desalin. Water Treat., 2019, 137, 243–259 CrossRef CAS.
- A. El Shahawy and G. J. R. A. Heikal, Regression, kinetics and isotherm models for biosorption of organic pollutants, suspended and dissolved solids by environmentally friendly and economical dried Phragmites australis, RSC Adv., 2018, 8(71), 40511–40528 RSC.
- I. Majdy, E. Cherkaoui, A. Nounah, M. J. JoM. Khamar and E. Science, The physico-chemical treatment by coagulation flocculation of wastewater discharges from the city of Sale, J. Mater. Environ. Sci., 2015, 6, 834–839 CAS.
- F. Elayadi, C. El Adlouni, M. A. E. El Herradi, M. El Krati, S. Tahiri and M. N. F. Naman, Effects of raw and treated olive mill wastewater (OMW) by coagulation-flocculation, on the germination and the growth of three plant species (wheat, white beans, lettuce), Moroccan J. Chem., 2019, 7(1), 111–122 CAS.
- M. J. M. Rusan, A. A. Albalasmeh and H. I. Malkawi, Treated olive mill wastewater effects on soil properties and plant growth, Water, Air, Soil Pollut., 2016, 227, 1–10 CrossRef CAS.
- E. El Herradi, G. Boujaber, M. Naman, A. Laamyem, C. El Adlouni and F. J. J. Naman, Treatment of oil mill wastewaters by infiltration-percolation on two types of filters based on soil, sand and fly ash, J. Mater. Environ. Sci., 2016, 7(3), 820–827 CAS.
- S. Jeddi, A. Ouassini, M. El Ouahhaby and H. J. J. Mghafri, Valorisation of natural mineral substances (NMS) at adsorption techniques: Case of olive oil mill waste waters, J. Mater. Environ. Sci., 2016, 7(2), 488–496 CAS.
- M. T. El, Y. Jaouad, L. Mandi, B. Marrot and N. J. E. T. Ouazzani, Biomass behaviour in a conventional activated sludge system treating olive mill wastewater, Environ. Technol., 2018, 39(2), 190–202 CrossRef.
- E. Lee, P. R. Rout and J. J. S. Bae, The applicability of anaerobically treated domestic wastewater as a nutrient medium in hydroponic lettuce cultivation: Nitrogen toxicity and health risk assessment, Sci. Total Environ., 2021, 780, 146482 CrossRef CAS PubMed.
- A. J. G. A. Talaiekhozani, A. Shamiri, S. Khosroyar, A. Talaiekhozani, R. Sanaye and K. Azizi, A review on different aerobic, Techniques atmidiwJoET. A review on different aerobic and anaerobic treatment methods in dairy industry wastewater, J. Environ. Treat. Tech., 2019, 7(1), 113–141 Search PubMed.
- E. J. W. S. Foresti, Technology. Anaerobic treatment of domestic sewage: established technologies and perspectives, Water Sci. Technol., 2002, 45(10), 181–186 CrossRef CAS.
- G. Lettinga, Anaerobic digestion and wastewater treatment systems, Antonie van leeuwenhoek, 1995, 67, 3–28 CrossRef CAS.
- B. J. W. S. Schink, Technology. Anaerobic digestion: concepts, limits and perspectives, Water Sci. Technol., 2002, 45(10), 1–8 CrossRef CAS.
- A. El Shahawy and G. J. E. E. Heikal, Organic pollutants removal from oily wastewater using clean technology economically, friendly biosorbent (Phragmites australis), Ecol. Eng., 2018, 122, 207–218 CrossRef.
- R. Li, B. Wang, A. Niu, N. Cheng, M. Chen and X. Zhang, Application of biochar immobilized microorganisms for pollutants removal from wastewater: A review, Sci. Total Environ., 2022, 837, 155563 CrossRef CAS PubMed.
- W. Xiang, X. Zhang, J. Chen, W. Zou, F. He and X. Hu, Biochar technology in wastewater treatment: A critical review, Chemosphere, 2020, 252, 126539 CrossRef CAS PubMed.
- N. A. Fathy, B. S. Girgis, L. B. Khalil and J. Y. Farah, Utilization of cotton stalks-biomass waste in the production of carbon adsorbents by KOH activation for removal of dye-contaminated water, Carbon letters, 2010, 11(3), 224–234 CrossRef.
- M. Deng, K. Li, Y.-J. Yan, F. Huang, D. J. E. S. Peng and P. Research, Enhanced cadmium removal by growing Bacillus cereus RC-1 immobilized on different magnetic biochars through simultaneous adsorption and bioaccumulation, Environ. Sci. Pollut. Res., 2022, 1–13 Search PubMed.
- S. K. Manikandan, D. A. Giannakoudakis, J. R. Prekodravac, V. Nair and J. C. J. Colmenares, Biotechnology. Role of catalyst supports in biocatalysis, J. Chem. Technol. Biotechnol., 2023, 98(1), 7–21 CrossRef CAS.
- B. Xiong, Y. Zhang, Y. Hou, H. P. H. Arp, B. J. Reid and C. J. C. Cai, Enhanced biodegradation of PAHs in historically contaminated soil by M. ágilvum inoculated biochar, Chemosphere, 2017, 182, 316–324 CrossRef CAS.
- H. Chen, J. Zhang, L. Tang, M. Su, D. Tian and L. Zhang, Enhanced Pb immobilization via the combination of biochar and phosphate solubilizing bacteria, Environ. Int., 2019, 127, 395–401 CrossRef CAS.
- Q. An, B. Ran, S. Deng, N. Jin, B. Zhao and J. Song, Peanut shell biochar immobilized Pseudomonas hibiscicola strain L1 to remove electroplating mixed-wastewater, J. Environ. Chem. Eng., 2023, 11(2), 109411 CrossRef CAS.
- V. A. Schommer, A. P. Vanin, M. T. Nazari, V. Ferrari, A. Dettmer and L. M. Colla, Biochar-immobilized Bacillus spp. for heavy metals bioremediation: A review on immobilization techniques, bioremediation mechanisms and effects on soil, Sci. Total Environ., 2023, 881, 163385 CrossRef CAS PubMed.
- H. Zhou, L. Jiang, K. Li, C. Chen, X. Lin and C. Zhang, Enhanced bioremediation of diesel oil-contaminated seawater by a biochar-immobilized biosurfactant-producing bacteria Vibrio sp. LQ2 isolated from cold seep sediment, Sci. Total Environ., 2021, 793, 148529 CrossRef CAS PubMed.
- N. Cai, H. Zhang, J. Nie, Y. Deng and J. Baeyens, Biochar from biomass slow pyrolysis, in IOP Conference Series: Earth and Environmental Science, IOP Publishing, 2020, vol. 586(1), p. 012001 Search PubMed.
- W. Tao, W. Duan, C. Liu, D. Zhu, X. Si and R. Zhu, Formation of persistent free radicals in biochar derived from rice straw based on a detailed analysis of pyrolysis kinetics, Sci. Total Environ., 2020, 715, 136575 CrossRef CAS PubMed.
- H. Srilatha, K. Nand, K. S. Babu and K. J. P. B. Madhukara, Fungal pretreatment of orange processing waste by solid-state fermentation for improved production of methane, Process Biochem., 1995, 30(4), 327–331 CrossRef CAS.
- G. Mengchun, S. Zonglian and H. M. Chunji, Performance evaluation of a mesophilic (37 deg. C) upflow anaerobic sludge blanket reactor in treating distiller's grains wastewater, J. Hazard. Mater., 2007, 141(3), 808–813 CrossRef.
- M. Selvamurugan, P. Doraisamy and M. J. I. Maheswari, High-rate anaerobic treatment of distillery spentwash using UASB and UAHR, Int. J. Environ. Eng., 2014, 6(3), 273–286 CrossRef.
- H. M. Abdulla, S. A. El-Shatoury, A. A. El-Shahawy, S. A. Ghorab, M. Nasr and M. E. J. Trujillo, An integrated bioaugmentation/electrocoagulation concept for olive mill wastewater management and the reuse in irrigation of biofuel plants: a pilot study, Environ. Sci. Pollut. Res., 2019, 26, 15803–15815 CrossRef CAS PubMed.
- M. C. Collivignarelli, A. Abbà, F. M. Caccamo, S. Calatroni, V. Torretta and I. A. Katsoyiannis, Applications of up-flow anaerobic sludge blanket (UASB) and characteristics of its microbial community: a review of bibliometric trend and recent findings, Int. J. Environ. Res. Public Health, 2021, 18(19), 10326 CrossRef CAS PubMed.
- K. Buchauer, A comparison of two simple titration procedures to determine volatile fatty acids in influents to waste-water and sludge treatment processes, Water, 1998, 24, 49–56 CAS.
- C. B. Akcal, C. Filik Iscen, S. J. D. Ilhan and W. Treatment, The anaerobic treatment of pharmaceutical industry wastewater in an anaerobic batch and upflow packed-bed reactor, Desalin. Water Treat., 2016, 57(14), 6278–6289 CrossRef.
- A. Hatata, O. H. Galal, N. Said and D. J. R. E. Ahmed, Prediction of biogas production from anaerobic co-digestion of waste activated sludge and wheat straw using two-dimensional mathematical models and an artificial neural network, Renewable Energy, 2021, 178, 226–240 CrossRef.
- G.-L. Tang, J. Huang, Z.-J. Sun, Q.-Q. Tang, C.-H. Yan and G.-Q. Liu, Biohydrogen production from cattle wastewater by enriched anaerobic mixed consortia: Influence of fermentation temperature and pH, J. Biosci. Bioeng., 2008, 106(1), 80–87 CrossRef CAS PubMed.
- R. M. M. Ziara, S. Li, J. Subbiah and B. I. Dvorak, Characterization of Wastewater in Two U.S. Cattle Slaughterhouses, Water Environ. Res., 2018, 90(9), 851–863 CrossRef.
- D. P. Zagklis, A. I. Vavouraki, M. E. Kornaros and C. A. J. J. Paraskeva, Purification of olive mill wastewater phenols through membrane filtration and resin adsorption/desorption, J. Hazard. Mater., 2015, 285, 69–76 CrossRef CAS PubMed.
- D. Hank, Z. Azi, S. A. Hocine, O. Chaalal and A. Hellal, Chemistry E. Optimization of phenol adsorption onto bentonite by factorial design methodology, J. Ind. Eng. Chem., 2014, 20(4), 2256–2263 CrossRef CAS.
- M. A. N. Camacho, A. I. G. López, A. Martinez-Ferez, J. M. J. S. Ochando-Pulido and P. Technology, Two-phase olive-oil washing wastewater treatment plus phenolic fraction recovery by novel ion exchange resins process modelling and optimization, Sep. Purif. Technol., 2021, 269, 118755 CrossRef CAS.
- A. V. Buntić, M. D. Pavlović, S. S. Šiler-Marinković and S. I. Dimitrijević-Branković, Biological treatment of colored wastewater by Streptomyces fulvissimus CKS 7, Water Sci. Technol., 2016, 73(9), 2231–2236 CrossRef.
- N. Mansouri and O. Benslama, Reprint of: Molecular docking exploration of the degradation activity of some synthetic hydrocarbons polymers by the laccase enzyme of Streptomyces, Mater. Today: Proc., 2022, 53, A1–A4 CAS.
- A. Rathinam, J. R. Rao and B. Unni Nair, Adsorption of phenol onto activated carbon from seaweed: Determination of the optimal experimental parameters using factorial design, J. Taiwan Inst. Chem. Eng., 2011, 42(6), 952–956 CrossRef CAS.
- S. N. Hazarika and D. Thakur, Chapter 21 – Actinobacteria, In Beneficial Microbes in Agro-Ecology, N. Amaresan, M. Senthil Kumar, K. Annapurna, K. Kumar and A. Sankaranarayanan, Academic Press, 2020, pp. 443–476 Search PubMed.
- T. Mathialagan and T. J. E. Viraraghavan, Biosorption of pentachlorophenol by fungal biomass from aqueous solutions: a factorial design analysis, Environ. Technol., 2005, 26(5), 571–580 CrossRef CAS PubMed.
- M. Saidu, A. Yuzir, M. R. Salim, A. S. Salmiati and N. Abdullah, Influence of palm oil mill effluent as inoculum on anaerobic digestion of cattle manure for biogas production, Bioresour. Technol., 2013, 141, 174–176 CrossRef CAS PubMed.
- M. O. J. Azzam, Olive mills wastewater treatment using mixed adsorbents of volcanic tuff, natural clay and charcoal, J. Environ. Chem. Eng., 2018, 6(2), 2126–2136 CrossRef CAS.
- S. El-Shatoury, J. Mitchell, M. Bahgat and A. J. A. Dewedar, Biodiversity of actinomycetes in a constructed wetland for industrial effluent treatment, Actinomycetologica, 2004, 18(1), 1–7 CrossRef CAS.
- Q. Guo, Z. Yang, B. Zhang, M. Hua, C. Liu and B. J. F. Pan, Enhanced methane production during long-term UASB operation at high organic loads as enabled by the immobilized Fungi, Front. Environ. Sci. Eng., 2022, 16, 1–13 CrossRef.
- S. Jadav, N. Sakthipriya, M. Doble and J. S. J. Sangwai, Engineering. Effect of biosurfactants produced by Bacillus subtilis and Pseudomonas aeruginosa on the formation kinetics of methane hydrates, J. Nat. Gas Sci. Eng., 2017, 43, 156–166 CrossRef CAS.
- S. N. K. M. Syahri, H. Abu Hasan, S. R. S. Abdullah, A. R. Othman, P. M. Abdul and R. F. H. R. Azmy, Recent challenges of biogas production and its conversion to electrical energy, J. Ecol. Eng., 2022, 23(3) Search PubMed.
- S. Periyasamy, T. Temesgen, V. Karthik, J. B. Isabel, S. Kavitha and J. R. Banu, Wastewater to Biogas Recovery. Clean Energy and Resource Recovery, Elsevier, 2022. pp. 301–314 Search PubMed.
- L. M. Mosley, P. Willson, B. Hamilton, G. Butler and R. J. E. Seaman, The capacity of biochar made from common reeds to neutralise pH and remove dissolved metals in acid drainage, Environ. Sci. Pollut. Res., 2015, 22, 15113–15122 CrossRef CAS PubMed.
| This journal is © The Royal Society of Chemistry 2024 |

