
 Open Access Article
 This Open Access Article is licensed under a Creative Commons Attribution-Non Commercial 3.0 Unported Licence
Development of spray pyrolysis-synthesised Bi2O3 thin films for photocatalytic applications†
Jekaterina Sydorenko *a,
Malle Krunksa,
Atanas Katerskia,
Raitis Grzibovskisb,
Aivars Vembrisb,
Arvo Merea,
Nicolae Spalatua and
Ilona Oja Acika
*a,
Malle Krunksa,
Atanas Katerskia,
Raitis Grzibovskisb,
Aivars Vembrisb,
Arvo Merea,
Nicolae Spalatua and
Ilona Oja Acika
aLaboratory for Thin Film Energy Materials, Department of Materials and Environmental Technology, Tallinn University of Technology, Ehitajate tee 5, 19086 Tallinn, Estonia. E-mail: jekaterina.spiridono@taltech.ee; Tel: +372 6203369
bInstitute of Solid State Physics, University of Latvia, Kengaraga Str. 8, Riga LV 1063, Latvia
First published on 18th June 2024
Abstract
Photocatalysis is a green and cost-effective approach to environmental remediation. While TiO2 is considered one of the benchmark photocatalysts, alternative materials such as Bi2O3 have recently attracted increasing scientific attention as prospective visible light photocatalysts. This study aimed to develop a strategy for Bi2O3 thin film deposition via ultrasonic spray pyrolysis and systematically study process variables for the deposition of β-Bi2O3 thin films for photocatalytic applications. To achieve the aim, the precursor solution concentration as well as deposition and annealing temperature were optimised. The structural, optical, morphological, chemical and wettability properties of the obtained Bi2O3 thin films were investigated with respect to the effect on the photocatalytic oxidation of 10 ppm methyl orange (MO). The highest photocatalytic activity (48% in 5 h) under UV-A was recorded for the β-Bi2O3 film deposited using 0.1 M precursor solution at 300 °C and heat-treated for 1 h in air at 350 °C. Deposition at 300 °C resulted in an amorphous film structure, whereas annealing at 350 °C led to the formation of the β-Bi2O3 phase with the dominant facet orientation (220). These results show the suitability of spray pyrolysis for the deposition of Bi2O3 thin films with promising results for MO dye degradation, expanding the range of suitable photocatalytic materials.
1 Introduction
The global photocatalyst market is rapidly growing owing to its wide range of applications, e.g., self-cleaning, antibacterial, water and air remediation. In 2021, the market of photocatalysts accounted for $3.1 billion, and it is expected to reach $5.1 billion in 2026.1 Although nearly 190 compounds were reported in the literature as photocatalysts,2 about 62% of the market is based on titanium dioxide (TiO2).3 TiO2 as a benchmark photocatalyst has shown good efficiency and stability in the oxidation of a variety of organic pollutants. The practical applications of TiO2, however, possess some challenges. The major limitation of TiO2 is its wide band gap, which requires irradiation with ultraviolet light. Thus, the development of and research on alternatives to TiO2 photocatalysts, especially solar light-driven photocatalysts, will be critical to make them a viable proposition for the future sustainable photocatalyst market.Currently, the most well-known visible light photocatalysts are CdS, CuS, CeO2, and BiVO4.4 However, the photocorrosion and fast recombination rate of electron–hole pairs limit their performance. Bismuth trioxide (Bi2O3) is also one of the promising green candidates for visible-light active photocatalysts. Bi2O3 plays an important role in semiconductor technology; however, due to its complex polymorphism, it is not a well-studied material.5 Depending on the preparation technology, Bi2O3 exists in several crystal forms, i.e. monoclinic (α), tetragonal (β), body-centred cubic (γ), face-centred cubic (δ), orthorhombic (ε), triclinic (ω), and hexagonal assemblies.6 However, only the α- and δ-phases are stable; the α-phase is stable at room temperature and the δ-phase is stable at high temperatures (730–825 °C).7 The optical band gap values of different phases vary from 2.0 to 3.9 eV and depend sensitively on preparation conditions.8
Studies showed that α-, β- and δ-phases can photocatalytically oxidize organic pollutants such as methyl orange (MO),9–11 methylene blue12 and rhodamine B (RhB)13–15 under UV and Vis light. The α-phase is the most studied one due to its thermal stability,16 while the β-phase was reported as more photocatalytically active7,17,18 However, the mechanism of β-Bi2O3 film formation and stability at high temperatures (450–667 °C) is still unclear and needs in-depth study.7,16
The application of the photocatalyst in the form of a thin film, rather than using nanopowders, provides several advantages to the photocatalytic process. Due to the excellent adhesion of the film, there is no need to separate nanoparticles from the liquid medium after treatment. Thus, they can be reused multiple times without losing their activity. Thin films can be easily scaled up to large areas, making them a viable option for industrial applications. Moreover, thin films can be used as multi-functional surfaces (e.g., self-cleaning, anti-fogging etc.).19,20 The first important step in the production of efficient photocatalytic thin films is the selection of the deposition method. Bi2O3 thin films were prepared using a variety of methods such as sol–gel, spray pyrolysis and sputtering, which are summarized in the ESI Table S1.† However, still, some critical things about the preparation and post-treatment temperature optimisation of the β-phase have not been shown. In this work, ultrasonic spray pyrolysis (USP) was used for Bi2O3 film deposition. This method has been proven as a cost-effective and easily scalable method for the production of uniform TiO2 thin films on large areas,21,22 while in the production of Bi2O3 films, it was used only by Hofmann et al.13
The second major step in the fabrication of thin films is the choice of the precursor. Bismuth(III) nitrate pentahydrate (Bi(NO3)3·5H2O) was mainly used as a precursor for Bi2O3 film deposition by chemical methods (Table S1†), while applying a metal–organic precursor can be more beneficial for the production of photocatalytic films. For example, metal acetates dissolved in organic solvents can be promising to produce photocatalytic coatings by spray pyrolysis. At room temperatures, acetate ligands with metal ions are retained in the complex, which leads to the stable precursor solution.23 At the temperature of 200 °C, acetate complexes start to decompose into metal oxides and completely decompose at the temperature of 400 °C.24 To the best of our knowledge, bismuth(III) acetate water solution for photocatalytic Bi2O3 film preparation was used only in one study,9 while organic solvents for bismuth(III) acetate solution preparation have not been reported yet. Moreover, the effect of annealing on the material and photocatalytic properties of the Bi2O3 films from bismuth(III) acetate precursor prepared by USP has not been studied yet. However, it is well-known that annealing of thin films has an impact on their photocatalytic activity through surface modification and defects engineering. The application of annealing helps create point defects on the surface of the photocatalyst, which act as active sites and enhance charge separation and transfer.25 For example, Dundar et al. showed an enhancement in photocatalytic efficiency of TiO2 thin films deposited at 350 °C and annealed at 500 °C due to the transformation from amorphous to crystalline TiO2 and the creation of higher amount of oxygen vacancies on the catalyst surface.26
It is important to note that photocatalytic materials must be designed carefully to avoid secondary pollution after their application in environmental remediation. Thus, the deposition of the photocatalyst in the form of well-adhered thin films is the best option. However, low quantum yield and high electron–hole pair recombination rate were reported as the main limitations for potential industrial photocatalytic application of Bi2O3 films.27 Modification of Bi2O3 via doping or making composite materials can help to overcome these limitations. For example, the heterostructures of α- and β-Bi2O3 were applied for Rh B13,28,29 photocatalytic oxidation and showed up to 3.5 times higher degradation rate compared to the α-phase. Moreover, Bi2O3 and TiO2 can form a p–n heterojunction with enhanced charge separation under visible light.30,31 However, prior to the preparation of complex compounds and heterostructures, an understanding of the properties of the constituent materials is needed. Thus, the novelty and key point of this paper lie in the development of the methodology for Bi2O3 thin film preparation by USP, the systematic study of material and photocatalytic properties of obtained films, and the subsequent study of the annealing effect.
The aim of this study was to understand and identify process variables and operative conditions for the deposition of photocatalytically active β-Bi2O3 thin films by ultrasonic spray pyrolysis using bismuth(III)acetate metal–organic compound as a precursor. To reach the aim, the influence of precursor concentration (0.025–0.1 M), film growth temperature (250–500 °C) and annealing temperature (300–550 °C in air) was investigated. Finally, the photocatalytic activity was measured by degradation of MO and compared with TiO2 thin films taken as a model photocatalytic material for these studies.
2 Experimental
2.1. Sample preparation
Bismuth(III) acetate (Bi(CH3COO)3, 99%, Alfa Aesar) was used as a precursor. The molar concentration of bismuth(III) acetate varied from 0.025 to 0.1 M. The precursor was dissolved under stirring at 50 °C in acetic acid (CH3COOH, Honeywell, ≥99.8%) and methanol (CH3OH, Honeywell, ≥99.9%) in the volume ratio 1![[thin space (1/6-em)]](https://www.rsc.org/images/entities/char_2009.gif) :4. A clear, transparent solution was obtained after 20 min stirring.
:4. A clear, transparent solution was obtained after 20 min stirring.
Borosilicate glass (40 × 9 mm) was used as a substrate. Films were deposited by ultrasonic spray pyrolysis (USP). Compressed air with a flow rate of 5 L min−1 was used to transport the precursor droplets from the nebulizer to the preheated glass substrate. The deposition time was set to 13 min, which gives the solution spray rate of 2.3 mL min−1. The deposition temperatures were between 250 °C and 500 °C at the intervals of 50 °C. Some of the as-deposed samples were annealed at temperatures of 300–550 °C for 1 h in air.
The TiO2 thin film for the comparison experiment was deposited using the same USP setup. For precursor preparation, 3 mL of titanium(IV) isopropoxide, 8 mL of acetylacetone and 39 mL of ethanol were mixed. TiO2 film was deposited using the same spray rate at a temperature of 350 °C and annealed for 1 h at 500 °C. The material and photocatalytic properties of the obtained film were studied in detail in previous papers.21,32,33
2.2. Characterization
Structural properties were investigated using X-ray diffraction (XRD). Rigaku Ultima IV diffractometer with Cu Kα radiation of λ = 1.5406 Å, 40 kV, 40 mA and silicon strip detector was operated with a scan range of 10–70°, scanning speed rate of 5° min−1 and a step of 0.02°. The total transmittance of the samples was measured with a Jasco V-670 UV-Vis-NIR spectrophotometer equipped with an integrating sphere in the spectral range 250–1500 nm. The optical direct band gap was determined using a Tauc plot. The surface morphology of the prepared samples was studied using a scanning electron microscope (SEM) (HR-SEM Zeiss Merlin). The thickness was determined from SEM cross-section images. X-ray photoelectron spectroscopy (XPS) analyses were carried out using a ThermoFisher ESCALAB Xi+ instrument using a monochromatic Al Kα X-ray source. The binding energy values were calibrated based on the C 1s core level peak at 285.0 eV. All samples were pre-treated with a UV-A lamp for 30 min before XPS measurements to clean the surface from adsorbed H2O species. The wettability of the films was studied with water contact angle (CA) measurements by DSA 25 (KRÜSS Instrument) at room temperature, using the sessile drop fitting method.The photocatalytic activity was measured by the oxidation of a commonly used model pollutant methyl orange (MO) dye in an aqueous solution under UV-A. Based on the band gap calculations, some experiments were conducted under Vis light. The initial concentration of MO was 10 ppm, and the volume was 3 mL. The concentration of MO was measured every 30 min for 300 min by measuring the highest absorbance intensity of MO at 464 nm with a UV-Vis-NIR spectrophotometer. MO degradation efficiency was calculated from eqn (1). All experiments were repeated at least twice, and the average efficiency was calculated with a standard deviation of <5%.
| η = (C0 − C)/C0 × 100% | (1) |
UV-A Philips Actinic BL 15 W with irradiance 3.5 mW cm−2 with reflector (integrated in the range of 180–400 nm, with max emission at 365 nm, UV-B/UV-A ratio <0.2%) and VIS Philips TL-D 15 W with irradiance 3.3 mW cm−2 with reflector (integrated in the range of 180–700 nm, UV/UV-Vis ratio <5%) lamps were used as light sources. Reference experiments were conducted to check the photolysis and adsorption, and detailed information is presented in the ESI section.† No photocatalysis or adsorption were detected (Fig. S1†).
Three different scavengers were added to the MO solution to identify the role of reactive species in MO oxidation. Isopropanol, ammonium oxalate and p-quinone were used as hydroxyl radical, hole and superoxide radical scavengers, respectively. The concentration of scavengers in the MO solution was 1 mmol L−1.
3 Results and discussion
At first, a series of different concentrations was performed to determine the molar concentration of the precursor for the spray solution (detailed information is presented in the ESI section†). Bi2O3 films were deposited from 0.025–0.1 M bismuth(III) acetate solutions at a deposition temperature of 350 °C without annealing and characterized by XRD and UV-Vis (Fig. S2†). Polycrystalline Bi2O3 film, which oxidized ca 2.7 ppm of MO in 5 h under UV-A, was obtained at a concentration of 0.1 M (Fig. S3†). Based on the results, the concentration of 0.1 M was fixed for further experiments.3.1. The effect of deposition and annealing temperature
Next, to identify a suitable deposition temperature for Bi2O3 film fabrication by ultrasonic spray pyrolysis, the deposition temperatures between 250 °C and 500 °C with intervals of 50 °C were screened. XRD patterns of the obtained films are given in Fig. 1a.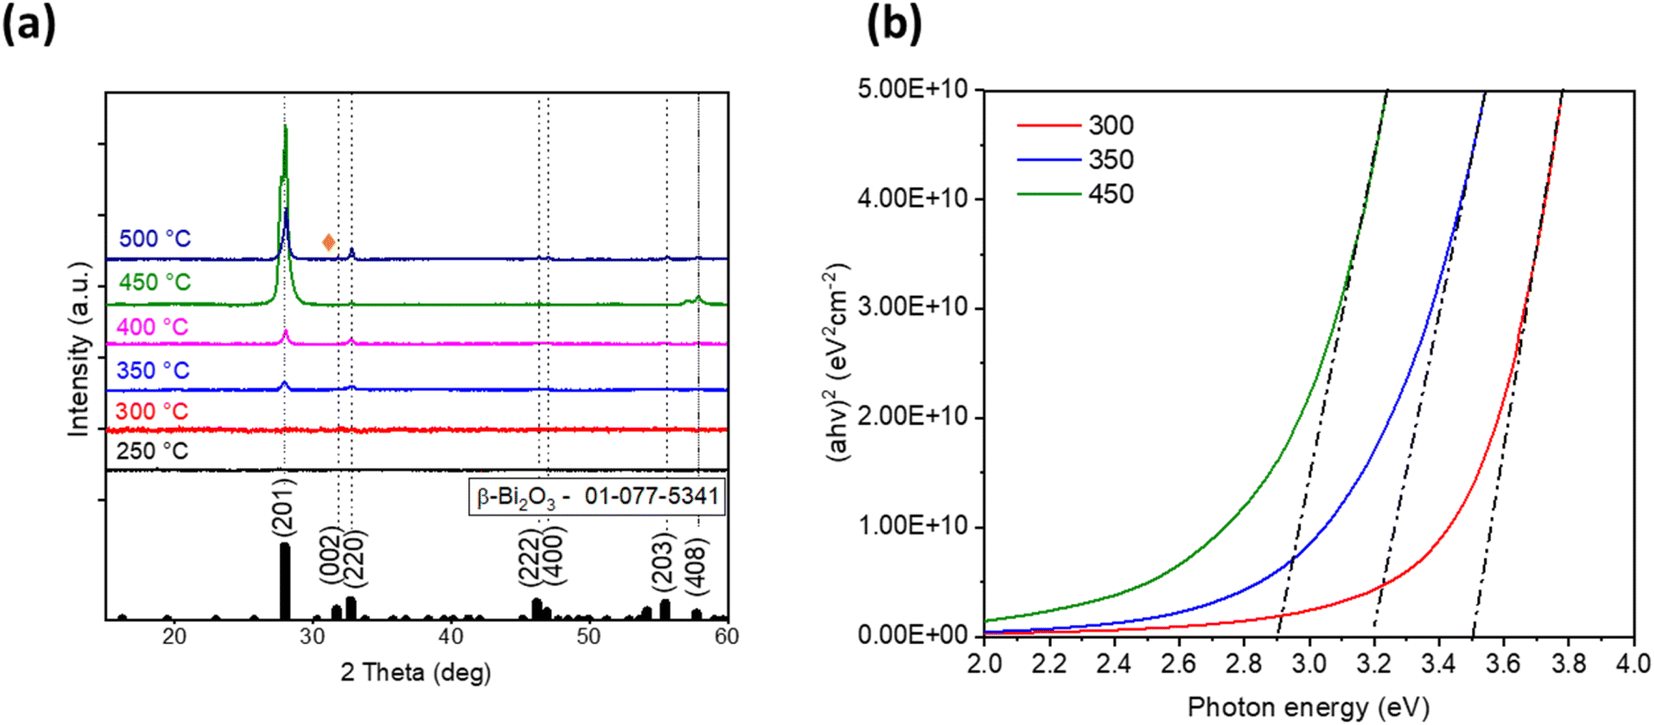 | ||
| Fig. 1 X-ray diffraction (XRD) patterns (a) and Tauc plots (b) of as-deposited bismuth oxide thin films prepared at different deposition temperatures. | ||
It is not surprising that films deposited at temperatures 300 °C and below are amorphous since the decomposition of acetates finishes at temperatures around 400 °C.24 The films deposited at temperatures of 350–450 °C indicate diffraction peaks at 2θ of 27.9, 32.7, 57.0 and 57.8° characteristic for β-Bi2O3 phase. Deposition at 500 °C resulted in the presence of one peak at 2θ of 31.0° (orange rhombus in Fig. 1a), which could belong to another bismuth oxide phase, and for further identification of this peak, annealing of the samples was applied. The phase composition of the obtained films is summarized in Table 1.
| Tdep, (°C) | Phase | Eg (eV) | MO degradation, UV-A, 5 h, (%) |
|---|---|---|---|
| 250 | Amorphous | — | 0 |
| 300 | Amorphous | 3.5 | 21 |
| 350 | β-Bi2O3 | 3.2 | 27 |
| 400 | β-Bi2O3 | 3.1 | 25 |
| 450 | β-Bi2O3 | 2.9 | 20 |
| 500 | β-Bi2O3 and Bi4O7 | 2.9 | Not measured |
| Tdep, (°C)/Tannel, (°C) | Phase | Eg (eV) | MO degradation, UV-A, 5 h, (%) |
|---|---|---|---|
| 250/300 | β-Bi2O3 | — | 7 |
| 250/350 | β-Bi2O3 | 3.2 | 5 |
| 250/400 | β-Bi2O3 | 2.7 | 7 |
| 250/450 | β-Bi2O3 and Bi4O7 | 3.5 | 0 |
| 250/500 | Bi4O7 | 4.1 | 0 |
| 300/350 | β-Bi2O3 | 3.4 | 48 |
| 300/400 | β-Bi2O3 | 3.0 | 25 |
| 300/450 | β-Bi2O3 and Bi4O7 | 3.5 | 1 |
| 300/500 | Bi4O7 | 4.0 | 0 |
| 300/550 | Bi4O7 | 4.0 | 0 |
It is well established that bismuth(III) acetate precursor decomposes to bismuth oxide and acetic acid on heating. It was reported in the literature that the decomposition of bismuth(III) acetate begins gradually at around 50 °C and ends with Bi2O3 at 320 °C.34 XRD results of the current study are in a good correlation with a thermal analysis study34 as crystalline Bi2O3 phase was obtained starting from the deposition temperature 350 °C.
The relative intensity of reflections on XRD patterns (Fig. 1a) attributed to β-Bi2O3 in the samples was similar to the ratio in the JCPDS 01-077-5341 powder reference file. This confirms that crystallites in the as-deposited samples have no preferred orientation.
The formation of the β-Bi2O3 phase was reported for films prepared from Bi(NO3)3·5H2O by spin-coating and annealed at 400–450 °C,35,36 films prepared by spray pyrolysis from [Bi38O45(OMc)24(DMSO)9]·2DMSO·7H2O and annealed at 370 °C in an argon atmosphere13 or deposited at 450 °C from bismuth(III) acetate without post-treatment.9 Hence, applied in the current study, deposition temperatures of 350–450 °C for β-Bi2O3 preparation are in good agreement with that reported in the literature.
The total transmittance spectra of the as-deposited samples in Fig. S4† demonstrate that all films were optically transparent in the visible spectral range. The band gap values were determined using the Tauc plot (Fig. 1b) and are presented in Table 1. It should be noted that the band gap values decreased from 3.5 to 2.9 eV (Fig. 1b) with deposition temperature increasing from 300 °C to 450 °C. This observation correlates with the transformation from amorphous to crystalline β-Bi2O3 phase owing to the complete decomposition of bismuth(III) acetate at higher temperatures.
To investigate the effect of annealing and clarify the formation of another bismuth oxide phase at intensified temperature, amorphous Bi2O3 films deposited at 250 °C and 300 °C were further annealed for 1 h in air at temperatures 300–550 °C. The XRD patterns of the obtained films are presented in Fig. 2.
 | ||
| Fig. 2 XRD patterns of as-deposited (AD) at 250 °C bismuth oxide thin films and after annealing at temperatures 300–500 °C (a). XRD patterns of AD at 300 °C bismuth oxide thin films and after annealing at temperatures 350–550 °C (b). | ||
XRD patterns demonstrate that deposition at 250 °C with annealing at 300 °C resulted in 2 peaks of β-Bi2O3 in the XRD pattern (red line in Fig. 2a), while the as-deposited (AD) film at 300 °C was amorphous (red line in Fig. 2b). Films deposited at 300 °C after annealing at 450 °C showed XRD peaks at 2θ of 23.4, 30.5 and 35.6°, which belong to the Bi4O7 phase (JCPDS card number 01-072-4663), where bismuth ions are in the mixed valence state 3+/5+.37 The presence of mixed β-Bi2O3 and Bi4O7 was also observed for films deposited at 250 °C and 300 °C after annealing at 500 °C and for the films as-grown at 500 °C (Fig. 1a). As mentioned earlier, in as-deposited β-Bi2O3 films grown at temperatures 350–450 °C, the crystallites had no preferential orientation (Fig. 1a). However, the ratio of peak intensities I220/I201 of the β-Bi2O3 films grown at 250 °C and 300 °C with further annealing at temperatures of 300–450 °C is higher compared to the JCPDS 01-077-5341 powder reference file. Hence, crystals in annealed Bi2O3 had preferential orientation along the (220) plane (Fig. 2a and b). Thus, annealing of the amorphous thin films helps to control the growth of the material. It was reported that exposure of high-energy (220) facets increased the number of structural defects, such as oxygen or bismuth vacancies and interstitials, compared to (201) facets in β-Bi2O3 films, which could enhance photocatalytic activity.38
3.2. Surface morphology
Scanning electron microscopy (SEM) images of the surface of Bi2O3 films deposited at different temperatures with and without annealing are given in Fig. 3. A distinct change in the morphology of the films grown at different temperatures and after annealing was observed. Fig. 3a shows that the surfaces of the films deposited at 300 °C had flake-like microstructures with irregular shapes and non-uniform morphology. Deposition at 350 °C resulted in a mixture of flakes and grains (Fig. 3d). At deposition temperatures of 400 °C and 450 °C (Fig. 3e and f), grains were distributed more homogeneously, and grain size increased with increased temperature. The film deposited at 300 °C and annealed at 350 °C shows a flake-like structure (Fig. 3b), while annealing at 500 °C led to agglomerated particles (Fig. 3c). SEM study confirms that surface morphology strongly depends on the deposition and annealing temperatures and annealing leads to the agglomeration. The thickness of the samples was determined from the SEM cross-sectional images and was ca 70 nm for all the samples.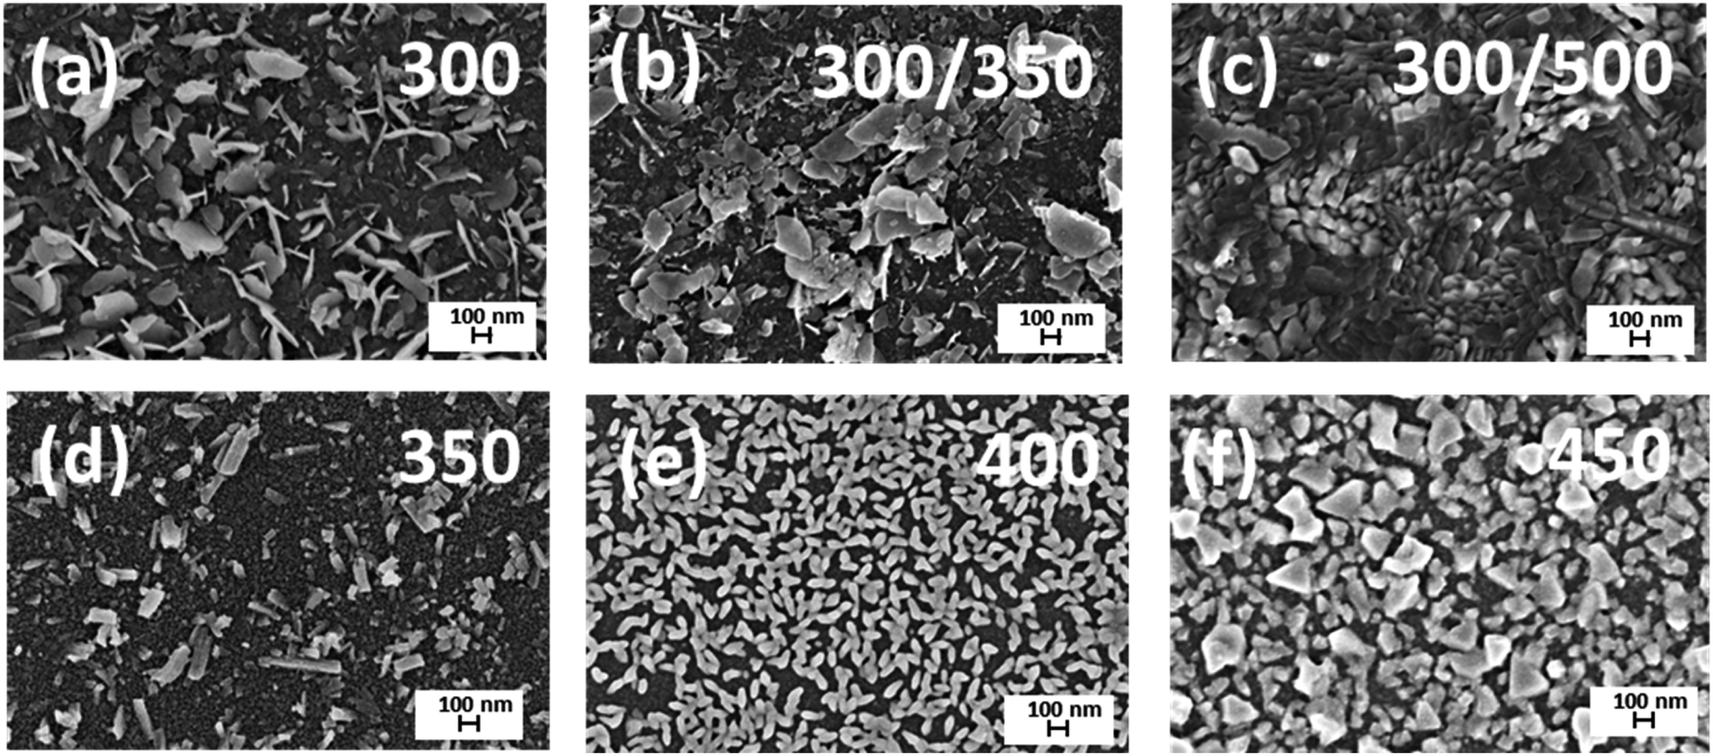 | ||
| Fig. 3 Scanning electron microscopy (SEM) surface images of Bi2O3 films. The surface of Bi2O3 films grown at a temperature of 300 °C without annealing (a) and annealed at temperatures 350 °C (b) and 500 °C (c); Bi2O3 films grown at temperatures 350 °C (d), 400 °C (e) and 450°(f) without annealing. | ||
3.3. Chemical composition and wettability
The surface chemical composition of Bi2O3 films deposited at 300 °C with annealing at different temperatures and deposited at 350 °C without annealing was studied by XPS. The changes on the surface, content of hydroxyl groups, and surface-active sites were studied. Before the measurements, the samples were pre-treated with UV-A irradiation for 30 min. The XPS spectra of Bi 4f7/2 and O 1s core levels are presented in Fig. 4. | ||
| Fig. 4 X-ray photoelectron spectroscopy (XPS) spectra of Bi 4f7/2 (a) and O 1s (b) core levels for Bi2O3 thin films deposited and annealed at different temperatures. | ||
The spectra of Bi 4f7/2 core level (Fig. 4a) of all films showed two overlapping peaks. The main peak at the binding energy (BE) of 159.0 ± 0.2 eV corresponds to Bi3+, and the peak at the higher BE of 159.6 ± 0.3 eV corresponds to Bi5+.39 The [Bi5+]/[Bi3+] ratio in the films deposited at 300 °C with annealing at 350 °C and deposited at 350 °C without annealing was almost similar (0.59 and 0.49, respectively). However, in the films annealed at 400 °C and 450 °C, the [Bi5+]/[Bi3+] ratio decreased (0.24 and 0.06, respectively). XPS results showed that all films contained bismuth in valence states 3+ and 5+, while XRD showed that crystalline Bi4O7 was formed at temperatures ≥450 °C. The presence of Bi5+, according to XPS, could mean that the surfaces of all the films contain amorphous regions consisting of Bi5+. Moreover, it is quite possible that these amorphous regions are also present in the bulk. During annealing at higher temperatures, both Bi2O3 and Bi4O7 crystalline phases form from Bi5+, which leads to the reduction of the [Bi5+]/[Bi3+] ratio.
The O 1s core level consisted of four peaks (Fig. 4b); the peak at BE 529.7 ± 0.3 eV corresponding to the lattice oxygen (Bi–O), peak at BE 530.3 ± 0.3 eV to oxygen vacancies (VO), peak at BE 531.4 ± 0.2 eV to chemisorbed water or hydroxyl groups (–OH) and peak at BE 532.8 ± 0.3 eV is associated with the C–O and C![[double bond, length as m-dash]](https://www.rsc.org/images/entities/char_e001.gif) O.40,41 The ratio of the components [Ov]/[Bi–O], [–OH]/[Bi–O] and [C–O]/[Bi–O] are summarized in Table 2.
O.40,41 The ratio of the components [Ov]/[Bi–O], [–OH]/[Bi–O] and [C–O]/[Bi–O] are summarized in Table 2.
| Sample | [Ov]/[Bi–O], (%/%) | [–OH]/[Bi–O], (%/%) | [C–O]/[Bi–O], (%/%) |
|---|---|---|---|
| 350 | 0.16 | 0.70 | 0.14 |
| 300/350 | 0.16 | 1.63 | 0.45 |
| 300/400 | 0.19 | 1.24 | 0.30 |
| 300/450 | 0.06 | 0.79 | 0.06 |
Table 2 demonstrates that the film deposited at 300 °C and annealed at 450 °C had the lowest ratio of oxygen vacancies, hydroxyl groups and carbon-containing species. Conversely, the film deposited at 300 °C and annealed at 350 °C had the highest ratio of hydroxyl groups and carbon-containing species. According to the literature, a higher number of surface-active sites and hydroxyl groups could promote the separation of charge carriers,34 which is the key point for photocatalytic efficiency enhancement.
For a deeper understanding of surface changes on Bi2O3 films under irradiation, the wettability of the surface of the film was studied by water contact angle (CA) measurements for freshly synthesized and stored in the dark samples with and without UV-A treatment (Table 3).
| Sample | Water contact angle, (°) | |||
|---|---|---|---|---|
| Synthesized films + 10 min UV-A treatment | One day storage in dark | Three days storage in dark | Three days of storage in the dark + UV-A treatment | |
| 300 | 8 | 27 | 33 | 9 |
| 350 | 5 | 23 | 45 | 6 |
| 400 | 8 | 20 | 25 | 10 |
| 300/350 | 6 | 17 | 27 | 5 |
| 300/450 | 10 | 23 | 55 | 9 |
Hydroxyl groups on the surface of the films are responsible for hydrogen bonding with water molecules. Thus, the smaller the water CA, the stronger the hydrogen bonding, which means that there is a higher number of –OH groups on the surface.42
Wettability measurements of Bi2O3 films showed that all samples are hydrophilic (Table 3). However, the film deposited at 300 °C with annealing at 350 °C had the lowest CA when it was kept in the dark. It means that the surface of this film contains the highest number of –OH groups, which is in agreement with the result obtained by XPS studies (Table 2). All samples became superhydrophilic (CA ≤ 10°) after UV-A treatment. Keeping in the dark for 1 day resulted in water CA increasing to 17–27°, while after keeping for three days in the dark, water CA continued to increase (up to 55° for the sample 300/450). Treating the samples with UV-A after three-day storage in the dark gives water CA ≤ 10°. Table 3 demonstrates that Bi2O3 films have reversed photoinduced hydrophilic properties as was reported for TiO2 and ZnO.43 This observation could mean that the mechanism of reactions, which take place on the surface of Bi2O3 under irradiation, is similar to TiO2 and ZnO. Namely, electron–hole pairs are generated under illumination in semiconductors. Next, created charges can recombine or move to the surface to react with adsorbed species, which is fundamental to photocatalysis. However, some holes can react with lattice oxygen and some electrons with lattice metal ions. These reactions create photogenerated surface defective sites, which lead to the reversed hydrophilic properties.43,44 The analogous behaviour of Bi2O3 films with TiO2 and ZnO showed that the same reactions take place on all film surfaces when irradiated with UV light.
3.4. Photocatalytic oxidation of methyl orange
The photocatalytic activity of the as-deposited and annealed Bi2O3 was estimated by the oxidation of MO (Fig. 5a and b). Fig. 5a shows that the film deposited at 250 °C exhibited no photocatalytic activity, which is not surprising since the total transmittance of this film was ca 99% (Fig. S4†) and no XRD peaks were detected (Fig. 1a), which shows that bismuth(III) acetate did not decompose to Bi2O3. These results confirm that 250 °C is too low a temperature for the formation of Bi2O3 films. The films deposited at 350 °C and 400 °C oxidized 27% and 25%, respectively, from 10 ppm of MO in 5 h under UV-A (Fig. 5a). However, the film deposited at 450 °C oxidized 20%. These results demonstrated that photocatalytic activity decreases with a further increase in deposition temperature. A similar effect on MO oxidation with increasing deposition temperature was observed by Chen et al.45 for NiO films prepared by spray pyrolysis from nickel(II) acetate tetrahydrate. They found that the deposition of the films at lower temperatures resulted in an increase in the amount of hydroxyl groups on the surface of the film, which led to higher photocatalytic activity.45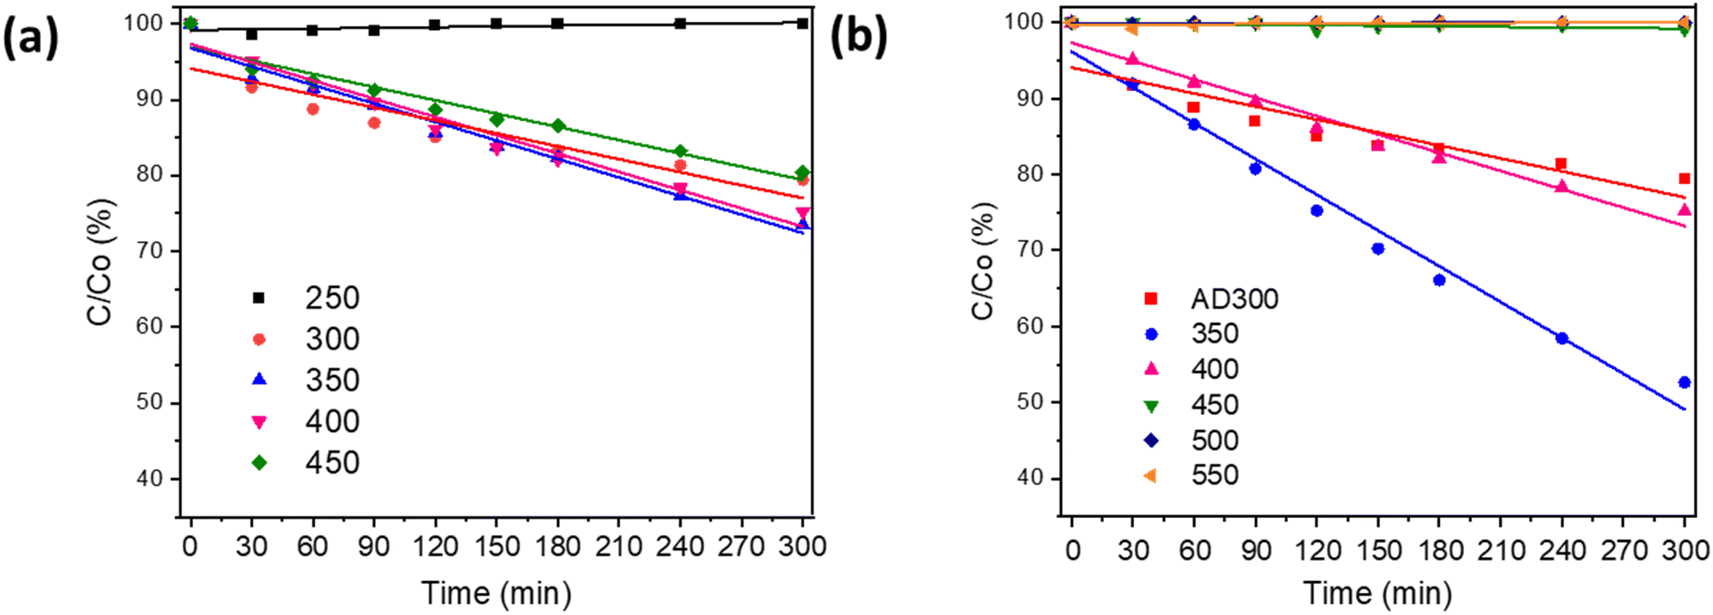 | ||
| Fig. 5 Degradation curves of MO oxidation under UV-A irradiation on Bi2O3 films prepared at different deposition temperatures (a) and deposited at 300 °C (AD) and annealed at temperatures 350–550 °C (b). | ||
Fig. 5b shows that β-Bi2O3 films deposited at 300 °C and annealed at temperatures 350–400 °C had a promising photocatalytic activity. However, the mixed phase of β-Bi2O3 and Bi4O7 formed at annealing temperatures 450–550 °C did not show any photocatalytic activity (Fig. 5b). The highest photocatalytic efficiency (48% in 5 h) for 10 ppm MO oxidation is shown for the film deposited at 300 °C and annealed at 350 °C. The photocatalytic efficiency of this film was two times higher compared to the films deposited at 300 °C and 350 °C (Fig. 5a). Thus, the deposition of amorphous film and crystallization during annealing enhances the photocatalytic efficiency of the β-Bi2O3 film. One of the possible reasons can be changes in preferential orientation along the (220) plane after annealing (Fig. 2a and b). Zhang et al. reported two times higher photocatalytic efficiency for 2-chlorophenol oxidation on β-Bi2O3 with (220) dominant facets compared to (201) owing to the increased number of structural defects.38 Besides, the XPS studies showed that films deposited at 300 °C and annealed at 350 °C had the highest number of surface-active sites and hydroxyl groups (Table 2), which enhance charge separation and production of reactive oxygen species. The enhancement in photocatalytic activity for annealed thin films has been reported by other authors. For example, Dundar et al.26 observed that the deposition of amorphous TiO2 films at 350 °C and annealing at 500 °C resulted in a higher amount of oxygen vacancies and hydroxyl groups on the film surface compared to films deposited at 450 °C and annealed at 500 °C. The degradation of methyl tert-butyl ether on the TiO2 film deposited at 350 °C was 25% higher compared to the film deposited at 450 °C.26 The photocatalytic efficiency of the prepared β-Bi2O3 to oxidize MO achieved in the current study is comparable to other studies on Bi2O3 films. For example, Barrera-Mota et al.,9 for 0.3 ppm MO oxidation, achieved 80% degradation efficiency under UV in 3 h (reaction rate 0.08 ppm h−1) on β-Bi2O3.9
In the current study, Bi2O3 film deposited at 350 °C oxidized ca 2.7 ppm in 5 h under UV-A (reaction rate 0.54 ppm h−1) and film deposited at 300 °C with annealing at 350 °C oxidized 4.8 ppm in 5 h under UV-A (reaction rate 0.96 ppm h−1).
The properties and photocatalytic activity of Bi2O3 films synthesised at different deposition and annealing temperatures are summarized in Table 1 in Section 3.1. Since the band gap of the films grown and annealed at temperatures 400–450 °C is <3.2 eV (Table 1), the MO oxidation was also studied under Vis light. The Bi2O3 film photocatalytic activity under Vis light reached a maximum degradation efficiency of 10% in 5 h (ESI, Fig. S5†).
Hofmann et al. reached ca 80% oxidation of RhB with an initial concentration of 4.8 ppm in 5 h under Vis light for sprayed β-Bi2O3 coatings with a thickness of 5–16 μm,13 which is four times higher compared to MO oxidation on the films with thickness ca 70 nm prepared in the current study. These results demonstrate that further modification of the material, such as thickness increase, band gap engineering or exploring different types of co-catalysts or dopants to reduce charge recombination, are needed to enhance photocatalytic efficiency towards Vis light.
As mentioned in Section 3.3, the mechanism of reactions, which take place on the surface of Bi2O3 under UV irradiation, is similar to TiO2. A model photocatalyst – TiO2 polycrystalline thin film was used for comparison. TiO2 film was grown by the same USP setup at a deposition temperature of 350 °C and annealed at 500 °C. The details of film preparation and characterization are published elsewhere.21 This TiO2 film showed enhanced photocatalytic activity for stearic acid21 and volatile organic compound oxidation.33
For a better comparison of the photocatalytic activity, the photodegradation rate constants (k) were calculated (Fig. 6a). Calculations were based on the Langmuir–Hinshelwood model assuming the first-order kinetics (eqn (2)).10
| −ln(C0/C) = k × t | (2) |
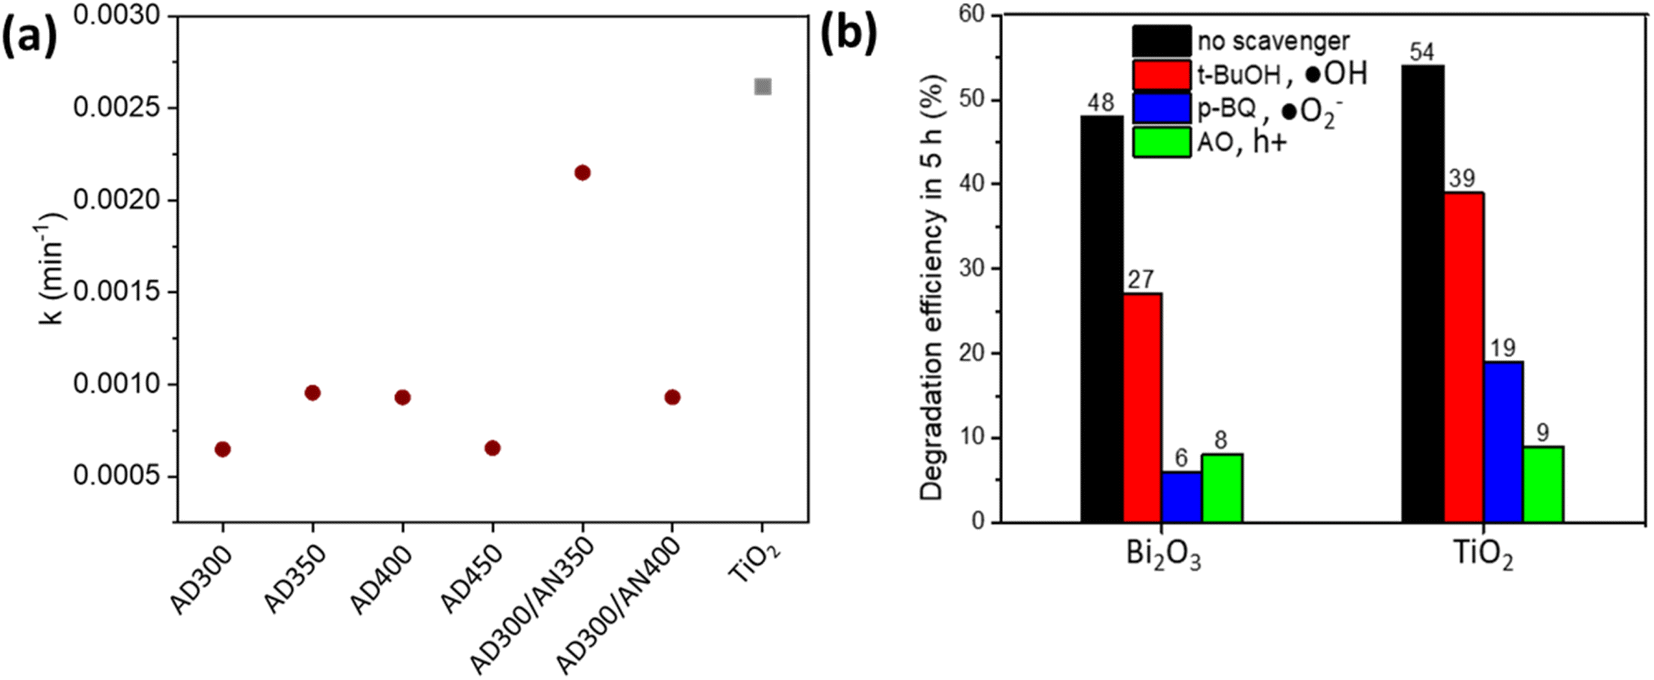 | ||
| Fig. 6 Photodegradation rate constants of MO oxidation on Bi2O3 and TiO2 thin films (a) and the influence of ˙OH, ˙O2− and h+ scavengers on MO degradation efficiency (b). | ||
The graph ln(C0/C) vs. t results in a collection of straight lines of slope k (Fig. 6a).
The oxidation of 10 ppm MO on the Bi2O3 thin film deposited at 300 °C and annealed at 350 °C was comparable with TiO2, reaching 48% and 54% degradation efficiency, respectively, in 5 h under UV-A. It resulted in k 0.00215 and 0.00262 min−1 for Bi2O3 and TiO2, respectively (Fig. 6a).
The mechanism of MO oxidation is complicated and follows the formation of different intermediates.46 To disclose the role of ˙OH, ˙O2− and h + active species in the photocatalytic oxidation of MO on Bi2O3 and TiO2, the degradation efficiency in the presence of scavengers was measured (Fig. 6b). tert-Butanol (t-BuOH) was used as an ˙OH scavenger, p-benzoquinone (p-BQ) as an ˙O2− scavenger and ammonium oxalate (AO) as an h+ scavenger. The concentration of scavengers in the MO solution was 1 mM. Fig. 6b demonstrates that degradation efficiency decreased in the presence of all scavengers on both Bi2O3 and TiO2 films. It indicates that all reactive species participate in MO oxidation reactions. However, using t-BuOH as a trapping agent decreased degradation efficiency less than applying p-BQ and AO, which significantly decelerated the reaction. This observation shows that ˙O2− and h+ play a key role in MO degradation on Bi2O3 and TiO2 films. Ma et al. also reported the dominant role of ˙O2− and h+ for the photodegradation of RhB on Ag3PO4/Bi2WO6 heterostructures.47 These results confirm that under UV-A, both electrons and holes are efficiently separated to the surface and contribute to the MO degradation.
4 Conclusions
In this study, it was demonstrated that the deposition and annealing temperatures had a strong effect on Bi2O3 film growth and crystallization by ultrasonic spray pyrolysis from bismuth(III) acetate metal–organic precursor. At the deposition temperature of 300 °C and below, films were amorphous due to the incomplete decomposition of bismuth(III) acetate. The deposition temperatures of 350–450 °C resulted in β-Bi2O3; the band gap values decreased from 3.2 to 2.9 eV with increasing temperature. An increase in the deposition temperature to 500 °C led to the appearance of the Bi4O7 crystalline phase. Deposition at 250 °C and 300 °C with annealing at temperatures ≥450 °C also resulted in the presence of a mixture of β-Bi2O3 and Bi4O7 phases. The films deposited at 250 °C and 300 °C and annealed below 450 °C resulted in β-Bi2O3 with preferred orientation along the (220) facet, while crystallites in as-deposited films had no preferential orientation.Moreover, according to the XPS results, the film deposited at 300 °C and annealed at 350 °C resulted in the highest amount of hydroxyl groups and carbon species on the surface, which correlates with the highest photocatalytic activity of the film studied for the oxidation of MO under UV-A (48% in 5 h). The photocatalytic activity of the films deposited at 300 °C and annealed at 350 °C was two times higher compared to the films deposited at 300 °C or 350 °C.
According to the scavengers test, it was shown that the photocatalytic mechanism of MO oxidation is similar for both TiO2 and Bi2O3 sprayed films. This study confirmed that β-Bi2O3 films with a band gap of 2.9 eV deposited by ultrasonic spray pyrolysis can be considered prospective visible light photocatalysts.
Author contributions
Jekaterina Sydorenko: conceptualization, validation, formal analysis, investigation, writing – original draft, visualization. Malle Krunks: conceptualization, writing – review & editing. Asanas Katerski: software, formal analysis. Raitis Grzibovskis: investigation. Aivars Vembris: investigation. Arvo Mere: formal analysis, writing – review & editing. Nicolae Spalatu: writing – review & editing. Ilona Oja Acik: conceptualization, resources, writing – review & editing, project administration, funding acquisition.Conflicts of interest
The authors declare that they have no known competing financial interests or personal relationships that could have appeared to influence the work reported in this paper.Acknowledgements
This research was funded by the Estonian Ministry of Education and Research, Estonian Research Council project PRG627, European Union's Horizon 2020 programme under the ERA Chair project 5GSOLAR, grant agreement No. 952509 and the Estonian Centre of Excellence project TK210; TK210U8. The authors acknowledge Valdek Mikli for SEM measurements.References
- B. Research, Photocatalysts: Technologies and Global Markets 2021-2026, 2021, https://www.bccresearch.com/market-research/advanced-materials/photocatalysts-technologies-markets-report.html, accessed 1 April 2024 Search PubMed.
- Y. Wangab, X. Ma, H. Li, B. Liu, H. Li, S. Yin and T. Sato, in Advanced Catalytic Materials – Photocatalysis and Other Current Trends, 2016, DOI:10.5772/61864.
- M. Intelligence, Photocatalyst Market – Growth, Trends, COVID-19 Impact, and Forecasts (2023 – 2028), https://www.mordorintelligence.com/industry-reports/photocatalyst-market/market-size, accessed 1 Aprill 2024.
- Z. Cui, H. Zhou, G. Wang, Y. Zhang, H. Zhang and H. Zhao, New J. Chem., 2019, 43, 7355–7362, 10.1039/c9nj01098j.
- X. Meng and Z. Zhang, J. Mol. Catal. A: Chem., 2016, 423, 533–549, DOI:10.1016/j.molcata.2016.07.030.
- A. H. Zahid and Q. Han, Nanoscale, 2021, 42, 17687–177724, 10.1039/d1nr03187b.
- C. C. Yu, H. Chang, A. C. Sun and J. W. Chiou, Vacuum, 2019, 169, 108918, DOI:10.1016/j.vacuum.2019.108918.
- J. C. Medina, M. Bizarro, C. L. Gomez, O. Depablos-Rivera, R. Mirabal-Rojas, B. M. Monroy, A. Fonseca-Garcia, J. Perez-Alvarez and S. E. Rodil, Catal. Today, 2016, 423, 533–549, DOI:10.1016/j.cattod.2015.10.025.
- K. Barrera-Mota, M. Bizarro, M. Castellino, A. Tagliaferro, A. Hernández and S. E. Rodil, Photochem. Photobiol. Sci., 2015, 14, 1110–1119, 10.1039/c4pp00367e.
- J. C. Medina, M. Bizarro, P. Silva-Bermudez, M. Giorcelli, A. Tagliaferro and S. E. Rodil, Thin Solid Films, 2016, 612, 72–81, DOI:10.1016/j.tsf.2016.05.034.
- T. N. Soitah, Y. Chunhui, Y. Yong, N. Yinghua and S. Liang, Curr. Appl. Phys., 2010, 10, 1372–1377, DOI:10.1016/j.cap.2010.04.006.
- D. Pérez-Mezcua, I. Bretos, R. Jiménez, J. Ricote, R. J. Jiménez-Rioboó, C. G. Da Silva, D. Chateigner, L. Fuentes-Cobas, R. Sirera and M. L. Calzada, Sci. Rep., 2016, 6, 39561, DOI:10.1038/srep39561.
- M. Hofmann, L. Rößner, M. Armbrüster and M. Mehring, ChemistryOpen, 2020, 9, 277–284, DOI:10.1002/open.201900323.
- H. Weidong, Q. Wei, W. Xiaohong, D. Xianbo, C. Long and J. Zhaohua, Thin Solid Films, 2007, 515, 5362–5365, DOI:10.1016/j.tsf.2007.01.031.
- K. Brezesinski, R. Ostermann, P. Hartmann, J. Perlich and T. Brezesinski, Chem. Mater., 2010, 22, 3079–3085, DOI:10.1021/cm903780m.
- H. Y. Jiang, P. Li, G. Liu, J. Ye and J. Lin, J. Mater. Chem. A, 2015, 3, 5119–5125, 10.1039/c4ta06235c.
- Y. Lu, Y. Zhao, J. Zhao, Y. Song, Z. Huang, F. Gao, N. Li and Y. Li, Cryst. Growth Des., 2015, 15, 1031–1042, DOI:10.1021/cg500792v.
- L. Zhang, W. Wang, J. Yang, Z. Chen, W. Zhang, L. Zhou and S. Liu, Appl. Catal., A, 2006, 308, 105–110, DOI:10.1016/j.apcata.2006.04.016.
- I. N. Martyanov and K. J. Klabunde, J. Catal., 2004, 225, 408–416 CrossRef CAS.
- K. L. Materna and L. Hammarström, Chem.–A Eur. J., 2021, 27, 16966–16977 CrossRef CAS PubMed.
- J. Spiridonova, A. Katerski, M. Danilson, M. Krichevskaya, M. Krunks and I. Oja Acik, Molecules, 2019, 24, 4326, DOI:10.3390/molecules24234326.
- I. Dundar, A. Mere, V. Mikli, M. Krunks and I. Oja Acik, Catalysts, 2020, 10, 1058, DOI:10.3390/catal10091058.
- T. T. Thuy, S. Hoste, G. G. Herman, N. Van De Velde, K. De Buysser and I. Van Driessche, J. Sol-Gel Sci. Technol., 2009, 51, 112–118, DOI:10.1007/s10971-009-1949-7.
- T. T. Thuy, S. Hoste, G. G. Herman, K. De Buysser, P. Lommens, J. Feys, D. Vandeput and I. Van Driessche, J. Sol-Gel Sci. Technol., 2009, 52, 124–133, DOI:10.1007/s10971-009-1987-1.
- Z. Xiao, P. Li, H. Zhang, S. Zhang, X. Tan, F. Ye, J. Gu, J. jun Zou and D. Wang, Fuel, 2024, 362, 130906 CrossRef CAS.
- I. Dundar, M. Krichevskaya, A. Katerski, M. Krunks and I. Oja Acik, Catalysts, 2019, 9(11), 915, DOI:10.3390/catal9110915.
- A. Syed, A. M. Elgorban, A. H. Bahkali and M. Sillanpää, Surf. Interfaces, 2021, 26, 101336, DOI:10.1016/j.surfin.2021.101336.
- X. Du, Y. Liu, X. Wang, J. Feng and C. Ren, J. Australas. Ceram. Soc., 2019, 55, 71–76, DOI:10.1007/s41779-018-0212-5.
- T. A. Gadhi, A. Hernández-Gordillo, M. Bizarro, P. Jagdale, A. Tagliaferro and S. E. Rodil, Ceram. Int., 2016, 42, 13065–13073, DOI:10.1016/j.ceramint.2016.05.087.
- Y. Huang, Y. Wei, J. Wang, D. Luo, L. Fan and J. Wu, Appl. Surf. Sci., 2017, 423, 119–130, DOI:10.1016/j.apsusc.2017.06.158.
- F. C. Correia, M. Calheiros, J. Marques, J. M. Ribeiro and C. J. Tavares, Ceram. Int., 2018, 44, 22638–22644, DOI:10.1016/j.ceramint.2018.09.040.
- J. Spiridonova, A. Mere, M. Krunks, M. Rosenberg, A. Kahru, M. Danilson, M. Krichevskaya and I. Oja Acik, Catalysts, 2020, 10, 1011, DOI:10.3390/catal10091011.
- J. Sydorenko, A. Mere, M. Krunks, M. Krichevskaya and I. Oja Acik, RSC Adv., 2022, 12, 35531–35542, 10.1039/d2ra06488j.
- K. Manabe, Y. Mitarai, T. Kubo and J. Soc, Chem. Ind. Japan, 1968, 71, 11, DOI:10.1246/nikkashi1898.71.11_1828.
- P. H. E. Falsetti, F. C. Soares, G. N. Rodrigues, D. M. S. Del Duque, W. R. de Oliveira, B. F. Gianelli and V. R. de Mendonça, Mater. Today Commun., 2021, 27, 102214, DOI:10.1016/j.mtcomm.2021.102214.
- R. Pandeeswari, T. Sonia, D. Balamurugan and B. G. Jeyaprakash, Sens. Imaging, 2022, 23, 1, DOI:10.1007/s11220-021-00371-1.
- A. P. Reverberi, P. S. Varbanov, M. Vocciante and B. Fabiano, Front. Chem. Sci. Eng., 2018, 12, 878–892, DOI:10.1007/s11705-018-1744-5.
- L. Zhang, Y. Shi, Z. Wang, C. Hu, B. Shi and X. Cao, Appl. Catal., B, 2020, 265, 118563, DOI:10.1016/j.apcatb.2019.118563.
- G. Zhang, L. Cai, Y. Zhang and Y. Wei, Chem.–A Eur. J., 2018, 24, 7434–7444, DOI:10.1002/chem.201706164.
- X. Han, Y. Li, H. Wang and Q. Zhang, Res. Chem. Intermed., 2020, 46, 5009–5021, DOI:10.1007/s11164-020-04237-1.
- I. Gromyko, M. Krunks, T. Dedova, A. Katerski, D. Klauson and I. Oja Acik, Appl. Surf. Sci., 2017, 405, 521–528, DOI:10.1016/j.apsusc.2017.02.065.
- M. A. Butkus and D. Grasso, Environ. Geol., 2001, 40, 446–453 CrossRef CAS.
- R. De Sun, A. Nakajima, A. Fujishima, T. Watanabe and K. Hashimoto, J. Phys. Chem. B, 2001, 105, 1984–1990, DOI:10.1021/jp002525j.
- S. Jenny, M. Masaya, T. Masato, Z. Jinlong, H. Yu, A. Masakazu and D. W. Bahnemann, Chem. Rev., 2014, 114, 9919–9986, DOI:10.1021/cr5001892.
- Z. Chen, T. Dedova, I. Oja Acik, M. Danilson and M. Krunks, Appl. Surf. Sci., 2021, 548, 149118, DOI:10.1016/j.apsusc.2021.149118.
- Y. Fu, S. Shan, F. Chen and J. Hu, J. Mater. Sci.: Mater. Electron., 2020, 31, 17967–17979 CrossRef.
- F. Ma, Q. Yang, Z. Wang, Y. Liu, J. Xin, J. Zhang, Y. Hao and L. Li, RSC Adv., 2018, 28, 15853–15862, 10.1039/c8ra01477a.
Footnote |
| † Electronic supplementary information (ESI) available. See DOI: https://doi.org/10.1039/d4ra02907k |
| This journal is © The Royal Society of Chemistry 2024 |