 Open Access Article
Efficient removal of methyl orange and ciprofloxacin by reusable Eu–TiO2/PVDF membranes with adsorption and photocatalysis methods†
Jiao Wang *,
Hemu Pi,
Panchao Zhao and
Na Zhou
Northwest Institute for Non-ferrous Metal Research, Xi'an, 710016, Shaanxi, P. R. China. E-mail: wjiao0311@163.com
First published on 10th June 2024
Abstract
The presence of methyl orange (MO) and ciprofloxacin (CIP) in wastewater poses a serious threat to the environment and human health. Titanium dioxide nanoparticles (TiO2 NPs) are widely studied as photocatalysts for wastewater treatment. However, TiO2 NPs have the drawbacks of high energy required for activation, fast electron–hole pair recombination and difficulty in recovering from water. To overcome these problems, europium decorated titanium dioxide/poly(vinylidene fluoride) (Eu–TiO2/PVDF) membranes were successful prepared in this work by combining the modified sol–gel method and the immersion phase inversion method. The Eu–TiO2/PVDF membranes obtained with the increase of Eu–TiO2 NPs content during the preparation process were named M1, M2 and M3, respectively. The pure PVDF membrane without the addition of Eu–TiO2 NPs was named M0, which was prepared by the immersion phase inversion method and served as a reference. The prepared Eu–TiO2/PVDF membranes could not only adsorb MO, but also degrade CIP under visible-light irradiation. Moreover, the Eu–TiO2/PVDF membranes exhibited adsorption–photocatalytic activity towards a mixture of MO and CIP under visible-light irradiation. Last but not the least, the Eu–TiO2/PVDF membranes exhibited excellent recyclability and reusability, opening the avenue for a possible use of these membranes in sewage-treatment plants.
1. Introduction
Dyes and antibiotics are detected frequently in wastewater, due to their widespread application.1–3 Methyl orange (MO), as a typical azo dye, has been used to dye textiles.4,5 It contains a nitrogen to nitrogen double bond (–N![[double bond, length as m-dash]](https://www.rsc.org/images/entities/char_e001.gif) N–), which is difficult to be degraded.6,7 Due to its toxicity and water solubility, the presence of MO in water is very harmful to human health and the environment.5,6 Ciprofloxacin (CIP), as a common antibiotic, is heavily used as the medicine in human activities.8,9 Its residue can cause eco-toxicological effects and enhance the resistance of bacteria in water.8–10 Therefore, the removal of MO and CIP from wastewater is an urgent problem to be solved.
N–), which is difficult to be degraded.6,7 Due to its toxicity and water solubility, the presence of MO in water is very harmful to human health and the environment.5,6 Ciprofloxacin (CIP), as a common antibiotic, is heavily used as the medicine in human activities.8,9 Its residue can cause eco-toxicological effects and enhance the resistance of bacteria in water.8–10 Therefore, the removal of MO and CIP from wastewater is an urgent problem to be solved.
However, traditional wastewater treatment methods, including flocculation, reverse osmosis, precipitation and ion exchange, have some limitations such as expensive equipment, secondary pollution, slow treatment rate and complex operation.11–13 Photocatalysis, as an important method in advanced oxidation progresses, has become a research hotspot in wastewater treatment due to its green energy-saving, easy operation, safety, low cost and no secondary pollution.14–16
As a typical photocatalyst, titanium dioxide (TiO2) has been used in photocatalysis because of its non-toxicity, low cost and chemical inertness.17,18 However, TiO2 has a large bandgap, which is needed for photocatalytic degradation of pollutants in water under ultraviolet (UV) irradiation.19 UV radiation accounts for only 5% of the energy in solar radiation, while visible light accounts for 43%.20 Therefore, improving the visible-light photocatalytic activity of TiO2 can better utilize solar light, thereby saving energy. In this work, TiO2 was decorated with the rare earth metal europium (Eu) to enhance its photocatalytic activity under visible-light irradiation. The specific benefits of Eu modified TiO2 are as follows: (1) the decoration of Eu can narrow the bandgap of TiO2 to achieve its absorption of visible light; (2) the f orbitals of Eu can interact with the functional groups in different pollutants to form complexes, thereby improving its adsorption capacity for pollutants.21
However, europium–titanium dioxide nanoparticles (Eu–TiO2 NPs) are easily washed away and cannot be well recovered in wastewater treatment due to their small particle size. In order to solve this problem, poly(vinylidene fluoride) (PVDF) membranes22 with good film-forming properties, high mechanical strength and stable chemical properties were prepared for the support of Eu–TiO2 NPs and serve as excellent adsorbents in water treatment. In this work, Eu–TiO2/PVDF membranes with different Eu–TiO2 NPs contents were prepared via the modified sol–gel method and the immersion phase inversion method. With the increase of Eu–TiO2 NPs content, the obtained Eu–TiO2/PVDF membranes were named M1, M2 and M3, respectively. The pure PVDF membrane without the addition of Eu–TiO2 NPs was named M0, which was prepared by the immersion phase inversion method and served as a reference. The obtained Eu–TiO2/PVDF membranes could not only adsorb MO, but also degrade CIP under visible-light irradiation. In order to study the adsorption or photocatalytic activity and mechanism of Eu–TiO2/PVDF membranes, the adsorption kinetics, adsorption isotherms and photocatalytic kinetics experiments were conducted and analysed. Moreover, the Eu–TiO2/PVDF membranes exhibited adsorption–photocatalytic activity towards a mixture of MO and CIP under visible-light irradiation. Finally, the Eu–TiO2/PVDF membranes exhibited good regeneration and reusability after adsorption–photocatalytic degradation of a mixture of MO and CIP.
2. Experimental section
2.1 Materials
Tetrabutyl titanate (TBOT, 98%), ethanol (CH3CH2OH, 99.5%), acetic acid (CH3COOH, 99.8%), dimethylacetamide (DMAc, 99%), methyl orange (MO, 85%) and hydrochloric acid (HCl, 37%) were purchased from Sinopharm Chemical Reagent Co., Ltd (Shanghai, China). Polyvinyl pyrrolidone K30 (PVP) was purchased from Tokyo Chemical Industry Co., Ltd (Tokyo, Japan). Europium nitrate hexahydrate (Eu(NO3)3·6H2O, 99.9%), poly(vinylidene fluoride) (PVDF) and ciprofloxacin (CIP, 98%) were purchased from Aladdin Reagents Co., Ltd (Shanghai, China).2.2 Preparation of Eu–TiO2 NPs
The modified sol–gel method was used to prepare Eu–TiO2 NPs.23 Firstly, 10 mL of TBOT and 30 mL of ethanol were mixed together under stirring for 10 min to get a transparent yellow sol, which is labelled as solution A. Secondly, 0.065 g of Eu(NO3)3·6H2O were dissolved into 10 mL of ethanol. After complete dissolution, 10 mL of ultrapure water and 5 mL of acetic acid were added into the former solution to obtain solution B. Solution A was added dropwise to solution B under stirring to form a mixture. After a while, the mixture was put under room temperature to get the gel. The gel was dried at 80 °C for 7 h and then calcined at 500 °C for 2 h to obtain Eu–TiO2 NPs.2.3 Preparation of the membranes
Eu–TiO2/PVDF membranes were prepared via the immersion phase inversion method.24,25 Firstly, the predetermined quantities of Eu–TiO2 NPs were dispersed in 12 mL of DMAc solvent under stirring. Subsequently, 2 g of PVDF and 0.8 g of PVP were added into the former suspension with sonication to obtain the homogenous solution. After 1 h sonication, the solution was heated for 8 h at 70 °C under stirring to obtain the casting solution. The casting solution was casted on the cleaned polyethylene terephthalate (PET) film and immersed into ultrapure water. After a while, the membrane was naturally separated from the PET substrate. The obtained Eu–TiO2/PVDF membranes were immersed in ultrapure water for 24 h and then dried at room temperature. With the increase of Eu–TiO2 NPs content, the Eu–TiO2/PVDF membranes were named M1, M2 and M3, respectively. Pure PVDF membrane (M0) without the addition of Eu–TiO2 NPs was prepared by the same immersion phase inversion method. The compositions of M0, M1, M2 and M3 are shown in Table 1.| Membrane compositions | M0 | M1 | M2 | M3 |
|---|---|---|---|---|
| PVDF (g) | 2 | 2 | 2 | 2 |
| PVP (g) | 0.8 | 0.8 | 0.8 | 0.8 |
| DMAc (mL) | 12 | 12 | 12 | 12 |
| Eu–TiO2 (g) | 0 | 0.02 | 0.2 | 0.4 |
2.4 Characterisation of the membranes
Scanning electron microscopy (SEM) SU5000 (Hitachi, Japan) was used to analyse the structure and morphology of the membranes. All membranes were treated with platinum sputter coating prior to SEM observation. The chemical compositions of the membranes were examined by Fourier Transform Infrared (FTIR) spectroscopy (Nicolet IS10, Thermo Nicolet Corporation, USA). IR spectra were acquired in transmission mode and the wavenumber range was from 4000 to 500 cm−1. The crystalline phase of all samples was investigated by a Bruker D8-Advance X-ray diffraction (XRD) system (Germany). The wettability of water droplets on the membranes' surface was characterized by using an optical contact angle measurements instruments (Dataphysics OCA50, Germany). Thermogravimetric analyses (TGA) were performed using a Netzsch STA 409 F3 thermal analyser (Germany). The membranes were heated from 25 to 600 °C (10 °C min−1) and under argon atmosphere (50 mL min−1). The Brunauer–Emmett–Teller (BET) surface area of the membranes was computed from the N2 adsorption–desorption isotherms by using the TriStar II Plus 3.03 (Micromeritics, USA).2.5 Adsorption experiments
All adsorption experiments on the membranes were performed under dark conditions and at room temperature with a constant stirring rate. MO absorbance changes were monitored by using an ultraviolet-visible (UV-Vis) spectrophotometer (UV 3600, Shimadzu, Japan). The maximum absorbance of the MO aqueous solution was at 463 nm. For the adsorption kinetic experiments, 20 cm2 of the membranes were added into 50 mL of the MO aqueous solution (3 mg L−1) under stirring and dark conditions. During the adsorption, samples were taken at different adsorption times of 10 min, 20 min, 30 min, 60 min, 90 min, 120 min, 150 min and 180 min. For the adsorption mechanism experiments, 20 cm2 of the membranes were added to each of the MO aqueous solution (50 mL) with different initial concentrations under dark conditions and stirring. The initial concentrations of the MO aqueous solution were 1, 3, 5, 20, 30, 60 and 90 mg L−1, respectively. Samples were taken after 180 min adsorption.The equilibrium adsorption capacity qe (mg g−1) was calculated by using eqn (1):26–28
 | (1) |
The pseudo-first-order (eqn (2)) and pseudo-second-order (eqn (3)) models were used to evaluate the adsorption kinetics of the membranes towards the pollutant.29
Ln(qe − qt) = ln![[thin space (1/6-em)]](https://www.rsc.org/images/entities/char_2009.gif) qe − k1t qe − k1t
| (2) |
 | (3) |
Langmuir (eqn (4)) and Freundlich (eqn (5)) adsorption models were used to investigate the adsorption mechanism of the membranes towards the pollutant.30,31
 | (4) |
 | (5) |
2.6 Photocatalytic experiments
The photocatalytic activity of the membranes was evaluated by the degradation of CIP under visible-light irradiation. A CEL-HXF300-T3 xenon lamp (China Education Au-light Co., Ltd, Beijing, China) with a UVIRCUT 420 filter for obtaining light at wavelength ranging from 420 to 780 nm was used as a visible-light source. 20 cm2 of the membranes were added into 50 mL of the CIP aqueous solution (3 mg L−1) under stirring. The mixture was kept in the dark for 30 min to establish the adsorption–desorption equilibrium. Subsequently, the mixture was placed under visible-light irradiation and samples were withdrawn at times 0 min (before irradiation) and after 10 min, 20 min, 30 min, 60 min, 90 min, 120 min, 150 min, 180 min, 210 min of visible-light irradiation. The absorbance changes for CIP were monitored by UV-Vis spectroscopy and the maximum absorbance of the CIP aqueous solution was at 277 nm. The obtained photocatalytic degradation curve was fitted by using a pseudo-first-order kinetic model as in eqn (6):32
 | (6) |
2.7 Adsorption–photocatalysis experiments
A mixture of MO and CIP was used as a mixed pollutants model to evaluate the adsorption–photocatalytic activity of the Eu–TiO2/PVDF membranes. Firstly, a mixed solution of MO and CIP (CMO = CCIP = 1 mg L−1) was prepared. 20 cm2 of the Eu–TiO2/PVDF membrane (M2) were added into 50 mL of the aforementioned mixed solution under stirring and dark conditions for 180 min to reach the adsorption–desorption equilibrium. During the adsorption process, samples were withdrawn at 30 min, 60 min, 90 min, 120 min, 150 min and 180 min. Subsequently, the former mixture was placed under visible-light irradiation with stirring for 180 min. During this process, samples were withdrawn at 0 min (equivalent to 180 min of the former adsorption process), 30 min, 60 min, 90 min, 120 min, 150 min and 180 min after visible-light irradiation. The absorbance changes of all samples were monitored by UV-Vis spectroscopy.Besides, a similar procedure was followed for the recycling adsorption–photocatalysis experiments: after each adsorption–photocatalysis experiment, M2 was washed by 0.1 M HCl and ultrapure water, dried, and reused for the subsequent adsorption–photocatalysis experiment of a fresh MO and CIP solution.
3. Results and discussion
3.1 Preparation and characterisation of the membranes
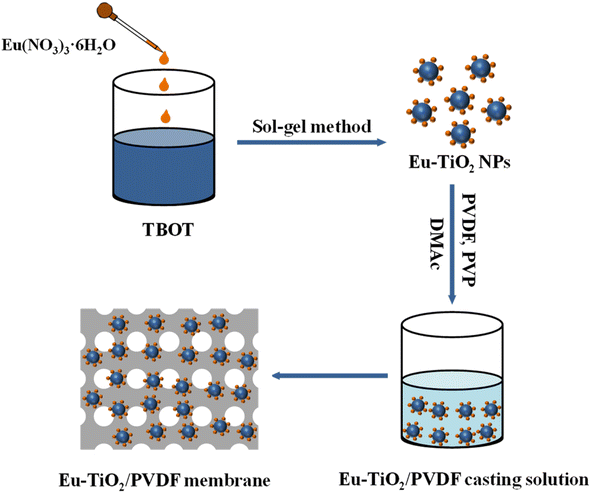
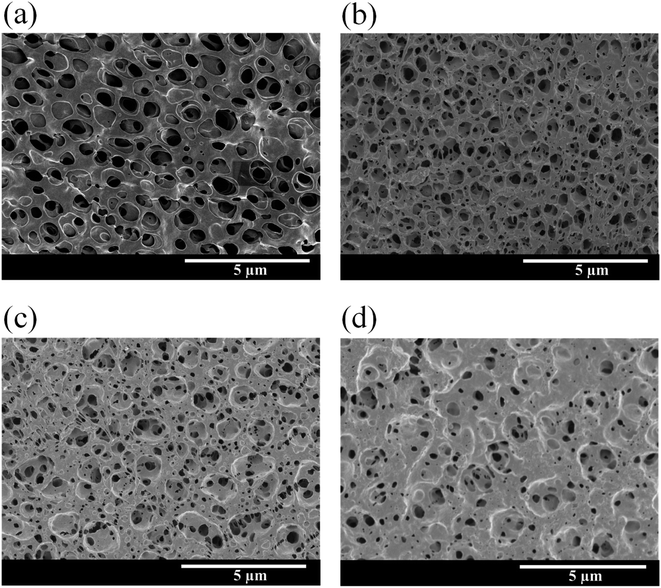
The preparation pathway for the Eu–TiO2/PVDF membranes (M1, M2 and M3) is illustrated in Scheme 1. The experiment details are reported in the Experimental section. The Eu–TiO2/PVDF membranes (M1, M2 and M3) were prepared by the combination of the modified sol–gel method and the immersion phase inversion method. Pure PVDF membrane (M0) without the addition of Eu–TiO2 NPs was prepared by the immersion phase inversion method. The morphology and structure of all membranes were characterised by SEM measurements.Fig. 1(a) shows the SEM image of the pure PVDF membrane (M0), which has a smooth surface. Most of the pores on M0 are at the micrometer level, with only a small portion at the nanometer level. Fig. 1(b)–(d) show the SEM images of Eu–TiO2/PVDF membranes (M1, M2 and M3) with different contents of Eu–TiO2 NPs, respectively. The porous size of M1, M2 and M3 is also from nano to micro scale. When the Eu–TiO2 NPs content of the membranes increases, the pores on the membranes become smaller, and the number of pores on the membranes also decrease. Among them, M3 has the smallest number of pores. The possible reason is that the excessive mixed Eu–TiO2 NPs aggregation, which blocks the pores of the membrane and reduces its pore size.33,34
EDS analyses of Eu–TiO2/PVDF membranes (M1, M2 and M3) were performed and the results were collected in Fig. S1, S2 and Table S1.† According to EDS analyses, the main structural elements of M1, M2 and M3 are carbon (C), oxygen (O) and fluorine (F), as expected. Platinum (Pt) was detected on all membranes, because all membranes were sputtered with Pt before SEM testing to ensure good conductivity. The presence of titanium (Ti) in M2 and M3 confirmed that the presence of TiO2. However, there was no Ti in M1, which might be the lower content of TiO2 of M1. Furthermore, the element composition determined by EDS showed that the weight percentage of C, O, F, Pt and Ti. In Table S1,† C, O and F accounted for the main percentage in M1, M2 and M3, while Ti had a relatively low percentage. The weight percentage of Ti in M1, M2 and M3 was 0, 0.03% and 1.83%, respectively.
IR spectra of M0, M1, M2 and M3 are shown in Fig. 2(a). All membranes exhibited distinct characteristic peaks of PVDF, which included –CH2 bending (1402 cm−1), –CF2 stretching (1174 cm−1) and amorphous phase absorption (876 and 839 cm−1).28,35,36 The peak with less intensity at 1664 cm−1 was due to C![[double bond, length as m-dash]](https://www.rsc.org/images/entities/char_e001.gif) O stretching vibration of PVP.37 The spectra suggested that no changes occurred after the mixture of PVDF with Eu–TiO2 NPs and no residual solvent left on the membranes.
O stretching vibration of PVP.37 The spectra suggested that no changes occurred after the mixture of PVDF with Eu–TiO2 NPs and no residual solvent left on the membranes.
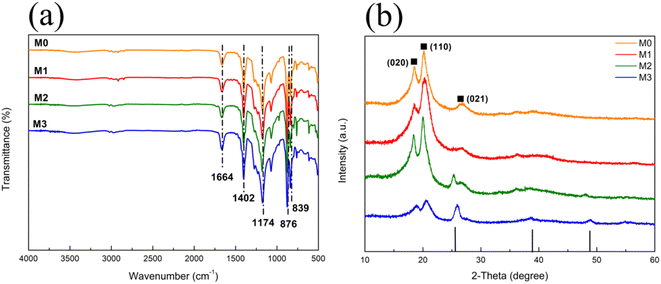 | ||
| Fig. 2 (a) IR spectra and (b) XRD patterns of M0 (orange line), M1 (red line), M2 (green line) and M3 (blue line). | ||
XRD patterns of the pure PVDF membrane (M0) and Eu–TiO2/PVDF membranes (M1, M2 and M3) are displayed in Fig. 2(b). M0 showed the diffraction peaks at 18.47, 20.24 and 26.88, corresponding to PVDF, with (020), (110) and (021) diffraction planes.38 Obviously, the characteristic peaks of PVDF appeared in M1, M2 and M3. Furthermore, for both M2 and M3, in addition to the characteristic peaks of PVDF, new peaks were observed at 25.45, 38.88 and 48.83, corresponding to TiO2, with (101), (004) and (200) planes. These results confirmed the successful incorporation of TiO2 NPs into the membranes. For M1, the characteristic peaks of TiO2 were not obvious, because the mass of Eu–TiO2 NPs was much lower than that of PVDF. These results are consistent with the characterization results of EDS mapping (Fig. S1, S2 and Table S1†).
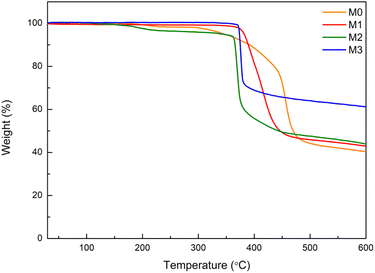
Thermal stability is an important criterion for Eu–TiO2/PVDF membranes before applying these membranes to different applications. Fig. 3 illustrates the TGA curves of the pure PVDF membrane (M0) and Eu–TiO2/PVDF membranes (M1, M2 and M3). When the heat treatment temperature was in the range of 300–500 °C, the weight loss of all membranes was notable. The degradation temperature was shifted from 304 °C (for M0) to 373 °C (for M3), which indicated that the thermal stability of membranes increased with the enhancement of Eu–TiO2 NPs amount.22,39 In addition, the results showed that the residual mass of M0, M1, M2 and M3 was 40%, 42%, 44% and 61% at 600 °C, respectively. The pure PVDF membrane showed higher weight loss than Eu–TiO2/PVDF membranes, which was due to the enhancement of Eu–TiO2 NPs amount and the good interfacial interactions between PVDF and Eu–TiO2 NPs.22,39
The water contact angle for exploring the hydrophilicity of the membranes is shown in Table 2. The contact angle of the pure PVDF membrane (M0) was about 114 ± 6°, which suggested that the surface of the pure PVDF membrane (M0) was hydrophobic.40 The contact angle was about 108 ± 7° for M1, 92 ± 7° for M2 and 56 ± 4° for M3, indicating that the contact angle of the membrane decreased with the increase of Eu–TiO2 NPs content in the membrane. The possible reason was that the presence of Eu–TiO2 NPs with a large number of hydrophilic groups (Ti–OH) made the membranes hydrophilicity thereby reducing the value of water contact angle.37 In a word, a decrease in contact angle lead to an increase in the hydrophilicity of the membrane, which is beneficial for its future application in water treatment.
| Membranes | Content of Eu–TiO2 (g) | Average contact angle (°) |
|---|---|---|
| M0 | 0 | 114 ± 6 |
| M1 | 0.02 | 108 ± 7 |
| M2 | 0.2 | 92 ± 7 |
| M3 | 0.4 | 56 ± 4 |
The N2 adsorption–desorption isotherm in Fig. 4 was carried out to determine the specific surface area of M0, M1, M2 and M3. As shown in Table 3, the BET surface area of M0, M1, M2 and M3 was 16.5258, 20.5867, 20.4360 and 26.0562 m2 g−1, respectively. Compared with the BET surface area of the pure PVDF membrane (M0), the BET surface area of Eu–TiO2/PVDF membranes (M1, M2 and M3) increased, which was attributed to the introduction of Eu–TiO2 NPs. After introducing Eu–TiO2 NPs, the proportion of the smaller pore sizes increased quickly, while the large void structures decreased or even disappeared.41
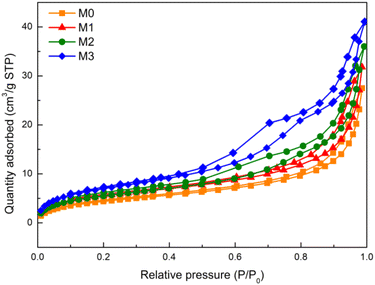 | ||
| Fig. 4 Nitrogen adsorption–desorption isotherm of M0 (orange line), M1 (red line), M2 (green line) and M3 (blue line). | ||
| Membranes | M0 | M1 | M2 | M3 |
|---|---|---|---|---|
| Specific surface area (m2 g−1) | 16.5258 | 20.5867 | 20.4360 | 26.0562 |
3.2 Adsorption capacity of the membranes towards MO
MO was selected as a target pollutant to evaluate the adsorption capacity of M0, M1, M2 and M3, respectively. The chemical structure of MO is shown in Fig. S3(a).† Fig. 5 shows the adsorption kinetics curves of MO on M0, M1, M2 and M3. The adsorption percentage of MO was 75% by M0, 36% by M1, 39% by M2 and 27% by M3. The data indicated that the adsorption capacity of the pure PVDF membrane (M0) was better than Eu–TiO2/PVDF membranes (M1, M2 and M3). The possible reason is that the excessive mixed Eu–TiO2 NPs aggregation, which blocks the pores of the membrane and reduces its pore size and pore numbers.34 As a result, the active sites of the membranes reduced, which prevented the adsorption of MO to the membranes.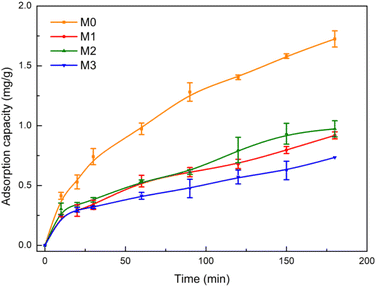 | ||
| Fig. 5 Adsorption kinetic curves of MO by M0 (orange line), M1 (red line), M2 (green line) and M3 (blue line) under dark conditions (initial concentration of MO: 3 mg L−1). | ||
The fitting of pseudo-first-order (eqn (2)) and pseudo-second-order (eqn (3)) model is shown in Fig. S4 and S5,† respectively, and the kinetic constants are listed in Table 4. The results indicate that the kinetic data of MO by M0, M1, M2 and M3 are better fitted with the pseudo-first-order model than with the pseudo-second-order. Because for M0, M1 and M3, the correlation coefficient value of the pseudo-first-order model (R2 = 0.9781 for M0, 0.9638 for M1, 0.9611 for M3) is higher than the one of the pseudo-second-order model (R2 = 0.9042 for M0, 0.9127 for M1, 0.9401 for M3). And for M2, the theoretical equilibrium adsorption capacity of the pseudo-first-order (1.02 mg g−1) is the same with the actual equilibrium adsorption capacity (qe,exp = 1.02 mg g−1). It is usually observed that when adsorption diffusion occurs through the interface, the dynamics follow this pseudo-first-order equation.27 The adsorption kinetics of M0, M1, M2 and M3 towards MO are more fit the pseudo-first-order model, suggesting that the adsorption rate decreased linearly with the increase of adsorption capacity.27,29
| Membranes | qe,exp (mg g−1) | Pseudo-first-order model | Pseudo-second-order model | ||||
|---|---|---|---|---|---|---|---|
| qe (mg g−1) | k1 (min−1) | R2 | qe (mg g−1) | k2 (g (mg−1 min−1)) | R2 | ||
| M0 | 1.73 | 1.66 | 0.01527 | 0.9781 | 1.79 | 0.01695 | 0.9042 |
| M1 | 0.92 | 1.20 | 0.01203 | 0.9638 | 0.86 | 0.04035 | 0.9127 |
| M2 | 1.02 | 1.02 | 0.01757 | 0.8551 | 0.98 | 0.03292 | 0.8664 |
| M3 | 0.73 | 0.62 | 0.01181 | 0.9611 | 0.65 | 0.07445 | 0.9401 |
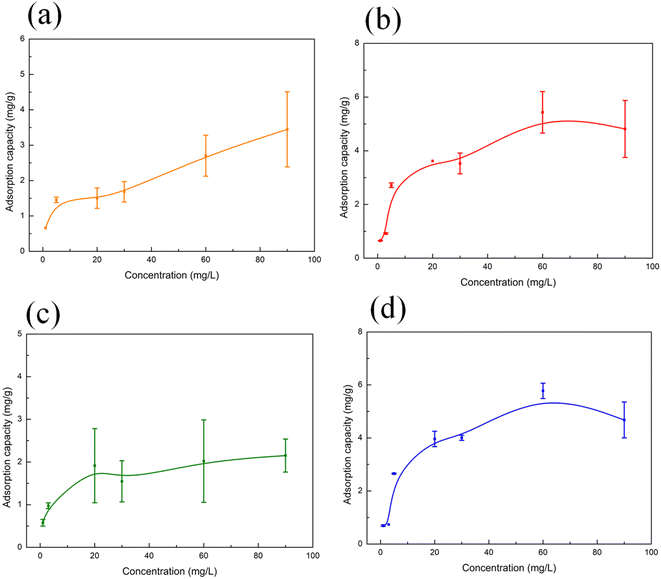
The experimental adsorption isotherm for MO adsorption on M0, M1, M2 and M3 (Fig. 6) indicates that the maximum adsorption capacity of the membranes towards MO reached 3.5, 4.8, 2.2 and 4.7 mg g−1, respectively, after 180 min of adsorption. Langmuir and Freundlich adsorption isotherms obtained using eqn (4) and (5) are presented in Fig. S6 and S7,† and the parameters are listed in Table 5. The Langmuir adsorption model states that the adsorption of the adsorbate is limited to a single layer and the adsorbent sites are homogeneous.26,42 It means that there is no interaction between the adsorbents, and each adsorbent occupies only one adsorption site. The Freundlich adsorption model implies multilayer adsorption, which results in different adsorption energies, because the adsorption sites on the surface of the adsorbent are heterogeneous.26 Fig. S6, S7† and Table 5 indicate that the data of M0, M1 and M2 are better fitted with the Langmuir adsorption model than with the Freundlich one, and the data of M3 are better fitted with the Freundlich adsorption model than with the Langmuir one. The evidence is that for M0, M1 and M2, the correlation coefficient value of the Langmuir adsorption model (R2 = 0.8736 for M0, 0.9717 for M1, 0.9738 for M2) is higher than the one of the Freundlich adsorption model (R2 = 0.6653 for M0, 0.7740 for M1, 0.4072 for M2). However, for M3, the correlation coefficient value of the Freundlich adsorption model (R2 = 0.9808) is higher than the one of Langmuir adsorption model (R2 = 0.9590). Therefore, the adsorption sites on the surface of M0, M1 and M2 are uniform and the rate determining step in the adsorption process is the interaction between MO and the adsorption sites of the membranes (M0, M1 and M2). It can be presumed that the adsorption of MO on M0, M1 and M2 mainly occurs through MO to the porous structure on the membranes. As for M3, the adsorption sites on its surface are heterogeneous with the different adsorption energies, that is, the active site of the adsorption is more than one. The possible adsorption mechanism of M3 is that MO adsorbed through porous structure and the Eu–TiO2 NPs effect on M3.
| Membranes | Langmuir constants | Freundlich constants | ||||
|---|---|---|---|---|---|---|
| KL (L mg−1) | qm (mg g−1) | R2 | KF (mg g−1) | 1/n | R2 | |
| M0 | 0.1101 | 3.23 | 0.8736 | 1.23 | 0.1699 | 0.6653 |
| M1 | 0.2354 | 5.05 | 0.9717 | 1.43 | 0.3011 | 0.7740 |
| M2 | 0.3092 | 2.05 | 0.9738 | 1.08 | 0.1592 | 0.4072 |
| M3 | 0.2564 | 5.12 | 0.9590 | 1.29 | 0.4106 | 0.9808 |
3.3 Photocatalytic activity of the membranes towards CIP under visible-light irradiation
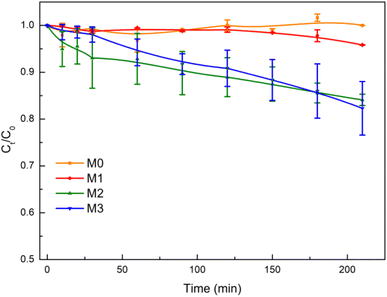
CIP was selected to evaluate the photocatalytic activity of the membranes under visible-light irradiation. The chemical structure of CIP is shown in Fig. S3(b).† The concentration of CIP is barely changed under visible-light irradiation in the absence of the photocatalyst (Fig. S8(a)†). The photodegradation of CIP was studied by acquiring the absorption spectra of the CIP solution at different times of visible-light irradiation in the presence of M0, M1, M2 and M3, as shown in Fig. S9.†In Fig. 7, the variation of CIP concentration over time shows that after 210 min of visible-light exposure, the concentration of CIP decreased by 0, 4%, 16% and 21% in the presence of M0, M1, M2 and M3, respectively. The results show that there was no degradation of CIP in the presence of M0 under visible-light irradiation, because of the absence of Eu–TiO2 NPs. Besides, when using photocatalysts from M1 to M3, the photocatalytic degradation efficiency of CIP increased. The possible reason is that the content of Eu–TiO2 NPs increased from M1 to M3. Therefore, Eu–TiO2 NPs played a photocatalytic role in the membranes.
The pseudo-first-order kinetic model (eqn (6)) is used to analyse the degradation kinetics of CIP by the membranes. Fig. S10† and Table 6 show that the degradation rate constant of CIP in the presence of M1, M2 and M3 was 3.2 × 10⁻⁶, 6.9 × 10⁻⁴ and 8.8 × 10⁻⁴ min−1, respectively. The degradation rate constant for M3, in the case of CIP, was about 1.3 times higher than that for M2 and was about 275 times higher than that for M1. It could be ascribe that the content of Eu–TiO2 NPs in M3 was 2 times higher than that of M2 and was 20 times higher than that of M1. The results indicated that within a certain range, as the Eu–TiO2 NPs content of the membranes increased, the photocatalytic degradation efficiency of the Eu–TiO2/PVDF membranes towards CIP increased.
| Membranes | Degradation efficiency (%) | k (min−1) |
|---|---|---|
| M0 | 0 | 0 |
| M1 | 4 | 3.2 × 10⁻⁶ |
| M2 | 16 | 6.9 × 10⁻⁴ |
| M3 | 21 | 8.8 × 10⁻⁴ |
3.4 Adsorption–photocatalytic activity of the membrane towards a mixture of MO and CIP
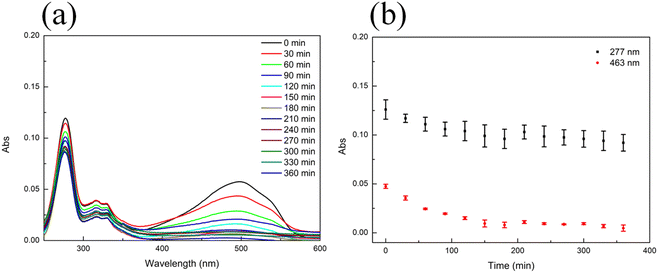
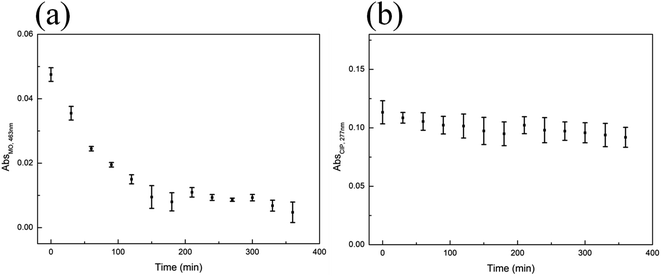
The adsorption–photocatalytic activity of the Eu–TiO2/PVDF membrane towards a mixture of MO and CIP was investigated. M2 was used to evaluate the adsorption–photocatalytic activity of the Eu–TiO2/PVDF membrane, as it showed relatively good adsorption and photocatalytic performance in former experiments. In this experiment, M2 was added into a mixture of the equiconcentrated MO and CIP solution (1 mg L−1) and placed under stirring and dark conditions at first, subsequently, under visible-light irradiation. After 180 min of dark adsorption, the adsorption–desorption equilibrium reached and the mixture was placed under visible-light irradiation. It is worth noting that in the absence of the photocatalyst, the concentration of CIP or MO remains almost unchanged under visible-light irradiation (Fig. S8†). Fig. 8 shows the adsorption and photocatalytic degradation of the mixture of MO and CIP by M2. Fig. 8(b) was obtained by plotting the registered absorbance values at the maximum absorption wavelengths of CIP (277 nm) and MO (463 nm). It is important to underline that only MO absorbs light at 463 nm, while the absorbance at 277 nm stems from the contribution of both MO and CIP. The removal percentage of MO and CIP by M2 was 95% and 19%, respectively, after 360 min, namely after both the dark adsorption and photocatalytic experiments were performed.In order to study the adsorption–photocatalytic kinetics of M2 towards MO, data were collected at 463 nm from 0 min to 360 min (Fig. 9(a)). In Fig. 9(a), the adsorption of MO by M2 accounted for a significant proportion. Therefore, the pseudo-first-order (eqn (2)) and pseudo-second-order (eqn (3)) models were selected to evaluate the adsorption–photocatalysis kinetics of M2 towards MO in this study. Fig. S11† and Table 7 show that the kinetic data are better fitted with a pseudo-second-order model than with a pseudo-first-order one: the correlation coefficient value of the pseudo-second-order model (R2 = 0.9582) is higher than that of the pseudo-first-order one (R2 = 0.2837). According to the pseudo-second-order model, the adsorption rate depends on the adsorption capacity not on the concentration of adsorbate and the rate-determining step in the adsorption process is the interaction of MO with the adsorption sites of M2.27,29
| Pollutants | qe,exp (mg g−1) | Pseudo-first-order model | Pseudo-second-order model | ||||
|---|---|---|---|---|---|---|---|
| qe (mg g−1) | k1 (min−1) | R2 | qe (mg g−1) | k2 (g (mg−1 min−1)) | R2 | ||
| MO | 0.55 | 0.62 | 0.02253 | 0.2837 | 0.62 | 0.03538 | 0.9582 |
| CIP | 0.13 | 0.11 | 0.00592 | 0.6901 | 0.16 | 0.03545 | 0.4117 |
At 277 nm (maximum absorption value for CIP), both MO and CIP absorb light. Therefore, the absorbance of CIP at 277 nm was calculated by subtracting the absorbance of MO at 277 nm from the absorbance of the mixture of MO and CIP at the same wavelength (Fig. 9(b)). The pseudo-first-order (eqn (2)) and pseudo-second-order (eqn (3)) models were used to evaluate the adsorption–photocatalytic degradation kinetics of M2 towards CIP. Fig. S12† and Table 7 show that the kinetic data are better fitted with a pseudo-first-order model than with a pseudo-second-order one: the correlation coefficient value of the pseudo-first-order model (R2 = 0.6901) results higher than that of the pseudo-second-order one (R2 = 0.4117). According to the pseudo-first-order model, the rate of change of solute uptake with time is directly proportional to difference in saturation concentration and the amount of solid uptake with time, which is generally applicable over the initial stage of an adsorption process.27 It is commonly observed that kinetics followed the pseudo-first-order model when adsorption occurs through diffusion through the interface.27
3.5 Reusability of the membranes
Based on the easy separation and recovery characteristics of the PVDF membrane, the Eu–TiO2/PVDF membranes could be easily and quickly recycled and reused. In this work, we performed the recycling experiments to assess the adsorption–photocatalysis performance of the Eu–TiO2/PVDF membrane (M2) over different adsorption–photocatalytic cycles. A mixture of MO and CIP was used as the model mixed pollutants for this experiment. M2 was utilised in the adsorption–photocatalytic degradation of a mixture of MO and CIP, recovered, washed with 0.1 M HCl and ultrapure water, and dried before being used for another adsorption–photocatalytic experiment with a fresh mixture of MO and CIP solution. This procedure was repeated for five times. The results for five adsorption–photocatalysis cycles are reported in Fig. 10. As shown in Fig. 10(a), the removal percentage of MO by M2 only slightly decreased with the number of reutilisations. After five cycles, the amount of removed MO decreased only 9%, namely from 95% to 86% of the initial MO amount. Fig. 10(b) shows that after five cycles, the amount of removed CIP decreased by 15%, namely from 19% to 4% of the initial CIP amount. The small decrease in the removal efficiency may be due to the loss of active sites caused by the adsorption on the surface of the catalyst of possibly unreacted MO/CIP and/or its degradation products.8,43 These results indicated that the Eu–TiO2/PVDF membrane possessed good stability and durability thus opening the path, after further studies, for a possible future industrial application.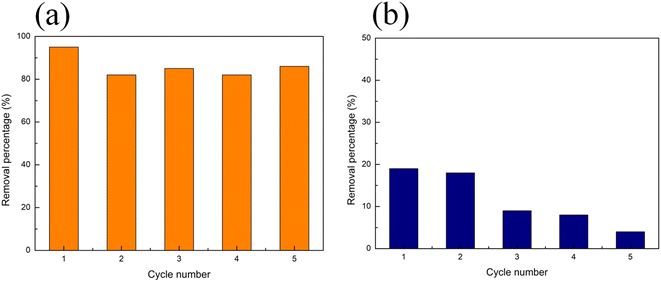 | ||
| Fig. 10 Recycling experiments of M2 adsorbing–degrading a mixture of MO and CIP: removal percentage of (a) MO and (b) CIP. | ||
4. Conclusions
In summary, Eu–TiO2/PVDF membranes were prepared by the combination of the modified sol–gel method and the immersion phase inversion method. The obtained Eu–TiO2/PVDF membranes were named M1, M2 and M3 with the increase of Eu–TiO2 NPs content. Meanwhile, as a reference, the pure PVDF membrane (M0) was prepared by the immersion phase inversion method. The obtained membranes could not only adsorb MO, but also degrade CIP under visible-light irradiation. In details, the adsorption percentage of MO by M0, M1, M2 and M3 was 75%, 36%, 39% and 27% and the degradation efficiency of CIP by M1, M2 and M3 was 4%, 16% and 21%, respectively. In addition, the adsorption rate constant of MO in the presence of M0, M1, M2 and M3 was 0.01527, 0.01203, 0.01757 and 0.01181 min−1 and the degradation rate constant of CIP by M1, M2 and M3 was 3.2 × 10⁻⁶, 6.9 × 10⁻⁴ and 8.8 × 10⁻⁴ min−1. Moreover, the Eu–TiO2/PVDF membrane (M2) showed adsorption–degradation activity towards a mixture of MO and CIP under visible-light irradiation. After 360 min of adsorption-degradation, the removal percentage of MO was 95% and the removal percentage of CIP was 19%, in the presence of M2. Finally, due to the use of PVDF membrane as a support, the Eu–TiO2/PVDF membranes could be easily and quickly recycled and reused. After five cycles, the removal percentage of MO only decreased 9% and the removal percentage of CIP decreased 15%. It is foreseen that the Eu–TiO2/PVDF membranes will find practical utilisation and application in water treatment.Author contributions
Conceptualization: J. W.; data curation: J. W.; formal analysis: J. W., H. M. P., P. C. Z., N. Z.; funding acquisition: J. W.; investigation: J. W., H. M. P., P. C. Z., N. Z.; methodology: J. W., H. M. P., P. C. Z., N. Z.; project administration: J. W.; resources: J. W.; supervision: J. W.; validation: J. W.; visualization: J. W.; writing – original draft: J. W.; writing – review & editing: J. W.Conflicts of interest
The authors declare no conflict of interest.Acknowledgements
The authors gratefully acknowledge financial support from Natural Science Basic Research Program of Shaanxi, P. R. China (Program No. 2023-JC-QN-0570), Young Talent Fund of Xi’an Association for Science and Technology, P. R. China (Program No. 959202313040) and Shaanxi Province Scholarship Program for Science and Technology Activities of the Returned Overseas Chinese, P. R. China (Program No. 2022-026).References
- F. M. Drumond Chequer, G. A. R. de Oliveira, E. R. Anastacio Ferraz, J. Carvalho, M. V. Boldrin Zanoni and D. P. de Oliveir, Textile dyes: dyeing process and environmental impact, Eco-Friendly Text. Dyeing Finish., 2013, 6, 151–176 Search PubMed.
- C. R. Holkar, A. J. Jadhav, D. V. Pinjari, N. M. Mahamuni and A. B. Pandit, A critical review on textile wastewater treatments: possible approaches, J. Environ. Manage., 2016, 182, 351–366 CrossRef CAS.
- H. Salazar, P. M. Martins, B. Santos, M. M. Fernandes, A. Reizabal, V. Sebastián, G. Botelho, C. J. Tavares, J. L. Vilas-Vilela and S. Lanceros-Mendez, Photocatalytic and antimicrobial multifunctional nanocomposite membranes for emerging pollutants water treatment applications, Chemosphere, 2020, 250, 126299 CrossRef CAS PubMed.
- J. Shen, Z. Li, Y. nan Wu, B. Zhang and F. Li, Dendrimer-based preparation of mesoporous alumina nanofibers by electrospinning and their application in dye adsorption, Chem. Eng. J., 2015, 264, 48–55 CrossRef CAS.
- M. S. Najafinejad, P. Mohammadi, M. Mehdi Afsahi and H. Sheibani, Green synthesis of the Fe3O4@polythiophen-Ag magnetic nanocatalyst using grapefruit peel extract: application of the catalyst for reduction of organic dyes in water, J. Mol. Liq., 2018, 262, 248–254 CrossRef CAS.
- R. Kumar, G. Kumar and A. Umar, ZnO nano-mushrooms for photocatalytic degradation of methyl orange, Mater. Lett., 2013, 97, 100–103 CrossRef CAS.
- L. Zhang, H. Li, Y. Liu, Z. Tian, B. Yang, Z. Sun and S. Yan, Adsorption-photocatalytic degradation of methyl orange over a facile one-step hydrothermally synthesized TiO2/ZnO-NH2-RGO nanocomposite, RSC Adv., 2014, 4, 48703–48711 RSC.
- A. Kaur, W. A. Anderson, S. Tanvir and S. K. Kansal, Solar light active silver/iron oxide/zinc oxide heterostructure for photodegradation of ciprofloxacin, transformation products and antibacterial activity, J. Colloid Interface Sci., 2019, 557, 236–253 CrossRef CAS PubMed.
- W. Xu, G. Zhang, X. Li, S. Zou, P. Li, Z. Hu and J. Li, Occurrence and elimination of antibiotics at four sewage treatment plants in the Pearl River Delta (PRD), South China, Water Res., 2007, 41, 4526–4534 CrossRef CAS.
- J. Wang, L. Svoboda, Z. Němečková, M. Sgarzi, J. Henych, N. Licciardello and G. Cuniberti, Enhanced visible-light photodegradation of fluoroquinolone-based antibiotics and E. coli growth inhibition using Ag–TiO2 nanoparticles, RSC Adv., 2021, 11, 13980–13991 RSC.
- R. B. Rajput, S. N. Jamble and R. B. Kale, A review on TiO2/SnO2 heterostructures as a photocatalyst for the degradation of dyes and organic pollutants, J. Environ. Manage., 2022, 307, 114533 CrossRef CAS PubMed.
- S. K. Kansal, M. Singh and D. Sud, Studies on photodegradation of two commercial dyes in aqueous phase using different photocatalysts, J. Hazard. Mater., 2007, 141, 581–590 CrossRef CAS PubMed.
- B. Rani, S. Punniyakoti and N. K. Sahu, Polyol asserted hydrothermal synthesis of SnO2 nanoparticles for the fast adsorption and photocatalytic degradation of methylene blue cationic dye, New J. Chem., 2018, 42, 943–954 RSC.
- Y. Deng and R. Zhao, Advanced oxidation processes (AOPs) in wastewater treatment, Curr. Pollut. Rep., 2015, 1, 167–176 CrossRef CAS.
- J. Zhang, B. Tian, L. Wang, M. Xing and J. Lei, Photocatalysis, Springer, 2018 Search PubMed.
- J. C. Wang, H. H. Lou, Z. H. Xu, C. X. Cui, Z. J. Li, K. Jiang, Y. P. Zhang, L. B. Qu and W. Shi, Natural sunlight driven highly efficient photocatalysis for simultaneous degradation of rhodamine B and methyl orange using I/C codoped TiO2 photocatalyst, J. Hazard. Mater., 2018, 360, 356–363 CrossRef CAS PubMed.
- J. Jing, J. Li, J. Feng, W. Li and W. W. Yu, Photodegradation of quinoline in water over magnetically separable Fe3O4/TiO2 composite photocatalysts, Chem. Eng. J., 2013, 219, 355–360 CrossRef CAS.
- N. Hosseini Nasab, M. M. Jalili and S. Farrokhpay, Application of paraffin and silver coated titania nanoparticles in polyethylene nanocomposite food packaging films, J. Appl. Polym. Sci., 2018, 135, 1–7 CrossRef.
- S. Wu, X. Li, Y. Tian, Y. Lin and Y. H. Hu, Excellent photocatalytic degradation of tetracycline over black anatase-TiO2 under visible light, Chem. Eng. J., 2021, 406, 126747 CrossRef CAS.
- C. Jia, X. Zhang, K. Matras-Postolek, B. Huang and P. Yang, Z-Scheme reduced graphene oxide/TiO2-Bronze/W18O49 ternary heterostructure towards efficient full solar-spectrum photocatalysis, Carbon, 2018, 139, 415–426 CrossRef CAS.
- S. Karuppaiah, R. Annamalai, A. Muthuraj, S. Kesavan, R. Palani, S. Ponnusamy, E. R. Nagarajan and S. Meenakshisundaram, Efficient photocatalytic degradation of ciprofloxacin and bisphenol A under visible light using Gd2WO6 loaded ZnO/bentonite nanocomposite, Appl. Surf. Sci., 2019, 481, 1109–1119 CrossRef CAS.
- H. Nawaz, M. Umar, I. Nawaz, A. Ullah, M. Tauseef Khawar, M. Nikiel, H. Razzaq, M. Siddiq and X. Liu, Hybrid PVDF/PANI membrane for removal of dyes from textile wastewater, Adv. Eng. Mater., 2022, 24, 2100719 CrossRef CAS.
- D.-S. Zhen, M. Guo, X.-F. Li, H.-L. Mao, C.-A. Li, J.-L. Li and Y. Liu, Eu–TiO2 nanocomposite with high photoelectrochemical activity for enhanced photocatalysis of rhodamine B, J. Nanosci. Nanotechnol., 2019, 19, 7758–7763 CrossRef CAS PubMed.
- J. Li, X. Liu, J. Lu, Y. Wang, G. Li and F. Zhao, Anti-bacterial properties of ultrafiltration membrane modified by graphene oxide with nano-silver particles, J. Colloid Interface Sci., 2016, 484, 107–115 CrossRef CAS.
- Y. Peng, Z. Yu, Y. Pan and G. Zeng, Antibacterial photocatalytic self-cleaning poly(vinylidene fluoride) membrane for dye wastewater treatment, Polym. Adv. Technol., 2018, 29, 254–262 CrossRef CAS.
- N. Li, Z. Li, L. Zhang, H. Shi, J. Li, J. Zhang, Z. Zhang and F. Dang, One-step fabrication of bifunctional self-assembled oligopeptides anchored magnetic carbon nanoparticles and their application in copper (II) ions removal from aqueous solutions, J. Hazard. Mater., 2020, 382, 121113 CrossRef CAS.
- T. R. Sahoo and B. Prelot, Nanomaterials for the Detection and Removal of Wastewater Pollutants, Elsevier, 2020 Search PubMed.
- H. Sun, Z. Ji, Y. He, L. Wang, J. Zhan, L. Chen and Y. Zhao, Preparation of PAMAM modified PVDF membrane and its adsorption performance for copper ions, Environ. Res., 2022, 204, 111943 CrossRef CAS.
- H. Yan, W. Zhang, X. Kan, L. Dong, Z. Jiang, H. Li, H. Yang and R. Cheng, Sorption of methylene blue by carboxymethyl cellulose and reuse process in a secondary sorption, Colloids Surf., A, 2011, 380, 143–151 CAS.
- B. Özkahraman, I. Acar and S. Emik, Removal of cationic dyes from aqueous solutions with poly(N-isopropylacrylamide-co-itaconic acid) hydrogels, Polym. Bull., 2011, 66, 551–570 CrossRef.
- A. M. Atta, H. A. Al-Lohedan, Z. A. ALOthman, A. A. Abdel-Khalek and A. M. Tawfeek, Characterization of reactive amphiphilic montmorillonite nanogels and its application for removal of toxic cationic dye and heavy metals water pollutants, J. Ind. Eng. Chem., 2015, 31, 374–384 CrossRef CAS.
- P. Martins, S. Kappert, H. Nga Le, V. Sebastian, K. Kühn, M. Alves, L. Pereira, G. Cuniberti, M. Melle-Franco and S. Lanceros-Méndez, Enhanced photocatalytic activity of Au/TiO2 nanoparticles against ciprofloxacin, Catalysts, 2020, 10, 234 CrossRef CAS.
- L. Penboon, A. Khrueakham and S. Sairiam, TiO2 coated on PVDF membrane for dye wastewater treatment by a photocatalytic membrane, Water Sci. Technol., 2019, 79, 958–966 CrossRef CAS.
- M. Yan, Y. Wu and X. Liu, Photocatalytic nanocomposite membranes for high-efficiency degradation of tetracycline under visible light: an imitated core-shell Au-TiO2-based design, J. Alloys Compd., 2021, 855, 157548 CrossRef CAS.
- Y. Zhang, B. Yang, K. Li, D. Hou, C. Zhao and J. Wang, Electrospun porous poly(tetrafluoroethylene-co-hexafluoropropylene-co-vinylidene fluoride) membranes for membrane distillation, RSC Adv., 2017, 7, 56183–56193 RSC.
- Y. Peng and P. Wu, A two dimensional infrared correlation spectroscopic study on the structure changes of PVDF during the melting process, Polymer, 2004, 45, 5295–5299 CrossRef CAS.
- J. R. Mishra, S. K. Samal, S. Mohanty and S. K. Nayak, Polyvinylidene fluoride (PVDF)/Ag@TiO2 nanocomposite membrane with enhanced fouling resistance and antibacterial performance, Mater. Chem. Phys., 2021, 268, 124723 CrossRef CAS.
- P. Pascariu, C. Cojocaru, P. Samoila, N. Olaru, A. Bele and A. Airinei, Novel electrospun membranes based on PVDF fibers embedding lanthanide doped ZnO for adsorption and photocatalytic degradation of dye organic pollutants, Mater. Res. Bull., 2021, 141, 111376 CrossRef.
- L. A. Shah, T. Malik, M. Siddiq, A. Haleem, M. Sayed and A. Naeem, TiO2 nanotubes doped poly(vinylidene fluoride) polymer membranes (PVDF/TNT) for efficient photocatalytic degradation of brilliant green dye, J. Environ. Chem. Eng., 2019, 7, 103291 CrossRef CAS.
- H. Zhao, D. Zhang, H. Sun, Y. Zhao and M. Xie, Adsorption and detection of heavy metals from aqueous water by PVDF/ATP-CDs composite membrane, Colloids Surf., A, 2022, 641, 128573 CrossRef CAS.
- Y.-X. Wang, S. Ma, M.-N. Huang, H. Yang, Z.-L. Xu and Z. Xu, Ag NPs coated PVDF@TiO2 nanofiber membrane prepared by epitaxial growth on TiO2 inter-layer for 4-NP reduction application, Sep. Purif. Technol., 2019, 227, 115700 CrossRef CAS.
- J. Wang, M. Sgarzi, Z. Němečková, J. Henych, N. Licciardello and G. Cuniberti, Reusable and antibacterial polymer-based nanocomposites for the adsorption of dyes and the visible-light-driven photocatalytic degradation of antibiotics, Global Challenges, 2022, 6, 2200076 CrossRef PubMed.
- S. Hamzezadeh-Nakhjavani, O. Tavakoli, S. P. Akhlaghi, Z. Salehi, P. Esmailnejad-Ahranjani and A. Arpanaei, Efficient photocatalytic degradation of organic pollutants by magnetically recoverable nitrogen-doped TiO2 nanocomposite photocatalysts under visible light irradiation, Environ. Sci. Pollut. Res., 2015, 22, 18859–18873 CrossRef CAS PubMed.
Footnote |
| † Electronic supplementary information (ESI) available. See DOI: https://doi.org/10.1039/d4ra02962c |
| This journal is © The Royal Society of Chemistry 2024 |

