 Open Access Article
In situ growth of CaMoO4 on electropolymerized PANI as a hybrid electrocatalyst for enhanced oxygen evolution†
Nitika Garg a and
Ashok K. Ganguli
 *ab
*ab
aDepartment of Chemistry, Indian Institute of Technology Delhi, Hauz Khas, New Delhi-110016, India. E-mail: ashok@chemistry.iitd.ac.in; Tel: +91-11-2659-1511
bDepartment of Chemical Sciences, Indian Institute of Science Education and Research Berhampur, Ganjam, Odisha-760003, India
First published on 20th August 2024
Abstract
Electrochemical water splitting stands as a promising avenue for sustainable hydrogen production, with the oxygen evolution reaction (OER) playing a pivotal role. Efficient and durable electrocatalysts are crucial for expediting the sluggish kinetics of OER. In this work, we investigate the synthesis and performance of a novel CaMoO4/polyaniline (CaMoO4/PANI) composite catalyst for OER. In situ growth of CaMoO4 has been done after the electropolymerization of polyaniline on nickel foam (NF), offering advantages such as improved structural integrity, increased surface area, and enhanced electroconductivity. Electrochemical characterization reveals that CaMoO4/PANI exhibits superior catalytic activity, with an overpotential of 233 mV at 10 mA cm−2, outperforming pristine CaMoO4, PANI, and certain current similar non-noble-metal electrocatalysts. Electrochemical studies reveal that the exceptional activity can be attributed to reduced charge transfer resistance, underscoring the catalyst's enhanced efficiency. Furthermore, multistep chronopotentiometry confirms excellent robustness of the catalyst electrode as well as its excellent mass transportation. This work highlights the potential of inorganic oxide/conductive polymer composites as efficient catalysts for OER, offering insights for future developments in sustainable energy technologies.
Introduction
Given the transition towards renewable energy sources, the electrochemical conversion of water into hydrogen gas shows considerable potential for various energy storage and conversion purposes.1,2 Electrochemical water splitting, being environmentally friendly, presents an attractive solution for the simultaneous generation of hydrogen and oxygen.3 A key aspect of this process is the oxygen evolution reaction (OER), which not only facilitates hydrogen production via water splitting but also finds applications in solar fuel generation and metal–air battery technologies.4 However, the sluggish kinetics associated with the OER poses a significant hurdle, highlighting the need for the development of efficient and long-lasting electrocatalysts to accelerate the multi-step four-electron transfer process.5 Although the theoretical thermodynamic potential for water splitting stands at 1.23 V versus the reversible hydrogen electrode (RHE), practical implementation often demands a higher overpotential.6Traditional approaches have leaned on iridium and ruthenium oxides (noble metal-based catalysts), which have served as benchmark electrocatalysts for OER.7 Nonetheless, their limited abundance and high cost have hindered their commercialization. Consequently, there is an urgent need to explore alternative earth-abundant metal-based catalysts that offer both cost-effectiveness and high catalytic activity.8,9 Researchers have explored a diverse array of catalysts to address these challenges, including transition metal oxides,10 oxyhydroxides,11 and sulfides,12 as well as carbides,13 phosphides,14 chalcogenides,15 and heterostructured materials16 that combine different active components to synergistically promote catalytic activity and durability.
The utilization of molybdenum-containing mixed oxides (MMoO4) as catalysts for water oxidation has garnered significant interest in recent years, driven by their unique combination of favourable attributes such as their low cost, abundance, environmental friendliness, and encouraging catalytic properties.17 Molybdenum is a widely available and relatively inexpensive transition metal, making MMoO4 (such as CoMoO4 and NiMoO4) catalysts economically viable alternatives to noble metal-based catalysts, and these do not involve toxic components.18 Furthermore, MMoO4 catalysts exhibit promising catalytic properties for the OER, characterized by their high activity, stability, and efficiency in promoting water oxidation. The versatility of MMoO4 catalysts allows for tailoring their composition, structure, and surface properties to optimize their performance for specific OER applications. Previously, calcium molybdate (CaMoO4) has been recognized for its versatility and utility across various fields, such as catalysis,19 healthcare applications,20 security applications21 and white LED technology.22 Its advantageous properties, including low phonon energy, structural stability, and thermal resilience, make it an appealing choice for these applications. However, its potential as a catalyst for electrochemical water splitting has yet to be thoroughly investigated.23
Efforts have recently been focused on investigating enhancements in properties attributed to inorganic oxide/conductive polymer composites.24 To further enhance the catalytic performance of CaMoO4 for OER, this study explores the integration of polyaniline (PANI), a well-known conducting polymer. With its conjugated structure containing alternating single-double bonds, PANI possesses a C–N five-membered heterocyclic structure, rendering it highly conducting. PANI finds widespread applications in various electrochemical fields, including electrocatalysis, energy storage, sensors, and electrochromic devices.25–28 The incorporation of PANI into the composite material enhances its conductivity, thereby facilitating electron transfer during the OER process and consequently improving electrocatalytic performance.29 The exceptional conductivity of polyaniline stems from its capacity to facilitate charge transport along the polymeric backbone.30 In composite materials, the interfacial PANI layer leads to facilitated charge transfer. Before conducting electrochemical measurements, electrode fabrication typically involves the use of a binder, such as Nafion. However, the presence of such binders can potentially obstruct active sites on the electrode surface, introduce mechanical instability, and act as insulators due to their non-conductive nature.31 In this study, we present the in situ hydrothermal synthesis of CaMoO4 onto electropolymerized PANI coated on NF. By examining the catalytic activity of the resulting CaMoO4/PANI composite without any binder in the oxygen evolution reaction (OER), we aim to provide fresh perspectives on the development of effective and long-lasting electrocatalysts.
Experimental section
Materials required
Calcium nitrate hexahydrate (Fisher Scientific >98%), sodium molybdate dihydrate (Fisher Scientific >98%), ethylene glycol (Fisher Scientific >99.5%), polyethylene glycol (Fisher Scientific), aniline (Thermo Fisher Scientific >99%), sulphuric acid (Thermo Fisher Scientific >98%), hydrochloric acid (Thermo Fisher Scientific >38%), Nafion (Alfa Aesar, 5% w/w in water and 1-propanol), ethanol (Merck), and NF (Images India Traders) were used. No further purification was done before using these chemicals.Electrodeposition of polyaniline on nickel foam
For depositing the material, 2.5 cm × 0.5 cm sized pieces of NF were used. These pieces were then subjected to cleaning with 0.01 M hydrochloric acid, followed by rinsing with deionized water and acetone using sonication for 10 minutes each. Subsequently, the cleaned NF was dried at 50 °C. A uniform layer of polyaniline was electrodeposited onto the NF substrate in a solution containing 0.03 M aniline and 0.1 M H2SO4, utilizing a three-electrode setup. In this configuration, the NF served as the working electrode, platinum wire as the counter electrode, and Ag/AgCl (saturated KCl) as the reference electrode. To optimize the catalytic performance of PANI, electropolymerization was conducted at room temperature by varying the number of cyclic voltammetry scans (10, 20, 30, 40) between −0.4 to 1.2 V at a scan rate of 20 mV s−1.32 Upon completion of the electrodeposition cycles, the PANI-loaded NF was thoroughly washed with double distilled water and ethanol and dried at 60 °C. The weight increment method was employed to determine the amount of PANI loaded onto the NF.Preparation of CaMoO4 over PANI/NF
CaMoO4 nanoparticles synthesis over PANI/NF was done using a modified solvothermal method described in previous literature.33 Specifically, a solution consisting of 25 mL of 5 mmol calcium nitrate hexahydrate in ethylene glycol, supplemented with 1.4 mL of polyethylene glycol, was slowly added dropwise to another solution containing 25 mL of 5 mmol sodium molybdate dihydrate in ethylene glycol, under constant magnetic stirring for 30 minutes. Subsequently, a 100 mL Teflon-lined autoclave was filled with the resulting solution, where the PANI/NF substrate was immersed into the reaction mixture. The autoclave was sealed and heated in an oven at 160 °C for 12 hours. The synthesized sample was subjected to multiple washes with deionized water and ethanol and then dried at 60 °C. For comparison purposes, CaMoO4 powder was synthesized using a similar method.Characterization
Powder X-ray diffraction (XRD) measurements were conducted using a Bruker D8 Advance diffractometer equipped with Cu Kα radiation (λ = 1.54178 Å), scanning within a 2θ range of 10–80° at a scan rate of 0.02° s−1. The size and surface morphology of the samples were characterized using a JEOL JSM-7800F Prime field emission scanning electron microscope. Additionally, high-resolution transmission electron microscopy (TEM) images were obtained using a Tecnai G2 20 microscope operating at 200 kV. Fourier-transform infrared (FTIR) spectra were acquired using a Thermo NICOLET – IS-50 spectrometer employing the KBr pellet technique, covering the spectral range from 400 to 4000 cm−1. Raman spectra were recorded utilizing a Renishaw inVia confocal Raman microscope with laser excitation at a wavelength of 514 nm. X-ray photoelectron microscopy (XPS) measurements were performed using a Kratos Analytical AXIS Supra instrument equipped with a monochromatic X-ray source (Al Kα) at 1486.6 eV.Electrochemical studies
For the electrocatalytic investigations, a three-electrode configuration was employed, comprising an Ag/AgCl reference electrode, a platinum coil as the counter electrode, and NF modified with the catalyst as the working electrode. Various electrochemical techniques, including linear sweep voltammetry (LSV), cyclic voltammetry (CV), and electrochemical impedance spectroscopy (EIS) were employed to evaluate the catalyst's performance. These measurements were carried out in a 1 M potassium hydroxide electrolyte solution. Further, to evaluate the stability and durability of synthesized catalysts, multistep chronopotentiometry response as well as chronopotentiometry response at a constant current density of 10 mA cm−2 have been recorded. All measurements and subsequent data analysis were conducted using a potentiostat (Autolab instrument) controlled by Nova2.1 software.To compensate for the effects of solution resistance (iR drop) in the initial data, an iR compensation of 85% was applied to the electrochemical measurements.34 This correction was necessary as the measured anodic currents alone may not accurately reflect the intrinsic behavior of the catalysts, particularly in cyclic voltammetry and linear sweep voltammetry experiments.
In this study, the potential of the reference electrode were determined using the following formula:
| E(RHE) = E(Ag/AgCl) + E°(Ag/AgCl) + 0.059pH | (1) |
The data acquired from linear sweep voltammetry (LSV) measurements was subsequently utilized for Tafel analysis. The Tafel slope was obtained by plotting overpotential versus the logarithm of current density. The Tafel plot was generated using the following equation:
η = b × log![[thin space (1/6-em)]](https://www.rsc.org/images/entities/char_2009.gif) j + a j + a
| (2) |
In this context, η represents the overpotential in volts (V), b represents the Tafel slope in mV dec−1, and j denotes the current density in mA cm−2.
In alkaline conditions, the double-layer capacitance measurement (Cdl) method has been utilized to ascertain the electrochemical active surface area (ECSA). The Cdl values for the catalysts were determined experimentally by choosing a non-faradaic region and recording cyclic voltammetry (CV) scans at different scan rates. Using the following equation:
 | (3) |
Results and discussion
Before the characterization, it was observed that a green colour material started depositing on silver-grey NF substrate, as shown in Fig. S1,† indicating that the material is getting deposited. PXRD pattern of bare NF was indexed to the cubic crystal system of Ni (JCPDS no. 04-0850), as shown in Fig. S2.† PXRD pattern of CaMoO4/PANI/NF (Fig. 1a) shows the presence of characteristic peaks at 19.1°, 29.1° and 47.4° corresponding to (101), (112), and (204) planes due to the tetragonal crystal system of CaMoO4 (JCPDS no. 85-0585) also, characteristic peaks due to cubic crystal system of Ni (JCPDS no. 04-0850) at 44.9°, 52.3° and 76.8° corresponding to (111), (200) and (220) planes are present; owing to its polymeric and amorphous nature, a broad and very less intense peak at around 20-30° due to PANI can be observed. Further, FT-IR and Raman spectroscopic techniques were used to characterize the formation of PANI. FT-IR spectra (Fig. 1b) showed the presence of characteristic peaks due to C–N and N–H stretching and bending vibrations. Raman spectroscopy was also used to study the formation of PANI prepared by the electropolymerization method and is depicted in Fig. 1c.35 In this Raman spectrum, two representative peaks arising from PANI at 1164 and 1456 cm−1 are observed, which correspond to C–H bending vibration and C![[double bond, length as m-dash]](https://www.rsc.org/images/entities/char_e001.gif) N stretching vibration, respectively. Further, C–C stretching vibrations can be confirmed by the presence of peaks at 1422 and 1609 cm−1. Raman spectrum for CaMoO4 shows prominent peaks due to Mo–O symmetric and asymmetric stretching modes. CaMoO4/PANI Raman spectrum shows peaks due to the presence of both CaMoO4 and PANI, confirming the composite formation.36,37
N stretching vibration, respectively. Further, C–C stretching vibrations can be confirmed by the presence of peaks at 1422 and 1609 cm−1. Raman spectrum for CaMoO4 shows prominent peaks due to Mo–O symmetric and asymmetric stretching modes. CaMoO4/PANI Raman spectrum shows peaks due to the presence of both CaMoO4 and PANI, confirming the composite formation.36,37
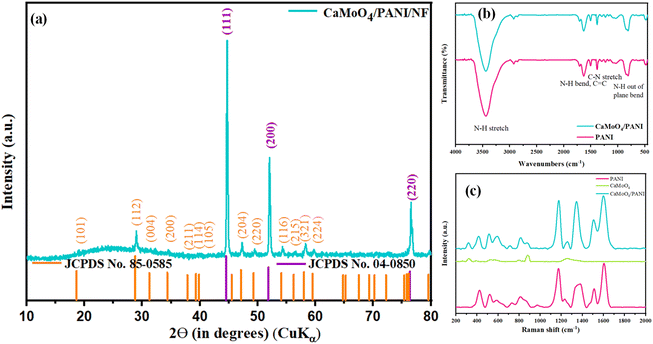 | ||
| Fig. 1 (a) XRD pattern, (b) FT-IR spectra, and (c) Raman spectra of the synthesized CaMoO4, PANI, and CaMoO4/PANI catalyst samples. | ||
The surface morphology of the synthesized samples was recorded using field emission-scanning electron microscopy (FE-SEM) and transmission electron microscopy (TEM). The smooth surface and porous nature of bare NF is clearly observed in the FE-SEM images at different magnifications in Fig. 2a and b. The morphology of the 3D Ni foam exhibits a well-defined macroporous pore-ligament structure with a pore diameter ∼100 to 400 µm. The enlarged FE-SEM image reveals that the surface of nickel scaffold is completely smooth (Fig. 2b). After the electrochemical deposition of PANI, the open pore-ligament structure is preserved (Fig. 2c), but the enlarged image shows the nickel surface is covered with a sheet-like PANI layer as shown in Fig. 2d. Further, the FE-SEM image of CaMoO4 is displayed in Fig. 2e and f , which shows an irregular spherical morphology with a diameter of 0.5–1.5 µm. These spherical particles are further composed of smaller nanoparticles having ellipsoidal morphology. The FE-SEM image of CaMoO4/PANI as shown in Fig. 2g and h confirms the presence of spherical CaMoO4 embedded on the surface of sheet-like PANI layers on completely intact well-defined macroporous pore-ligament structure of NF.
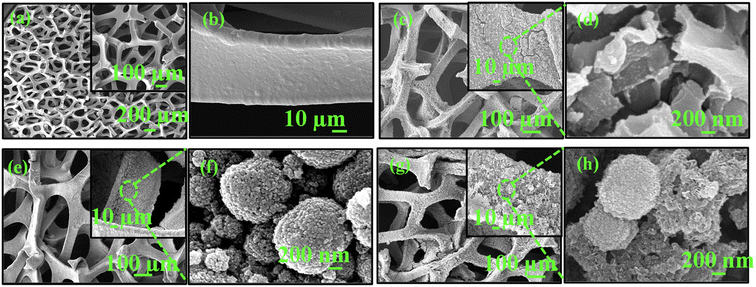 | ||
| Fig. 2 FESEM images at different magnifications of (a) and (b) bare NF, (c) and (d) PANI, (e) and (f) CaMoO4, and (g) and (h) CaMoO4/PANI. | ||
The electron dispersive spectrometer mapping results further confirm the formation of PANI layers over bare NF pore ligament structure. EDS mapping of the CaMoO4/PANI further confirms the uniform distribution of CaMoO4 nanoparticles over the layered PANI, as shown in Fig. S3.†
To complement the FE-SEM results, high resolution transmission electron microscopy (HRTEM) analysis was done to gain insights into surface morphology and lattice parameters. The TEM micrographs of synthesized PANI are given in Fig. 3a which depict the sheet-like nature of PANI more clearly. In TEM images (Fig. 3b), it becomes more evident that the cluster of CaMoO4 formed over NF substrate is in fact an aggregate of smaller ellipsoidal CaMoO4 nanoparticles. Fig. 3c shows the TEM micrographs of the CaMoO4/PANI composite and further confirms the presence of entangled clusters of CaMoO4 particles over layered sheet-like PANI material. The clear lattice fringes (Fig. 3d) captured of the synthesized crystalline CaMoO4 was further processed using Inverse Fast Fourier Transform (IFFT) by GMS3 to measure the inter planar spacing more accurately. The calculated inter planar distance is 2.6523 Å which corresponds to (200) plane of CaMoO4 ellipsoids, shown in Fig. 3e and f. The lattice fringes agree well with the d-spacing of the (200) plane of CaMoO4; however, no fringes can be observed in the layered sheet-like material due to the amorphous polymeric nature of PANI.
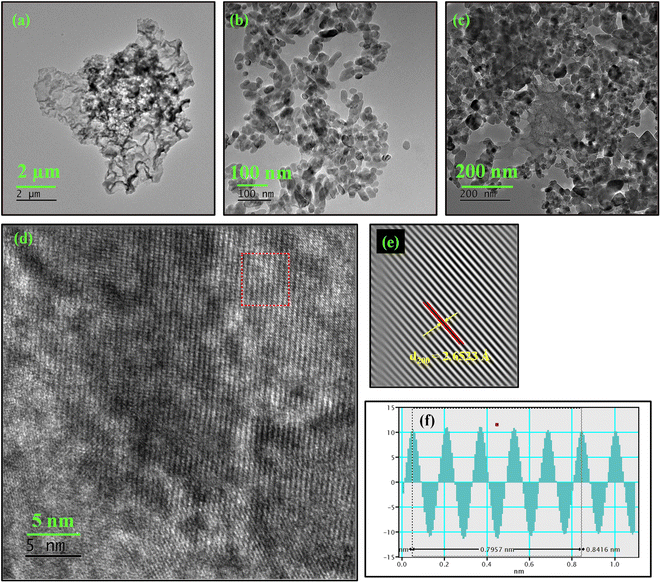 | ||
| Fig. 3 TEM images of (a) PANI, (b) CaMoO4, (c) CaMoO4/PANI, (d) HRTEM of CaMoO4/PANI, (e) IFFT and (f) profile of IFFT CaMoO4/PANI. | ||
The analysis of the chemical states of the elements in synthesized composite CaMoO4/PANI was carried out using X-ray photoelectron spectroscopy (XPS) (Fig. 4). The core spectra for all the elements have been deconvoluted into Gaussian profiles using the Levenberg–Marquardt fitting method.38 Fig. 4a illustrates the deconvoluted N 1s spectrum, delineating three discernible peaks corresponding to three different electronic states of nitrogen: the quinoid and benzenoid amine, and nitrogen cationic radical. The core C 1s spectrum of CaMoO4/PANI (Fig. 4b) portrays the presence of diverse carbon functional groups, encompassing non-nitrogenated carbon (C–C/C![[double bond, length as m-dash]](https://www.rsc.org/images/entities/char_e001.gif) C/C–H) and nitrogenated carbon (C–N/C
C/C–H) and nitrogenated carbon (C–N/C![[double bond, length as m-dash]](https://www.rsc.org/images/entities/char_e001.gif) N), indicative of PANI in its protonated state within the sample.39 Fig. 4c depicts two discernible bands at 344.7 eV and 348.2 eV corresponding to Ca 2p3/2 and Ca 2p1/2, with clearly spaced spin–orbit components (Δ = 3.5 eV), signifying the presence of Ca in +2 oxidation state. The Mo 3d scan, as portrayed in Fig. 4d, unveils two peaks at 230.2 eV and 233.3 eV corresponding to 3d5/2 and 3d3/2 of Mo respectively, with spin–orbit components spaced by 3.1 eV, indicative of Mo being in a +6 oxidation state. Additionally, the O 1s spectrum (depicted in Fig. 4e) manifests two distinct peaks at 527.8 eV and 529.3 eV, representing oxygen in two different forms: the peak at 527.8 eV signifies oxygen within the lattice, whereas the peak at 529.3 eV arises from chemisorbed oxygen.33
N), indicative of PANI in its protonated state within the sample.39 Fig. 4c depicts two discernible bands at 344.7 eV and 348.2 eV corresponding to Ca 2p3/2 and Ca 2p1/2, with clearly spaced spin–orbit components (Δ = 3.5 eV), signifying the presence of Ca in +2 oxidation state. The Mo 3d scan, as portrayed in Fig. 4d, unveils two peaks at 230.2 eV and 233.3 eV corresponding to 3d5/2 and 3d3/2 of Mo respectively, with spin–orbit components spaced by 3.1 eV, indicative of Mo being in a +6 oxidation state. Additionally, the O 1s spectrum (depicted in Fig. 4e) manifests two distinct peaks at 527.8 eV and 529.3 eV, representing oxygen in two different forms: the peak at 527.8 eV signifies oxygen within the lattice, whereas the peak at 529.3 eV arises from chemisorbed oxygen.33
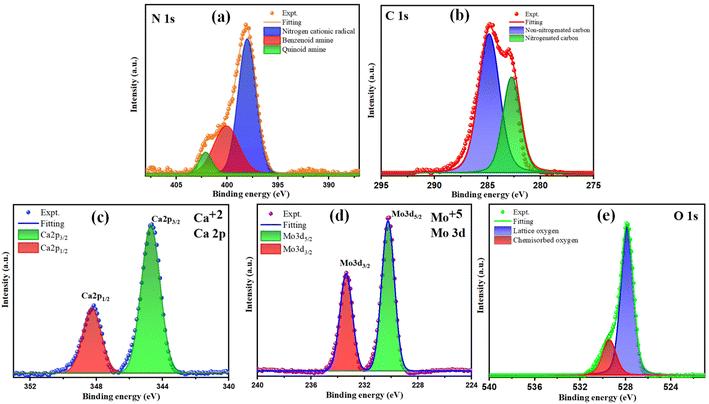 | ||
| Fig. 4 XPS deconvoluted spectra of (a) N 1s, (b) C 1s, (c) Ca 2p, (d) Mo 3d and (e) O 1s of CaMoO4/PANI. | ||
OER activity of CaMoO4/PANI was investigated using a typical three-electrode setup in 1 M KOH as electrolyte with a scan rate of 2 mV s−1 to avoid metal ion redox activity. For comparative study, bare NF, PANI, CaMoO4, and CaMoO4 loaded (CaMoO4 loaded here signifies the use of Nafion during electrode fabrication) were tested under the same conditions. NF has been used as the electrode substrate owing to its high electrical conductivity and highly efficient charge and mass transfer. As the activity of an electrocatalyst is directly related to the number of active sites and overloading of catalyst can lead to suppression of electrocatalytic activity, hence different amount of PANI was deposited over NF substrate. For enhanced OER efficiency of the PANI, the amount of PANI was adjusted during the electropolymerization process. Consequently, different amount of PANI was loaded over NF substrate by varying the number of cyclic voltammetry cycles during electrodeposition. PANI10, PANI20, PANI30 and PANI40 denote different mass loadings of PANI over NF. LSV curves (Fig. 5a) recorded at a scan rate of 2 mV s−1 shows that PANI20 has least overpotential as well as the highest current density which confirmed optimum mass loading at 20 cyclic voltammetry cycles (corresponding to catalyst amount 3 mg) during electrodeposition on the 1 cm2 NF substrate. The NF substrate shows negligible activity and the recorded overpotential for PANI20 was 321 at 10 mA cm−2 current density. Notably, a loading higher as well as lower than PANI20, resulted in higher overpotential values at a current density of 10 mA cm−2 depicting lower activity as electrocatalyst as depicted in Fig. 5b. The electrocatalytic activity of an electrocatalyst is directly related to the availability of number of active sites by facilitating the movement of electrolyte ions into the channels and structural cavities. PANI20 is the optimum amount of electrocatalyst as a lower amount of electrocatalyst loading had a lesser number of active sites, whereas higher loading of PANI over NF led to blockage of some of the active sites, leading to lower OER activity. As depicted in Fig. S5a,† PANI20 exhibited the least value of Tafel slope (31 mV dec−1), indicating that the electrochemical reaction proceeds rapidly with a small change in overpotential as well as it signifies that the rate-limiting step involves fast electron transfer kinetics at this mass loading. Additionally, the Nyquist plot (Fig. S5b†) shows that the diameter of semicircle arc formed by PANI20 is the lowest, indicating it has the lowest charge transfer resistance. This low charge transfer resistance indicates that the transfer of electrons is taking place rapidly between the electrode and the electrolytic ions.
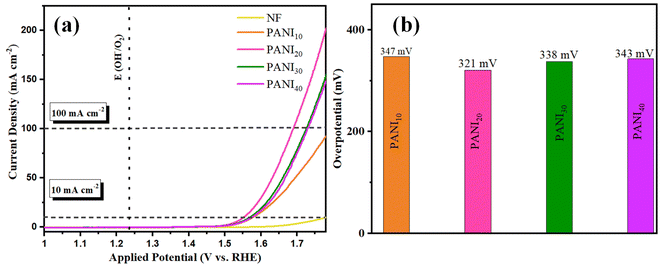 | ||
| Fig. 5 (a) Polarization curves obtained from the LSV measurements with PANI10, PANI20, PANI30, PANI40 and NF and (b) comparative representation of the overpotential at current density 10 mA cm−2. | ||
The activity of bare CaMoO4 with and without binder has also been compared, and the LSV curves (as shown in Fig. S6a†) clearly indicate that the CaMoO4 shows lower overpotential and higher current density, i.e., better OER activity in the absence of Nafion as binder. Fabrication of electrodes without binder has shown better electrocatalytic activity as such binders can block the catalysts' active sites. The porous structure of the NF substrate is preserved in the absence of a binder, and there is higher electrolyte penetration and ion diffusion. The Nyquist plots depicted in Fig. S6b† validate the findings derived from the LSV curves.
After comparison, CaMoO4/PANI exhibits the best OER activity among these catalysts and offers ultralow overpotential of 233 mV at 10 mA cm−2 current density, and current density started increasing sharply after 1.5 V owing to the catalytic generation of current due to water oxidation reaction, as shown in Fig. 6a. These performance metrics are far greater than those of PANI (321 mV for 10 mA cm−2), and CaMoO4 (366 mV for 10 mA cm−2) (Fig. 6b). Notably, the overpotential of CaMoO4/PANI is lower than most recently reported similar electrocatalysts showing it has the least activation energy for the OER reactions (Table S1†). These results indicate an optimized electronic interaction between CaMoO4 and PANI after the heterostructure formation with a synergistic effect, more number of active sites, higher conductivity, and higher movement of electrolyte ions into the structural cavities at the catalyst surface. The composite combines the inherent catalytic activity of molybdate with the high electronic conductivity of PANI. PANI acts as a conductive bridge, promoting rapid electron transport from the active sites of molybdate to the electrode surface. The synergistic effect between PANI and CaMoO4 minimizes concentration polarization and ohmic losses during OER. Additionally, the overpotential exhibited by CaMoO4/PANI is significantly lower compared to the commercially available noble metal oxides, i.e. RuO2, when evaluated under identical experimental conditions (Fig. S7†).
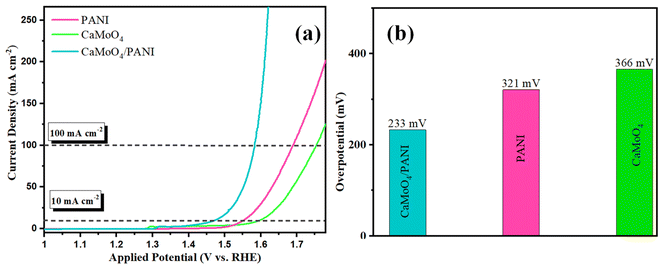 | ||
| Fig. 6 (a) Polarization curves from the LSV measurements with PANI, CaMoO4, and CaMoO4/PANI. (b) Bar diagram of the overpotential at 10 mA cm−2 current density. | ||
The determination of the Tafel slope served as a crucial parameter for assessing the catalytic activity, the reaction mechanism of electron transfer rate in the catalyst as well as at the electrode–electrolyte interface.40 The values calculated for Tafel slope was 24 mV dec−1, while the pristine catalysts CaMoO4 and PANI gave the values 31 mV dec−1 and 65 mV dec−1, respectively (shown in Fig. 7a). Our results revealed a notable decrease in the Tafel slope upon the heterostructure formation, indicative of enhanced OER kinetics and improved electrocatalytic performance compared to pristine catalysts. This reduction in the Tafel slope suggests a more facile reaction pathway, potentially attributed to the synergistic interactions between molybdate and conducting polymer matrix. Additionally, the unique morphology of composite and surface chemistry likely facilitated the charge transfer and increased the number of electrochemically active sites, contributing to the observed improvements in OER activity.
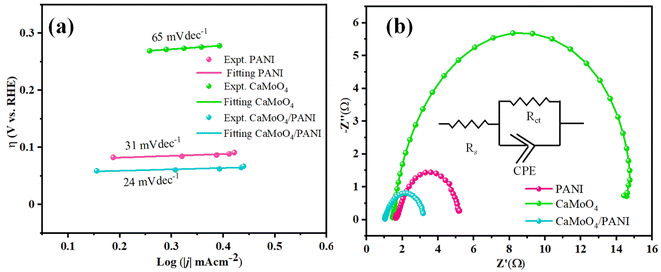 | ||
| Fig. 7 (a) Tafel slope obtained from the polarization curves from the LSV measurements and (b) Nyquist plots of PANI, CaMoO4, and CaMoO4/PANI. | ||
Electrochemical impedance spectroscopy (EIS) (Fig. 7b) was employed to understand the intrinsic kinetics, i.e., charge transfer dynamics of OER between the electrode (catalyst: bare NF, PANI, CaMoO4, CaMoO4 loaded and CaMoO4/PANI) and electrolyte at a bias of 1.54 V vs. RHE.41 Charge transfer behaviour has been studied by analysing Nyquist plots, according to which CaMoO4/PANI exhibits the lowest charge-transfer resistance. Based on the obtained values, a modified Randle's circuit has been fitted to obtain charge transfer resistance (Rct) values between the electrode and electrolyte (as shown in Fig. S8†). CaMoO4/PANI has the smallest radius as compared to the other catalysts which indicates that the former possesses least charge transfer resistance.42 CaMoO4/PANI has the lowest Rct values of 2.27 Ω, compared to PANI and CaMoO4. This lower Rct value is indicative of ultrafine interfacial interactions at the heterostructure interface, as well as a high density of active sites. These values indicate that PANI sheets offer a facile transfer of charge carriers along with excellent conductivity to CaMoO4 ellipsoids, which is indicative of reduced contact impedance. It shows that the electronic coupling between CaMoO4 and PANI in the heterostructure greatly enhances the charge transfer in the OER and accelerates the transport of electrons and ions, thereby leading to an improvement in its performance. In the Bode plots (Fig. S9a and S9b†), the relationship between the magnitude of impedance and phase angle has been analyzed in relation to frequency. Notably, the CaMoO4/PANI exhibits a higher peak frequency compared to CaMoO4 and PANI, indicating a longer electron transport lifetime. Furthermore, the Bode plot illustrates a low phase angle for CaMoO4/PANI, suggesting favorable oxygen evolution reaction (OER) kinetics on the catalyst surface. There exists a synergistic effect between the components forming the heterostructure; formation of heterostructure has led to a change in electronic properties of CaMoO4 which in turn causes an enhancement in the efficiency of the CaMoO4/PANI as electrocatalyst.
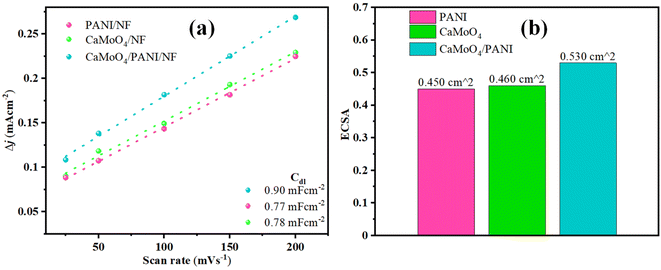
To further study the intrinsic features of different catalysts, electrochemically active surface area (ECSA) was determined for different electrodes.43 The highest Cdl value has been obtained for CaMoO4/PANI (0.90 mF cm−2) among all the other catalysts (shown in Fig. 8a and S10†). For PANI and CaMoO4, the Cdl values were 0.77 mF cm−2 and 0.78 mF cm−2, respectively. As ECSA is directly proportional to Cdl, a higher value of Cdl for CaMoO4/PANI implies higher ECSA (Fig. 8b), which leads to the conclusion that there exists a higher number of active sites, better charge conductivity, and higher area for the electrochemical reactions at the electrode/electrolyte interface for CaMoO4/PANI electrode. Binder-free growth of CaMoO4/PANI heterostructure has led to an increment in the number of active sites and promoted charge transfer. Also, there is formation of structural cavities at the catalyst surface that holds a higher surface charge leading to the formation of electrical double layer. Furthermore, ECSA correction has been applied to the polarization curves to accurately assess the intrinsic catalytic activity, and these show that the materials have much lower overpotential value intrinsically (Fig. S11†).
Stability of the electrocatalyst needs to be analyzed to evaluate its usage in the long-term. Therefore, the multistep chronopotentiometry technique was used to evaluate the stability of the electrocatalyst (CaMoO4/PANI). The electrocatalyst stability was measured at different current densities varying from 10 to 40 mA cm−2 with an increment of 10 mA cm−2 per 3 hours (Fig. 9).44 At each current density, the potential remained constant and immediately levelled off at the next current density value. The catalyst is also stable under prolonged exposure to a single current density (10 mA cm−2), as shown by the chronopotentiometry data in the inset plot of Fig. 9. This indicates the stability of the material towards catalytic activity and shows the excellent mechanical robustness of the catalyst. The durability and stability of the catalyst in the long-term can be attributed to the unique interfacial interaction between heterostructure CaMoO4 and PANI in the heterostructure with channels leading to accelerated charge and mass transfer, leading to the increased movement of ions from the electrolyte inside the channels and structural cavities.
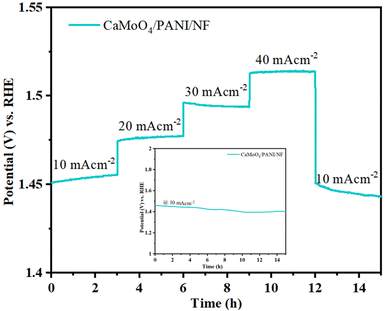 | ||
| Fig. 9 Multistep chronopotentiometry plot recorded at varied current densities. Inset shows chronopotentiometric test at 10 mA cm−2 for 15 h. | ||
For post-catalytic analyses, samples were further characterized after OER by PXRD and Raman spectroscopy. PXRD peaks showed no change in the peak positions, and no additional peaks were observed in the PXRD pattern after catalysis (Fig. 10a). Further, to support the structural integrity of PANI, Raman spectroscopy measurements were carried, and all the characteristic peaks were observed in the Raman spectrum post catalysis (Fig. 10b) further confirming the structural integrity of synthesized composite.36,37 Microscopic investigations were done using FESEM and TEM imaging techniques; both techniques showed retention in the morphology of the catalyst post-catalysis (Fig. S12†). Furthermore, the robust nature of CaMoO4/PANI is evident from the Nyquist plot (Fig. S13†) before and after catalysis.
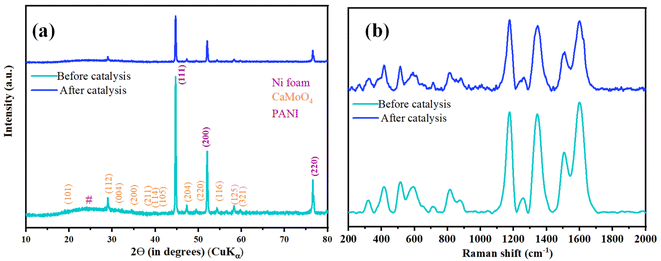 | ||
| Fig. 10 Before and after catalysis characterization of CaMoO4/PANI (a) PXRD pattern and (b) Raman spectra. | ||
Conclusions
In this study, we investigated the fabrication of electrodes for OER using a composite of CaMoO4 and PANI deposited on nickel foam (NF) substrates without the use of binder. Detailed structural and electrochemical characterization elucidated the significant advantages offered by this binder-free growth strategy. Our results revealed that the CaMoO4/PANI composite exhibited far superior OER activity as compared to CaMoO4 and PANI exhibiting a low overpotential (233 mV; 10 mA cm−2) as well as low Tafel slope (24 mV dec−1), which stems from synergistic interactions and improved charge and ion transfer between the redox-active properties of CaMoO4 and high electrical conductivity of PANI. This synergy made the charge transfer process efficient and accelerated the reaction kinetics, which contributed to enhanced electrocatalytic performance. Furthermore, the binder-free growth approach facilitated the direct deposition of electrocatalyst particles onto the NF substrate, thereby maximizing the active surface area of electrode. This improved the utilization of the catalyst material as well as enhanced the stability and durability of the electrode as concluded after the multistep chronopotentiometry study and prolonged electrochemical cycling. Our studies demonstrate the potential of inorganic oxide/conductive polymer composite electrode prepared via binder-free growth for applications in electrochemical water splitting and energy conversion.Data availability
The data supporting this article have been included as part of the ESI.†Conflicts of interest
The authors have no conflicts of interest to declare.Acknowledgements
NG acknowledges MHRD, India for PMRF fellowship through IIT Delhi. Both authors thank the Central Research Facility (CRF) IIT Delhi for providing research support.References
- J. He, Z. Hu, K. Deng, R. Zhao, X. Lv, W. Tian, Y. X. Zhang and J. Ji, CrystEngComm, 2021, 23, 2262–2268 RSC.
- L. N. Zhang, R. Li, H.-Y. Zang, H.-Q. Tan, Z.-H. Kang, Y.-H. Wang and Y.-G. Li, Energy Environ. Sci., 2021, 14, 6191–6210 RSC.
- I. Slobodkin, E. Davydova, M. Sananis, A. Breytus and A. Rothschild, Nat. Mater., 2024, 23, 398–405 CrossRef CAS PubMed.
- M. Li, L. Chen, S. Ye, G. Fan, L. Yang, X. Zhang and F. Li, J. Mater. Chem. A, 2019, 7, 13695–13704 RSC.
- W. Li, D. Xiong, X. Gao and L. Liu, Chem. Commun., 2019, 55, 8744–8763 RSC.
- A. Raveendran, M. Chandran and R. Dhanusuraman, RSC Adv., 2023, 13, 3843–3876 RSC.
- Q. Shi, C. Zhu, D. Du and Y. Lin, Chem. Soc. Rev., 2019, 48, 3181–3192 RSC.
- Y. Lee, J. Suntivich, K. J. May, E. E. Perry and Y. Shao-Horn, J. Phys. Chem. Lett., 2012, 3, 399–404 CrossRef CAS PubMed.
- D. F. Abbott, D. Lebedev, K. Waltar, M. Povia, M. Nachtegaal, E. Fabbri, C. Copéret and T. J. Schmidt, Chem. Mater., 2016, 28, 6591–6604 CrossRef CAS.
- T. Soltani, X. Zhu, A. Yamamoto, S. P. Singh, E. Fudo, A. Tanaka, H. Kominami and H. Yoshida, Appl. Catal., B, 2021, 286, 119899 CrossRef CAS.
- Y. Ou, L. P. Twight, B. Samanta, L. Liu, S. Biswas, J. L. Fehrs, N. A. Sagui, J. Villalobos, J. Morales-Santelices, D. Antipin, M. Risch, M. C. Toroker and S. W. Boettcher, Nat. Commun., 2023, 14, 7688 CrossRef CAS PubMed.
- M. Wang, L. Zhang, Y. He and H. Zhu, J. Mater. Chem. A, 2021, 9, 5320–5363 RSC.
- S. Li, B. Chen, Y. Wang, M.-Y. Ye, P. A. van Aken, C. Cheng and A. Thomas, Nat. Mater., 2021, 20, 1240–1247 CrossRef CAS PubMed.
- J. Xu, J. Li, D. Xiong, B. Zhang, Y. Liu, K.-H. Wu, I. Amorim, W. Li and L. Liu, Chem. Sci., 2018, 9, 3470–3476 RSC.
- J. Huang, Y. Jiang, T. An and M. Cao, J. Mater. Chem. A, 2020, 8, 25465–25498 RSC.
- M. Singh, D. C. Cha, T. I. Singh, A. Maibam, D. R. Paudel, D. H. Nam, T. H. Kim, S. Yoo and S. Lee, Mater. Chem. Front., 2023, 7, 6254–6280 RSC.
- H. K. Beere, P. Kulkarni, U. N. Maiti, R. G. Balakrishna, P. Mukherjee, H. Y. Jung, K. Samanta and D. Ghosh, Sustain. Energy Fuels, 2023, 7, 4303–4316 RSC.
- A. Piñeiro García, D. Perivoliotis, X. Wu and E. Gracia-Espino, ACS Sustain. Chem. Eng., 2023, 11, 7641–7654 CrossRef.
- S. Swathi, R. Yuvakkumar, P. Senthil Kumar, G. Ravi, M. Thambidurai, C. Dang and D. Velauthapillai, Int. J. Hydrog. Energy, 2022, 47, 26013–26022 CrossRef CAS.
- J. Wu, J. Ma, H. Zhuang, H. Ma and C. Wu, Nano Today, 2023, 51, 101917 CrossRef CAS.
- L. K. Bharat, G. S. R. Raju and J. S. Yu, Sci. Rep., 2017, 7, 11571 CrossRef PubMed.
- J.-Y. Jung, Opt. Mater., 2022, 132, 112830 CrossRef CAS.
- Y. Gou, Q. Liu, X. Shi, A. M. Asiri, J. Hu and X. Sun, Chem. Commun., 2018, 54, 5066–5069 RSC.
- H. Ai, L. Fan, Y. Wang, Z. Wang, H. Zhang, J. Zhao, M. Jiao, B. Lv and X. Han, RSC Adv., 2023, 13, 32045–32053 RSC.
- J. He, M. Wang, W. Wang, R. Miao, W. Zhong, S.-Y. Chen, S. Poges, T. Jafari, W. Song, J. Liu and S. L. Suib, ACS Appl. Mater. Interfaces, 2017, 9, 42676–42687 CrossRef CAS PubMed.
- Y. Duan, Z. Huang, J. Ren, X. Dong, Q. Wu, R. Jia, X. Xu, S. Shi and S. Han, Dalton Trans., 2022, 51, 9116–9126 RSC.
- R. Soni, V. Kashyap, D. Nagaraju and S. Kurungot, ACS Appl. Mater. Interfaces, 2018, 10, 676–686 CrossRef CAS PubMed.
- Y. Dong, J. Feng and G. Li, Macromol. Chem. Phys., 2017, 218, 1700359 CrossRef.
- M. S. Tamboli, S. A. Patil, A. M. Tamboli, S. S. Patil, N. T. N. Truong, K. Lee, C. S. Praveen, N. K. Shrestha, C. Park and B. B. Kale, Dalton Trans., 2022, 51, 6027–6035 RSC.
- N. K and C. S. Rout, RSC Adv., 2021, 11, 5659–5697 RSC.
- Q. Cheng, J. Tang, J. Ma, H. Zhang, N. Shinya and L.-C. Qin, J. Phys. Chem. C, 2011, 115, 23584–23590 CrossRef CAS.
- H. Khoshsang and A. Ghaffarinejad, Inorg. Chem. Commun., 2022, 142, 109631 CrossRef CAS.
- J. Bhagwan, Sk. K. Hussain and J. S. Yu, ACS Sustain. Chem. Eng., 2019, 7, 12340–12350 CAS.
- W. Zheng, ACS Energy Lett., 2023, 8, 1952–1958 CrossRef CAS.
- M. Khalid, M. A. Tumelero, V. C. Zoldan, C. C. Pla Cid, D. F. Franceschini, R. A. Timm, L. T. Kubota, S. A. Moshkalev and A. A. Pasa, RSC Adv., 2014, 4, 34168–34178 RSC.
- G. Louarn, M. Lapkowski, S. Quillard, A. Pron, J. P. Buisson and S. Lefrant, J. Phys. Chem., 1996, 100, 6998–7006 CrossRef CAS.
- E. C. Xiao, Q. Ren, Z. Cao, G. Dou, Z.-M. Qi and F. Shi, J. Mater. Sci.: Mater. Electron., 2020, 31, 5686–5691 CrossRef CAS.
- X. L. Wei, M. Fahlman and A. J. Epstein, Macromolecules, 1999, 32, 3114–3117 CrossRef CAS.
- P. Ahuja, S. K. Ujjain, I. Arora and M. Samim, ACS Omega, 2018, 3, 7846–7855 CrossRef CAS PubMed.
- O. van der Heijden, S. Park, R. E. Vos, J. J. J. Eggebeen and M. T. M. Koper, ACS Energy Lett., 2024, 9, 1871–1879 CrossRef CAS PubMed.
- A. Ch. Lazanas and M. I. Prodromidis, ACS Meas. Sci. Au, 2023, 3, 162–193 CrossRef CAS PubMed.
- G. Liu, Y. Cheng, M. Qiu, C. Li, A. Bao, Z. Sun, C. Yang and D. Liu, J. Colloid Interface Sci., 2023, 643, 214–222 CrossRef CAS PubMed.
- W. Zheng, M. Liu and L. Y. S. Lee, ACS Energy Lett., 2020, 5, 3260–3264 CrossRef CAS.
- Z. Ge, F. Wang, J. Guo, J. Ma, C. Yu, A. Zhong and Y. Xie, Inorg. Chem. Front., 2021, 8, 2713–2724 RSC.
Footnote |
| † Electronic supplementary information (ESI) available: Digital picture of electrodeposited PANI electrode (Fig. S1), PXRD pattern of bare nickel foam substrate (Fig. S2), EDS analysis of PANI, CaMoO4, and CaMoO4/PANI (Fig. S3), TEM images of PANI, CaMoO4, and CaMoO4/PANI after different magnification (Fig. S4), Tafel slope obtained from the polarization curves obtained using LSV measurements and Nyquist plots (Fig. S5), LSV curves and Nyquist plots for comparison between binder-free CaMoO4 electrode and CaMoO4 electrode loaded on NF using Nafion as binder (Fig. S6), LSV curves to compare OER activity of synthesized catalyst with noble metal catalyst (RuO2) (Fig. S7), Nyquist plots of PANI, CaMoO4 and CaMoO4/PANI after circuit fitting (Fig. S8), Bode plot (|Z| versus modulation frequency) and Bode plot (ϕ versus modulation frequency) of PANI, CaMoO4 and CaMoO4/PANI (Fig. S9), CV curves for ECSA analysis in non-faradaic region of PANI, CaMoO4 and CaMoO4/PANI (Fig. S10), ECSA corrected LSV curves of PANI, CaMoO4 and CaMoO4/PANI (Fig. S11), FESEM and TEM images after catalysis of PANI, CaMoO4 and CaMoO4/PANI (Fig. S12), Nyquist plot of CaMoO4/PANI before and after catalysis (Fig. S13), Table S1: OER electrocatalytic activity of PANI based previously reported catalysts in alkaline media. See DOI: https://doi.org/10.1039/d4ra03196b |
| This journal is © The Royal Society of Chemistry 2024 |

