 Open Access Article
Electrochemical oscillation during galvanostatic charging and discharging of Zr-modified Li4Ti5O12 in Li-ion batteries†
Yijin Sheng‡
a,
Fangxu Hu‡a,
Yu Wua,
De Li *ac,
Wenting Ji
 *a and
Yong Chen
 *b
*b
aState Key Laboratory of Marine Resources Utilization in South China Sea, Key Laboratory of Research on Utilization of Si-Zr-Ti Resources of Hainan Province, School of Materials Science and Engineering, Hainan University, Haikou 570228, China. E-mail: jwt0316@163.com
bGuangdong Key Laboratory for Hydrogen Energy Technologies, School of Materials Science and Hydrogen Energy, Foshan University, Foshan, 528000, China. E-mail: ychen2002@163.com
cNational Laboratory of Solid State Microstructures, Nanjing University, Nanjing 210093, China. E-mail: lidenju@sina.com
First published on 9th July 2024
Abstract
The electrochemical oscillation in Li-ion batteries has been reported for two-phase electrode materials of Li4Ti5O12 and LiCrTiO4, which is originated from the group-by-group phase transition in a multi-particle electrode. For both Li4Ti5O12 and LiCrTiO4, the electrochemical oscillation exhibits usually during charging, while rarely for discharging. Herein, a series of Zr-modified Li4Ti5O12 samples are prepared by using the spray-drying combined with high-temperature sintering method, and the electrochemical oscillation is observed during not only the charging process, but also the discharging process, which gradually grows up and then disappears by increasing the Li content. Compared with Li4Ti5O12, the specific capacity of Zr-modified Li4Ti5O12 decreases gradually by increasing the Zr/Ti ratio, owing to the impurity phases. According to the XRD, XPS and STEM results, the Zr element tends to accumulate on the surface to form ZrO2 nanoparticles, rather than dope into the bulk phase of Li4Ti5O12, which makes Li4Ti5O12 particles well dispersive. In contrast to the Li deficiency for only charging, the electrochemical oscillation during both charging and discharging should be attributed to the Li excess, but too much Li2TiO3 phase will suppress the electrochemical oscillation. Therefore, the Li excess can induce the electrochemical oscillation during both charging and discharging of Zr-modified Li4Ti5O12, which can be adopted to investigate the electrochemical oscillation of other materials in LIBs.
1. Introduction
Li-ion batteries (LIBs) have been widely used in portable electronic products, energy storage systems, electric trams and other fields because of their high operability, high energy density and wide operating temperature range.1–3 Several inspiring articles have already made strides in understanding the electrochemical phenomena of electrodes, such as memory effect and electrochemical oscillation. Sasaki et al. first observed the memory effect of LiFePO4 in LIBs, which has challenged the common knowledge that LIBs have no memory effect.4 Based on the phase-separating model, Li et al. reported the phenomenon of electrochemical oscillation in surface-reconstructed Li4Ti5O12 electrodes.5 Recently, Que et al. first reported the voltage oscillation in PC/EC-based system at −20 °C in Sodium-ion batteries.6 Due to the relatively weak electrochemical signals and the complexity of phase transition, it is a challenge to understand the fundamental characteristics of phase-transition electrodes, which is important to optimize and improve battery performances.7,8Spinel Li4Ti5O12 is a well-known commercial anode material in LIBs, which takes a two-phase reaction of Li4Ti5O12 ↔ Li7Ti5O12 at ca. 1.565 V vs. Li+/Li through electrochemical (de)lithiation.9,10 In its charge and discharge plateaus, there have observed some interesting electrochemical signals as voltage steps and oscillations, corresponding to the memory effect11 and the electrochemical oscillation,5 respectively. The electrochemical oscillation in LIBs typically appears as periodic voltage fluctuations in the voltage plateau, which is originated from the group-by-group phase transition in a multi-particle electrode.5,12
Surface engineering and element doping are effective strategies for regulating electrochemical oscillation signals. The electrochemical oscillation was first discovered in the charge and discharge plateaus of a surface-reconstructed Li4Ti5O12 in LIBs.5 Chen et al. reported that the charge/discharge oscillations of Li4Ti5O12 electrodes were suppressed by doped Al-ZnO surface coatings decoration, which can reduce barriers to surface nucleation.13 Lim et al. revealed the memory effect as well as the electrochemical oscillation of Li4Ti5O12 with oxygen defects on the surface.14 And we have reported the electrochemical oscillation in an Al-doped Li4Ti5O12 composite, that has an ultra-high Al content far beyond the saturation doping concentration to form Al2O3 phase.15 Despite explorations above, it is still worth seeking new specific methods to regulate the electrochemical oscillation, especially during discharging, in order to reveal the underlying mechanism.
The Zr doping has been adopted to improve the electrochemical properties of Li4Ti5O12, in which the substitution of Zr for Ti leads to the slight increase of lattice parameters.16–20 Through atomic layer deposition, the ZrO2 ultrathin film has been directly deposited on Li4Ti5O12 electrode to improve its electrochemical performance.21 However, there is no report about the electrochemical oscillation of Li4Ti5O12 with Zr doping, ZrO2 coating or mixture. In this work, a series of Zr-modified Li4Ti5O12 samples are prepared by using the spray-drying combined with high-temperature sintering method, and the electrochemical oscillation is achieved during not only the charging process, but also the discharging process of the Li-excessive Zr-modified Li4Ti5O12.
2. Experimental section
2.1 Materials preparation
Zr-modified Li4Ti5O12 samples are synthesized by using the spray-drying combined with high-temperature sintering method, as described in our previous work.12 In the precursor solution, the LiOH·H2O (Aladdin 99.99%), Ti(OC4H9)4 (Aladdin 99.0%), and ZrO(NO3)2·xH2O (Macklin 99.99%) are selected as Li, Ti and Zr sources, respectively. Put 10 mL H2O2 (30 wt%) and 8.1 mmol Ti(OC4H9)4 into 80 mL ultrapure water successively, put 7.92 mmol of LiOH·H2O into 20 mL ultrapure water, and put 0.9 mmol of ZrO(NO3)2·xH2O into another 20 mL deionized water, which are magnetically stirred for 20 min to obtain three clarified solutions, respectively, then mix them together and stir for 15 min to obtain the precursor solution of Li4.4Ti4.5Zr0.5O12 with an element ratio of Li![[thin space (1/6-em)]](https://www.rsc.org/images/entities/char_2009.gif) :
:![[thin space (1/6-em)]](https://www.rsc.org/images/entities/char_2009.gif) Ti
Ti![[thin space (1/6-em)]](https://www.rsc.org/images/entities/char_2009.gif) :
:![[thin space (1/6-em)]](https://www.rsc.org/images/entities/char_2009.gif) Zr = 4.4
Zr = 4.4![[thin space (1/6-em)]](https://www.rsc.org/images/entities/char_2009.gif) :
:![[thin space (1/6-em)]](https://www.rsc.org/images/entities/char_2009.gif) 4.5
4.5![[thin space (1/6-em)]](https://www.rsc.org/images/entities/char_2009.gif) :
:![[thin space (1/6-em)]](https://www.rsc.org/images/entities/char_2009.gif) 0.5. By tailoring the ratio of raw materials, the precursor solutions of Li4.0Ti4.5Zr0.5O12, Li4.2Ti4.5Zr0.5O12, Li4.6Ti4.5Zr0.5O12, Li4.4Ti5O12, Li4.4Ti4.75Zr0.25O12 and Li4.4Ti4.25Zr0.75O12 can be prepared with an element ratio of Li
0.5. By tailoring the ratio of raw materials, the precursor solutions of Li4.0Ti4.5Zr0.5O12, Li4.2Ti4.5Zr0.5O12, Li4.6Ti4.5Zr0.5O12, Li4.4Ti5O12, Li4.4Ti4.75Zr0.25O12 and Li4.4Ti4.25Zr0.75O12 can be prepared with an element ratio of Li![[thin space (1/6-em)]](https://www.rsc.org/images/entities/char_2009.gif) :
:![[thin space (1/6-em)]](https://www.rsc.org/images/entities/char_2009.gif) Ti
Ti![[thin space (1/6-em)]](https://www.rsc.org/images/entities/char_2009.gif) :
:![[thin space (1/6-em)]](https://www.rsc.org/images/entities/char_2009.gif) Zr = 4.0
Zr = 4.0![[thin space (1/6-em)]](https://www.rsc.org/images/entities/char_2009.gif) :
:![[thin space (1/6-em)]](https://www.rsc.org/images/entities/char_2009.gif) 4.5
4.5![[thin space (1/6-em)]](https://www.rsc.org/images/entities/char_2009.gif) :
:![[thin space (1/6-em)]](https://www.rsc.org/images/entities/char_2009.gif) 0.5, 4.2
0.5, 4.2![[thin space (1/6-em)]](https://www.rsc.org/images/entities/char_2009.gif) :
:![[thin space (1/6-em)]](https://www.rsc.org/images/entities/char_2009.gif) 4.5
4.5![[thin space (1/6-em)]](https://www.rsc.org/images/entities/char_2009.gif) :
:![[thin space (1/6-em)]](https://www.rsc.org/images/entities/char_2009.gif) 0.5, 4.6
0.5, 4.6![[thin space (1/6-em)]](https://www.rsc.org/images/entities/char_2009.gif) :
:![[thin space (1/6-em)]](https://www.rsc.org/images/entities/char_2009.gif) 4.5
4.5![[thin space (1/6-em)]](https://www.rsc.org/images/entities/char_2009.gif) :
:![[thin space (1/6-em)]](https://www.rsc.org/images/entities/char_2009.gif) 0.5, 4.4
0.5, 4.4![[thin space (1/6-em)]](https://www.rsc.org/images/entities/char_2009.gif) :
:![[thin space (1/6-em)]](https://www.rsc.org/images/entities/char_2009.gif) 5:0, 4.4
5:0, 4.4![[thin space (1/6-em)]](https://www.rsc.org/images/entities/char_2009.gif) :
:![[thin space (1/6-em)]](https://www.rsc.org/images/entities/char_2009.gif) 4.75
4.75![[thin space (1/6-em)]](https://www.rsc.org/images/entities/char_2009.gif) :
:![[thin space (1/6-em)]](https://www.rsc.org/images/entities/char_2009.gif) 0.25 and 4.4
0.25 and 4.4![[thin space (1/6-em)]](https://www.rsc.org/images/entities/char_2009.gif) :
:![[thin space (1/6-em)]](https://www.rsc.org/images/entities/char_2009.gif) 4.25
4.25![[thin space (1/6-em)]](https://www.rsc.org/images/entities/char_2009.gif) :
:![[thin space (1/6-em)]](https://www.rsc.org/images/entities/char_2009.gif) 0.75. In the process of getting the Zr-modified Li4Ti5O12 powder, the precursor solution is atomized by an ultrasonic atomizer (402AI, Yuewell Company), and carried into a tube furnace at a temperature of 400 °C by high purity Ar gas with a flow rate of 0.8 L min−1. The dried precursor powder is collected on a SUS sheet under the impact of high voltage of negative-ion generator, and then calcined at 800 °C for 8 h under air atmosphere in a muffle furnace to obtain the Zr-modified Li4Ti5O12 samples.
0.75. In the process of getting the Zr-modified Li4Ti5O12 powder, the precursor solution is atomized by an ultrasonic atomizer (402AI, Yuewell Company), and carried into a tube furnace at a temperature of 400 °C by high purity Ar gas with a flow rate of 0.8 L min−1. The dried precursor powder is collected on a SUS sheet under the impact of high voltage of negative-ion generator, and then calcined at 800 °C for 8 h under air atmosphere in a muffle furnace to obtain the Zr-modified Li4Ti5O12 samples.
2.2 Materials characterization
The crystal structure of as-prepared Li4Ti5O12 samples is characterized by X-ray diffraction (XRD Bruker D2 PHASER, Germany) with an X-ray of Cu Kα (λ = 1.541 Å) at an accelerating voltage of 30 kV. Here, the powder sample with ca. 1 wt% graphite is evenly ground in a mortar for 15 min, and then measured by XRD. The Raman spectra are collected by Raman imaging microscopy (Thermo Scientific DXRxi, USA) with a laser wavelength of 532 nm, the morphology is characterized by scanning electron microscopy (SEM, Thermo Scientific Verios G4 UC, USA), the particle surface was studied by using X-ray photoelectron spectroscopy (XPS, Axis Supra) with focused monochromatized Al Kα radiation (1486.6 eV), the microscopic structure and elementary analysis is conducted by high-angle annular dark-field (HAADF) scanning transmission electron microscopy (STEM) with energy dispersive X-ray (EDX) spectroscopy (Thermo Talos F200X G2, USA, 200 kV).2.3 Battery assembly and test
Electrochemical tests are conducted by using coin-type cells (CR2032). The working electrode is a composite film (ϕ4 mm), containing 42.5 wt% active material, 42.5 wt% acetylene black and 15 wt% polytetrafluoroethylene (PTFE), that is firmly pressed on a carbon paper (ϕ5 mm). The electrolyte is 1 M LiTFSI in ethyl carbonate (EC)/diethyl carbonate (DEC) solution with a volume ratio of 1![[thin space (1/6-em)]](https://www.rsc.org/images/entities/char_2009.gif) :
:![[thin space (1/6-em)]](https://www.rsc.org/images/entities/char_2009.gif) 1, the separator is a glass fiber filter (Whatman GF/a, ϕ19 mm), and the counter electrode is lithium metal. After all components are completely dried, the battery is assembled in a glove box filled with argon gas. At a constant operating temperature of 25 °C, the galvanostatic charge/discharge measurements are carried out by a Hokuto Denko battery test system, and the electrochemical impedance spectroscopy (EIS) tests are conducted by a multi-channel electrochemical workstation (Biologic VSP-300, France).
1, the separator is a glass fiber filter (Whatman GF/a, ϕ19 mm), and the counter electrode is lithium metal. After all components are completely dried, the battery is assembled in a glove box filled with argon gas. At a constant operating temperature of 25 °C, the galvanostatic charge/discharge measurements are carried out by a Hokuto Denko battery test system, and the electrochemical impedance spectroscopy (EIS) tests are conducted by a multi-channel electrochemical workstation (Biologic VSP-300, France).
3. Results and discussion
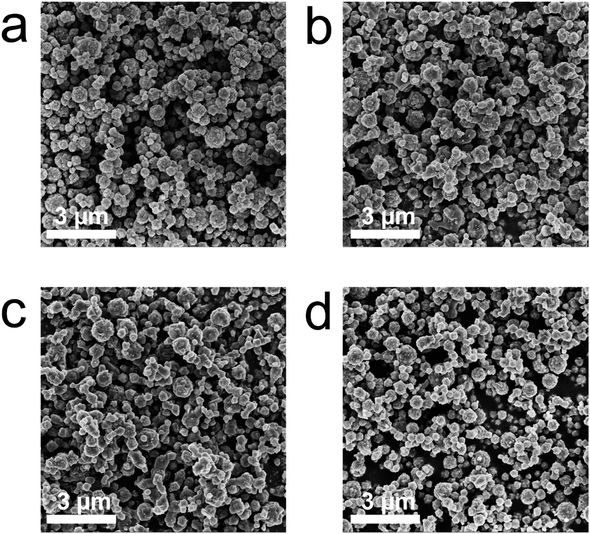
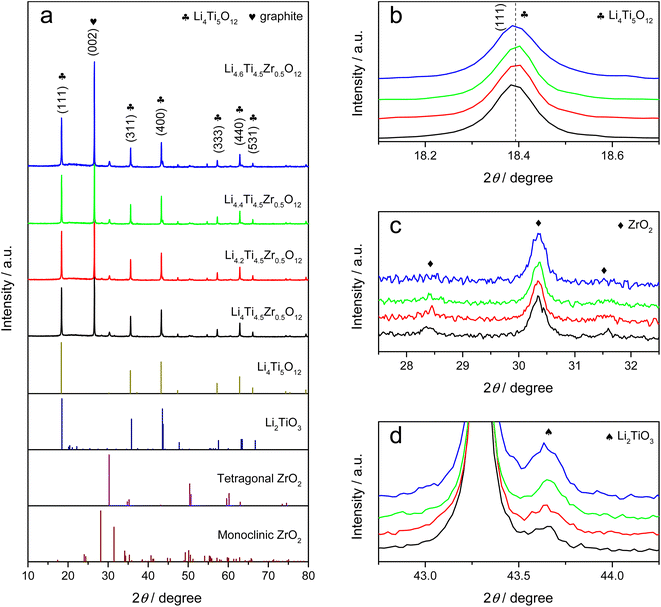
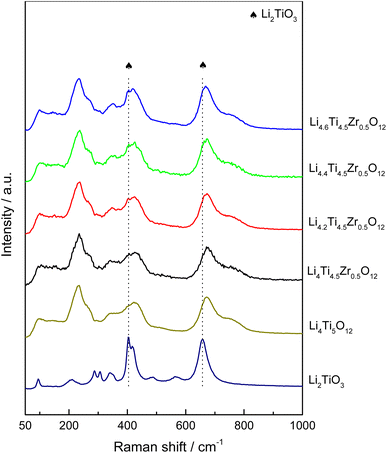
As-prepared Li4Ti5O12 samples can be classified into one group as Li4.4Ti5O12, Li4.4Ti4.75Zr0.25O12, Li4.4Ti4.5Zr0.5O12 and Li4.4Ti4.25Zr0.75O12 by tailoring the Zr/Ti ratio, and another group as Li4.0Ti4.5Zr0.5O12, Li4.2Ti4.5Zr0.5O12, Li4.4Ti4.5Zr0.5O12 and Li4.6Ti4.5Zr0.5O12 by tailoring the Li content. As shown in Fig. 1 and S1,† all Li4Ti5O12 samples present as aggregations of submicron particles. The undoped Li4.4Ti5O12 sample has irregular blocky structure and smooth surface, while other Zr-modified Li4Ti5O12 samples are agglomerated and form spheroidal structures. In the XRD patterns, all Li4Ti5O12 samples exhibit sharp diffraction peaks at 2θ = 18.4°, 35.6°, 43.3°, 57.3°, 62.9° and 66.1°, corresponding to the (111), (311), (400), (333), (440) and (531) crystal planes of spinel Li4Ti5O12 phase (JCPDS No. 49-0207),22 as shown in Fig. 2a and S2a.† Here, all XRD patterns are calibrated by the (002) peak of graphite. After Zr doping, no evident shift is observed for the XRD peaks of Li4Ti5O12 phase, as shown in Fig. 2b and S2b,† meanwhile there exhibit three additional peaks at 2θ = 30.3°, 28.4° and 31.6°, consistent with the tetragonal ZrO2 phase (JCPDS No. 50-1089) and the monoclinic ZrO2 phase (JCPDS No. 37-1484),23–25 which grow up by increasing the Zr/Ti ratio, as shown in Fig. 2c and S2c.† Thereby, the Zr element tends to accumulate on the surface to form ZrO2 phases, rather than dope into the bulk phase of Li4Ti5O12. Besides, there appears a peak at 2θ = 43.7° after Zr doping, which grows up evidently by increasing the Li content, as shown in Fig. 2d and S2d,† and this peak belongs to Li2TiO3 phase (JCPDS No. 33-0831),26 which is usually generated at a high Li/Ti ratio.As shown in Fig. 3 and S3,† as-prepared Li4Ti5O12 samples are further characterized by Raman spectra. There observe five vibration bands at 232, 337, 425, 674 and 760 cm−1, in which the low-frequency band at 232 cm−1 is attributed to the bending vibration of O–Ti–O (F2g mode), the middle frequency bands of 300–500 cm−1 are assigned to the stretching of Li–O in LiO6 and LiO4 polyhedra (F2g and Eg modes), and the high-frequency bands at 674 and 760 cm−1 are originated from Ti–O stretching in the TiO6 octahedron structure (A1g mode), consistent with the Raman spectrum of standard spinel Li4Ti5O12 structure.27,28 Besides, there emerge two shoulder peaks at 404 and 657 cm−1 that belong to Li2TiO3,29 which become evident by increasing the Zr/Ti ratio or the Li content, while no evident Raman signal is observed for the tetragonal and monocline ZrO2 phases.30 Thus, the Li4Ti5O12 and Li2TiO3 phases are confirmed by the Raman spectra in as-prepared Li4Ti5O12 samples.
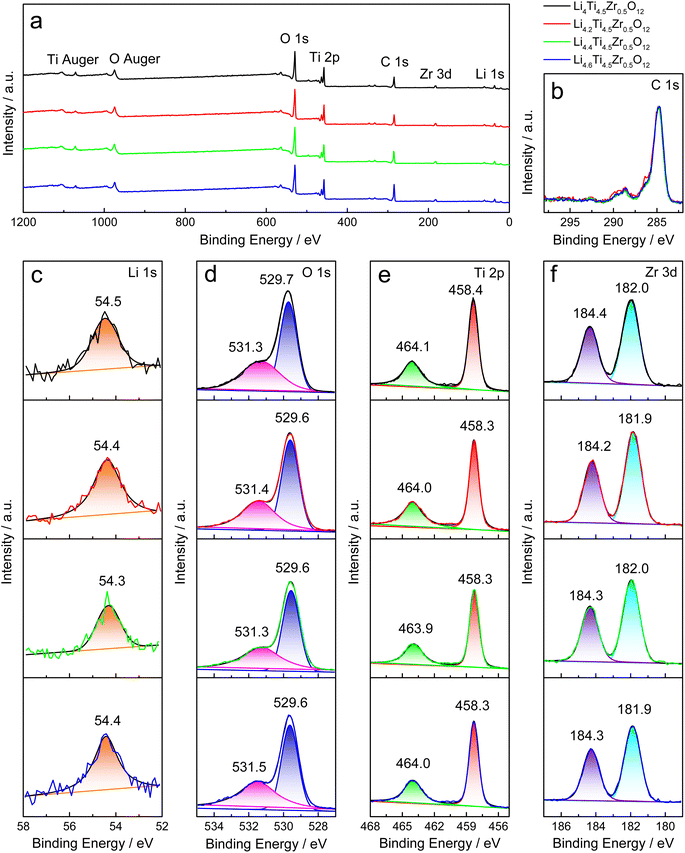
The XPS analysis is utilized to study the elemental composition and valence state of as-prepared Li4Ti5O12 samples. All samples were stored for ca. 3 weeks before XPS tests. The characteristic peaks of O 1s, Ti 2p, C 1s, Zr 3d and Li 1s are detected in the survey spectra, as shown in Fig. 4a and S4a.† Here, the signals around 169 eV and 230 eV may be caused by impurities introduced during the XPS measurement, as shown in Fig. S4a.† All XPS spectra are calibrated by the main peak of C 1s at 284.8 eV, as shown in Fig. 4b and S4b.† The Li 1s peak is situated 54.9 eV for Li4.4Ti5O12 and ca. 54.4 eV for Zr-modified Li4Ti5O12, as shown in Fig. 4c and S4c.† Through fitting by the Voigt function, there are two O 1s peaks at ca. 529.7 eV and ca. 531.4 eV, corresponding to oxygen ions in titanates (Li4Ti5O12 and Li2TiO3) and ZrO2, and the functional group of CO32−,31,32 respectively, and the latter decreases evidently by increasing the Zr/Ti ratio, as shown in Fig. 4d and S4d.† Two characteristic peaks at ca. 458.3 eV and ca. 464.0 eV are assigned to Ti 2p3/2 and 2p1/2 of Ti4+ in titanates (Li4Ti5O12 and Li2TiO3),33 as shown in Fig. 4e and S4e.† As shown in Fig. 4f and S4f,† the Zr 3d peaks at ca. 182.0 eV and ca. 184.3 eV grow up evidently by increasing the Zr/Ti ratio. Thereby, the XPS spectra verify the elemental composition and valence state in as-prepared Li4Ti5O12 samples, and the carbonate on the surface is evidently reduced by increasing the Zr/Ti ratio.
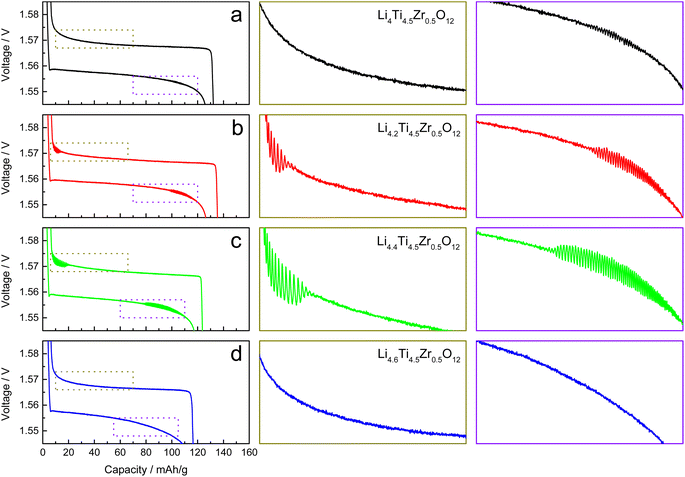
The galvanostatic charge–discharge measurements are conducted with a voltage range of 1.2–2.0 V vs. Li+/Li and a current rate of 0.1C for two groups of as-prepared Li4Ti5O12 samples. The charge and discharge curves become stable after initial 8 cycles, which are collected for analysis in this work. For Li4.4Ti5O12, there observes a strong electrochemical oscillation during charging only, consistent with the previous work,12 as shown in Fig. S5a.† After Zr-doping, the electrochemical oscillation disappears during charging while emerges during discharging in Li4.4Ti4.75Zr0.25O12, becomes strong during both charging and discharging in Li4.4Ti4.5Zr0.5O12, but disappears in Li4.4Ti4.25Zr0.75O12, as shown in Fig. S5b–d.† Notably, relative to the Ti content, the Li content is also heightened by increasing the Zr/Ti ratio in these four samples. By increasing the Li content, the electrochemical oscillation emerges during only discharging in Li4Ti4.5Zr0.5O12, appears and becomes strong for both charging and discharging in Li4.2Ti4.5Zr0.5O12 and Li4.4Ti4.5Zr0.5O12, respectively, but disappears in Li4.6Ti4.5Zr0.5O12, as shown in Fig. 5a–d. Thereby, the electrochemical oscillation gradually grows up during both charging and discharging, and then disappears by increasing the Li content (relative to the Ti content). In our previous work,12 the Li deficiency in Li4Ti5O12 leads to the electrochemical oscillation during only charging, in contrast, the Li excess gives rise to the electrochemical oscillation during both charging and discharging here.
In order to reveal the underlying mechanism, STEM images and EDX maps are collected to analyze the microstructure of Li4.4Ti4.5Zr0.5O12. As shown in Fig. 6a and b, the Li4.4Ti4.5Zr0.5O12 sample consists of submicron particles attached by many nanoparticles. The EDX maps disclose the uniform spatial distribution of O and Ti species, as shown in Fig. 6c and d, while the Zr element is gathered in the nanoparticles, as shown in Fig. 6e and f. As shown in Fig. S6,† the EDX map is remeasured to disclose the element distribution and the atomic fraction, especially for carbon, resultingly a little carbon of only 2.57% is uniformly distributed in the Li4.4Ti4.5Zr0.5O12 particle, possibly owing to ambient carbon contamination, as well as lithium carbonate produced by reaction of lithium titanate with air. Here, the extra carbon at the bottom of the image is due to the carbon support film, as shown in Fig. S6c.† In the high-resolution STEM images, the submicron particles are made of Li4Ti5O12 phase with an interplanar distance of d111 = 0.480 nm,34 and the nanoparticles consist of ZrO2 phases with an interplanar distance of d![[1 with combining macron]](https://www.rsc.org/images/entities/char_0031_0304.gif) 11 = 0.312 nm,23,35 as shown in Fig. S7.† Besides, there observes an amorphous film of several nanometers thick on the surface of both Li4Ti5O12 and ZrO2 particles. As a result, the Li4Ti5O12 submicron particles are well dispersed by the ZrO2 nanoparticles formed on the surface.
11 = 0.312 nm,23,35 as shown in Fig. S7.† Besides, there observes an amorphous film of several nanometers thick on the surface of both Li4Ti5O12 and ZrO2 particles. As a result, the Li4Ti5O12 submicron particles are well dispersed by the ZrO2 nanoparticles formed on the surface.
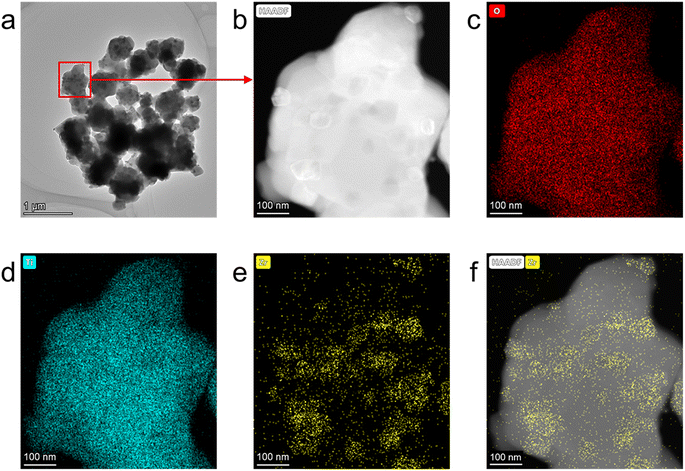 | ||
| Fig. 6 (a) The STEM image of Li4.4Ti4.5Zr0.5O12, the enlarged HAADF-STEM image (b) and the corresponding EDX maps of O (c), Ti (d), Zr (e) and Zr overlaping the HAADF-STEM image (f). | ||
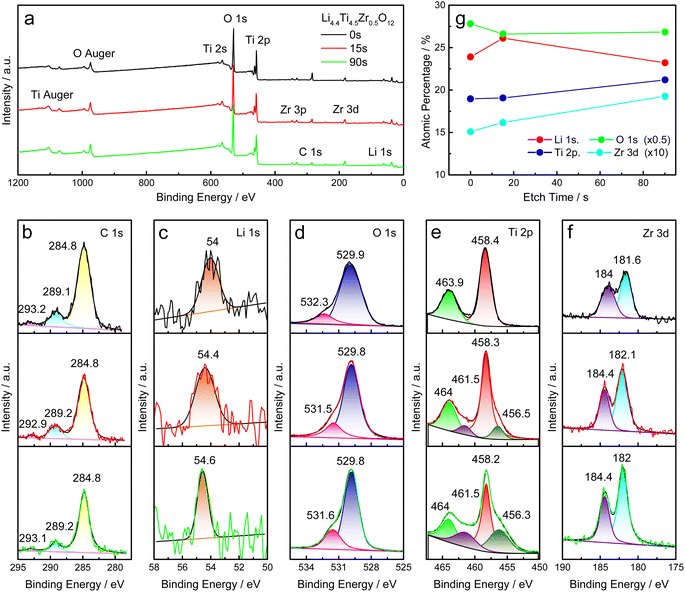
XPS depth-profiling measurements are applied to study the chemical composition of Li4.4Ti4.5Zr0.5O12 at different depths from the surface to the bulk. The full survey scan appears similar after etching for 0 s, 15 s and 90 s, as shown in Fig. 7a. All the XPS spectra for C 1s, Li 1s, O 1s, Ti 2p and Zr 3d are fitted with the Voigt function, as shown in Fig. 7b–f. Here, all XPS spectra are calibrated by the main peak of C 1s at 284.8 eV. Through etching, the C 1s peak at 284.8 eV decreases, the Li 1s peak shifts to the high binding energy and becomes sharp, the O 1s peak at ca. 532 eV increases evidently, corresponding to the functional group of CO32−, additional two Ti 2p peaks appear at ca. 456.4 eV and 461.5 eV, due to the Ti3+ ions formed after etching,36 and the Zr 3d peaks is heightened evidently. After etching for 90 s, the atomic percentage of Li element decreases significantly, while the Ti and Zr elements increase evidently, as shown in Fig. 7g. Therefore, the Li4.4Ti4.5Zr0.5O12 sample has a Li-excessive surface, possibly corresponding to the amorphous film observed in STEM images.
As to additional electrochemical data, the galvanostatic charge and discharge curves of Li4.4Ti4.5Zr0.5O12 at 1C, 0.5C, 0.2C, 0.1C and 0.05C are shown in Fig. S8.† The amplitude and range of charge and discharge oscillations decrease by increasing the rate. The discharge oscillation disappeared at the rate of 0.2C, and the charge oscillation disappear at the rate of 0.5C. With the increase of rate, the polarization increases significantly, and the specific capacity reduces evidently. As shown in Fig. S9,† the cycling performances were measured with a voltage range of 1.2–2.0 V vs. Li+/Li and a current rate of 0.1C to study the stability of Li4.4Ti4.5Zr0.5O12, as well as Li4.4Ti5O12 for comparison. The capacity retention is approximately 98% within 25 cycles, and the coulombic efficiency is almost constant at approximately 100%. And Fig. S10† shows the Nyquist plots of EIS spectra for Li4.4Ti5O12 and Li4.4Ti4.5Zr0.5O12 from 100 kHz to 0.1 Hz. The semicircle in the high frequency region represents the resistance of solid–electrolyte interphase (SEI) and the charge transfer resistance, which exhibit no significant difference between Li4.4Ti5O12 and Li4.4Ti4.5Zr0.5O12.
Accordingly, we propose a possible mechanism for the electrochemical oscillation during both charging and discharging. In the Zr-modified Li4Ti5O12, the Zr element tends to accumulate on the surface to form ZrO2 nanoparticles, rather than dope into the bulk phase of Li4Ti5O12, which make Li4Ti5O12 particles well dispersive. And an amorphous film of several nanometers thick is produced on the surface of both Li4Ti5O12 and ZrO2 particles, which might be Li-excessive. In LIBs, the electrochemical oscillation is observed during both charging and discharging, possibly owing to the Li excess, in contrast to the Li deficiency for only charging as reported in our previous work.12 However, too much Li2TiO3 phase might suppress the electrochemical oscillation by further increasing the Li content (relative to the Ti content). Thus, the Li4.4Ti4.5Zr0.5O12 sample exhibits the strongest electrochemical oscillation during both charging and discharging, compared with other Zr-modified Li4Ti5O12 samples.
4. Conclusion
In this work, a series of Zr-modified Li4Ti5O12 samples are prepared by using the spray-drying combined with high-temperature sintering method, which can be classified into one group as Li4.4Ti5O12, Li4.4Ti4.75Zr0.25O12, Li4.4Ti4.5Zr0.5O12 and Li4.4Ti4.25Zr0.75O12 by tailoring the Zr/Ti ratio, and another group as Li4.0Ti4.5Zr0.5O12, Li4.2Ti4.5Zr0.5O12, Li4.4Ti4.5Zr0.5O12 and Li4.6Ti4.5Zr0.5O12 by tailoring the Li content. In LIBs, the electrochemical oscillation gradually grows up during both charging and discharging, and then disappears by increasing the Li content (relative to the Ti content). According to the XRD, XPS and STEM results, the Zr element tends to accumulate on the surface to form ZrO2 nanoparticles, rather than dope into the bulk phase of Li4Ti5O12, which make Li4Ti5O12 particles well dispersive. Thereby, the Li excess can induce the electrochemical oscillation during both charging and discharging of Zr-modified Li4Ti5O12, in contrast to that the Li deficiency in Li4Ti5O12 leads to the electrochemical oscillation during only charging in our previous work. This finding might be extended to investigate the electrochemical oscillation of other materials in LIBs.Data availability
The data that support the findings of this study are available from the corresponding author upon reasonable request.Conflicts of interest
The authors declare no competing financial interest.Acknowledgements
This work was financially supported by National Natural Science Foundation of China (52162026 and 52062012), Hainan Provincial Natural Science Foundation of China (521RC499), Guangdong Province Key Discipline Construction Project (2021ZDJS102), the Innovation Team of Universities of Guangdong Province (2022KCXTD030 and 2020KCXTD011), and the Guangdong Key Laboratory for Hydrogen Energy Technologies (2018B030322005).References
- J. M. Tarascon and M. Armand, Nature, 2001, 414, 359–367 CrossRef CAS PubMed.
- M. Armand and J. M. Tarascon, Nature, 2008, 451, 652–657 CrossRef CAS PubMed.
- F. Degen, M. Winter, D. Bendig and J. Tübke, Nat. Energy, 2023, 8, 1284–1295 CrossRef CAS.
- T. Sasaki, Y. Ukyo and P. Novak, Nat. Mater., 2013, 12, 569–575 CrossRef CAS PubMed.
- D. Li, Y. Sun, Z. Yang, L. Gu, Y. Chen and H. Zhou, Joule, 2018, 2, 1265–1277 CrossRef CAS.
- L. Que, F. Yu, J. Wu, Z. Lan, Y. Feng, R. Zhao, Z. Sun, Z. Yang, H. Luo and D. Chao, Proc. Natl. Acad. Sci. U. S. A., 2024, 121, e2311075121 CrossRef CAS PubMed.
- T. Katrasnik, J. Moskon, K. Zelic, I. Mele, F. Ruiz-Zepeda and M. Gaberscek, Adv. Mater., 2023, 35, 2210937 CrossRef CAS PubMed.
- K. Zelic, I. Mele, A. Bhowmik and T. Katrasrik, Energy Storage Mater., 2023, 56, 489–494 CrossRef.
- M. M. Thackeray and K. Amine, Nat. Energy, 2021, 6, 683 CrossRef CAS.
- D. Li and H. S. Zhou, Mater. Today, 2014, 17, 451–463 CrossRef CAS.
- D. Li, Y. Sun, X. Z. Liu, R. W. Peng and H. S. Zhou, Chem. Sci., 2015, 6, 4066–4070 RSC.
- T. Lan, Q. Qiao, F. Hu, D. Li and Y. Chen, J. Phys. Chem. C, 2021, 125, 14549–14558 CrossRef CAS.
- Y. Chen, H. Pan, C. Lin, J. Li, R. Cai, S. J. Haigh, G. Zhao, J. Zhang, Y. Lin, O. V. Kolosov and Z. Huang, Adv. Funct. Mater., 2021, 31, 2105354 CrossRef CAS.
- H. Lim, M. A. Abbas and J. H. Bang, ACS Energy Lett., 2022, 7, 1086–1091 CrossRef CAS.
- L. Zhang, Y. Qu, J. Huang, X. Feng, D. Li and Y. Chen, Chem. Commun., 2019, 55, 1279–1282 RSC.
- L. Hou, X. Qin, X. Gao, T. Guo, X. Li and J. Li, J. Alloys Compd., 2019, 774, 38–45 CrossRef CAS.
- I. Seo, C.-R. Lee and J.-K. Kim, J. Phys. Chem. Solids, 2017, 108, 25–29 CrossRef CAS.
- Z. Wang, Z. Wang, W. Peng, H. Guo and X. Li, Ceram. Int., 2014, 40, 10053–10059 CrossRef CAS.
- J.-G. Kim, M.-S. Park, S. M. Hwang, Y.-U. Heo, T. Liao, Z. Sun, J. H. Park, K. J. Kim, G. Jeong, Y.-J. Kim, J. H. Kim and S. X. Dou, ChemSusChem, 2014, 7, 1451–1457 CrossRef CAS PubMed.
- T.-F. Yi, B. Chen, H.-Y. Shen, R.-S. Zhu, A.-N. Zhou and H.-B. Qiao, J. Alloys Compd., 2013, 558, 11–17 CrossRef CAS.
- J. Liu, X. Li, M. Cai, R. Li and X. Sun, Electrochim. Acta, 2013, 93, 195–201 CrossRef CAS.
- K. Ariyoshi, R. Yamato and T. Ohzuku, Electrochim. Acta, 2005, 51, 1125–1129 CrossRef CAS.
- A. Bumajdad, A. A. Nazeer, F. Al Sagheer, S. Nahar and M. I. Zaki, Sci. Rep., 2018, 8, 3695 CrossRef PubMed.
- Y. Mansilla, M. D. Arce, C. González-Oliver, J. Basbus, H. Troiani and A. Serquis, Appl. Surf. Sci., 2021, 569, 150787 CrossRef CAS.
- C. V. Reddy, B. Babu, I. N. Reddy and J. Shim, Ceram. Int., 2018, 44, 6940–6948 CrossRef CAS.
- Y. Xie, Q. Wang, F. Gu, K. Dai, M. Shui and J. Shu, J. Alloys Compd., 2022, 893, 162348 CrossRef CAS.
- R. Baddour-Hadjean and J. P. Pereira-Ramos, Chem. Rev., 2010, 110, 1278–1319 CrossRef CAS PubMed.
- W.-C. Chien, Z.-H. Wu, Y.-C. Hsieh, Y.-S. Wu, S.-H. Wu and C.-C. Yang, Ceram. Int., 2020, 46, 26923–26935 CrossRef CAS.
- R. Ramaraghavulu, S. Buddhudu and G. Bhaskar Kumar, Ceram. Int., 2011, 37, 1245–1249 CrossRef CAS.
- L. Kurpaska, M. Lesniak, R. Jadach, M. Sitarz, J. J. Jasinski and J. L. Grosseau-Poussard, J. Mol. Struct., 2016, 1126, 186–191 CrossRef CAS.
- J. J. Gao, B. L. Gong, Q. T. Zhang, G. D. Wang, Y. J. Dai and W. F. Fan, Ionics, 2015, 21, 2409–2416 CrossRef CAS.
- H. Wang, L. Wang, J. Lin, J. Yang, F. Wu, L. Li and R. Chen, Electrochim. Acta, 2021, 368, 137470 CrossRef CAS.
- H. Song, T. G. Jeong, Y. H. Moon, H. H. Chun, K. Y. Chung, H. S. Kim, B. W. Cho and Y. T. Kim, Sci. Rep., 2014, 4, 4350 CrossRef PubMed.
- J. Speulmanns, A. M. Kia, S. Bönhardt, W. Weinreich and P. Adelhelm, Small, 2021, 17, 2102635 CrossRef CAS PubMed.
- R. Zhang, H. Liu and D. He, Catal. Commun., 2012, 26, 244–247 CrossRef CAS.
- C.-Y. Guo and X. Qi, Mater. Des., 2019, 179, 107888 CrossRef CAS.
Footnotes |
| † Electronic supplementary information (ESI) available. See DOI: https://doi.org/10.1039/d4ra03331k |
| ‡ Y. S. and F. H. contributed equally to this work. |
| This journal is © The Royal Society of Chemistry 2024 |

