DOI:
10.1039/D4RA03385J
(Paper)
RSC Adv., 2024,
14, 21355-21374
Design, synthesis, and in vitro and in silico studies of morpholine derived thiazoles as bovine carbonic anhydrase-II inhibitors†
Received
8th May 2024
, Accepted 1st July 2024
First published on 8th July 2024
Abstract
Carbonic anhydrase CA-II enzyme is essential for maintaining homeostasis in several processes, including respiration, lipogenesis, gluconeogenesis, calcification, bone resorption, and electrolyte balance due to its vital function within cellular processes. Herein, we screened 25 newly synthesized thiazole derivatives and assessed their inhibitory potential against the zinc-containing carbonic anhydrase CA-II enzyme. Intriguingly, derivatives of thiazole exhibited varying degrees of inhibitory action against CA-II. The distinctive attribute of these compounds is that they can attach to the CA-II binding site and block its action. Morpholine based thiazoles can be strategically modified to improve bovine CA-II inhibitor binding affinity, selectivity, and pharmacokinetics. Thiazole and morpholine moieties can boost inhibitory efficacy and selectivity over other calcium-binding proteins by interacting with target bovine CA-II binding sites. The derivatives 23–26 exhibited greater affinity when compared to the standard acetazolamide. Furthermore, kinetic study of the most potent compound 24 was performed, which exhibited concentration dependent inhibition with a Ki value of 9.64 ± 0.007 μM. Molecular docking, MD simulation and QSAR analysis was also carried out to elucidate the interactions, orientation, and conformational changes of these compounds within the active site of the enzyme. Moreover, pharmacokinetic assessments showed that most of the compounds possess attributes conducive to potential drug development.
1 Introduction
Carbonic anhydrases (CAs, EC 4.2.1.1) are zinc-containing metallo-enzymes and are present in a wide variety of organisms, including eubacteria, archaea, plants, algae, and mammals. So far, seven separate and unrelated CA families—the α-, β-, γ-, δ-, ζ-, η-, and θ-CAs have been identified; all of these families catalyze the reversible hydration process of carbon dioxide to produce bicarbonate and protons.1–3 Various metabolic processes, in many physiological and pathological activities, rely on the reversible hydration of CO2 and its by-products.4 These include transporting CO2, participating in biosynthetic reactions like ureagenesis, lipogenesis, and gluconeogenesis, secreting electrolytes, facilitating bone resorption and calcification, and even facilitating tumorigenesis.5,6 Conversely, disorders like cancer, epilepsy and glaucoma are linked to any aberration in these enzymes.7 Approximately 87% of the amino acid residues in human and mammalian CA are identical, and the two species share a very similar fundamental structure,8 but α-CAs are quite versatile and can catalyze various additional hydrolytic reactions. Enzymes belonging to the hydrolase family include carbonic anhydrases. The α-CA class, which is exclusive to mammals, comprises sixteen distinct isoforms.9 CA-I, CA-II, CA-III, CA-VII, and CA-XIII are cytosolic isoforms; CA-VA and CA-VB are mitochondrial isoforms; CA-IV, CA-IX, CA-XII, CA-XIV, and CA-XV are membrane-associated isoforms; and CA-VI is the isoform found in saliva.10,11
Carbonic anhydrase-II (CA-II), the most prevalent isoform of CA enzymes in the body, is not only present in red blood cells, gastrointestinal tract, lungs, and kidneys but also in some types of cancer, such as urothelial carcinoma12,13 as well as in malignant brain tumors. Its inhibitors have been extensively used in medicine for its diuretic, antiglaucoma, and antiepileptic properties.9,14,15 It has also been associated with various other conditions such as epilepsy, edema, glaucoma, and altitude sickness. Glaucoma is a multifaceted condition that involves elevated pressure within the eye, resulting in harm to the optic nerve and the possibility of impaired vision. CA inhibitors are a type of medication that can effectively lower intraocular pressure, by blocking the carbonic anhydrase enzymes in the ciliary body of the eye, these drugs decrease the production of aqueous humor, which helps to lower intraocular pressure making them a valuable treatment option for glaucoma. Enzyme inhibitors are small compounds that bind to enzymes and stop substrate molecules from entering the active site of the enzyme, reducing the activity of the enzyme.2,16 Carbonic anhydrase inhibitors (CAIs) contain a catalytic Zn2+ ion in the active site of CA isoenzymes to reduce their activity.14 These enzymes are intriguing targets for therapeutic intervention in the management of pathological diseases. CA-II primarily regulates the concentration of bicarbonate in the eyes and CA-II inhibitors are effective in lowering the elevated intraocular pressure commonly observed in individuals with glaucoma.10,17 Additionally, CA-II is also present in malignant brain tumors, as well as in renal, gastritis, and pancreatic carcinomas.18,19 CA-II inhibitors have also been explored as a supplementary treatment in cancer chemotherapy.1,20–22 The plethora of enzyme isoforms, the enzyme's pervasiveness in many tissues and organs, and the inability of current drugs to exclusively target isoenzymes have made CA inhibitors unsafe. Commercial CA-II inhibitors including ethoxzolamide (EZA),23 methazolamide (MZA),24 and acetazolamide (AZA)12 are powerful but not selective. Blocking CA-II enzymes and other isoenzymes, these compounds may cause drowsiness, tingling, sadness, weariness, weight loss, gastrointestinal issues, metabolic acidosis, myopia, and other adverse effects. Therefore, safe CA inhibitors with high selectivity are need of time in drug development.
Thiazole derivatives are crucial in pharmacological applications due to their prevalence in natural sources.25 Thiazole-based drugs are used for the treatment of allergies, epilepsy, inflammation, schizophrenia, bacterial and HIV infections, representing a valuable structural component in the development of synthetic drug candidates.26,27 Additionally, thiazoles possess antifungal and radio-protective qualities. Particularly in the search for potential novel pharmaceuticals, heterocyclic chemistry plays a crucial role. Many bioactive chemicals have compounds that contain a morpholine scaffold, which is highly significant in the field of heterocyclic chemistry.28,29
The usage of thiazoles has increased in medicinal chemistry due to their status as a preferred class of heterocyclic compounds that have a growing number of potential therapeutic candidates. Several thiazole derivatives, sulfonamides30,31 and hydrazinyl32 were tested as CA-II inhibitors. These thiazole derivatives show compelling CA-II inhibition33 while a series of morpholine derivatives has also been reported as potent inhibitors of CA-II. Morpholine-substituted acetamide,34 sulfonamide,33 and acryl amide35 are studied for CA-II inhibitors.
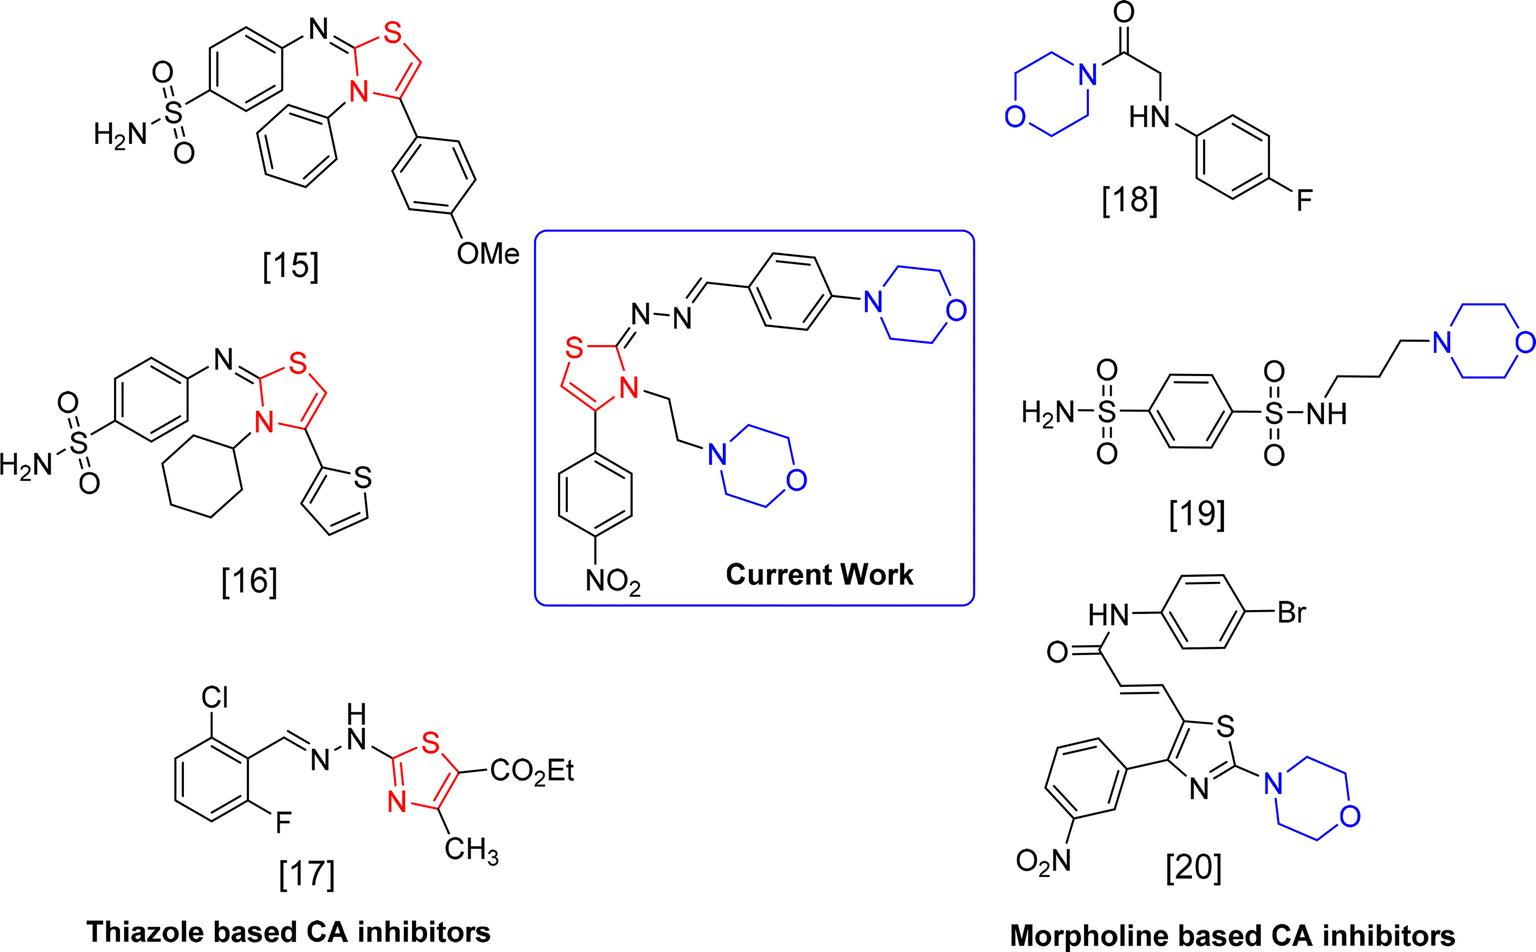
In this study, we describe the synthesis and the inhibition of bovine carbonic anhydrase-II (bCA-II) of 25 novel thiazole derivatives. New morpholine based thiazole derivatives were developed as specific inhibitors for carbonic anhydrase (CA) isoform II, aiming to discover potent therapeutic agents for glaucoma. In glaucoma research, both bovine and human models have been used to study the effectiveness and mechanisms of action of CA inhibitors. In initial pharmacological studies, bovine models are frequently utilized because of the striking resemblance of their eye anatomy and physiology to that of humans. They offer a viable and morally sound option for preliminary research before conducting human trials. The design of the thiazole derivatives was supported by docking studies and the kinetic studies of the active thiazoles provided better insights on their inhibitory mechanism (Fig. 1).
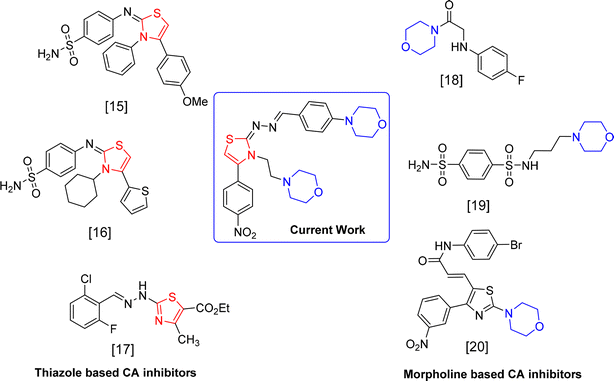 |
| | Fig. 1 Reported inhibitors of CA-II. | |
2 Results and discussion
2.1 Chemistry
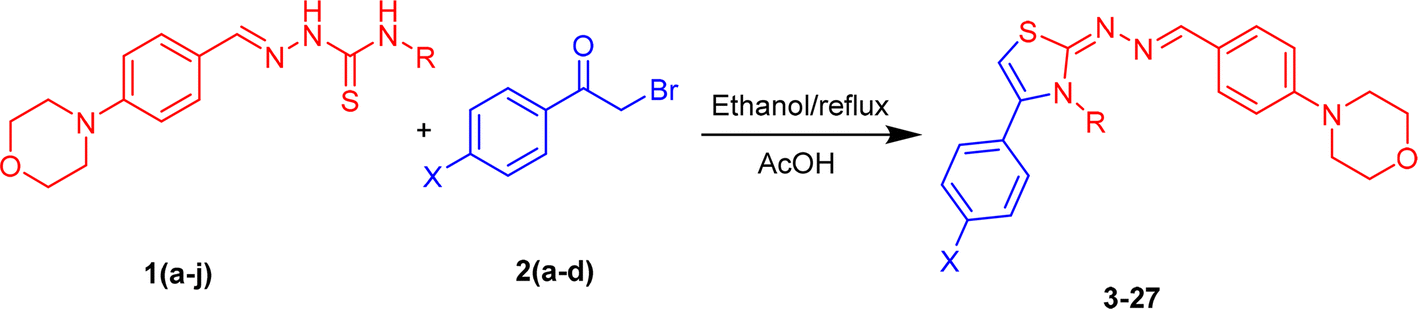
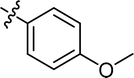
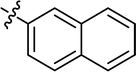
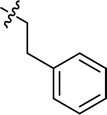
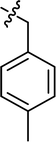
The morpholine-based thiazole analogues were synthesized as shown in Scheme 1 following the procedure outlined in experimental Section 3.3. All produced compounds were analyzed using advanced spectroscopic techniques, including 1H NMR and 13C NMR, to determine their structures. The 1H-NMR spectrum of the previous product displayed four singlet signals corresponding to CH2, thiazole-H, OH, and NH protons, respectively. Morpholine –CH2 protons in 1HNMR were observed between δ 3.13–3.73 ppm as triplet. While the aromatic protons displayed variable patterns depending on the substituent and appeared within the range of δ 6.0–8.5 ppm. The chemical shift value of the ring carbons (benzene ring) in a 13CNMR spectrum appeared within the range of 110–167 ppm. Carbon atoms bonded to a nitrogen atom in the thiazole ring are significantly deshielded due to nitrogen's high electronegativity, resulting in their detection at 145–150 ppm downfield. All final product structures are detailed in Table 1. The 13C-NMR spectrum displayed four signals at δ 53.2, 63.0, and 66.5 corresponding to morpholine-C3, CH2, and morpholine-C2 carbons, respectively. It also showed 13 signals associated with methine-C, thiazole, and aromatic carbons.
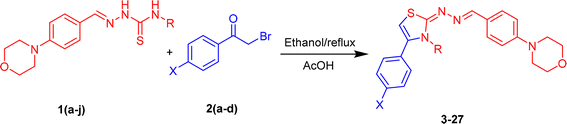 |
| | Scheme 1 Synthesis of morpholine based thiazoles (3–27). | |
Table 1 A list of the synthesized thiazoles derivatives (3–27)
| Compound |
R |
X |
Percent inhibition (0.5 mM) |
IC50 ± μM (SEM) |
| 3 |
 |
H |
86.44 |
30.20 ± 0.59 |
| 4 |
 |
H |
87.59 |
24.39 ± 0.71 |
| 5 |
 |
H |
86.61 |
26.49 ± 0.68 |
| 6 |
 |
H |
84.29 |
34.61 ± 1.10 |
| 7 |
 |
H |
80.94 |
37.20 ± 1.37 |
| 8 |
 |
H |
83.11 |
27.35 ± 0.47 |
| 9 |
 |
H |
80.73 |
33.69 ± 0.63 |
| 10 |
 |
H |
80.20 |
39.72 ± 1.41 |
| 11 |
 |
H |
78.40 |
44.30 ± 0.82 |
| 12 |
 |
H |
76.89 |
46.18 ± 1.27 |
| 13 |
 |
Cl |
80.47 |
31.50 ± 0.74 |
| 14 |
 |
Cl |
80.69 |
35.44 ± 0.64 |
| 15 |
 |
Cl |
75.36 |
49.31 ± 1.35 |
| 16 |
 |
Cl |
70.20 |
56.29 ± 1.40 |
| 17 |
 |
Cl |
71.19 |
51.22 ± 1.26 |
| 18 |
 |
Cl |
69.84 |
59.26 ± 1.21 |
| 19 |
 |
Cl |
70.35 |
48.25 ± 1.19 |
| 20 |
 |
Cl |
80.53 |
36.10 ± 0.60 |
| 21 |
 |
Cl |
81.46 |
38.59 ± 0.48 |
| 22 |
 |
NO2 |
89.61 |
20.36 ± 0.47 |
| 23 |
 |
NO2 |
89.79 |
16.24 ± 0.30 |
| 24 |
 |
NO2 |
90.25 |
14.68 ± 0.29 |
| 25 |
 |
NO2 |
88.69 |
16.53 ± 0.40 |
| 26 |
 |
NO2 |
89.76 |
17.21 ± 0.36 |
| 27 |
 |
Br |
84.95 |
23.80 ± 0.44 |
| |
|
Acetazolamide |
|
18.20 ± 0.43 |
2.2 In vitro CA-II inhibition
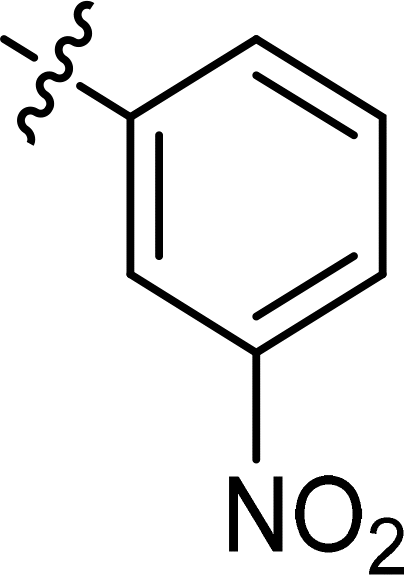
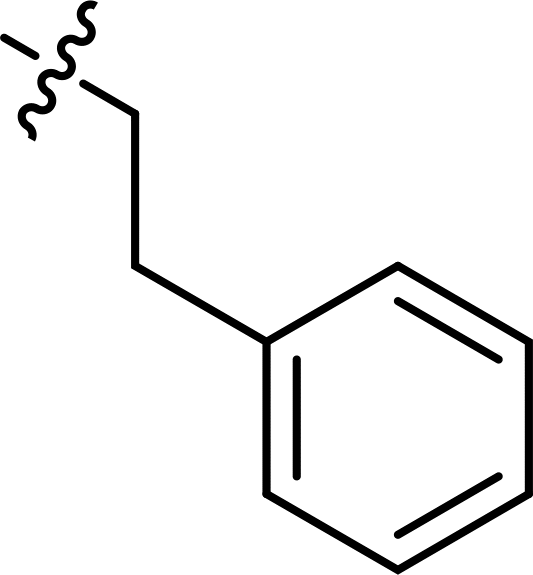
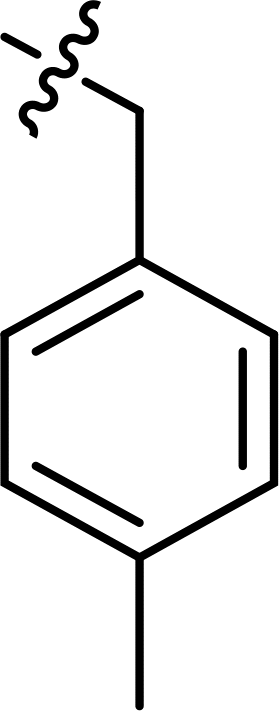
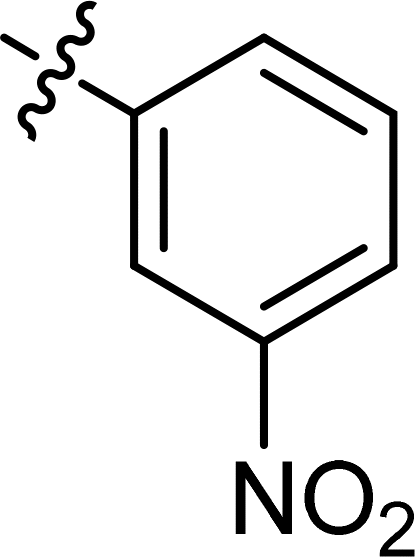
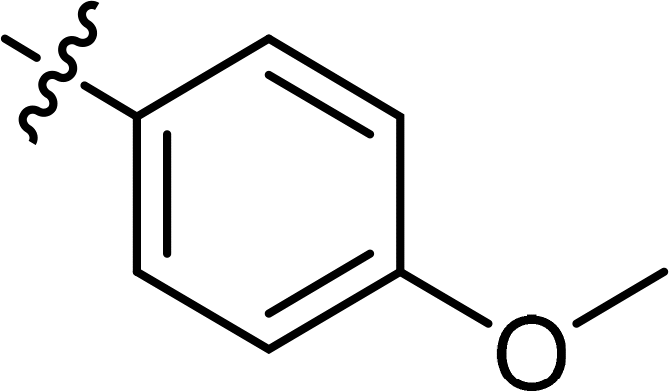
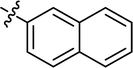
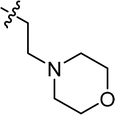
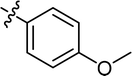
The thiazole residue and its 4-phenyl moiety were substituted to explore the biological activity of the synthesized morpholine-based thiazoles. As showed in Fig. 2, the 4-para-nitrophenyl substitution resulted in a more potent compound series (IC50 range 14–20 μM) than the unsubstituted 4-phenyl derivatives (IC50 range 24–46 μM), while the 4-para-chlorophenyl analogs exhibited the least inhibitory activity in this study (IC50 range 31–59 μM). The only 4-para-bromophenyl derivative 27 exhibited good potency with IC50 of 23.80 μM, showing that a larger halogen can increase the activity of the inhibitors. The N-substitution of thiazole was achieved introducing both aromatic and non-aromatic residues directly attached to the nitrogen atom or through one or two methylene units. The small benzene directly connected to the nitrogen atom of the thiazoles (compounds 4, 13 and 23) led to higher inhibitory activity against the bovine CA-II. Moreover, the N-benzyl derivatives 5 and 14 exhibited good potency. Interestingly, the 4-para-nitrophenyl N-ethyl-morpholine derivative 24 was the most potent compound of this study with IC50 of 14.68 μM. The morpholine based thiazole ring's improved CA-II inhibition is attributed to electron-withdrawing ability by the inclusion of the NO2 group, which can influence the pKa value of the molecule leading to an increase in the molecule's hydrophobicity and lipophilicity. This improves CA-II inhibition by making it easier for the inhibitor to engage with the CA-II channel. Steric characteristics, which are affected by the bulkiness of the NO2 group, can alter the binding of the inhibitor to the CA-II channel. As a result, CA-II inhibition may become more targeted and effective. The 4-para-phenyl (7) and 4-para-chlorophenyl (17) derivatives exhibited lower inhibitory activities (IC50 of 37.20 and 51.22 μM, respectively) indicating that the effects of the substitutions of the thiazole moiety on the CA-II inhibitory activities are interdependent. The structure–activity relationships of this study serves as starting point for the design of potent CA-II inhibitors with a thiazole scaffold.
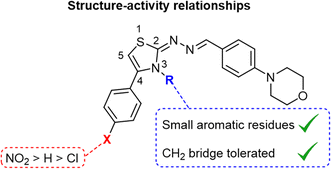 |
| | Fig. 2 Structure–activity relationships of the morpholine-based thiazoles as inhibitors of the bovine carbonic anhydrase-II. | |
2.3 Enzyme kinetics study
To explore the mechanism of action the most potent inhibitor 24 was proceeded for their in vitro kinetic studies. The mechanistic study revealed competitive type of inhibition with Ki value 9.64 ± 0.07 μM. In this type of inhibition, the inhibitor binds with the active site residues of enzyme that leads to increase the Km value of enzyme while Vmax remains constant (Fig. 3). The type of inhibition was determined from Line weaver–Burk plot (Fig. 3A) and Ki was elucidated from secondary replot of Line weaver–Burk plot (Fig. 3B), which is further confirmed from Dixon plot (Fig. 3C).
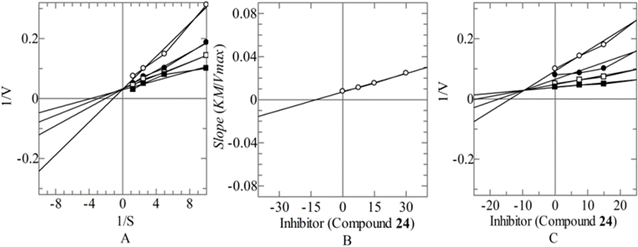 |
| | Fig. 3 Mode of inhibition of CA-II by compound (24) (A) Line weaver–Burk plot of reciprocal of rate of reaction (velocities) vs. reciprocal of substrate 4-nitrophenyl acetate in the absence of (■), and in the presence of 30.00 μM (○), 15.00 μM (●) and 7.50 μM (□) of compounds (24). (B) Secondary replot of line weaver–Burk plot between the slopes of each line on line weaver–Burk plot vs. different concentrations of compounds (24). (C) Dixon plot of reciprocal of rate of reaction (velocities) vs. different concentrations of compounds (24). | |
2.4 Molecular docking
Using molecular docking, we further analysed the hypothetical binding mode of the synthesized compounds (3–24) as effective CA-II inhibitors. Using the Glide module, we docked the successful compounds from the virtual screening into the binding cavity of protein 5LJT. Using increased precision (XP), we docked molecules. We also looked at the hits' docking scores, which in XP mode ranged from −6.102 to −3.426 kcal mol−1 (Table 2).
Table 2 Molecular docking score of synthesized compounds (3–24)
| Code |
Docking score (−kcal mol−1) |
Code |
Docking score (−kcal mol−1) |
Code |
Docking score (−kcal mol−1) |
| 3 |
−5.175 |
12 |
−4.722 |
20 |
−4.095 |
| 4 |
−4.504 |
13 |
−4.751 |
21 |
−3.928 |
| 5 |
−4.431 |
14 |
−5.362 |
22 |
−4.095 |
| 6 |
−5.416 |
15 |
−4.274 |
23 |
−6.072 |
| 7 |
−5.343 |
16 |
−4.95 |
24 |
−6.102 |
| 8 |
−5.177 |
17 |
−3.52 |
25 |
−5.046 |
| 9 |
−5.185 |
18 |
−3.426 |
26 |
−4.963 |
| 10 |
−3.856 |
19 |
−3.936 |
27 |
−4.5 |
| 11 |
−4.429 |
Acetazolamide |
−5.417 |
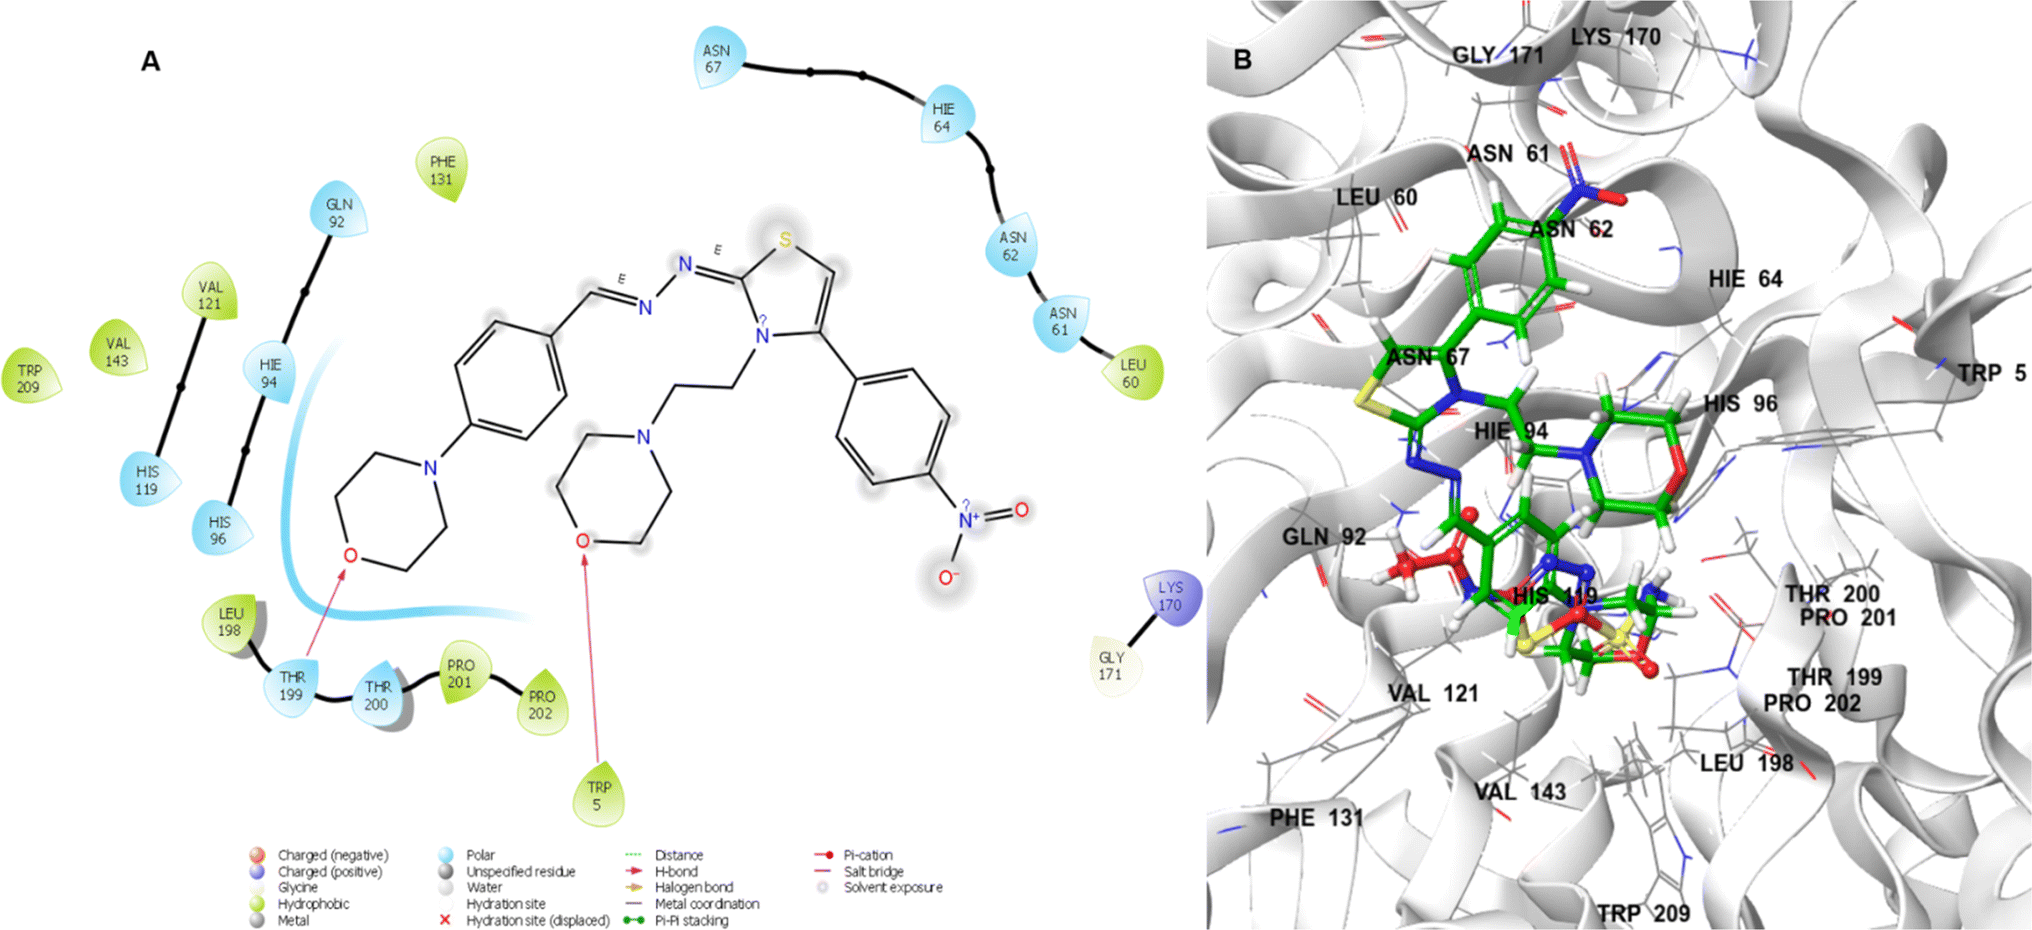
In Fig. 4A, lead molecule 24 binds to the binding pocket of 5LJT. In the binding regions of 5LJT, the chemical 24 interacted with important amino acids. These featured the hydrogen-bonding amino acid residues Trp5 and Thr199 as well as the hydrophobic interactions Trp209, Pro202, Pr0201, Thr200, Leu198, Gly171, Lys170, Val143, His119, Val121, Phe131, His96, Gln92, Asn67, Ans62, Asn61, and Leu60. In 3D interaction with we see lead compound and acetazolamide bind in similar pocket and lead compound occupied whole pocket of C II protein. Overall, hydrogen bonding between amino acid (Trp5 and Thr199) and oxygen atom of morpholine ring of lead compound 24 may show favourable for CA-II inhibition.
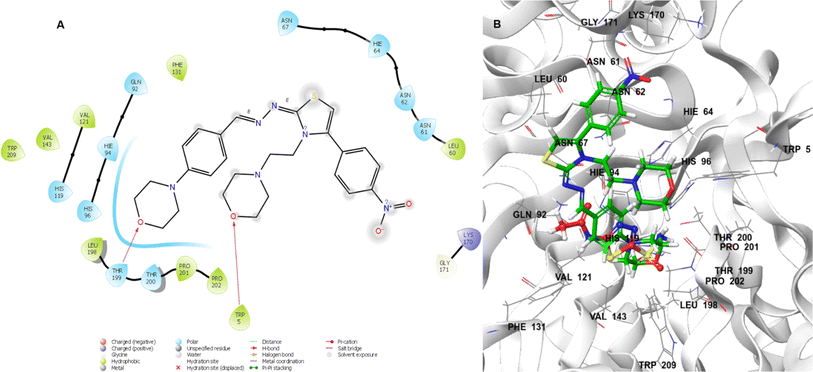 |
| | Fig. 4 Lead compound 24 (A) in two dimensions. 3D (B) acetazolamide (red) and 24 (green) interacting with the CA-II binding pocket. | |
2.5 Molecular dynamics simulation (MDS)
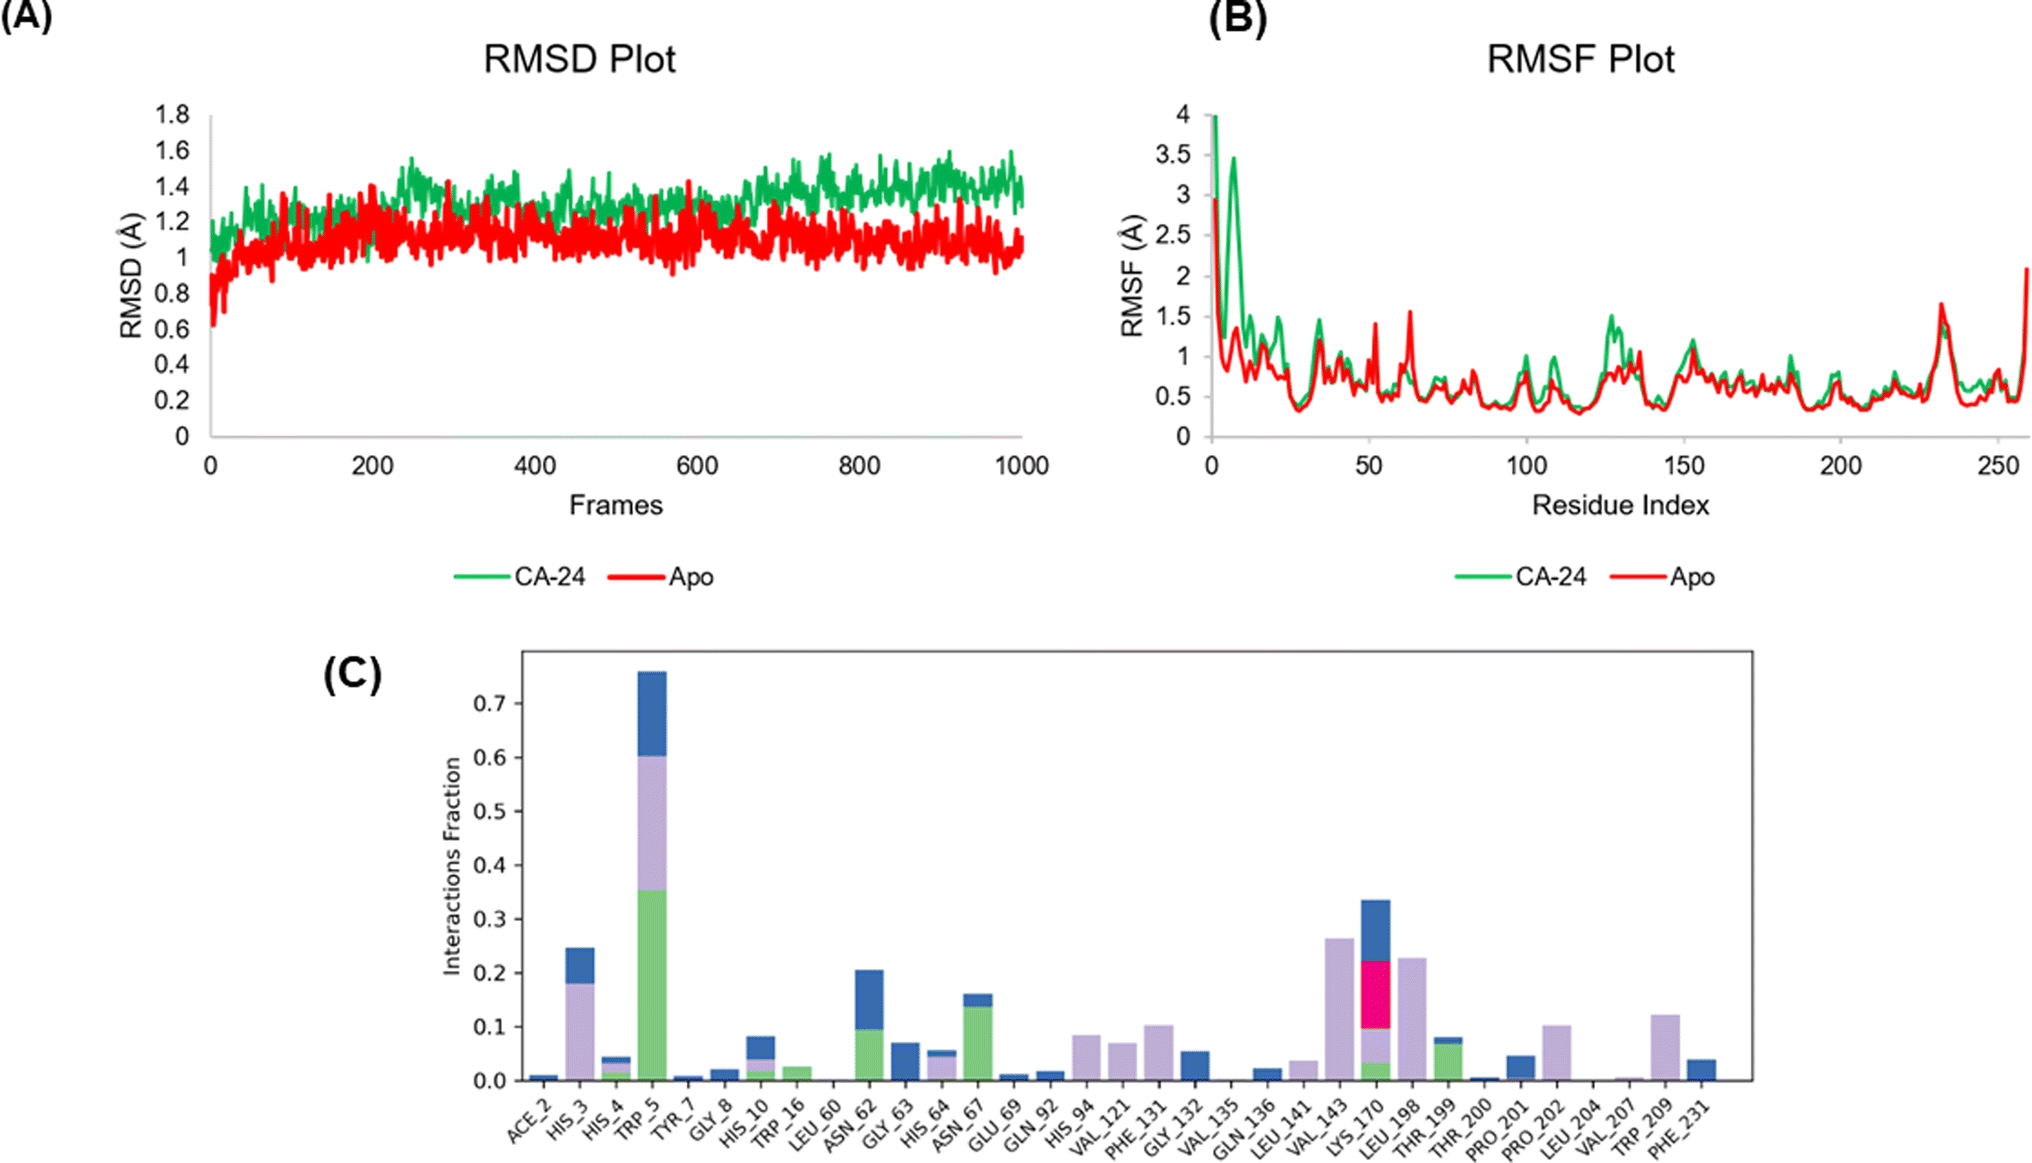
It seems possible to fully characterize biological systems as dynamic networks of molecular interactions by applying molecular dynamics (MD). A cohesive viewpoint on the relationship between a protein and its ligands is offered by this method. In order to better understand the dynamic behaviour of the docked 24-CA-II complex and apo protein, we ran MD simulations for 150 ns. To sample several conformations that the complex could take in a solvated state, an explicit water model was used. Throughout the simulation, the ligand's occupancy of the substrate-binding pocket of the CA-II enzyme and the primary interactions seen in the first docked posture were preserved. The root mean square deviation (RMSD) value obtained from the MD simulation trajectory is a crucial parameter for tracking modifications in the structural conformation of the protein backbone during system equilibration. The stability of the protein structure is indicated by consistently low and stable RMSD values. The RMSD plot presented in our simulation showed a stable ligand–protein complex, with RMSD values ranging from 0.9 to 1.60 Å for the protein's Cα atoms associated with 24 and apo protein 0.8 to 1.50 Å. The average RMSD values for the 24-CA-II and apo were 1.30 Å and 1.18 Å, respectively. Throughout the simulation, the protein's RMSD did not change, with the exception of a little fluctuation at 35–40 ns. On the other hand, the apo protein RMSD fluctuated for very minute and staying constant until the simulation ended (Fig. 5A). Generally, the 24-CA-II docked complex protein showed miniscale deviation from the docked attitude comparing to apo protein. A protein's Root Mean Square Fluctuation (RMSF) value is frequently employed, in addition to RMSD, to evaluate ligand-induced changes in the internal chains of the protein. The RMSF provides information about the mobility and flexibility of particular amino acids. Less flexibility and mobility in the residue are indicated by a lower RMSF value. When the RMSF value at the active site residues of a protein is low, the ligand–protein interaction results in greater binding between the two molecules. Low values indicate the presence of secondary structures that control structural stability, such as helices and sheets. Greater RMSF values (peaks), on the other hand, indicate the presence of twists, loops, terminal ends, and slack bonding, which suggests structural flexibility. The flexible portions of the protein were thus described in depth by the protein RMSF plot analysis. Thirty two amino acids in the CA-II protein, His3 (4.2 Å), His4 (2.299 Å), Trp5 (1.247 Å), Tyr7 (2.124 Å), Gly8 (3.218 Å), His10 (2.945 Å), Trp16 (0.908 Å), Leu60 (0.652 Å), Asn62 (0.768 Å), Gly63 (0.894 Å), His64 (0.782 Å), Asn67 (0.564 Å), Glu69 (0.492 Å), Gln92 (0.445 Å), His94 (0.379 Å), Val121 (0.349 Å), Phe13 (1.184 Å), Gly132 (1.347 Å), Val135 (0.927 Å), Gln136 (1.093 Å), Leu141 (0.426 Å), Val143 (0.36 Å), Lys170 (0.705 Å), Leu198 (0.504 Å), Thr199 (0.58 Å), Thr200 (0.774 Å), Pro201 (0.758 Å), Pro202 (0.806 Å), Leu204 (0.527 Å), Val207 (0.43 Å), Trp209 (0.372 Å), and Phe231 (0.742 Å). The residues in the catalytic pocket showed significantly less fluctuation than other residues, suggesting that the residue's conformation stayed rather stable during the simulation (Fig. 5B). The differences in RMSF between the apo protein and the 24-complex fluctuated between ranges of 100–150 and 1–10 amino acid residues. Overall, the apo and complex RMSD and RMSF were comparable. The binding interactions between 24 and the amino acid residues in the active site within the binding pocket of the CA-II protein are shown in Fig. 5C. The MD simulations show that hydrogen bonds, polar interactions (water-mediated hydrogen bonding), and hydrophobic interactions are the most common types of interactions. His3, Trp5, Asn67, His94, Val121, Phe131 Val143, Lys170, Leu198, Thr199, Pro202, and Thr209 show considerable contact with 24 based on the protein–ligand contact analysis. Amino acid Trp5 shows hydrophobic, hydrogen bond, and water bridge interaction with compound 24 throughout 150 ns MDS. Similar interactions can be seen when comparing the ligand's 2-D interaction during docking (Fig. 4A) with that following simulation. Compound 24's simulation result show hydrogen bonding with amino acid Trp5, which may imply that it has the potential to be an inhibitor of CA-II.
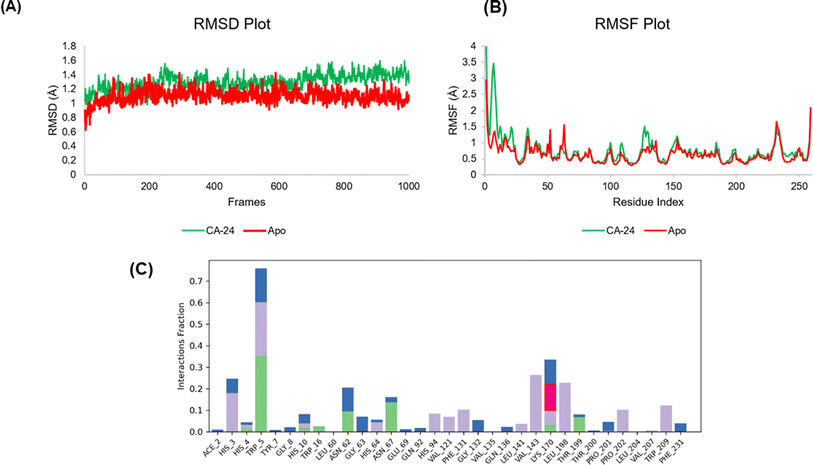 |
| | Fig. 5 MD simulation analysis of 24-CA-II complex and apo protein. Root-mean-square deviation (RMSD) (A) and root-mean-square fluctuation (RMSF) of various amino acids (B). Protein–ligand contact analysis of 24-CA-II (C). | |
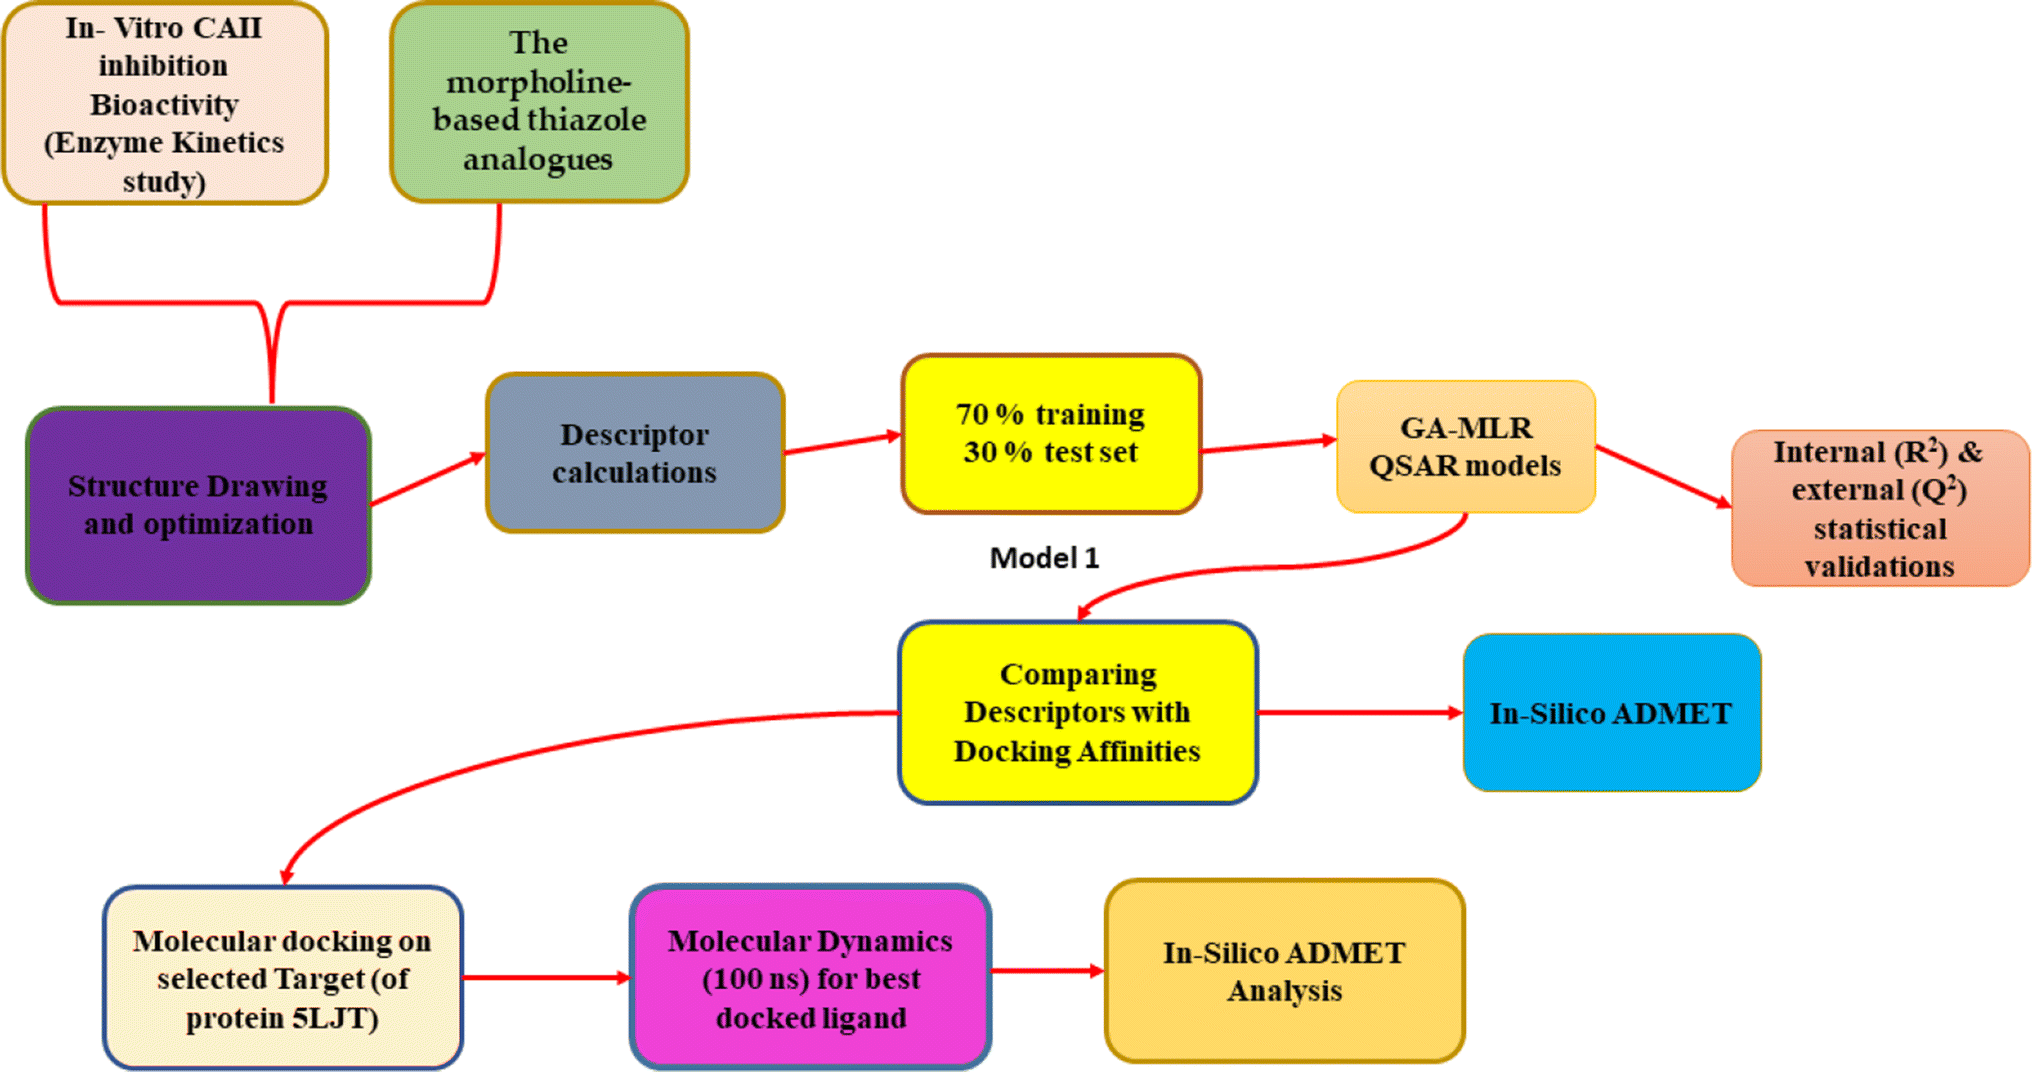
2.6 GA-MLR based QSAR analysis
2.6.1 QSAR model. Out of developed 20 QSAR models, we selected the most statistically robust model as given below:
2.6.1.1 QSAR model-1. PIC50 = −60.0735 + 0.4231 (±0.1843) × GATS2c + 6.4836 (±0.2944) × SpMax2_Bhv + 32.6610 (±1.2276) × SpMin6_Bhe − 1.2490(±1.0248) × VP-6 statistical parameters (internal and external validations) R2: 0.9238, Radj2: 0.9021, R2 − Radj2: 0.0218, LOF: 0.0068, Kxx: 0.3365, delta K: 0.0432, RMSE tr: 0.0478, MAEtr: 0.0375, RSStr: 0.0434, CCCtr: 0.9604, s: 0.0557, F: 42.4449, Qloo2: 0.8534, R2 − Qloo2: 0.0704, RMSEcv: 0.0663, MAE cv: 0.0534, PRESS cv: 0.0836, CCCcv: 0.9227, QLMO2: 0.6971, RYscr2: 0.2147, QYscr2: 0.8949, RMSE AV Yscr: 0.1529, calc. external data regr. angle from diagonal: −41.0675°.For the statistical meanings of these parameters, please refer to ESI.† From our analysis, the obtained model-1 was found to be statistically robust and interpretable as below. Moreover, the external validation parameters were in-lined with the known limits as reported in our earlier publications. Obtained QSAR model was demonstrated with low values of MAE (mean absolute error), LOF (lack-of-fit), and RMSE (root mean square error) denoting good QSAR model. Fig. 6 displays various plots obtained for the model-1 using QSARINS result analysis. These plots include, the correlation among experimental and predicted pIC50 values, residual plot, and standard Williams plot to check the applicability domains. The developed model was found to fulfil set criterions by OECD (the Organisation for Economic Co-operation and Development). Please refer Table S1† for dataset splitting.
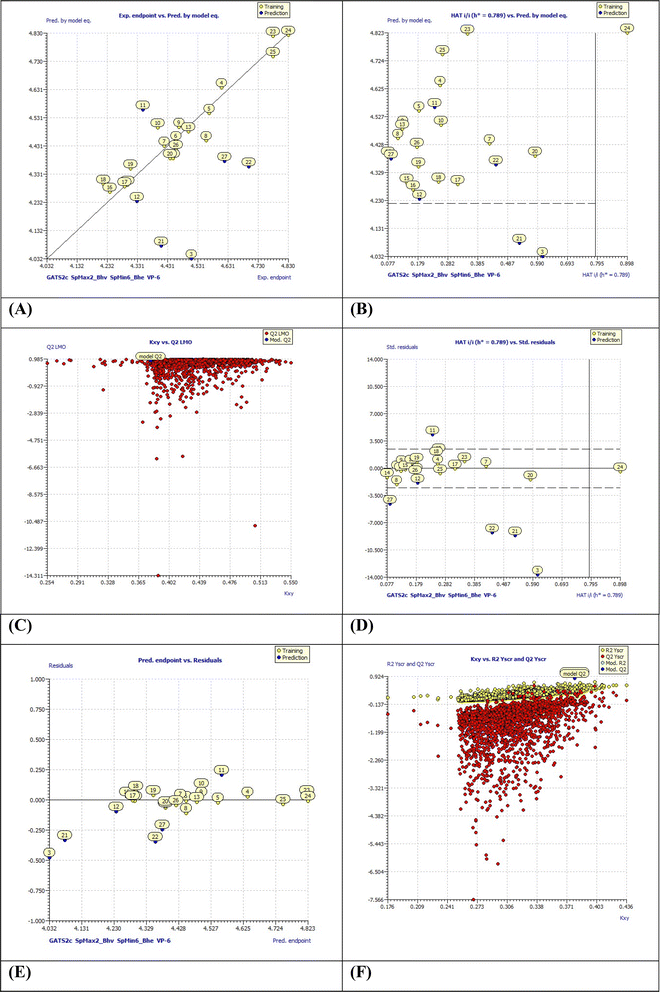 |
| | Fig. 6 (A) Experimental endpoints vs. predicted values by model equation-1; (B) HAT i/h vs. pred. by model equation (Insubria plot); (C) LMO plot (Leave Many Out); (D) William's plot for applicability domain (the vertical solid line represents h* = 0.750 and horizontal dashed lines represent the upper and lower boundaries for applicability domain); (E) predicted endpoints vs. residual values and (F) Y-scramble plot. | |
The QSAR model-1, 4 variable model was derived from the dataset splitting of 70![[thin space (1/6-em)]](https://www.rsc.org/images/entities/char_2009.gif) :30 ratio Fig. 7, wherein training set consist of 19 compounds and 6 were in test set. The molecular descriptor, ‘GATS2c’ is a ‘Geary autocorrelation – lag 2/weighted by charges’ and considered in a class of ‘auto correlation descriptor’.
:30 ratio Fig. 7, wherein training set consist of 19 compounds and 6 were in test set. The molecular descriptor, ‘GATS2c’ is a ‘Geary autocorrelation – lag 2/weighted by charges’ and considered in a class of ‘auto correlation descriptor’.
 |
| | Fig. 7 QSAR model-1: molecular descriptors ‘GATS2c’, ‘SpMax2_Bhv’, ‘SpMin6_Bhe’, ‘VP-6’ correlation with biological activity. | |
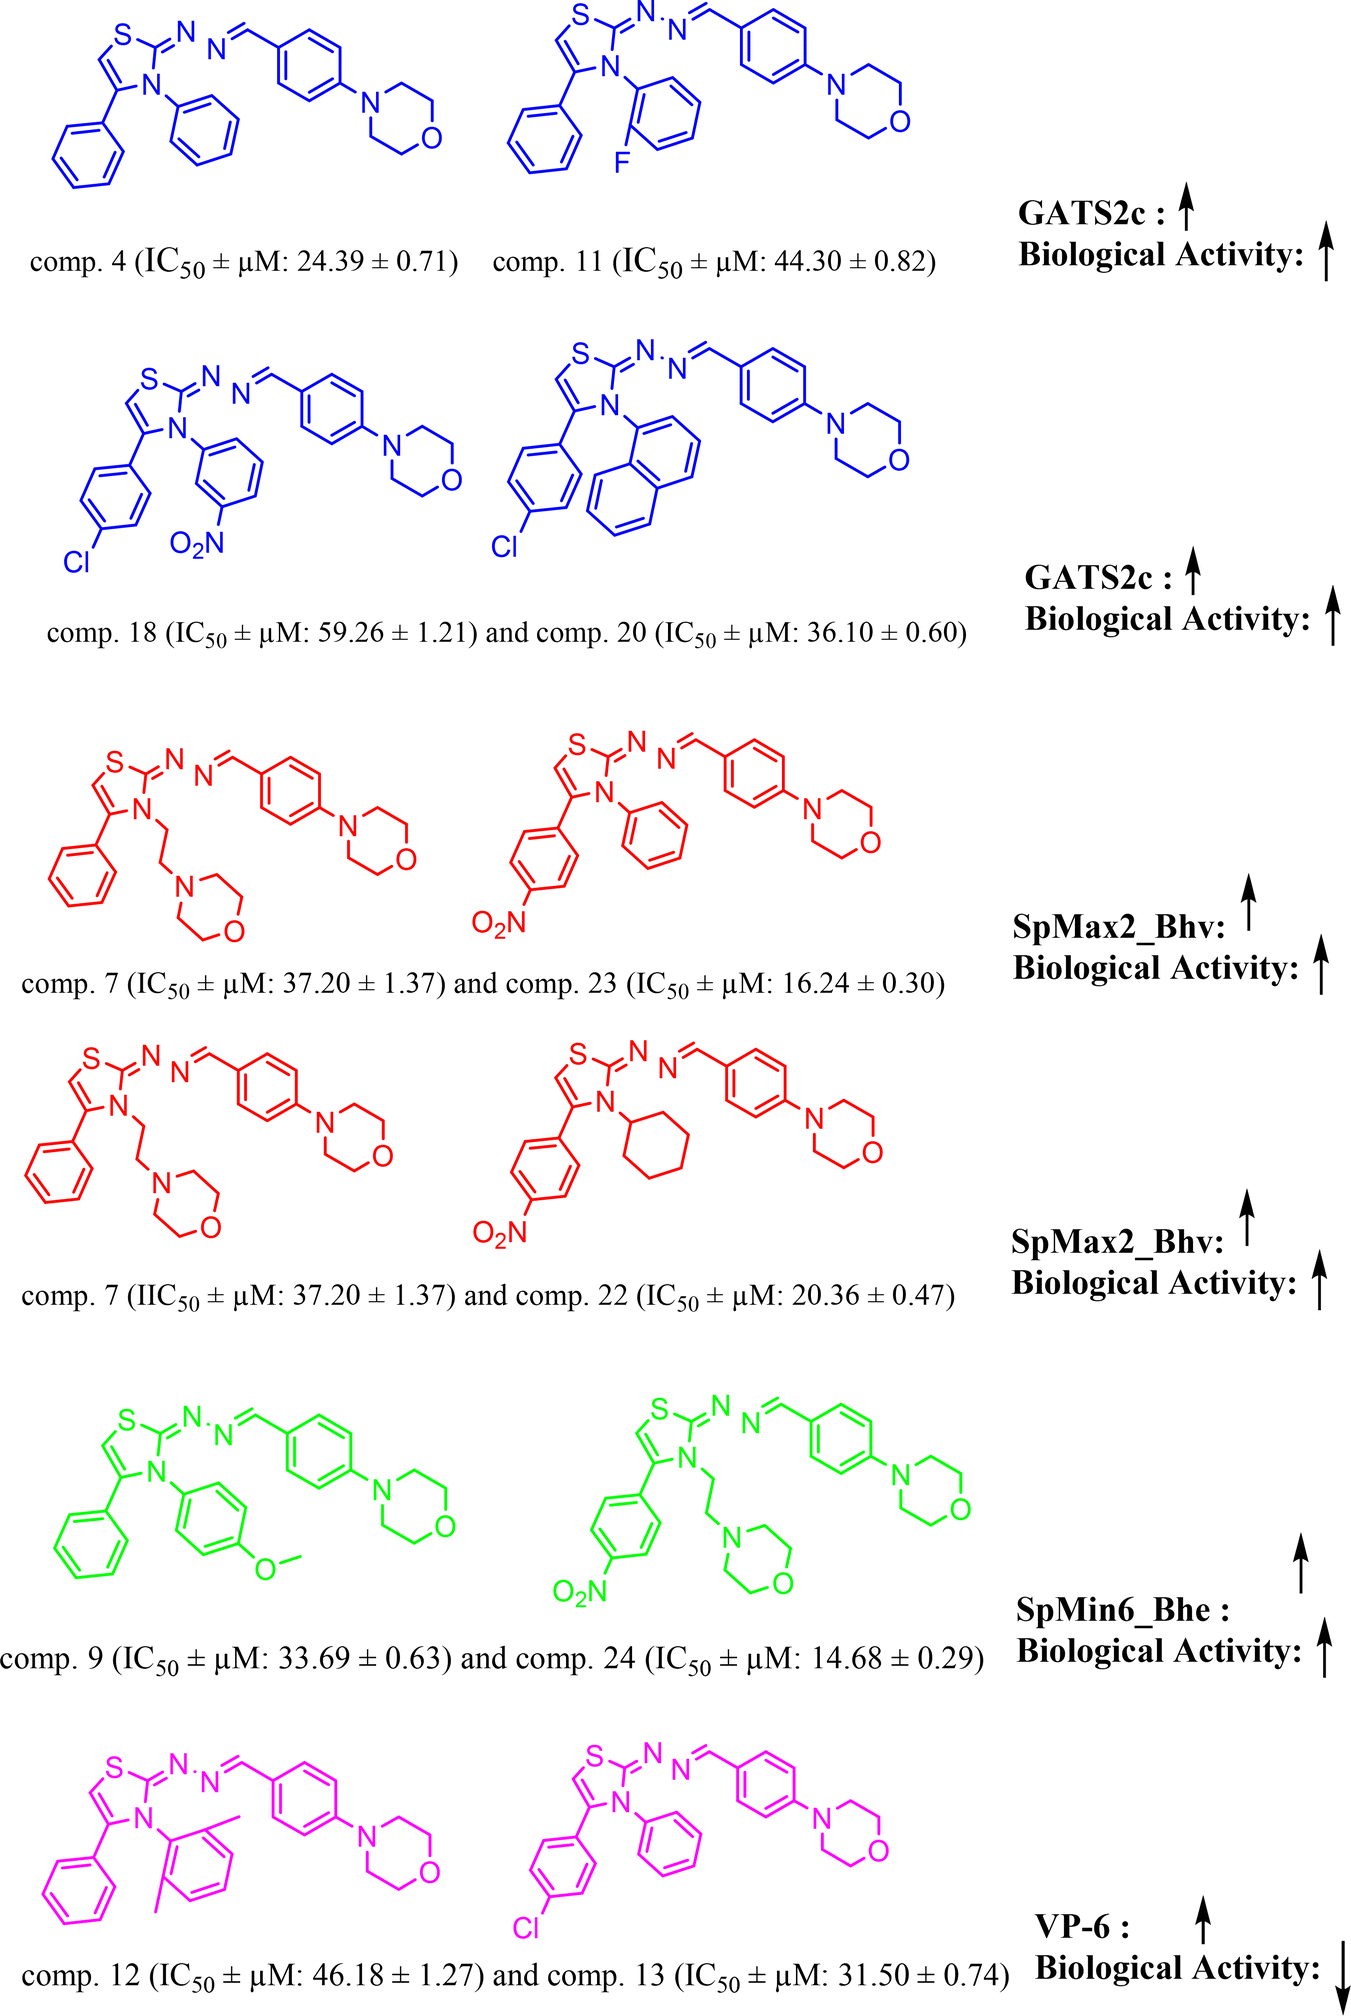
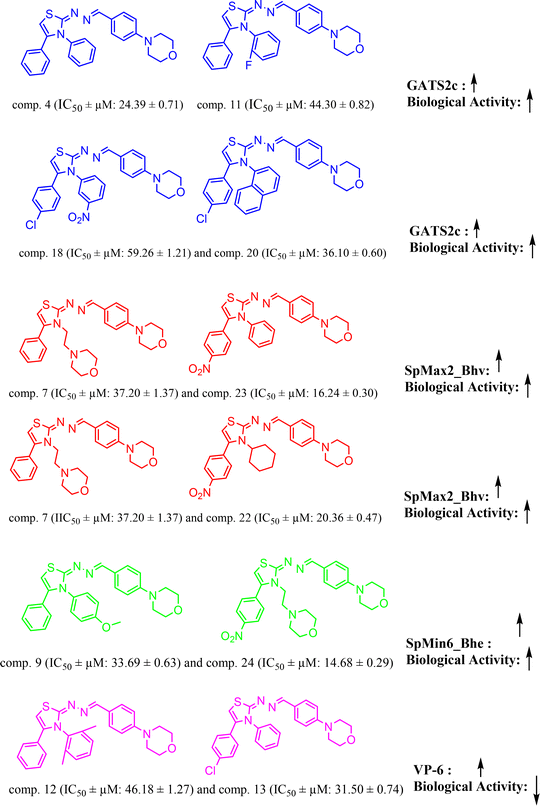
From model-1, it is very evident that this descriptor is positively correlated with the biological activity herein (BA). This trend can be observed with molecules, comp. 4 (IC50 ± μM: 24.39 ± 0.71) (docking score: −4.504 kcal mol; GATS2c: 1.6952658) [increased value of descriptor GATS2c, increased docking affinity among two]; and comp. 11 (IC50 ± μM: 44.30 ± 0.82) (docking score: −4.429 kcal mol; GATS2c: 1.59859344); and comp. 18 (IC50 ± μM: 59.26 ± 1.21) [lower value of GATS2c: 1.56112492 compared to comp. 20, GATS2c: 1.597086807, shows that increased value of GATS2c value tends to increase the docking affinity score of other]; and comp. 20 (IC50 ± μM: 36.10 ± 0.60). The descriptor, ‘SpMax2_Bhv’ and ‘SpMin6_Bhe’ represents ‘largest absolute eigenvalue of Burden modified matrix – n 2/weighted by relative van der Waals volumes’ and ‘smallest absolute eigenvalue of Burden modified matrix – n 6/weighted by relative Sanderson electronegativities’, respectively and both of these are ‘Burden modified eigen values descriptors. From model-1 equation, it is clear that both of these are positively correlated with BA and this trend can be observed with examples, [comp. 7 (IC50 ± μM: 37.20 ± 1.37; SpMax2_Bhv: 3.822; docking score: −5.343 kcal mol−1) and comp. 23 (IC50 ± μM: 16.24 ± 0.30; SpMax2_Bhv: 3.825; docking score: −6.072 kcal mol−1); comp. 7 (IC50 ± μM: 37.20 ± 1.37; SpMax2_Bhv: 3.822; docking score: −5.343 kcal mol−1) and comp. 22 (IC50 ± μM: 20.36 ± 0.47; SpMax2_Bhv: 3.825; docking score: −4.095 kcal mol−1)] and [comp. 9 (IC50 ± μM: 33.69 ± 0.63; SpMin6_Bhe: 1.2657; docking score: −5.185 kcal mol−1) and comp. 24 (IC50 ± μM: 14.68 ± 0.29; SpMin6_Bhe: 1.2891; docking score: −6.102)], respectively. We have noticed that positively correlated descriptor, SpMax2_Bhv would likely to increase BA which can also be correlated with increased binding affinity as seen from docking scores. The final descriptor, ‘VP-6’ is a ‘valence path, order 6’ belonging to class ‘PaDEL ChiPath descriptor’. This descriptor was found to be negatively correlated with BA, meaning decreasing the values of this descriptor tends to decrease in BA. Examples of this case are comp. 3 (IC50 ± μM: 30.20 ± 0.59) and comp. 4 (IC50 ± μM: 24.39 ± 0.71); comp. 12 (IC50 ± μM: 46.18 ± 1.27; VP-6: 2.025124884; docking score: −4.722) and comp. 13 (IC50 ± μM: 31.50 ± 0.74; VP-6: 1.840322559; docking score: −4.751 kcal mol−1). It is very interesting to note that when we compared docking affinities of compounds from Fig. 7, it is very clear that increased values of molecular descriptors ‘GATS2c’, ‘SpMax2_Bhv’, ‘SpMin6_Bhe’ had direct correlation with increased biological activity as well as increased binding affinities. Which suggest the potential contributions of such descriptors involved in binding affinities of said compounds. Similar study can be found from the literature.36,37
2.7 In silico pharmacokinetics studies
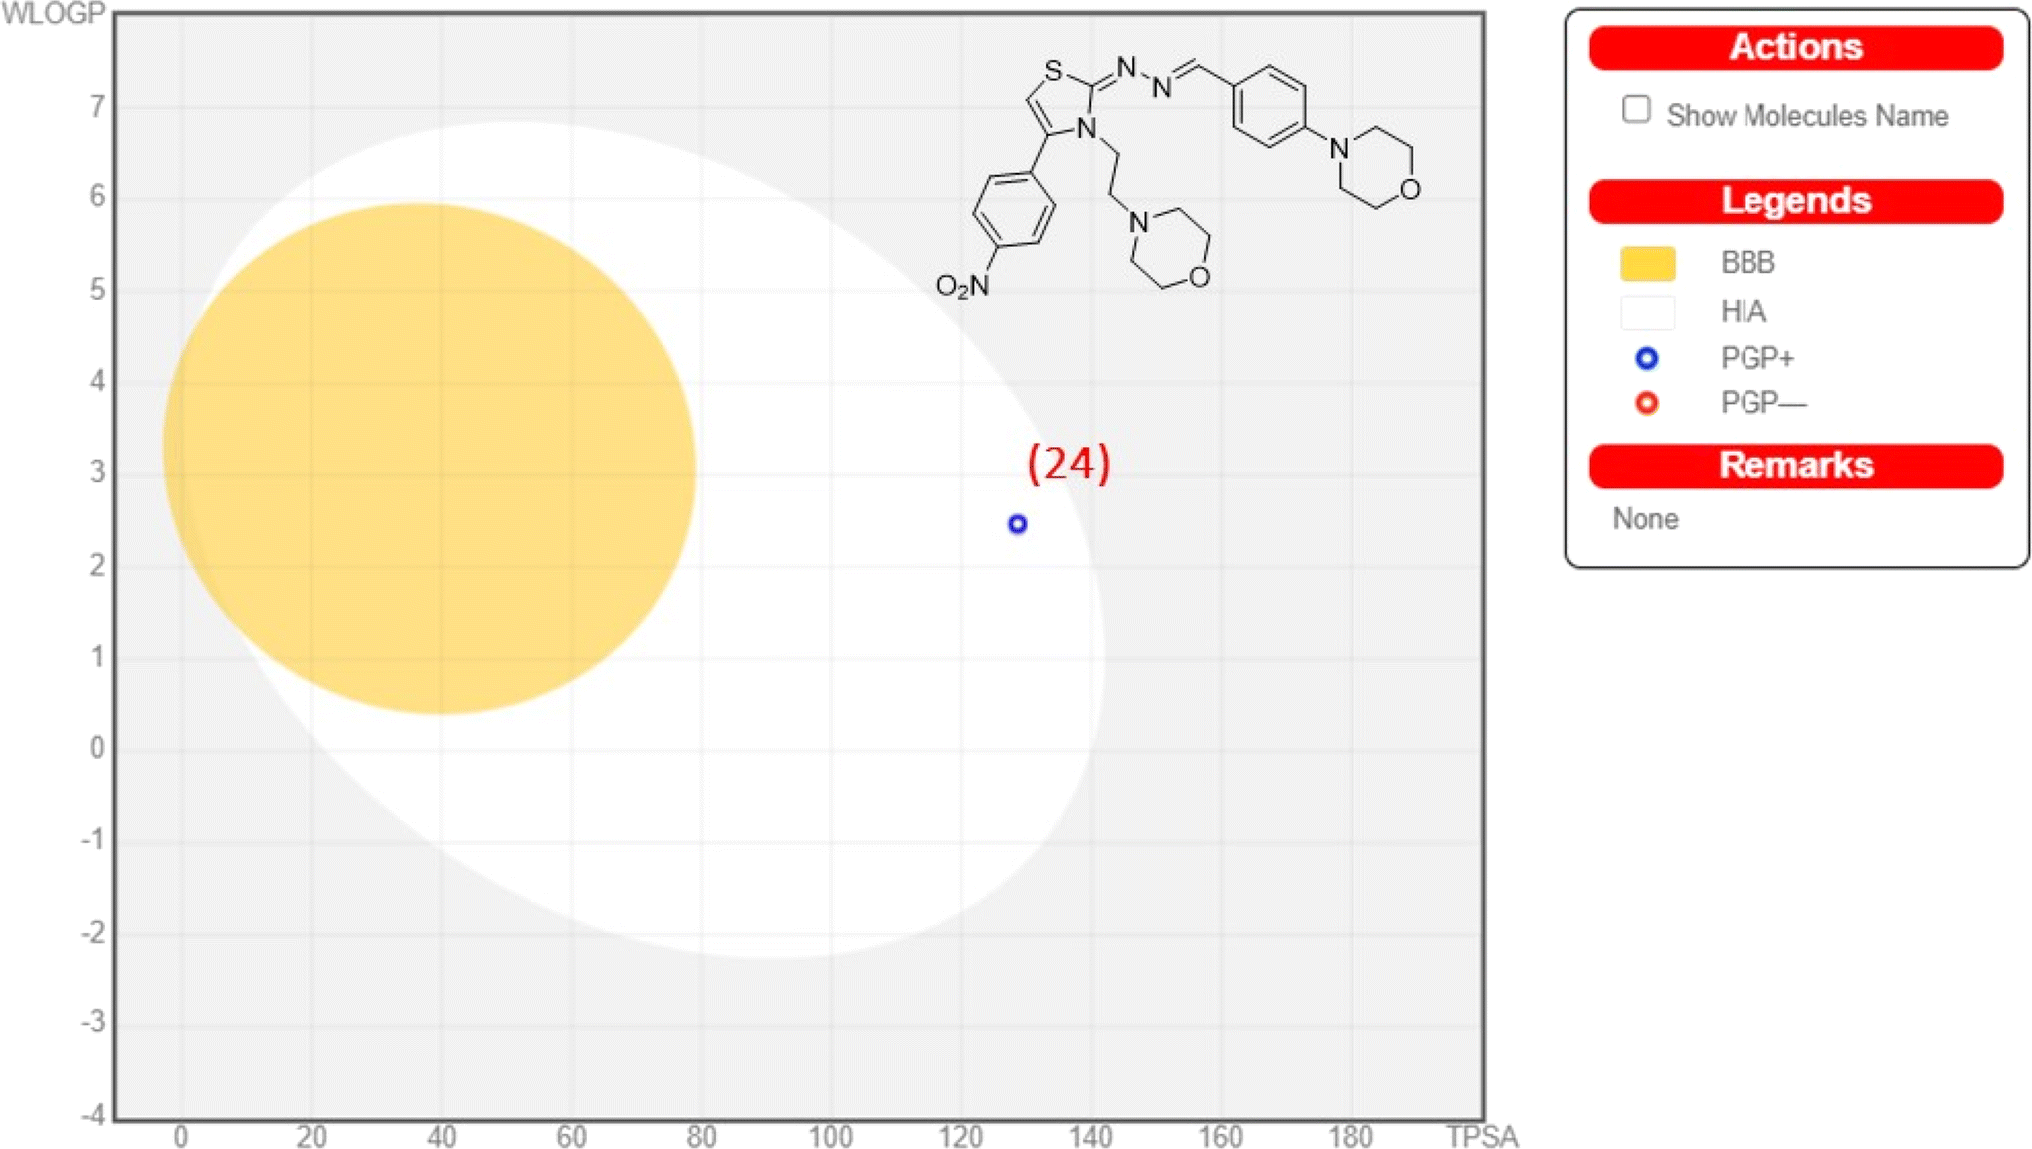
The blood–brain barrier (BBB) plays a crucial role in maintaining brain homeostasis but poses challenges for drug delivery. From the analysis, we found that all of synthesized compounds would likely to cross BBB. However, these compounds were also showed positive human intestinal absorption profiles. While protecting against harmful agents, the BBB limits therapeutic agents' access to the central nervous system (CNS). Caco-2 cells, a human colon epithelial cancer cell line, serve as a model for intestinal drug absorption. When cultured as a monolayer, they mimic paracellular movement and express proteins representing various pathways. p-Glycoprotein, a key player, safeguards the body by removing drugs from the intestines, maintaining BBB integrity, and facilitating drug elimination from kidneys and liver into urine and bile. All compounds under consideration would likely to act as a substrate for p-glycoprotein. The in silico calculations point out the mitochondria as a subcellular location. CYP450 enzymes, primarily found in the liver, play a crucial role in drug metabolism. They facilitate the breakdown of various substances, including drugs and toxins, affecting their efficacy and toxicity. Understanding CYP450 interactions is essential in predicting and optimizing drug metabolism for personalized medicine. All compounds were found to be non-substrates for enzymes CYP450 2C9 and CYP450 2D6. We observed mixed profile for all analogues against CYP450 3A4. Except compounds 8, and 24–26, all were observed as inhibitors. For enzyme CYP450 2C19, all analogues were shown inhibitory nature. Further, all compounds depicted ‘non-carcinogenic’ and ‘non-AMES toxic profiles’ (except 22–24, 8, and 18). The ‘BOILED-egg’ model as depicted in the Fig. 8 shows positive absorption profile for compound 24. Table 2 displays ADMET properties for all compounds.
 |
| | Fig. 8 Analysis of compound 24 for ‘BOILED-egg’ model predictions. | |
3 Conclusion
Morpholine-based thiazole derivatives (3–27) were synthesized with the aim of identifying novel therapeutic agents for glaucoma and other diseases characterized by excessive activity of carbonic anhydrase-II (CA-II). In vitro experimentation revealed that these compounds exhibited varying degrees of inhibition against the enzyme bCA-II, with compounds 22–26 demonstrating particularly potent activity (IC50 range 14–20 μM). Among the compounds, 24 was found to be the most active one with IC50 of 14.68 μM for hCA-II inhibition. Structure–activity relationship analysis highlighted the pivotal role of the nitro group on the phenyl ring at the X position in modulating the inhibitory potency of these compounds. Of the tested compounds, 23 and 25 exhibited remarkable selectivity towards bCA-II. Furthermore, kinetic studies indicated a competitive mode of inhibition within this compound series. Molecular docking simulations suggested that these compounds effectively bind to the zinc ion and various residues within the active site, thereby efficiently inhibiting bCA-II enzyme through precise fitting and binding interactions. Overall, this line of research has the potential to unravel insights that can contribute to the development of novel therapeutic interventions and preventive measures. This study is based on the in vitro and in silico results, however, these finding needs the in vivo results for the better efficacy and safety the compounds can be used for some medical applications after in vivo studies.
4 Experimental
4.1 Chemicals and reagents
Sigma-Aldrich was the source for all of the chemicals utilized in the synthesis of morpholine-based thiazole derivatives. The analytical grade solvents, including ethanol, acetic acid, and n-hexane, were all bought from Merck. Distillation was used to further purify these solvents before they were used. Petroleum ether and ethyl acetate were the solvent systems utilized for Thin Layer Chromatography (TLC). To observe the TLC spots, ultraviolet (UV) lights were employed. For filtration, Whatsman filter paper (No. 1) was utilized.
4.2 Experimental instruments
Using a melting point device, we were able to find the melting point of each of the synthetic substances. Bruker 600 MHz and 151 MHz spectrophotometers were used to acquire the 1H NMR and 13C NMR spectra, respectively using TMS as an internal standard and DMSO-d6 as a solvent. There are different patterns of splitting: s, singlet; d, doublet; dd, double doublets; t, triplet; m, multiplet. Coupling constants were measured in hertz (Hz) and chemical shifts are expressed in parts per million (ppm). On 2.0–5.0 cm aluminum sheets pre-coated with silica gel 60F254 to a width of 0.25 mm (Merck), the TLC was used to monitor the reactions. Iodine vapours or ultraviolet light (254–366 nm) were used to visualize the chromatograms.
4.3 General procedure for the synthesis of morphline derived thiazoles (3–27)
A binary mixture of α-bromoketones and thiosemicarbazide was dissolved in a 100 mL round bottom flask in ethanol with the addition of acetic acid. The reaction mixture was stirred using a magnetic stirrer at a rate of 40 revolutions per minute overnight under reflux conditions. The final products generation and reaction progress were observed using TLC. The resulting compounds precipitated at the bottom of the flask. The reaction mixture was cooled, filtered, washed with ethanol, and the reaction product was recrystallized using the appropriate solvent.
4.3.1 4-{4-[(E)-{[(E)-3-cyclohexyl-4-phenylthiazol-2(3H)-ylidene]hydrazone}methyl]phenyl} morpholine (3). Yield: 90%, M.P: 251–253 °C, colour: dark green, IR νmax (cm−1): 1620 (C![[double bond, length as m-dash]](https://www.rsc.org/images/entities/char_e001.gif) C), 1540 (CN), 1250 (C–N), 1110 (C–S). δH (600 MHz, DMSO-d6) 8.35 (1H, s), 7.61 (2H, d, J = 8.4 Hz), 7.51 (3H, d, J = 4.8 Hz), 7.43 (2H, d, J = 5.7 Hz), 7.04 (2H, d, J = 8.6 Hz), 6.48 (1H, s), 3.22 (5H, s), 2.49 (2H, s), 2.40–2.28 (2H, m), 1.70 (5H, d, J = 10.8 Hz), 1.49 (1H, d, J = 8.1 Hz), 1.12–0.89 (4H, m); 13C NMR (151 MHz, DMSO) δ 165.28, 151.49, 139.43, 131.41, 130.19, 129.99, 129.57, 129.27, 129.09, 128.84, 128.31, 114.90, 65.86, 56.06, 47.96, 28.31, 25.54, 24.46, 18.56. Q-TOF-MS 447.2461; anal. calcd for [C26H30N4OS]; C, 69.92; H, 6.77; N, 12.55; found; C, 70.06; H, 6.88; N, 12.71.
C), 1540 (CN), 1250 (C–N), 1110 (C–S). δH (600 MHz, DMSO-d6) 8.35 (1H, s), 7.61 (2H, d, J = 8.4 Hz), 7.51 (3H, d, J = 4.8 Hz), 7.43 (2H, d, J = 5.7 Hz), 7.04 (2H, d, J = 8.6 Hz), 6.48 (1H, s), 3.22 (5H, s), 2.49 (2H, s), 2.40–2.28 (2H, m), 1.70 (5H, d, J = 10.8 Hz), 1.49 (1H, d, J = 8.1 Hz), 1.12–0.89 (4H, m); 13C NMR (151 MHz, DMSO) δ 165.28, 151.49, 139.43, 131.41, 130.19, 129.99, 129.57, 129.27, 129.09, 128.84, 128.31, 114.90, 65.86, 56.06, 47.96, 28.31, 25.54, 24.46, 18.56. Q-TOF-MS 447.2461; anal. calcd for [C26H30N4OS]; C, 69.92; H, 6.77; N, 12.55; found; C, 70.06; H, 6.88; N, 12.71.
4.3.2 4-{4-[(E)-{[(E)-3,4-diphenylthiazol-2(3H)-ylidene]hydrazone}methyl] phenyl} morpholine (4). Yield: 88%, M.P: 258–260 °C, colour: green, IR νmax (cm−1): 1450 (CC), 1360 (CN), 1210 (C–N), 1120 (C–S). δH (600 MHz, DMSO-d6) 8.03 (1H, s), 7.53 (2H, d, J = 8.3 Hz), 7.34 (2H, t, J = 7.5 Hz), 7.28 (1H, d, J = 7.6 Hz), 7.23 (5H, dd, J = 12.8, 7.2 Hz), 7.15 (2H, d, J = 7.0 Hz), 6.95 (2H, d, J = 8.4v Hz), 6.57 (1H, s), 3.75–3.68 (4H, m), 3.16 (4H, d, J = 6.0 Hz); 13C NMR (151 MHz, DMSO) δ 168.48, 151.97, 151.83, 139.56, 137.74, 130.84, 128.92, 128.76, 128.39, 128.26, 128.19, 127.80, 125.58, 114.48, 101.36, 65.98, 47.67. Q-TOF-MS 441.2016; anal. calcd for [C26H24N4OS]; C, 70.88; H, 5.49; N, 12.72; found; C, 70.74; H, 5.67; N, 12.83.
4.3.3 4-{4-[(E)-{[(E)-3-benzyl-4-phenylthiazol-2(3H)-ylidene] hydrazone}methyl]phenyl} morpholine (5). Yield: 94%, M.P: 161–163 °C, colour: green, IR νmax (cm−1): 1600 (CC), 1520 (CN), 1370 (C–N), 1220 (C–S). δH (600 MHz, DMSO-d6) 8.12 (1H, s), 7.55 (2H, d, J = 8.4 Hz), 7.46 (2H, d, J = 8.2 Hz), 7.33 (4H, t, J = 8.7 Hz), 7.02 (2H, d, J = 8.2 Hz), 6.96 (2H, d, J = 8.4 Hz), 6.45 (1H, s), 4.99 (2H, s), 3.72 (4H, t, J = 4.8 Hz), 3.17 (4H, t, J = 4.9 Hz); 13C NMR (151 MHz, DMSO) δ 167.79, 151.89, 151.43, 138.71, 135.99, 134.06, 131.74, 130.53, 129.34, 128.83, 128.55, 128.41, 128.25, 128.14, 125.58, 114.46, 101.14, 66.00, 47.64. Q-TOF-MS 455.2767; anal. calcd for [C27H26N4OS]; C, 71.34; H, 5.77; N, 12.32; found; C, 71.23; H, 5.88; N, 12.49.
4.3.4 4-{4-[(E)-{[(E)-3-phenethyl-4-phenylthiazol-2(3H)-ylidene]hydrazone} methyl]phenyl} morpholine (6). Yield: 89%, M.P: 183–185 °C, colour: grey, IR νmax (cm−1): 1630 (CC), 1510 (CN), 1440 (C–N), 1105 (C–S). δH (600 MHz, DMSO-d6) 8.26 (1H, s), 7.60 (2H, d, J = 8.5 Hz), 7.47–7.40 (3H, m), 7.25–7.14 (5H, m), 6.98 (2H, d, J = 8.6 Hz), 6.94–6.88 (2H, m), 6.22 (1H, s), 3.90 (2H, t, J = 7.5 Hz), 3.74 (4H, t, J = 4.8 Hz), 3.16 (4H, s), 2.88 (2H, t, J = 7.5 Hz); 13C NMR (151 MHz, DMSO) δ 167.43, 151.82, 150.87, 140.18, 138.13, 130.79, 129.13, 128.90, 128.64, 128.55, 128.47, 128.07, 126.41, 125.90, 114.54, 99.45, 66.02, 47.72, 46.65, 32.95. Q-TOF-MS 469.2052; anal. calcd for [C28H28N4OS]; C, 71.77; H, 6.02; N, 11.96; found; C, 71.87; H, 6.15; N, 12.13.
4.3.5 4-{2-[(E)-2-{[(E)-4-morpholinobenzylidene]hydrazineylidene}-4-phenylthiazol-3(2H)-yl]ethyl}morpholine (7). Yield: 91%, M.P: 257–259 °C, colour: light green, IR νmax (cm−1): 1620 (CC), 1505 (CN), 1440 (C–N), 1180 (C–S). δH (600 MHz, DMSO-d6) 8.24 (1H, s), 7.60 (2H, d, J = 8.4 Hz), 7.52 (6H, q, J = 4.8, 3.6 Hz), 6.99 (2H, d, J = 8.5 Hz), 6.41 (1H, s), 4.05 (2H, t, J = 6.9 Hz), 3.79 (4H, s), 3.73 (6H, t, J = 4.8 Hz), 3.28 (4H, s), 3.19 (6H, t, J = 4.9 Hz); 13C NMR (151 MHz, DMSO) δ 167.81, 152.03, 151.84, 139.53, 130.09, 129.62, 129.12, 128.23, 125.41, 114.51, 100.56, 66.00, 63.35, 53.21, 51.56, 47.63. Q-TOF-MS 478.2348; anal. calcd for [C26H31N5O2S]; C, 65.38; H, 6.54; N, 14.66; found; C, 65.52; H, 6.44; N, 14.79.
4.3.6 4-{4-[(E)-{[(E)-3-(3-nitrophenyl)-4-phenylthiazol-2(3H)-ylidene] hydrazone}methyl] phenyl} morpholine (8). Yield: 92%, M.P: 197–199 °C, colour: brown, IR νmax (cm−1): 1600 (CC), 1510 (CN), 1380 (C–N), 1180 (C–S). δH (600 MHz, DMSO-d6) 8.22 (1H, t, J = 2.2 Hz), 8.13 (1H, dd, J = 8.3, 2.5 Hz), 8.07 (1H, s), 7.68–7.64 (1H, m Hz), 7.61 (1H, t, J = 8.1 Hz), 7.56 (2H, d, J = 8.4 Hz), 7.25 (3H, q, J = 3.7, 3.2 Hz), 7.20 (2H, dd, J = 6.7, 3.0 Hz), 6.95 (2H, d, J = 8.4 Hz), 6.66 (1H, s), 3.72 (4H, t, J = 4.8 Hz), 3.17 (4H, t, J = 4.9 Hz); 13C NMR (151 MHz, DMSO) δ 167.76, 152.78, 152.12, 147.72, 138.78, 138.54, 135.28, 130.28, 130.18, 128.68, 128.49, 128.45, 128.36, 125.27, 123.88, 122.53, 114.44, 102.35, 65.97, 47.61. Q-TOF-MS 486.2693; anal. calcd for [C26H23N5O3S]; C, 64.31; H, 4.77; N, 14.42; found; C, 64.20; H, 4.94; N, 14.52.
4.3.7 4-{4-[(E)-{[(E)-3-(4-methoxyphenyl)-4-phenylthiazol-2(3H)-ylidene] hydrazone} methyl] phenyl}morpholine (9). Yield: 87%, M.P: 180–182 °C, colour: light green, IR νmax (cm−1): 1630 (CC), 1540 (CN), 1250 (C–N), 1150 (C–S). δH (600 MHz, DMSO-d6) 8.10 (1H, d, J = 6.0 Hz), 7.55 (2H, t, J = 8.2 Hz), 7.28 (6H, ddt, J = 13.7, 9.8, 7.5 Hz), 7.22–7.16 (2H, m), 7.00–6.93 (3H, m), 6.82 (1H, d, J = 8.9 Hz), 3.75–3.71 (7H, m), 3.19 (4H, dt, J = 10.2, 4.8 Hz); 13C NMR (151 MHz, DMSO) δ 168.83, 166.44, 159.29, 158.58, 152.59, 152.36, 152.10, 151.83, 138.68, 130.19, 130.06, 129.93, 129.15, 128.91, 128.78, 128.55, 128.40, 128.32, 128.26, 114.60, 114.49, 114.05, 65.95, 55.44, 47.65. Q-TOF-MS 471.2555; anal. calcd for [C27H26N4O2S]; C, 68.91; H, 5.57; N, 11.91; found; C, 69.05; H, 5.43; N, 12.02.
4.3.8 4-{4-[(E)-{[(E)-3-(naphthalen-1-yl)-4-phenylthiazol-2(3H)-ylidene] hydrazone} methyl] phenyl} morpholine (10). Yield: 89%, M.P: 150–152 °C, colour: green, IR νmax (cm−1): 1600 (CC), 1520 (CN), 1210 (C–N), 1105 (C–S). δH (600 MHz, DMSO-d6) 7.94 (2H, dd, J = 13.2, 8.1 Hz), 7.85 (1H, s), 7.63 (1H, d, J = 8.3 Hz), 7.60–7.54 (2H, m), 7.52 (2H, dd, J = 7.9, 4.1 Hz), 7.48 (2H, d, J = 8.4 Hz), 7.15–7.10 (3H, m), 7.07 (2H, t, J = 7.4 Hz), 6.92 (2H, d, J = 8.4 Hz), 6.70 (1H, s), 3.71 (4H, t, J = 4.7 Hz), 3.15 (4H, t, J = 4.9 Hz); 13C NMR (151 MHz, DMSO) δ 168.77, 151.92, 151.87, 140.41, 134.23, 133.91, 130.67, 130.26, 129.13, 128.56, 128.43, 128.31, 128.13, 128.07, 127.88, 127.43, 126.52, 125.67, 125.45, 122.52, 114.41, 101.11, 65.98, 47.62. Q-TOF-MS 491.2638; anal. calcd for [C30H26N4OS]; C, 73.44; H, 5.34; N, 11.42; found; C, 73.32; H, 5.45; N, 11.57.
4.3.9 4-{4-[(E)-{[(E)-3-(2-fluorophenyl)-4-phenylthiazol-2(3H)-ylidene] hydrazone} methyl] phenyl} morpholine (11). Yield: 93%, M.P: 245–247 °C, colour: green, IR νmax (cm−1): 1620 (CC), 1510 (CN), 1420 (C–N), 1250 (C–S). δH (600 MHz, DMSO-d6) 8.04 (1H, s), 7.54 (2H, d, J = 8.6 Hz), 7.44 (1H, td, J = 7.8, 1.8 Hz), 7.38 (1H, ddt, J = 7.3, 4.9, 2.1 Hz), 7.25 (4H, qd, J = 9.7, 8.7, 6.2 Hz), 7.19 (3H, qd, J = 7.9, 1.8 Hz), 6.95 (2H, d, J = 8.6 Hz), 6.60 (1H, s), 3.74–3.68 (4H, m), 3.17 (4H, t, J = 4.8 Hz); 13C NMR (151 MHz, DMSO) δ 167.63, 158.33, 156.67, 152.46, 152.04, 139.26, 131.50, 130.84, 130.25, 128.76, 128.38, 128.27, 127.91, 125.41, 125.29, 124.96, 116.48, 116.35, 114.44, 101.00, 65.98, 47.63. Q-TOF-MS 459.2433; anal. calcd for [C26H23FN4OS]; C, 68.10; H, 5.06; N, 12.22; found; C, 68.23; H, 5.16; N, 12.37.
4.3.10 4-{4-[(E)-{[(E)-3-(2,6-dimethylphenyl)-4-phenylthiazol-2(3H)-ylidene]hydrazone} methyl]phenyl}morpholine (12). Yield: 90%, M.P: 185–187 °C, colour: brown, IR νmax (cm−1): 1600 (CC), 1510 (CN), 1430 (C–N), 1250 (C–S). δH (600 MHz, DMSO-d6) 8.08 (1H, s), 7.57–7.52 (2H, m), 7.29–7.19 (4H, m), 7.16–7.09 (4H, m), 6.98 (2H, d, J = 8.7 Hz), 6.86 (1H, s), 3.75–3.71 (4H, m), 3.19 (4H, dd, J = 6.0, 3.7 Hz), 2.08 (6H, s); 13C NMR (151 MHz, DMSO) δ 166.88, 152.00, 151.88, 139.70, 136.13, 129.84, 129.33, 129.02, 128.71, 128.40, 128.36, 127.58, 127.38, 114.49, 113.97, 113.25, 65.94, 47.60, 17.68. Q-TOF-MS 469.2735; anal. calcd for [C28H28N4OS]; C, 71.77; H, 6.02; N, 11.96; found; C, 71.65; H, 6.14; N, 12.07.
4.3.11 4-{4-[(E)-{[(E)-4-(4-chlorophenyl)-3-phenylthiazol-2(3H)-ylidene]hydrazone}methyl] phenyl}morpholine (13). Yield: 89%, M.P: 274–276 °C, colour: green, IR νmax (cm−1): 1620 (CC), 1500 (CN), 1190 (C–N), 1190 (C–S). δH (600 MHz, DMSO-d6) 8.07 (1H, d, J = 7.4 Hz), 7.54 (2H, d, J = 8.4 Hz), 7.41–7.33 (3H, m), 7.29 (5H, dq, J = 13.0, 6.4, 5.7 Hz), 7.17 (1H, d, J = 8.3 Hz), 6.96 (2H, d, J = 8.3 Hz), 6.73 (1H, s), 3.72 (4H, t, J = 4.8 Hz), 3.18 (4H, t, J = 4.8 Hz); 13C NMR (151 MHz, DMSO) δ 168.30, 165.81, 152.99, 152.07, 137.42, 133.93, 133.26, 132.04, 130.13, 128.41, 128.35, 125.07, 114.49, 114.44, 89.58, 65.95, 47.64. Q-TOF-MS 475.2837; anal. calcd for [C26H23ClN4OS]; C, 65.74; H, 4.88; N, 11.80; found; C, 65.60; H, 5.04; N, 11.95.
4.3.12 4-{4-[(E)-{[(E)-3-benzyl-4-(4-chlorophenyl)thiazol-2(3H)-ylidene]hydrazone}methyl] phenyl}morpholine (14). Yield: 87%, M.P: 231–233 °C, colour: green, IR νmax (cm−1): 1630 (CC), 1510 (CN), 1250 (C–N), 1140 (C–S). δH (600 MHz, DMSO-d6) 8.12 (1H, s), 7.55 (2H, d, J = 8.5 Hz), 7.45 (2H, d, J = 8.1 Hz), 7.35 (2H, d, J = 8.2 Hz), 7.25 (2H, t, J = 7.5 Hz), 7.19 (1H, t, J = 7.3 Hz), 6.97 (4H, dd, J = 16.3, 8.1 Hz), 6.44 (1H, s), 5.02 (2H, s), 3.73 (4H, t, J = 4.8 Hz), 3.17 (4H, t, J = 4.9 Hz); 13C NMR (151 MHz, DMSO) δ 167.97, 151.86, 151.23, 138.90, 136.96, 133.97, 130.53, 129.48, 128.75, 128.53, 128.10, 127.17, 126.29, 125.65, 114.47, 101.03, 66.00, 47.65. Q-TOF-MS 489.2493; anal. calcd for [C27H25ClN4OS]; C, 66.31; H, 5.15; N, 11.46; found; C, 66.18; H, 5.30; N, 11.60.
4.3.13 4-{4-[(E)-{[(E)-4-(4-chlorophenyl)-3-phenethylthiazol-2(3H)-ylidene]hydrazone}methyl] phenyl}morpholine (15). Yield: 88%, M.P: 248–250 °C, colour: off-white, IR νmax (cm−1): 1650 (CC), 1520 (CN), 1230 (C–N), 1200 (C–S). δH (600 MHz, DMSO-d6) 8.29 (1H, s), 7.60 (2H, d, J = 8.2 Hz), 7.46 (2H, d, J = 8.0 Hz), 7.21–7.14 (5H, m), 6.99 (2H, d, J = 8.7 Hz), 6.91–6.85 (2H, m), 6.50 (1H, s), 4.02 (2H, t, J = 7.1 Hz), 3.72 (4H, d, J = 5.0 Hz), 3.19 (4H, q, J = 7.3, 6.1 Hz), 2.84 (2H, d, J = 7.1 Hz); 13C NMR (151 MHz, DMSO) δ 167.42, 152.24, 151.27, 137.83, 131.89, 130.95, 128.89, 128.76, 128.62, 128.55, 128.51, 128.41, 126.70, 126.61, 114.51, 113.22, 65.92, 47.53, 46.59, 32.68. Q-TOF-MS 503.2527; anal. calcd for [C28H27ClN4OS]; C, 63.50; H, 5.92; N, 16.46; found; C, 63.63; H, 6.04; N, 16.60.
4.3.14 4-{4-[(E)-{[(E)-4-(4-chlorophenyl)-3-(4-methylbenzyl)thiazol-2(3H)-ylidene]hydrazone} methyl]phenyl}morpholine (16). Yield: 91%, M.P: 223–225 °C, colour: yellow, IR νmax (cm−1): 1620 (CC), 1515 (CN), 1220 (C–N), 1070 (C–S). δH (600 MHz, DMSO-d6) 8.12 (1H, s), 7.55 (2H, d, J = 8.4 Hz), 7.46 (2H, d, J = 8.1 Hz), 7.35 (2H, d, J = 8.1 Hz), 7.05 (2H, d, J = 7.7 Hz), 6.96 (2H, d, J = 8.4 Hz), 6.87 (2H, d, J = 7.7 Hz), 6.43 (1H, s), 4.97 (2H, s), 3.73 (4H, t, J = 4.9 Hz), 3.17 (4H, t, J = 4.9 Hz), 2.22 (3H, s); 13C NMR (151 MHz, DMSO) δ 167.96, 151.85, 151.16, 138.94, 136.27, 133.96, 133.93, 130.51, 129.53, 129.08, 128.76, 128.09, 126.29, 125.68, 114.47, 100.98, 66.00, 47.86, 47.66, 20.66. Q-TOF-MS 503.2554; anal. calcd for [C28H27ClN4OS]; C, 63.50; H, 5.92; N, 16.46; found; C, 63.66; H, 6.06; N, 16.32.
4.3.15 4-{2-[(E)-2-{[(E)-4-morpholinobenzylidene]hydrazineylidene}-4-(4-chlorophenyl) thiazol-3(2H)-yl]ethyl}morpholine (17). Yield: 90%, M.P: 228–230 °C, colour: light yellow, IR νmax (cm−1): 1660 (CC), 1500 (CN), 1220 (C–N), 1180 (C–S). δH (600 MHz, DMSO-d6) 8.24 (1H, s), 7.59 (4H, dd, J = 8.5, 4.5 Hz), 7.54 (2H, d, J = 8.2 Hz), 6.98 (2H, d, J = 8.6 Hz), 6.44 (1H, s), 4.03 (2H, t, J = 7.0 Hz), 3.80 (2H, s), 3.73 (4H, t, J = 4.9 Hz), 3.50–3.25 (8H, m), 3.18 (4H, t, J = 4.9 Hz); 13C NMR (151 MHz, DMSO) δ 167.62, 152.04, 151.95, 138.35, 134.32, 130.96, 129.14, 128.93, 128.24, 125.38, 114.50, 101.19, 66.00, 63.41, 53.08, 51.63, 47.62. Q-TOF-MS 512.1877; anal. calcd for [C26H30ClN5O2S]; C, 60.99; H, 5.91; N, 13.68; found; C, 61.12; H, 5.80; N, 13.82.
4.3.16 4-{4-[(E)-{[(E)-4-(4-chlorophenyl)-3-(3-nitrophenyl)thiazol-2(3H)-ylidene]hydrazone} methyl]phenyl}morpholine (18). Yield: 88%, M.P: 227–229 °C, colour: orange red, IR νmax (cm−1): 1670 (CC), 1510 (CN), 1350 (C–N), 1110 (C–S). δH (600 MHz, DMSO-d6) 8.28 (1H, t, J = 2.1 Hz), 8.15 (1H, dt, J = 7.2, 2.2 Hz), 8.07 (1H, s), 7.65–7.61 (2H, m), 7.57–7.53 (2H, m), 7.35–7.30 (2H, m), 7.25–7.20 (2H, m), 6.98–6.93 (2H, m), 6.72 (1H, s), 3.72 (4H, t, J = 4.9 Hz), 3.20–3.14 (4H, m); 13C NMR (151 MHz, DMSO) δ 167.60, 152.93, 152.14, 147.80, 138.35, 137.56, 135.19, 133.33, 130.27, 130.22, 129.16, 128.56, 128.37, 125.23, 124.00, 122.66, 114.42, 103.08, 65.97, 47.60. Q-TOF-MS 520.1834; anal. calcd for [C26H22ClN5O3S]; C, 60.05; H, 4.26; N, 13.47; found; C, 60.16; H, 4.37; N, 13.34.
4.3.17 4-{4-[(E)-{[(E)-4-(4-chlorophenyl)-3-(4-methoxyphenyl)thiazol-2(3H)-ylidene] hydrazone}methyl]phenyl}morpholine (19). Yield: 90%, M.P: 259–261 °C, colour: light green, IR νmax (cm−1): 1630 (CC), 1500 (CN), 1250 (C–N), 1100 (C–S). δH (600 MHz, DMSO-d6) 8.02 (1H, s), 7.56–7.50 (2H, m), 7.34–7.30 (2H, m), 7.21–7.15 (4H, m), 6.95 (2H, d, J = 8.4 Hz), 6.93–6.88 (2H, m), 6.60 (1H, s), 3.75–3.69 (7H, m), 3.17 (4H, t, J = 4.9 Hz); 13C NMR (151 MHz, DMSO) δ 168.61, 158.45, 151.96, 151.74, 138.56, 133.05, 130.17, 130.04, 129.92, 129.78, 128.34, 128.16, 127.49, 125.61, 114.48, 114.22, 114.17, 113.23, 101.58, 65.99, 55.33, 47.68. Q-TOF-MS 505.1711; anal. calcd for [C27H25ClN4O2S]; C, 64.21; H, 4.99; N, 11.09; found; C, 64.34; H, 5.13; N, 10.95.
4.3.18 4-{4-[(E)-{[(E)-4-(4-chlorophenyl)-3-(naphthalen-1-yl)thiazol-2(3H)-ylidene]hydrazone} methyl]phenyl}morpholine (20). Yield: 92%, M.P: 227–229 °C, colour: light yellow, IR νmax (cm−1): 1620 (CC), 1540 (CN), 1250 (C–N), 1100 (C–S). δH (600 MHz, DMSO-d6) 7.96 (2H, t, J = 8.5 Hz), 7.85 (1H, s), 7.61 (2H, t, J = 7.0 Hz), 7.57–7.50 (3H, m), 7.47 (2H, d, J = 8.5 Hz), 7.14 (4H, s), 6.92 (2H, d, J = 8.5 Hz), 6.75 (1H, s), 3.71 (4H, t, J = 4.9 Hz), 3.15 (4H, t, J = 4.9 Hz); 13C NMR (151 MHz, DMSO) δ 168.57, 152.04, 151.94, 139.11, 134.03, 133.92, 133.27, 130.16, 129.62, 129.54, 129.23, 128.48, 128.37, 128.18, 128.15, 127.52, 126.59, 125.70, 125.42, 122.42, 114.40, 101.79, 65.98, 47.60. Q-TOF-MS 525.1814; anal. calcd for [C30H25ClN4OS]; C, 68.63; H, 4.80; N, 10.67; found; C, 68.75; H, 4.67; N, 10.80.
4.3.19 4-{4-[(E)-{[(E)-4-(4-chlorophenyl)-3-(2,6-dimethylphenyl)thiazol-2(3H)-ylidene]hydrazone}methyl]phenyl}morpholine (21). Yield: 86%, M.P: 206–208 °C, colour: yellow, IR νmax (cm−1): 1650 (CC), 1530 (CN), 1250 (C–N), 1200 (C–S). δH (600 MHz, DMSO-d6) 8.02 (1H, s), 7.53 (2H, d, J = 8.6 Hz), 7.29 (2H, d, J = 8.5 Hz), 7.20 (1H, t, J = 7.5 Hz), 7.11 (4H, t, J = 8.0 Hz), 6.95 (2H, d, J = 8.6 Hz), 6.76 (1H, s), 3.72 (4H, t, J = 4.9 Hz), 3.20–3.13 (4H, m), 2.07 (6H, s); 13C NMR (151 MHz, DMSO) δ 166.58, 151.91, 151.85, 138.13, 136.14, 135.59, 133.48, 129.17, 129.09, 129.03, 128.62, 128.45, 128.20, 125.36, 114.43, 102.21, 65.98, 47.60, 17.74. Q-TOF-MS 503.2363; anal. calcd for [C28H27ClN4OS]; C, 66.85; H, 5.41; N, 11.14; found; C, 66.72; H, 5.54; N, 11.27.
4.3.20 4-{4-[(E)-{[(E)-3-cyclohexyl-4-(4-nitrophenyl)thiazol-2(3H)-ylidene]hydrazone}methyl] phenyl}morpholine (22). Yield: 88%, M.P: 270–272 °C, colour: orange, IR νmax (cm−1): 1650 (CC), 1520 (CN), 1250 (C–N), 1210 (C–S). δH (600 MHz, DMSO-d6) 8.37 (1H, dd, J = 8.4, 5.9 Hz), 8.32 (1H, d, J = 8.6 Hz), 8.23 (1H, d, J = 4.5 Hz), 7.81 (1H, dd, J = 12.5, 8.6 Hz), 7.75 (1H, d, J = 8.5 Hz), 7.69 (1H, d, J = 8.4 Hz), 7.59 (2H, dd, J = 8.9, 2.7 Hz), 6.98 (2H, d, J = 8.6 Hz), 3.73 (4H, q, J = 5.7, 5.2 Hz), 3.29–3.14 (5H, m), 2.58 (1H, m), 2.47–2.39 (1H, m), 1.75–1.45 (4H, m), 1.08–0.96 (4H, m). Q-TOF-MS 492.2994; anal. calcd for [C26H29N5O3S]; C, 63.52; H, 5.95; N, 14.25; found; C, 63.39; H, 6.07; N, 14.36.
4.3.21 4-{4-[(E)-{[(E)-4-(4-nitrophenyl)-3-phenylthiazol-2(3H)-ylidene]hydrazone}methyl] phenyl}morpholine (23). Yield: 89%, M.P: 269–271 °C, colour: orange, IR νmax (cm−1): 1620 (CC), 1510 (CN), 1350 (C–N), 1200 (C–S). δH (600 MHz, DMSO-d6) 8.11 (1H, s), 8.09–8.05 (2H, m), 7.55 (2H, d, J = 8.8 Hz), 7.45–7.37 (4H, m), 7.37–7.31 (3H, m), 7.04–6.94 (3H, m), 4.04–3.67 (4H, m), 3.19 (4H, t, J = 5.0 Hz); 13C NMR (151 MHz, DMSO) δ 168.12, 152.51, 152.08, 146.87, 137.90, 136.93, 136.71, 129.32, 129.28, 128.58, 128.47, 128.41, 125.10, 123.46, 114.53, 105.99, 65.93, 47.66. Q-TOF-MS 486.2490; anal. calcd for [C26H23N5O3S]; C, 64.31; H, 4.77; N, 14.42; found; C, 64.45; H, 4.62; N, 14.59.
4.3.22 4-{2-[(E)-2-{[(E)-4-morpholinobenzylidene]hydrazineylidene}-4-(4-nitrophenyl)thiazol-3(2H)-yl]ethyl}morpholine (24). Yield: 90%, M.P: 251–253 °C, colour: orange, IR νmax (cm−1): 1620 (CC), 1530 (CN), 1380 (C–N), 1200 (C–S). δH (600 MHz, DMSO-d6) 8.35 (2H, d, J = 8.3 Hz), 8.26 (1H, s), 7.81 (2H, d, J = 8.4 Hz), 7.60 (2H, d, J = 8.5 Hz), 6.99 (2H, d, J = 8.5 Hz), 6.66 (1H, s), 4.08 (2H, t, J = 7.3 Hz), 3.87–3.66 (8H, m), 3.58–3.18 (10H, m); 13C NMR (151 MHz, DMSO) δ 167.55, 152.39, 152.12, 147.72, 137.72, 136.35, 130.20, 128.31, 125.24, 124.20, 114.48, 103.54, 65.99, 63.38, 52.87, 51.59, 47.59. Q-TOF-MS 523.2509; anal. calcd for [C26H30N6O4S]; C, 59.75; H, 5.79; N, 16.08; found; C, 59.89; H, 5.94; N, 15.93.
4.3.23 4-{4-[(E)-{[(E)-3-(4-methoxyphenyl)-4-(4-nitrophenyl)thiazol-2(3H)-ylidene]hydrazone} methyl] phenyl}morpholine (25). Yield: 86%, M.P: 268–270 °C, colour: orange red, IR νmax (cm−1): 1640 (CC), 1505 (CN), 1350 (C–N), 1220 (C–S). δH (600 MHz, DMSO-d6) 8.10–8.06 (2H, m), 8.05 (1H, s), 7.56–7.51 (2H, m), 7.46–7.42 (2H, m), 7.23–7.18 (2H, m), 6.98–6.93 (2H, m), 6.93–6.89 (2H, m), 6.87 (1H, s), 3.73 (7H, d, J = 5.4 Hz), 3.17 (4H, t, J = 4.9 Hz); 13C NMR (151 MHz, DMSO) δ 168.37, 158.54, 152.22, 152.05, 146.74, 137.85, 137.10, 130.05, 129.78, 129.12, 128.25, 125.44, 123.47, 114.46, 114.31, 104.76, 65.98, 55.35, 47.64. Q-TOF-MS 516.2907; anal. calcd for [C27H25N5O4S]; C, 62.90; H, 4.89; N, 13.58; found; C, 63.05; H, 4.75; N, 13.72.
4.3.24 4-{4-[(E)-{[(E)-3-(2,6-dimethylphenyl)-4-(4-nitrophenyl)thiazol-2(3H)ylidene] hydrazone}methyl]phenyl}morpholine (26). Yield: 91%, M.P: 235–237 °C, colour: orange, IR νmax (cm−1): 1610 (CC), 1520 (CN), 1350 (C–N), 1220 (C–S). δH (600 MHz, DMSO-d6) 8.07–8.04 (2H, m), 8.03 (1H, s), 7.55–7.51 (2H, m), 7.37–7.32 (2H, m), 7.20 (1H, dd, J = 8.1, 7.0 Hz), 7.13 (2H, d, J = 7.6 Hz), 7.00 (1H, s), 6.97–6.92 (2H, m), 3.72 (4H, dd, J = 6.1, 3.7 Hz), 3.22–3.13 (4H, m), 2.10 (6H, s); 13C NMR (151 MHz, DMSO) δ 166.26, 152.29, 151.98, 146.96, 137.38, 136.42, 136.14, 135.72, 129.05, 128.73, 128.23, 125.35, 123.60, 114.38, 104.96, 65.99, 47.57, 17.77. Q-TOF-MS 514.2144; anal. calcd for [C28H27N5O3S]; C, 65.48; H, 5.30; N, 13.64; found; C, 65.31; H, 5.45; N, 13.50.
4.3.25 4-{4-[(E)-{[(E)-4-(4-bromophenyl)-3-phenylthiazol-2(3H)-ylidene]hydrazone}methyl] phenyl}morpholine (27). Yield: 93%, M.P: 277–279 °C, colour: grey, IR νmax (cm−1): 1650 (CC), 1520 (CN), 1250 (C–N), 1140 (C–S). δH (600 MHz, DMSO-d6) 8.03 (1H, s), 7.54–7.50 (2H, m), 7.43–7.40 (2H, m), 7.39–7.33 (2H, m), 7.33–7.28 (1H, m), 7.26–7.21 (2H, m), 7.12–7.07 (2H, m), 6.97–6.91 (2H, m), 6.63 (1H, s), 3.74–3.69 (4H, m), 3.19–3.13 (4H, m); 13C NMR (151 MHz, DMSO) δ 168.30, 152.02, 138.38, 137.51, 131.25, 130.20, 130.04, 129.04, 128.73, 128.21, 127.96, 125.48, 121.73, 114.47, 102.15, 65.97, 47.65. Q-TOF-MS 514.21; Q-TOF-MS 521.1770; anal. calcd for [C26H23BrN4OS]; C, 60.12; H, 4.46; N, 10.79; found; C, 60.23; H, 4.34; N, 10.90.
4.4 CA-II in vitro assay
The carbonic anhydrase CA-II in vitro inhibitory study was performed by following the already available methodology.8 In total 200 μL was the reaction volume, with 20 μL per well of compounds dissolved in DMSO, 140 μL of HEPES-tris buffer, 20 μL per well of buffer-made purified bovine erythrocyte CA-II (0.15 mg mL−1), and 20 μL per well of 4-nitrophenyl acetate solution added in that order. In a 96-well flat bottom plate, 20 μL per well of the tested substances were incubated with the enzyme carbonic anhydrase-II (EC 4.2.1.1) for 15 minutes. Using a spectrophotometer, the rate of product production was observed by adding 20 μL of 4-NPA as substrate, which was produced in ethanol at a final concentration of 0.7 mM at 25C for 30 min at regular intervals of 1 min (xMarkTM Microplate, Bio-Rad, Hercules, CA, USA). DMSO 7% 20 μL per well was used as blank while acetazolamide was used as negative inhibitor. The kinetic study was carried out by following the similar procedure with different concentrations of substrate including 0.1, 0.2, 0.4 and 0.8 mM.
4.5 Molecular docking
Molecular docking studies were conducted on the aforementioned conformations in order to examine residue interactions and binding energy scores. The protein database (https://www.rcsb.org/) provided the initial configuration of CA-II, PDB 3D crystal structure 5LJT.38 After removing the current ligands and adding hydrogen atoms, missing residues were repaired using the glide. The ligand that was co-crystallized has been redocked to the 5LJT active site to determine the docking parameters. To prepare protein crystal structures, molecular docking used a three-step method that included pre-processing, optimization, and protein energy reduction using the Protein Preparation Wizard (PPW) program.5,39 The ligands were generated using LigPrep, which ensured precise assignment of protonation states and atom types at pH 7.4 ± 1.0. Bond ordering occurred in the structures, and hydrogen atoms were added. Then, a grid was made at the coordinates (x, y, z) of the binding pockets (20 Å), aligned with a co-crystallized ligand, using the Receptor grid generating tool.39
4.6 Molecular dynamic simulation
MDS have been performed using the “Desmond V 7.2 package” (Schrodinger 2022-4) to investigate the effects of the solvent system on the protein–ligand complex structure. The simulations were executed on a Dell Inc. Precision 7820 Tower equipped with an Intel Xeon (R) Silver 4210R processor and an NVIDIA Corporation GP104GL (RTX A 4000) graphics processing unit running Ubuntu 22.04.1 LTS 64 bit. The OPLS4 forcefield was used to carry out the MDS of the docked complex (24-CA-II). The complex has been placed in the center of an orthorhombic cubic box for MDS.32 TIP3P water molecules and buffers have been added, with the protein atom and the box's edge separated by 10 Å with NPT ensemble. The boundary condition box volume has also been computed based on complex type, in addition to counterions such as Na+ and Cl-that have been injected to neutralize the system at random. A study of the protein–ligand interaction, Root Mean Square Deviation (RMSD), and Root Mean Square Fluctuation (RMSF) was carried out over all Cα atoms throughout the 150 ns MD simulation to evaluate domain correlations.39,40
4.7 QSAR analysis
For the current study, we have analyzed the correlation between observed bioactivity and molecules synthesized via standard QSAR approach, wherein we used ‘QSARINS-2.2.4’. Number of GA-MLR [Genetic Algorithm-Multi Linear Regression] based QSAR models were developed. All the 2D structures were first drawn in ‘ChemBioDraw V. 12.0’ followed by their 3D optimizations, saving them in ‘mol’ and importing in the ‘PaDEL’ platform. In total of 1394 descriptors were used. Among them 1049 were automatically excluded by ‘OSF’ function of ‘QSARINS’ tool. Finally, the models used 394 molecular descriptors (2D and fingerprint descriptors) in them (please refer ESI† for detailed QSAR modelling methodology).
4.8 ADMET analysis
For the current set of compounds, we analyzed predictive ADMET analysis using the popular webserver ‘admetSAR’ [http://lmmd.ecust.edu.cn/admetsar1/predict/]. Wherein, the prediction for the ‘BOILED-EGG Model’ was done using the ‘SwissADME’ server [http://www.swissadme.ch/].
4.9 Statistical analysis
The programs were employed to analyze the attained results for biological activity, the SoftMax Pro package and Excel were utilized.
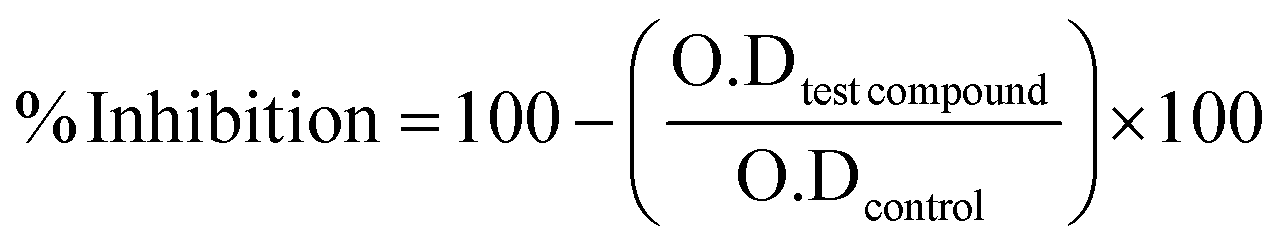
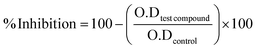
The given formula below was used to calculate percent inhibition.
| |
 | (1) |
EZ-FIT (Perrella Scientific, Inc., USA) was used for IC50 calculations of all tested samples. To overcome on the expected errors all experiments were performed in triplicate, and variations in the results are reported in Standard Error of Mean values (SEM).
| |
 | (2) |
Data availability
The data supporting this article have been included as part of the ESI.†
Author contributions
Mussarat Tasleem: investigation, methodology. Saeed Ullah: validation, formal analysis. Ajmal Khan: validation, data curation. Suraj N. Mali: investigation, software. Sunil Kumar: formal analysis, software. Bijo Mathew: software, validation. Angelo Oneto: investigation, writing. Faiqa Noreen: investigation, methodology. Gaber E. Eldesoky: resources, funding acquisition. Silvia Schenone: writing – review & editing. Ahmed Al-Harrasi: formal analysis, resources. Zahid Shafiq: conceptualization, supervision, writing – review & editing.
Conflicts of interest
The authors have declared no conflict of interest.
Acknowledgements
Authors are grateful to the Researchers Supporting Project No. (RSP2024R161), King Saud University, Riyadh, Saudi Arabia. Z. S is thankful to the Alexander von Humboldt Foundation for the award of Georg Forster Research Fellowship for Experienced Researchers.
References
- A. Khan, et al., Quinazolinones as competitive inhibitors of carbonic anhydrase-II (human and bovine): synthesis, in vitro, in silico, selectivity, and kinetics studies, Front. Chem., 2020, 8, 598095 CrossRef CAS PubMed.
- C. T. Supuran, Carbonic anhydrase inhibitors, Bioorg. Med. Chem. Lett., 2010, 20(12), 3467–3474 CrossRef CAS PubMed.
- C. T. Supuran, Emerging role of carbonic anhydrase inhibitors, Clin. Sci., 2021, 135(10), 1233–1249 CrossRef CAS PubMed.
- C. T. Supuran, Novel carbonic anhydrase inhibitors, Future Med. Chem., 2021, 13(22), 1935–1937 CrossRef PubMed.
- D. Ekinci, et al., Structure–activity relationships for the interaction of 5, 10-dihydroindeno [1, 2-b] indole derivatives with human and bovine carbonic anhydrase isoforms I, II, III, IV and VI, Eur. J. Med. Chem., 2012, 49, 68–73 CrossRef CAS PubMed.
- C. T. Supuran, Carbonic anhydrase inhibitors and their potential in a range of therapeutic areas, Expert Opin. Ther. Pat., 2018, 28(10), 709–712 CrossRef CAS PubMed.
- C. B. Mishra, M. Tiwari and C. T. Supuran, Progress in the development of human carbonic anhydrase inhibitors and their pharmacological applications: Where are we today?, Med. Res. Rev., 2020, 40(6), 2485–2565 CrossRef CAS PubMed.
- N. U. Rehman, et al., Carbonic Anhydrase-II, α-Glucosidase, and Chemical Composition of Essential Oils from Stem and Leaves of Zygophyllum qatarense, J. Essent.Oil Bear. Plants, 2022, 25(4), 835–843 CrossRef CAS.
- S. Kumar, et al., Recent advances in the medicinal chemistry of carbonic anhydrase inhibitors, Eur. J. Med. Chem., 2021, 209, 112923 CrossRef CAS PubMed.
- C. M. Al-Matarneh, et al., Synthetic Approaches to Novel Human Carbonic Anhydrase Isoform Inhibitors Based on Pyrrol-2-one Moiety, J. Med. Chem., 2024, 67(4), 3018–3038 CrossRef CAS PubMed.
- A. M. Alafeefy, et al., Development of certain new 2-substituted-quinazolin-4-yl-aminobenzenesulfonamide as potential antitumor agents, Eur. J. Med. Chem., 2016, 109, 247–253 CrossRef CAS PubMed.
- F. P. Busardò, et al., In silico, in vitro, and in vivo human metabolism of acetazolamide, a carbonic anhydrase inhibitor and common “diuretic and masking agent” in doping, Arch. Toxicol., 2022, 96(7), 1989–2001 CrossRef PubMed.
- S. Ghorai, et al., Structure-activity relationship of human carbonic anhydrase-II inhibitors: Detailed insight for future development as anti-glaucoma agents, Bioorg. Chem., 2020, 95, 103557 CrossRef CAS PubMed.
- M. Bozdag, et al., Discovery of 4-hydroxy-3-3-(phenylureido) benzenesulfonamides as SLC-0111 analogues for the treatment of hypoxic tumors overexpressing carbonic anhydrase IX, J. Med. Chem., 2018, 61(14), 6328–6338 CrossRef CAS PubMed.
- L. Ciccone, et al., Carbonic anhydrase inhibitors and epilepsy: State of the art and future perspectives, Molecules, 2021, 26(21), 6380 CrossRef CAS PubMed.
- B. Arabaci, I. Gulcin and S. Alwasel, Capsaicin: a potent inhibitor of carbonic anhydrase isoenzymes, Molecules, 2014, 19(7), 10103–10114 CrossRef PubMed.
- F. Anjum, et al., Discovery of natural compounds as potential inhibitors of human carbonic anhydrase II: An integrated virtual screening, docking, and molecular dynamics simulation study, OMICS: J. Integr. Biol., 2021, 25(8), 513–524 CrossRef CAS PubMed.
- D. Masci, et al., 4-(3-Phenyl-4-(3, 4, 5-trimethoxybenzoyl)-1 H-pyrrol-1-yl) benzenesulfonamide, a Novel Carbonic Anhydrase and Wnt/β-Catenin Signaling Pathway Dual-Targeting Inhibitor with Potent Activity against Multidrug Resistant Cancer Cells, J. Med. Chem., 2023, 66(21), 14824–14842 CrossRef CAS PubMed.
- C. T. Supuran, Experimental carbonic anhydrase inhibitors for the treatment of hypoxic tumors, J. Exp. Pharmacol., 2020, 603–617 CrossRef CAS PubMed.
- S. G. Nerella, et al., Anticancer carbonic anhydrase inhibitors: a patent and literature update 2018–2022, Expert Opin. Ther. Pat., 2022, 32(8), 833–847 CrossRef CAS PubMed.
- A. Güttler, et al., Betulin sulfonamides as carbonic anhydrase inhibitors and anticancer agents in breast cancer cells, Int. J. Mol. Sci., 2021, 22(16), 8808 CrossRef PubMed.
- M. Khan, et al., Inhibitory efficacy of thiosemicarbazones for carbonic Anhydrase II (bovine and human) as a target of calcification and tumorigenicity, Curr. Pharm. Des., 2022, 28(36), 3010–3022 CrossRef CAS PubMed.
- A. Di Fiore, et al., Carbonic anhydrase inhibitors: the X-ray crystal structure of ethoxzolamide complexed to human isoform II reveals the importance of thr200 and gln92 for obtaining tight-binding inhibitors, Bioorg. Med. Chem. Lett., 2008, 18(8), 2669–2674 CrossRef CAS PubMed.
- A. Moradi, et al., Developing a novel amperometric method for biosensing of carbonic anhydrase II based on conventional and multi-way chemometric analyses of its inhibition by acetazolamide, dorzolamide and methazolamide, Sens. Bio-Sens. Res., 2022, 37, 100516 CrossRef.
- C. T. Supuran, Carbonic anhydrase inhibitors from marine natural products, Mar. Drugs, 2022, 20(11), 721 CrossRef CAS PubMed.
- P. K. Shukla, A. Verma, and P. Mishra, Significance of nitrogen heterocyclic nuclei in the search of pharmacological active compounds, New Perspective in Agricultural and Human Health, ed. R. P. Shukla, R. S. Mishra, A. D. Tripathi, A. K. Yadav, M. Tiwari and R. R. Mishra, 2017, pp. 100–126 Search PubMed.
- M. T. Shehzad, et al., Exploring synthetic and therapeutic prospects of new thiazoline derivatives as aldose reductase (ALR2) inhibitors, RSC Adv., 2021, 11(28), 17259–17282 RSC.
- S. G. Nerella, et al., Tumor associated carbonic anhydrase inhibitors: Rational approaches, design strategies, structure activity relationship and mechanistic insights, Eur. J. Med. Chem. Rep., 2024, 100131 CAS.
- S. A. Channar, et al., Exploring thiazole-linked thioureas using alkaline phosphatase assay, biochemical evaluation, computational analysis and structure–activity relationship (SAR) studies, Med. Chem. Res., 2022, 31(10), 1792–1802 CrossRef CAS.
- N. Berber, et al., Synthesis of new series of thiazol-(2 (3H)-ylideneamino) benzenesulfonamide derivatives as carbonic anhydrase inhibitors, J. Biochem. Mol. Toxicol., 2020, 34(12), e22596 CrossRef CAS PubMed.
- R. Meleddu, et al., New 4-[(3-cyclohexyl-4-aryl-2, 3-dihydro-1, 3-thiazol-2-ylidene) amino] benzene-1-sulfonamides, synthesis and inhibitory activity toward carbonic anhydrase I, II, IX, XII, Bioorg. Med. Chem. Lett., 2015, 25(16), 3281–3284 CrossRef CAS PubMed.
- A. Saeed, et al., Substituted (E)-2-(2-benzylidenehydrazinyl)-4-methylthiazole-5-carboxylates as dual inhibitors of 15-lipoxygenase & carbonic anhydrase II: synthesis, biochemical evaluation and docking studies, Biochem. Biophys. Res. Commun., 2017, 482(1), 176–181 CrossRef CAS PubMed.
- C. T. Supuran, et al., Three new aromatic sulfonamide inhibitors of carbonic anhydrases I, II, IV and XII, J. Enzyme Inhib. Med. Chem., 2013, 28(2), 289–293 CrossRef CAS PubMed.
- A. S. Sheikh, et al., Formation of morpholine-acetamide derivatives as potent anti-tumor drug candidates: Pharmacological evaluation and molecular docking studies, Heliyon, 2023, 9(11), e22183 CrossRef CAS PubMed.
- B. Swain, et al., Synthesis and exploration of 2-morpholino-4-phenylthiazol-5-yl acrylamide derivatives for their effects against carbonic anhydrase I, II, IX and XII isoforms as a non-sulfonamide class of inhibitors, Bioorg. Med. Chem., 2019, 27(21), 115090 CrossRef CAS PubMed.
- M. Campos, et al., In silico structure-based design of GABAB receptor agonists using a combination of docking and QSAR, Chem. Biol. Drug Des., 2019, 94(4), 1782–1798 CrossRef PubMed.
- N. Quintana, et al., Exploring the gallic and cinnamic acids chimeric derivatives as Anticancer Agents over HeLa cell line: An in silico and in vitro study, Mol. Inf., 2023, 42(1), 2200016 CrossRef PubMed.
- A. Nocentini, et al., Benzenesulfonamides incorporating flexible triazole moieties are highly effective carbonic anhydrase inhibitors: synthesis and kinetic, crystallographic, computational, and intraocular pressure lowering investigations, J. Med. Chem., 2016, 59(23), 10692–10704 CrossRef CAS PubMed.
- S. Kumar, et al., Discerning of isatin-based monoamine oxidase (MAO) inhibitors for neurodegenerative disorders by exploiting 2D, 3D-QSAR modelling and molecular dynamics simulation, J. Biomol. Struct. Dyn., 2023, 1–13 Search PubMed.
- A. Manoharan, et al., Assembling a Cinnamyl Pharmacophore in the C3-Position of Substituted Isatins via Microwave-Assisted Synthesis: Development of a New Class of Monoamine Oxidase-B Inhibitors for the Treatment of Parkinson's Disease, Molecules, 2023, 28(16), 6167 CrossRef CAS PubMed.
|
| This journal is © The Royal Society of Chemistry 2024 |
Click here to see how this site uses Cookies. View our privacy policy here. 
 Open Access Article
 This Open Access Article is licensed under a Creative Commons Attribution-Non Commercial 3.0 Unported Licence
 a,
Saeed Ullahb,
Ajmal Khanb,
Suraj N. Mali
a,
Saeed Ullahb,
Ajmal Khanb,
Suraj N. Mali