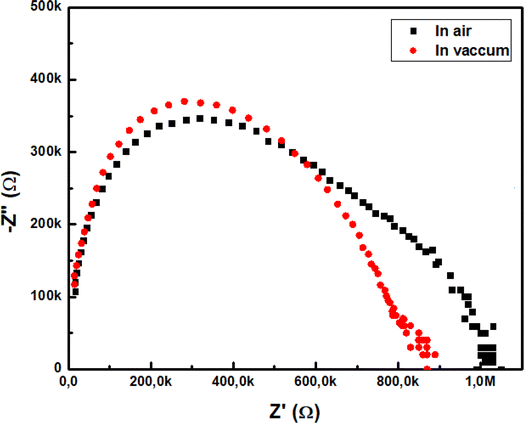
 Open Access Article
Creative Commons Attribution 3.0 Unported Licence
Isopropanol sensor based on sprayed In2S3 thin film using linear discriminant analysis for real-time selectivity
R. Souissi *ab,
B. Bourichaac,
N. Ihzazd,
N. Bouguila
 d and
M. Abderrabbaa
aLaboratory of Materials, Molecules and Applications IPEST, University of Carthage, BP 51, La Marsa 2070, Tunis, Tunisia. E-mail: riadhsouissi1@gmail.com; Tel: +216 28419444
bPreparatory Institute of Engineering Studies of Bizerte, University of Carthage, Zarzouna, 7021, Bizerte, Tunisia
cFaculty of Sciences of Bizerte, University of Carthage, Zarzouna, 7021, Bizerte, Tunisia
dFaculty of Sciences of Gabes, Laboratory of Physics of Materials and Nanomaterials Applied to the Environment, University of Gabes, Erriadh, 6079, Gabes, Tunisia
First published on 26th July 2024
Abstract
Metal sulfides have been studied for their high performance as new sensitive materials for gas detection. These material innovations contribute significantly to the development of more sensitive, stable and specific conductivity sensors, opening the way to new applications in detecting gases at low concentrations. Hence, this work reports on the sensing performance of In2S3 for isopropanol detection. Numerous VOCs, such as ketones, alcohols, and aldehydes, serve as cancer biomarkers. Notably, isopropanol, as a biomarker, shows a substantial increase (20–1007 ppb) in lung cancer patients, suggesting its potential as an early diagnostic criterion. To explore this, we fabricated a thin film of In2S3 onto a platinum interdigitated silicon dioxide substrate by simple and low-cost spray pyrolysis technology. Structural and morphological analyses via XRD, MEB, AFM, and TEM were conducted on the prepared samples. Isopropanol vapor response was assessed within a controlled temperature range of 250 °C–450 °C. The In2S3-based sensor demonstrated notable sensitivity (0.034 ppm−1), maintained stability over three weeks, and reliably detected isopropanol activation. In2S3 emerges as a promising candidate for detecting isopropanol, with a limit of detection (LOD) of 162 ppb. In this work, seven VOCs, including isopropanol, ethanol, methanol, butan-1-ol, formaldehyde, toluene, and acetone, were evaluated. Cross-responses among these VOCs were observed, indicating a lack of assured sensor selectivity. However, isopropanol recognition was achieved by employing linear discriminant analysis (LDA) on pertinent features derived from transient current change measurements. As a result, the sensor's sensitivity enables the deduction of the isopropanol concentration.
1. Introduction
Lung cancer is one of the deadliest diseases globally, with the highest morbidity and mortality rates among all cancers. Without early detection, it is nearly incurable, with a 5 year survival rate of only 15–20%.1 Early detection, however, can boost the survival rate to around 80%. Therefore, developing an easy and accurate early diagnosis method is crucial.The presence of certain volatile organic compounds (VOCs) in human breath can indicate lung cancer.2–4 Using chemical sensors to detect these VOCs offers a non-invasive diagnostic approach. Hydrocarbons like ketones, alcohols, and aldehydes are considered cancer biomarkers.5 Among these, isopropanol levels are notably higher in lung cancer patients compared to healthy individuals and those with other lung diseases. Diabetic patients, for instance, have an average exhaled isopropanol concentration of 85.44 ppb.6 Breath analysis for alcohols is linear up to 420 ppb.6 Monitoring VOC concentrations can aid in early diagnosis, underscoring the need for a rigorous detection protocol.
Nanotechnology has advanced sensor sensitivity, selectivity, and stability through the development of new materials. In2S3 (indium sulfide) is a promising material for gas sensors due to its exceptional electrical properties and broad application range, including solar cells, gas sensors, and photocatalysts.7–12 While metal oxides are effective chemical gas sensors, they face selectivity challenges.13,14 Recent studies, including our own, have shown In2S3's sensitivity to various gases like VOCs, O3, NO2, and NH3.9,10,15,16 Although cross-responses can affect selectivity, using hetero-structures or doping can enhance specific analyte detection,17,18 contributing to electronic nose applications.19
In this study, we propose addressing overlapping static responses by developing new features from the sensor's dynamic response. This will create a database for linear discriminant analysis to recognize isopropanol.
2. Experimental
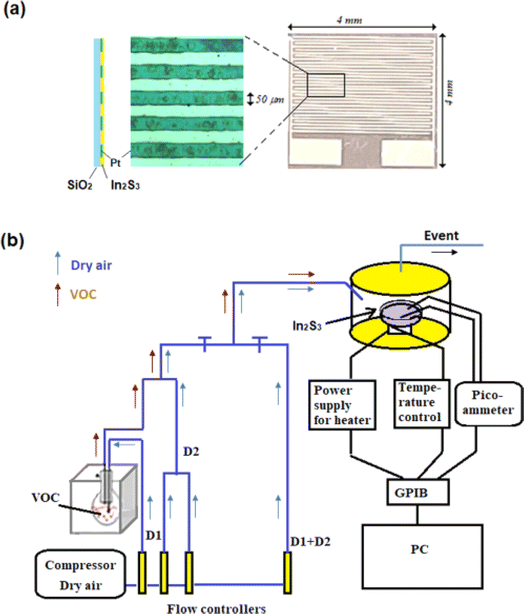
Supplied from Sigma-Aldrich, thiourea, SC(NH2)2 (99.0%), and indium chloride InCl3 (99.0%) were added to distilled water to obtain initial solution. The latter was sprayed by pyrolysis for 180 s at 350 °C onto silicon substrates, equipped with interdigitated microelectrodes composed of a total of 30 platinum fingers (with an electrode spacing of 50 μm) prepared by sputtering with photolithography and lift-up methods on 4 × 4 mm2 surface as shown in Fig. 1(a). The last mentioned are previously immersed in an acetone bath for 15 min under ultrasound and then rinsed by distilled water and dried for 15 min. Spray pyrolysis is simple and inexpensive at reasonable temperatures (100 °C to 500 °C). It does not require high-quality targets or vacuum. The flow rates of solution and nitrogen gas were kept constant at 2 mL min−1 and 6 L min−1, respectively. The molar ratio of the S/In precursor solution was set to 2. The synthesis of In2S3 is given by the following equation.| 2InCl3 + 3SC(NH2)2 + 6H2O → In2S3 + 3CO2 + 6NH4Cl | (1) |
The layer thickness, d was estimated to be 200 nm using the double weight method and calculated by the following formula:
 | (2) |
Given that the thickness of the interdigitated platinum electrode is 100 nm, and considering that adsorption occurs at the surface, it is reasonable for the film thickness to be slightly greater than that of the electrodes. This ensures a good electron flow during the gas sensing process.
Fig. 1(b) illustrates the experimental set-up employed for gas detection. In2S3 sensor is positioned on a support using two golden tungsten electrodes and polarized at 1 V utilizing an HP 4140B pico-ammeter source. The device is linked to a computer via a GPIB card for real-time recording electric current across the sensor. Heating of the sample is achieved by a halogen lamp. The working temperature ranges from 250 °C to 450 °C. Organic vapors are bubbling from a pure liquid contained in a round-bottomed flask positioned within a Polystat cc1 Huber water bath set at a fixed temperature (Tvap). These vapors are subsequently diluted with dry air serving as the carrier gas. The concentration of VOC is regulated using a two-arm gas flow device. The first arm receives organic vapor (D1 flow rate), while the second arm is supplied with dry air (D2 flow rate). The two streams converge at the end of the two arms.
The VOC concentration is given by the following expression:9
 | (3) |
 is the molar ratio of VOCs at a predetermined Tvap temperature, Pvap is the partial pressure of volatile organic compounds at a given temperature Tvap, and Patm designates atmospheric pressure.
Following a 5 minute sensor exposure to VOCs, the test chamber will undergo a 15 minute cleaning with dry air, representing the typical duration needed to revert to the initial baseline level. The sensor response is defined accordingly:9
 | (4) |
Likewise, sensitivity is defined by eqn (5):15
 | (5) |
3. Results and discussion
3.1 Characterization
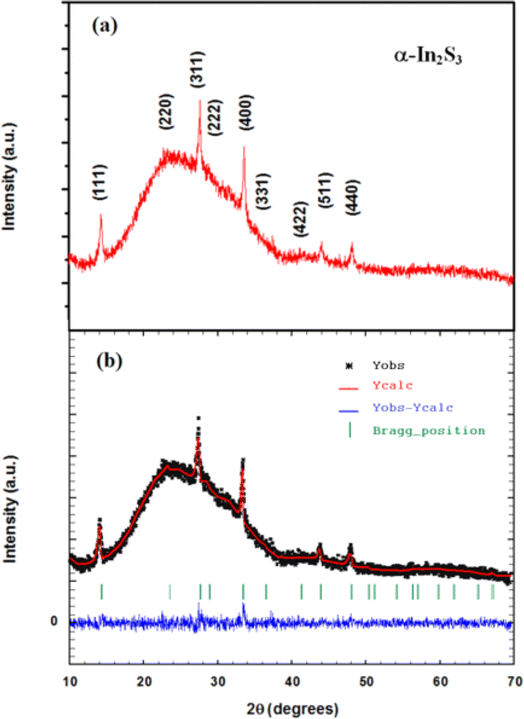
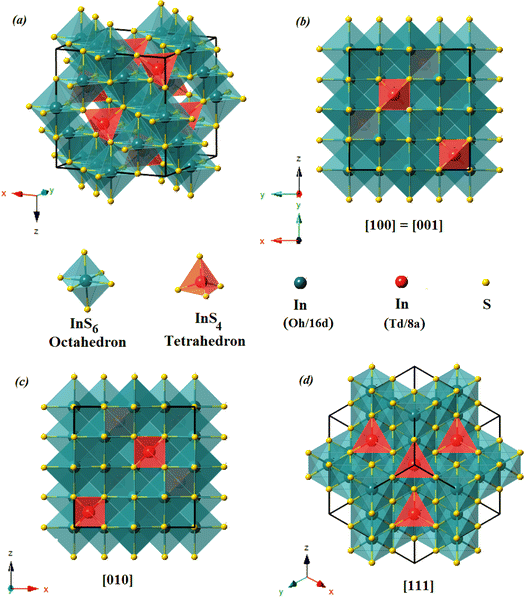
![[3 with combining macron]](https://www.rsc.org/images/entities/char_0033_0304.gif) m space group according to the standard JCPDS card no. 32-0459.20 The Rietveld analysis plots, which were realized by FULLPROF software program21 of X-ray diffraction pattern at room temperature, show a good agreement between the observed and calculated patterns. The observed and calculated patterns are shown as the solid circles and the top solid line, respectively. The vertical markers stand for the angles of Bragg reflections. The lowest solid line corresponds to the difference between the calculated and observed intensities. To achieve the refinement, we have adopted Pseudo-Voigt peak profile function and approximate the background by a cubic spline interpolation between a set of background points with refinable heights, and taking into account the amorphous substrate contribution. Fig. 2(b) shows the refinement results of XRD patterns of In2S3 sprayed thin films. The structural parameters estimated from X-ray diffraction data are given in Table 1. The primitive unit cells of the structural models of the cubic α-In2S3 with a projection along the [100], [010], [001], and [111] axis is represented in Fig. 3 which takes a cubic spinel structure of space group Fd
m space group according to the standard JCPDS card no. 32-0459.20 The Rietveld analysis plots, which were realized by FULLPROF software program21 of X-ray diffraction pattern at room temperature, show a good agreement between the observed and calculated patterns. The observed and calculated patterns are shown as the solid circles and the top solid line, respectively. The vertical markers stand for the angles of Bragg reflections. The lowest solid line corresponds to the difference between the calculated and observed intensities. To achieve the refinement, we have adopted Pseudo-Voigt peak profile function and approximate the background by a cubic spline interpolation between a set of background points with refinable heights, and taking into account the amorphous substrate contribution. Fig. 2(b) shows the refinement results of XRD patterns of In2S3 sprayed thin films. The structural parameters estimated from X-ray diffraction data are given in Table 1. The primitive unit cells of the structural models of the cubic α-In2S3 with a projection along the [100], [010], [001], and [111] axis is represented in Fig. 3 which takes a cubic spinel structure of space group Fd![[3 with combining macron]](https://www.rsc.org/images/entities/char_0033_0304.gif) m. Fractional occupation of In atoms occurs in tetrahedrally coordinated in Td(8a) sites at the Wyckoff position (8a) (1/8, 1/8, 1/8), and octahedrally coordinated Oh(16d)-sites at the Wyckoff position 16d (1/2, 1/2, 1/2), and S ions at (32e) sites (x, x, x). The resulting higher crystal symmetry explains the observed disappearance of some of the minor intensity peaks in the diffractograms compared to another indium sulfide.22 This is in good agreement with the results in a previous report.20,23–25 Various fitting parameters are used to assess the quality of fitting simulated data on the experimental plot. Reliability index parameters in form of Rp, Rwp, Rexp has been estimated. Rp is the residual error, Rwp is the weighted residual error, Rexp is the expected residual error. The obtained reliability factors, the goodness-of-fitting (χ2), and lattice parameters calculated from the Rietveld refinements are tabulated in Table 1.
m. Fractional occupation of In atoms occurs in tetrahedrally coordinated in Td(8a) sites at the Wyckoff position (8a) (1/8, 1/8, 1/8), and octahedrally coordinated Oh(16d)-sites at the Wyckoff position 16d (1/2, 1/2, 1/2), and S ions at (32e) sites (x, x, x). The resulting higher crystal symmetry explains the observed disappearance of some of the minor intensity peaks in the diffractograms compared to another indium sulfide.22 This is in good agreement with the results in a previous report.20,23–25 Various fitting parameters are used to assess the quality of fitting simulated data on the experimental plot. Reliability index parameters in form of Rp, Rwp, Rexp has been estimated. Rp is the residual error, Rwp is the weighted residual error, Rexp is the expected residual error. The obtained reliability factors, the goodness-of-fitting (χ2), and lattice parameters calculated from the Rietveld refinements are tabulated in Table 1.
| Synopsis | |
|---|---|
| Formula | α-In2S3 |
| Crystal system | Cubic |
| Space group | Fd![[3 with combining macron]](https://www.rsc.org/images/entities/char_0033_0304.gif) m m |
| Density (g cm−3) | 4.686 |
| Lattice parameters | |
|---|---|
| a = b = c (Å) | 10.7189 (8) |
| α = β = γ (°) | 90 |
| Volume, V (Å3) | 1231.55 (9) |
| Atomic coordinates | |||||
|---|---|---|---|---|---|
| Atoms | Wyckoff | x | y | z | Occ. |
| In | 8a | 0.1250 | 0.1250 | 0.1250 | 0.34(2) |
| In | 16d | 0.5000 | 0.5000 | 0.5000 | 1.66(2) |
| S | 32e | 0.2524(9) | 0.2524(9) | 0.2524(9) | 3 |
| Reliability index parameters | |||
|---|---|---|---|
| Rp (%) = 3.32 | Rwp (%) = 4.25 | Rexp (%) = 4.11 | χ2 = 1.07 |
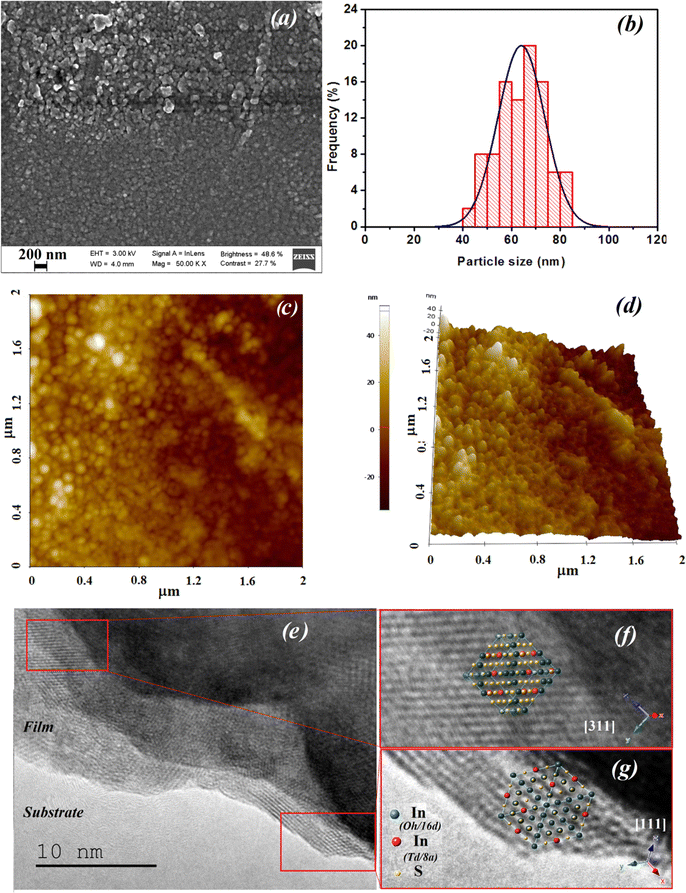
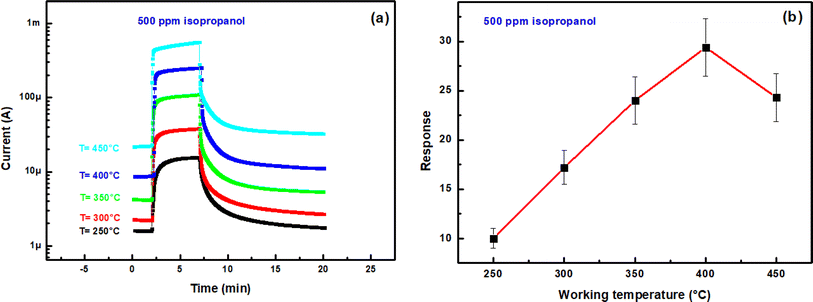
These checked characterizations are crucial for ensuring that the material provides a sensitive surface with nanoparticles sized between 40 and 85 nm, offering an excellent sensing area with a roughness of 13 nm. Additionally, they help us to optimize metrological parameters for future studies. Each manufacturing or deposition parameter can significantly impact the sensor's performance.
In2S3 is an n-type wide band-gap semiconductor characterized by sulfur vacancies that act as donors.26,27 When the film is exposed to air, molecular oxygen accepts electrons, reducing the electron concentration in the conduction band. Oxygen, in forms such as O2−, O−, or O2− depending on temperature, is chemisorbed on the surface and at grain boundaries. This chemisorption creates a surface Schottky barrier and an electron-depleted region, increasing the material's resistance.28 During the pumping phase, the film releases adsorbed oxygen as molecular O2. This desorption frees one or two electrons per atom, which re-enter the conduction band. This process lowers the resistance by reducing the potential barrier at the grain boundaries and increasing the carrier density.
3.2 Isopropanol sensing properties
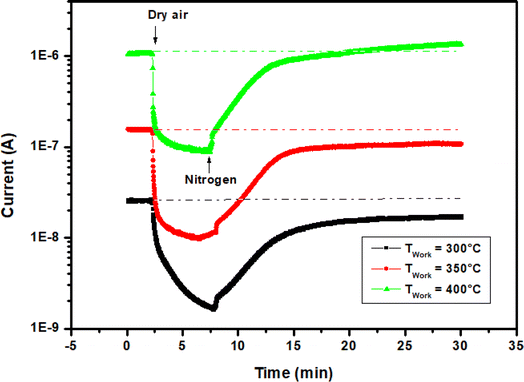 | ||
| Fig. 6 Current change through In2S3 film vs. time upon altering exposure to dry air and nitrogen at operating temperatures 300 °C, 350 °C and 400 °C. | ||
Fig. 7(a) illustrates the transient current variation of an In2S3 film when alternating between 500 ppm isopropanol and dry air within the test chamber at 350 °C. As depicted, the sample exhibits an increase in current when exposed to isopropanol and a return to baseline level when subjected to dry air. This observed behavior aligns with the detection mechanism of reducing gases by n-type semiconductors.30,31
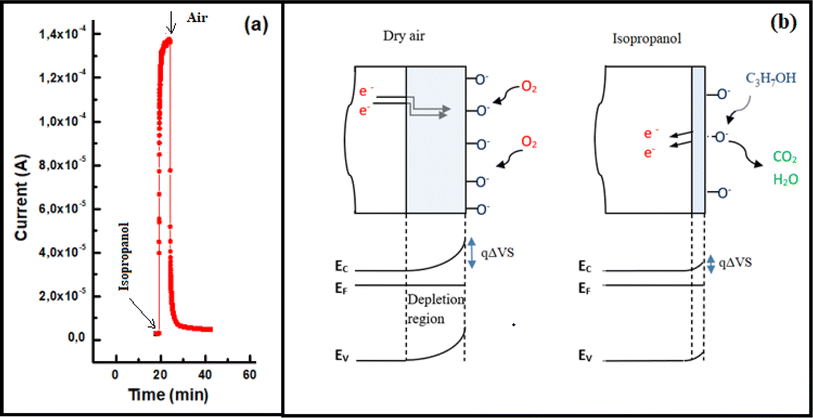 | ||
| Fig. 7 (a) Dynamic change of current during a cycle of alternating exposure of In2S3 film to 500 ppm isopropanol and dry air at 350 °C, (b) schematic isopropanol sensing mechanism. | ||
Upon isopropanol vapors injection into the test chamber, the molecules react with the previously adsorbed oxygen species and electrons were released to In2S3 layer. In previous work32 we demonstrated that O2− ions in the layer interact mainly with VOCs. Hence, the isopropanol sensing mechanism in indium sulfide film can be elucidated by the following equations:
Under dry air:
 | (6) |
Under isopropanol:
| C3H7OH(ads) + 9O(ads)2− → 3CO2 + 4H2O + 18ē | (7) |
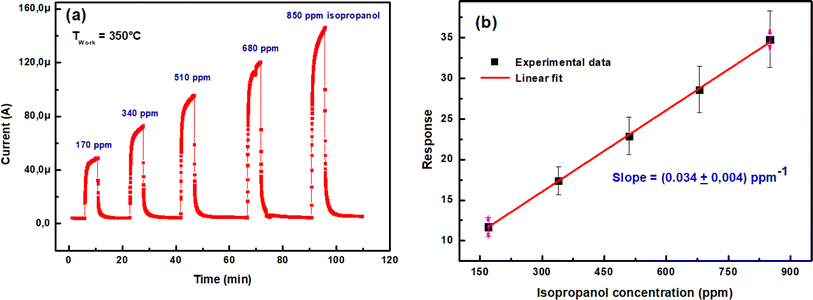 | ||
| Fig. 9 (a) Transient current intensity vs. time upon exposure of In2S3 sensor to various isopropanol concentrations at 350 °C, (b) sensing response vs. isopropanol concentration. | ||
The response as a function of gas concentration is plotted in Fig. 9(b). The sensing response is linearly proportional to isopropanol concentration in the range 150–900 ppm. The sensitivity of this sensor is calculated from the response slope of the fitted line and reaches (0.034 ± 0.004) ppm−1. This last value allowed to deduce the limit of detection (LOD) which is defined as the lowest concentration where the signal is distinctly distinguishable from the background noise (usually LOD is set at three times the standard deviation of the noise). To estimate sensor noise, the sensing response of the sensor is measured in its baseline state before exposure to volatile organic compounds (VOCs). This involves obtaining the average sensing response (Resp) from a series of baseline measurements (N = 30), followed by calculating the root mean square deviation (RMSD) using the formula provided33,34
 | (8) |
N represents the number of data points and Respi denotes the ith baseline measurement response, the (LOD) was computed using eqn (9) as per this definition.
 | (9) |
The computed LOD value is (162 ± 19) ppb. This value is sufficient to explore the detection of isopropanol as a biomarker in human breath according to recognized standards.
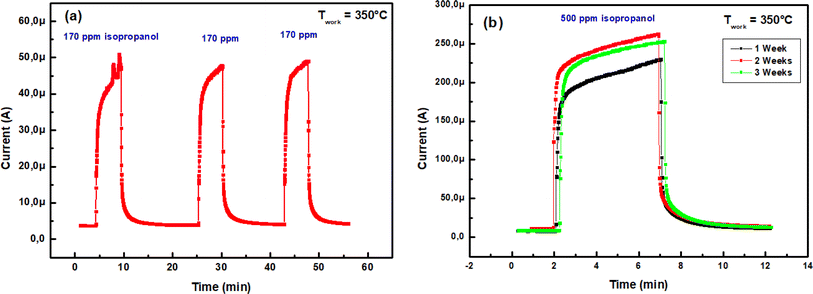 | ||
| Fig. 10 (a) Reproducibility of the In2S3 sensor at 350 °C towards 170 ppm isopropanol vapor, (b) stability at 350 °C towards 500 ppm during three weeks. | ||
The performance metrics of this new type of In2S3-based isopropanol sensing material prepared by simple spray pyrolysis were compared with other similar works published in the literature shown in Table 2. These results reveal that the best detection limit is found in this work. Moreover, the sensing properties of the In2S3 sensor are encouraging to further study to enhance the selectivity of the sensor as detailed in the following text.
| Material | T (°C) | Concentration (ppm) | Response | τresp/τrec (s) | LOD (ppb) | Year | Ref. |
|---|---|---|---|---|---|---|---|
| a Response = Rair/Rgas.b Response = Rgas/Rair.c Response = (Rair − Rgas)/Rair. | |||||||
| NiO/NiCoxFe2−xO4 | 183.5 | 100 | 11.2a | —/— | — | 2023 | 36 |
| rGO-ZnO nanofibers | 225 | 50 | 23.2a | 14/39 | 2023 | 37 | |
| Fe-doped ZnO nanoneedles | 275 | 5 | 23.6a | 51/762 | 250 | 2021 | 38 |
| ErFeO3 | 270 | 100 | 21b | 6/25 | 2000 | 2021 | 39 |
| ZnMn2O4 nanoparticles | 250 | 100 | 0.99c | 23/70 | 666 | 2021 | 40 |
| ZnSnO3 nanospheres | 200 | 10 | 10.3b | 500 | 2020 | 41 | |
| Double-shelled SnO2 cubes | 180 | 100 | 14.5a | 1/33 | — | 2019 | 42 |
| In2S3 nanoparticles | 350 | 170 | 11.7a | 113/42 | 162 | 2024 | This work |
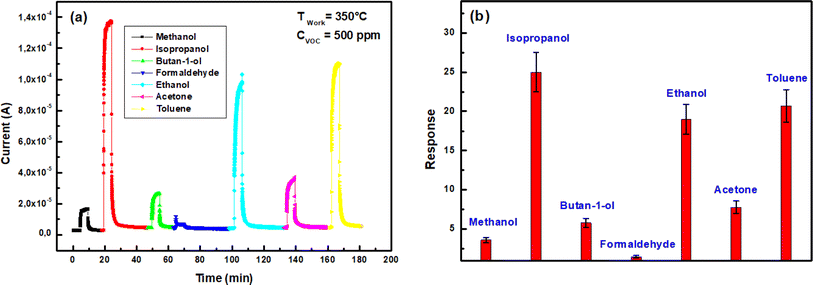 | ||
| Fig. 11 (a) Transient current change of In2S3 sensor at 350 °C towards different VOCs for 500 ppm concentration, (b) sensing response to 500 ppm VOC at 350 °C. | ||
We note a cross-responses between isopropanol, ethanol and toluene as shown in Fig. 11(b). Despite the higher response to isopropanol there was poor selectivity. Hence, at present, In2S3 sensor's selectivity cannot be assured. In order to solve this problem and achieve isopropanol recognition, we came up with the idea of applying linear discriminant analysis (LDA) to features arising from transient current change measurements. Indeed, LDA is a graphical data analysis method aimed at identifying the most representative trends in space that capture the interconnections among the selected measurement variables.45
3.3 Linear discriminant analysis for real time selectivity
Linear Discriminant Analysis (LDA) is a widely-used and straightforward statistical algorithm.46,47 It operates by creating vectors of linear combinations of features associated with individuals, aiming to maximize the variance between different classes while minimizing the variance within the same class. The data matrix for LDA consists of rows representing individual names and columns corresponding to their respective features. LDA works with a static database and is categorized as a supervised machine learning. In our study, we focused on examining the transient response of the sensor during the injection of target steam. We have identified and extracted key features from this system, which will be discussed in detail in the following section.
 | (10) |
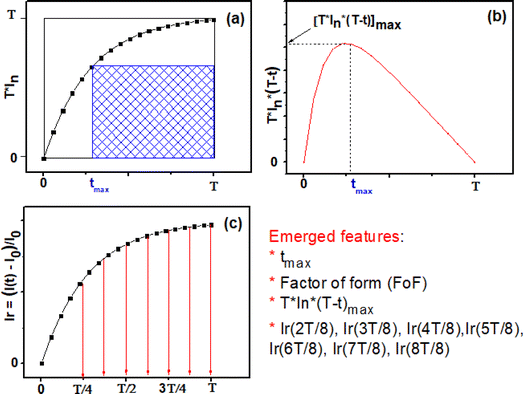
Fig. 12(a) illustrates the time-dependent normalized and squared response, T·In, within the interval [0, T]. Furthermore, Fig. 12(b) depicts a distinct curve derived from the normalized response using the subsequent expression:
| P(t) = [T·In(t)·(T − t)] | (11) |
It is observed that P(t) reaches its peak at a specific time instant, denoted as tmax, which can indirectly reflect the kinetics of the chemical reaction of the target gas on the surface. The value of tmax is correlated with the normalized and squared response depicted in Fig. 12(a), as it signifies the point crucial for determining the factor of form (FoF), as defined by the ensuing formula:
 | (12) |
Visually, the FoF is represented by the ratio of the blue shaded area to the total square area (T2), as illustrated in Fig. 12(a).
In addition, the relative response Ir(t) is expressed as follow:
 | (13) |
Subsequently, through the execution of the computer code, we adeptly extract 10 features, specifically: tmax, FoF, [T·In·(T − t)]max, the relative responses Ir(t) relating at instants (15 s, 22.5 s, 30 s, 37.5 s, 45 s, 52.5 s, 60 s).
This enabled us to construct a labeled database for conducting linear discriminant analysis.
• It maximizes the separation between the centroids of each cluster projected onto this line, thereby increasing the between-clusters distance.
• It minimizes the distance of observations from their respective centroids, thereby reducing within-cluster variance.
The classical LDA method is extensively utilized across various applications in a conventional manner, typically interpreted through a standard subspace discrimination algorithm for binary classification problems. By assembling a dataset derived from a vector matrix comprising two classes, we can calculate the between-class scatter matrix SB and the within-class scatter matrix SW using eqn (14) and (18) respectively.45–50
 | (14) |
 | (15) |
 | (16) |
 | (17) |
 | (18) |
The objective in LDA is to determine the optimal projection vector W. This vector W, responsible for space transformation, is obtained for dimensionality reduction by solving the following Rayleigh quotient:45–50
 | (19) |
| SW−1SBV = λV | (20) |
| |SW−1SB − λI| = 0 | (21) |
| W = SW−1(μ1 − μ2) | (22) |
Supervised analysis involves integrating the learned features of VOCs with the database to confirm their belonging, thus determining their classification into one of two classes. Therefore, the outputs are binary, represented as either 0 or 1. This enables us to choose isopropanol for its separation from the other VOCs. Subsequently, we establish the projection vector that constitutes the learning outcome. To achieve this, we utilized a matrix comprising 11 measurements, encompassing five concentrations ranging from 170 to 850 ppm for isopropanol and a single concentration of 500 ppm for each remaining volatile compound (ethanol, methanol, acetone, formaldehyde, butan-1-ol and toluene). Each measurement correlates with ten features extracted from the transient response occurring before reaching a steady state (0 < t < T = 1 min). Initially, we partitioned our supervised measurements into two groups: the first group comprised solely of isopropanol, while the second group encompassed the remaining six VOCs.
The process of automating the Linear Discriminant Analysis (LDA) algorithm is outlined in the flowchart depicted in Fig. 13(a) and (b), which illustrates all the computational steps involved and the test procedure for the isopropanol target. Given that LDA is a supervised technique, individual test data cannot be incrementally added to the existing database. Additionally, our approach is constrained to classifying into two distinct groups, resulting in a binary outcome (yes/no). For positive classifications, we can reference the isopropanol concentration using the calibration curve provided in Fig. 9(b).
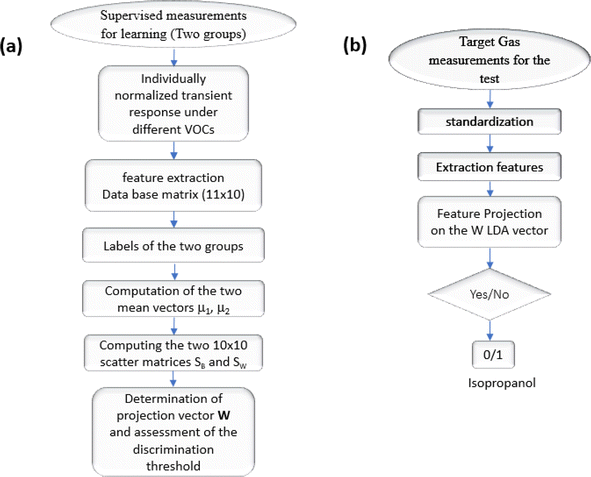 | ||
| Fig. 13 (a) Flowchart showing the steps of automatically pick out isopropanol molecules, (b) test procedure for the isopropanol target. | ||
The outcome was remarkably conclusive, as depicted in Fig. 14(a), enabling us to establish a separation threshold of 2.27 × 10¹⁰ along the LDA projection axis for these two groups.
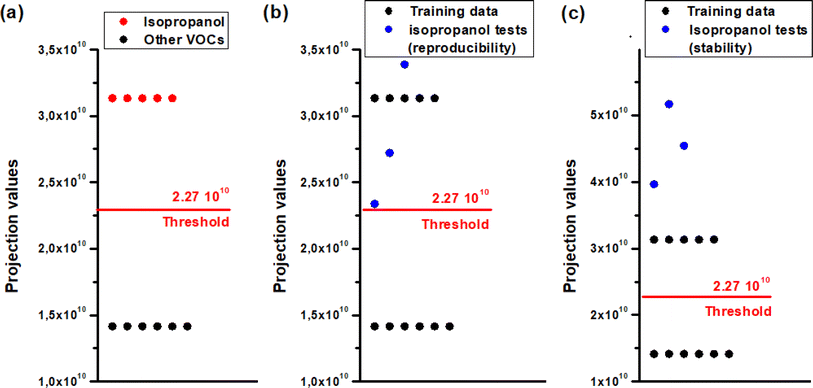 | ||
| Fig. 14 LDA outputs for identifying isopropanol vapor (a) training data, (b) isopropanol reproducibility test, (c) isopropanol stability test. | ||
To authenticate our separation method, we conducted numerous tests involving isopropanol. We have processed the measurements depicted in Fig. 10(a) and (b) using code to extract the transient features described in the preceding paragraph. These features were subsequently projected onto the axis defined by the vector W (eqn (22)), which was derived from the learning outputs through the LDA method. Fig. 14(b) and (c) illustrates the LDA outcomes for the repeatability test conducted over three consecutive cycles and the stability test spanning three weeks, respectively. It is noteworthy that the detected isopropanol vapor aligns closely with its designated group in both tests.
Practical implementation can be done by volunteers who participate by providing breath samples in accordance with the biomedical research ethics protocol. Each volunteer should breathe deeply into the collection bag using the mouthpiece, making sure to do so before eating or drinking and after rinsing their mouth with clean water. The bag must be equipped with a tight check valve to ensure that only exhaled air flows into the bag and to prevent any outside air from entering. Breath samples will be collected in triplicate and immediately transferred to the sensor networks by pumping the contents of each bag for 5 minutes at a specified rate.
4. Conclusion
This work is focused on the integration of In2S3 material as an isopropanol sensor. The latter is relatively inexpensive compared to other advanced materials commonly used in sensor technology. Its cost-effectiveness, combined with its promising performance characteristics, makes it an attractive option for large-scale implementation in isopropanol detection for lung cancer diagnostics. Using the spray technique, we deposited In2S3 layers on SiO2/Si substrates with inter-digitized platinum electrodes. The refinement of XRD patterns for In2S3 films using the Pseudo-Voigt method demonstrates a strong agreement between calculated and observed intensities. The lattice parameters for cubic α-In2S3 were determined as a = b = c = 10.7189 Å, with the space group identified as Fd![[3 with combining macron]](https://www.rsc.org/images/entities/char_0033_0304.gif) m. SEM analysis indicates that the surface of the α-In2S3 thin film is relatively uniform, with crystallites coalescing to cover the surface. The particle size distribution falls within the range of 40–85 nm. AFM observations reveal a disrupted surface morphology characterized by randomly oriented crystallites, resulting in a rough surface with an RMS surface roughness measuring approximately 13 nm. The isopropanol sensing response versus working temperature shows an optimal temperature around 400 °C. The response of the material increases from 12 to 34 by varying isopropanol concentration from 170 to 850 ppm at 350 °C. The sensitivity was found to be 0.034 ppm−1. The sensor reveals good reproducibility and stability. Selectivity was strengthened via LDA mathematic tool by introducing genius features from transient response. The result ensures very good recognition of isopropanol.
m. SEM analysis indicates that the surface of the α-In2S3 thin film is relatively uniform, with crystallites coalescing to cover the surface. The particle size distribution falls within the range of 40–85 nm. AFM observations reveal a disrupted surface morphology characterized by randomly oriented crystallites, resulting in a rough surface with an RMS surface roughness measuring approximately 13 nm. The isopropanol sensing response versus working temperature shows an optimal temperature around 400 °C. The response of the material increases from 12 to 34 by varying isopropanol concentration from 170 to 850 ppm at 350 °C. The sensitivity was found to be 0.034 ppm−1. The sensor reveals good reproducibility and stability. Selectivity was strengthened via LDA mathematic tool by introducing genius features from transient response. The result ensures very good recognition of isopropanol.
Data availability
The datasets generated during and/or analyzed during the current study are available from corresponding author on reasonable request.Author contributions
Conceptualization: R. Souissi, B. Bouricha. Data curation: R. Souissi, B. Bouricha. Formal analysis: R. Souissi, B. Bouricha, N. Ihzaz. Methodology: R. Souissi, B. Bouricha. Validation: R. Souissi, B. Bouricha, N. Ihzaz, N. Bouguila, M. Abderrabba. Writing – original draft: R. Souissi, B. Bouricha, N. Ihzaz. Writing – review & editing: N. Bouguila, M. Abderrabba.Conflicts of interest
There are no conflicts to declare.Acknowledgements
This work was supported by Tunisian Ministry of Higher Education and Scientific Research. The authors would like to thank C. Vazquez Vasquez (Faculty of Chemistry, University of Santiago de Compostela, Spain) for the AFM and SEM measurements. We thank Professor M. Bendahan from the University of Aix-Marseille in France for providing the substrate.References
- C. Allemani, T. Matsuda, V. Di Carlo, R. Harewood, M. Matz and M. Nikšić, et al., Global surveillance of trends in cancer survival 2000–14 (CONCORD-3): analysis of individual records for 37 513 025 patients diagnosed with one of 18 cancers from 322 population-based registries in 71 countries, Lancet, 2018, 391(10125), 1023–1075, DOI:10.1016/S0140-6736(17)33326-3.
- A. Amann, G. Poupart, S. Telser, M. Ledochowski, A. Schmid and S. Mechtcheriakov, Applications of breath gas analysis in medicine, Int. J. Mass Spectrom., 2004, 239(2–3), 227–233, DOI:10.1016/j.ijms.2004.08.010.
- B. Buszewski, M. Kęsy, T. Ligor and A. Amann, Human exhaled air analytics: biomarkers of diseases, Biomed. Chromatogr., 2007, 21(6), 553–566, DOI:10.1002/bmc.835.
- P. J. Mazzone, Analysis of Volatile Organic Compounds in the Exhaled Breath for the Diagnosis of Lung Cancer, J. Thorac. Oncol., 2008, 3(7), 774–780, DOI:10.1097/JTO.0b013e31817c7439.
- J. Rudnicka, M. Walczak, T. Kowalkowski, T. Jezierski and B. Buszewski, Determination of volatile organic compounds as potential markers of lung cancer by gas chromatography–mass spectrometry versus trained dogs, Sens. Actuators, B, 2014, 202, 615–621, DOI:10.1016/j.snb.2014.06.006.
- W. Li, Y. Liu, Y. Liu, S. Cheng and Y. Duan, Exhaled isopropanol: new potential biomarker in diabetic breathomics and its metabolic correlations with acetone, RSC Adv., 2017, 7(28), 17480–17488, 10.1039/C7RA00815E.
- S. Lugo-Loredo, Y. Peña-Méndez, M. Calixto-Rodriguez, S. Messina-Fernández, A. Alvarez-Gallegos and A. Vázquez-Dimas, et al., Indium sulfide thin films as window layer in chemically deposited solar cells, Thin Solid Films, 2014, 550, 110–113, DOI:10.1016/j.tsf.2013.10.115.
- J. Trigo, B. Asenjo, J. Herrero and M. Gutiérrez, Optical characterization of In2S3 solar cell buffer layers grown by chemical bath and physical vapor deposition, Sol. Energy Mater. Sol. Cells, 2008, 92(9), 1145–1148, DOI:10.1016/j.solmat.2008.04.002.
- R. Souissi, N. Bouguila and A. Labidi, Ethanol sensing properties of sprayed β-In2S3 thin films, Sens. Actuators, B, 2018, 261, 522–530, DOI:10.1016/j.snb.2018.01.175.
- R. Souissi, N. Bouguila, M. Bendahan, K. Aguir, T. Fiorido and M. Abderrabba, et al., Ozone sensing study of sprayed β-In2S3 thin films, J. Alloys Compd., 2022, 900, 163513, DOI:10.1016/j.jallcom.2021.163513.
- C. Xing, Z. Wu, D. Jiang and M. Chen, Hydrothermal synthesis of In 2 S 3/g-C 3 N 4 heterojunctions with enhanced photocatalytic activity, J. Colloid Interface Sci., 2014, 433, 9–15, DOI:10.1016/j.jcis.2014.07.015.
- J. Chen, W. Liu and W. Gao, Tuning photocatalytic activity of In 2 S 3 broadband spectrum photocatalyst based on morphology, Appl. Surf. Sci., 2016, 368, 288–297, DOI:10.1016/j.apsusc.2016.02.008.
- J. Walker, P. Karnati, S. A. Akbar and P. A. Morris, Selectivity mechanisms in resistive-type metal oxide heterostructural gas sensors, Sens. Actuators, B, 2022, 355, 131242, DOI:10.1016/j.snb.2021.131242.
- A. Ponzoni, C. Baratto, N. Cattabiani, M. Falasconi, V. Galstyan and E. Nunez-Carmona, et al., Metal Oxide Gas Sensors, a Survey of Selectivity Issues Addressed at the SENSOR Lab, Brescia (Italy), Sensors, 2017, 17(4), 714, DOI:10.3390/s17040714.
- R. Souissi, N. Bouguila, M. Bendahan, T. Fiorido, K. Aguir and M. Kraini, et al., Highly sensitive nitrogen dioxide gas sensors based on sprayed β-In2S3 film, Sens. Actuators, B, 2020, 319, 128280, DOI:10.1016/j.snb.2020.128280.
- S. Kumar and T. T. John, Quick surface adsorption and sensing of ammonia at room temperature by In2S3 thin films, Appl. Surf. Sci., 2023, 620, 156816, DOI:10.1016/j.apsusc.2023.156816.
- Y. Chen, X. Xiong, J. Nie, S. Li, Z. Zhu and L. Cao, et al., Co9S8@In2S3 hetero-nanostructures as highly sensitive and selective triethylamine sensor, J. Alloys Compd., 2023, 935, 168158, DOI:10.1016/j.jallcom.2022.168158.
- Y. Cheng, Z. Li, T. Tang, K. Xu, H. Yu and X. Tao, et al., 3D micro-combs self-assembled from 2D N-doped In2S3 for room-temperature reversible NO2 gas sensing, Appl. Mater. Today, 2022, 26, 101355, DOI:10.1016/j.apmt.2021.101355.
- C. Zang, H. Zhou, K. Ma, Y. Yano, S. Li and H. Yamahara, et al., Electronic nose based on multiple electrospinning nanofibers sensor array and application in gas classification, Front. Sens., 2023, 4, 1170280, DOI:10.3389/fsens.2023.1170280.
- M. Kraini, N. Bouguila and J. El Ghoul, Nickel doping effect on properties of sprayed In2S3 films, Indian J. Phys., 2018, 92(8), 989–997, DOI:10.1007/s12648-018-1195-3.
- J. Rodríguez-Carvajal, Recent advances in magnetic structure determination by neutron powder diffraction, Phys. B, 1993, 192(1–2), 55–69, DOI:10.1016/0921-4526(93)90108-I.
- M. El-Nahass, B. Khalifa, H. Soliman and M. Seyam, Crystal structure and optical absorption investigations on β-In2S3 thin films, Thin Solid Films, 2006, 515(4), 1796–1801, DOI:10.1016/j.tsf.2006.06.036.
- S. Gallego-Parra, Ó. Gomis, R. Vilaplana, V. P. Cuenca-Gotor, D. Martínez-García and P. Rodríguez-Hernández, et al., Pressure-induced order–disorder transitions in β-In2S3: an experimental and theoretical study of structural and vibrational properties, Phys. Chem. Chem. Phys., 2021, 23(41), 23625–23642, 10.1039/D1CP02969J.
- L. Liu, W. Xiang, J. Zhong, X. Yang, X. Liang and H. Liu, et al., Flowerlike cubic β-In2S3 microspheres: Synthesis and characterization, J. Alloys Compd., 2010, 493(1–2), 309–313, DOI:10.1016/j.jallcom.2009.12.089.
- P. Pistor, J. M. Merino Álvarez, M. León, M. di Michiel, S. Schorr and R. Klenk, et al., Structure reinvestigation of α-, β- and γ-In2S3, Acta Crystallogr., Sect. B: Struct. Sci., Cryst. Eng. Mater., 2016, 72(3), 410–415, DOI:10.1107/S2052520616007058.
- J. Raj Mohamed and L. Amalraj, Effect of precursor concentration on physical properties of nebulized spray deposited In2S3 thin films, J. Asian Ceram. Soc., 2016, 4(3), 357–366, DOI:10.1016/j.jascer.2016.07.002.
- M. Khalaf Salman, S. Asgary and S. Tehrani-Nasab, Effect of different dopants on the structural and physical properties of In2S3 thin films: a review, J. Mater. Sci., 2023, 58(30), 12143–12157, DOI:10.1007/s10853-023-08777-w.
- N. Barsan and U. Weimar, J. Electroceram., 2001, 7(3), 143–167, DOI:10.1023/A:1014405811371.
- S. Yan and Q. Wu, A novel structure for enhancing the sensitivity of gas sensors – α-Fe2O3 nanoropes containing a large amount of grain boundaries and their excellent ethanol sensing performance, J. Mater. Chem. A, 2015, 3(11), 5982–5990, 10.1039/C4TA06861K.
- R. Xing, L. Xu, J. Song, C. Zhou, Q. Li and D. Liu, et al., Preparation and Gas Sensing Properties of In2O3/Au Nanorods for Detection of Volatile Organic Compounds in Exhaled Breath, Sci. Rep., 2015, 5(1), 10717, DOI:10.1038/srep10717.
- O. Lupan, V. Postica, J. Gröttrup, A. K. Mishra, N. H. de Leeuw and J. F. C. Carreira, et al., Hybridization of Zinc Oxide Tetrapods for Selective Gas Sensing Applications, ACS Appl. Mater. Interfaces, 2017, 9(4), 4084–4099, DOI:10.1021/acsami.6b11337.
- R. Souissi, N. Bouguila, B. Bouricha, C. Vázquez-Vázquez, M. Bendahan and A. Labidi, Thickness effect on VOC sensing properties of sprayed In2S3 films, RSC Adv., 2020, 10(32), 18841–18852, 10.1039/D0RA01573C.
- T. Sekrafi, B. Bouricha, Z. Denden, S. Tascu, A. Labidi and H. Nasri, et al., Development of Cost-Effective, Selective and Stable Room Temperature Methanol Sensor, IEEE Sens. J., 2021, 21(3), 2589–2596, DOI:10.1109/JSEN.2020.3026825.
- J. Sun, L. Sun, N. Han, H. Chu, S. Bai and X. Shu, et al., rGO decorated CdS/CdO composite for detection of low concentration NO2, Sens. Actuators, B, 2019, 299, 126832, DOI:10.1016/j.snb.2019.126832.
- F. Annanouch, G. Bouchet, P. Perrier, N. Morati, C. Reynard-Carette and K. Aguir, et al., Hydrodynamic evaluation of gas testing chamber: Simulation, experiment, Sens. Actuators, B, 2019, 290, 598–606, DOI:10.1016/j.snb.2019.04.023.
- W. Wang, J. Han, C. Liu, J. Zhou, Y. Ma and X. Li, et al., An isopropanol sensor based on MOF-derived NiO/NiCoxFe2−xO4 porous nanocube with improved response and selectivity, J. Alloys Compd., 2023, 933, 167734, DOI:10.1016/j.jallcom.2022.167734.
- J. Zhang, G. Li, J. Liu, Y. Liu, R. Yang and L. Li, et al., Metal–organic framework-derived mesoporous rGO–ZnO composite nanofibers for enhanced isopropanol sensing properties, Sens. Actuators, B, 2023, 378, 133108, DOI:10.1016/j.snb.2022.133108.
- Y. Luo, A. Ly, D. Lahem, C. Zhang and M. Debliquy, A novel low-concentration isopropanol gas sensor based on Fe-doped ZnO nanoneedles and its gas sensing mechanism, J. Mater. Sci., 2021, 56(4), 3230–3245, DOI:10.1007/s10853-020-05453-1.
- T. T. Yang, S. Y. Ma, P. F. Cao, X. L. Xu, L. Wang and S. T. Pei, et al., Synthesis and characterization of ErFeO3 nanoparticles by a hydrothermal method for isopropanol sensing properties, Vacuum, 2021, 185, 110005, DOI:10.1016/j.vacuum.2020.110005.
- E. S. Guillén-López, F. López-Urías, E. Muñoz-Sandoval, M. Courel-Piedrahita, M. Sanchez-Tizapa and H. Guillén-Bonilla, et al., High performance isopropanol sensor based on spinel ZnMn2O4 nanoparticles, Mater. Today Commun., 2021, 26, 102138, DOI:10.1016/j.mtcomm.2021.102138.
- Y. Yin, Y. Shen, P. Zhou, R. Lu, A. Li and S. Zhao, et al., Fabrication, characterization and n-propanol sensing properties of perovskite-type ZnSnO3 nanospheres based gas sensor, Appl. Surf. Sci., 2020, 509, 145335, DOI:10.1016/j.apsusc.2020.145335.
- H. Sun, C. Zhang, Y. Peng and W. Gao, Synthesis of double-shelled SnO2 hollow cubes for superior isopropanol sensing performance, New J. Chem., 2019, 43(12), 4721–4726, 10.1039/C9NJ00292H.
- R. Jaisutti, M. Lee, J. Kim, S. Choi, T. Ha and J. Kim, et al., Ultrasensitive Room-Temperature Operable Gas Sensors Using p-Type Na:ZnO Nanoflowers for Diabetes Detection, ACS Appl. Mater. Interfaces, 2017, 9(10), 8796–8804, DOI:10.1021/acsami.7b00673.
- V. Siril, K. Jasmi, T. AntoJohny and K. Madhusoodanan, Investigation of thickness effect on NO2 gas sensing properties of ZnO/Na thin films, Mater. Today: Proc., 2023, 76, 365–371, DOI:10.1016/j.matpr.2022.11.422.
- X. Jin, M. Zhao, T. W. S. Chow and M. Pecht, Motor Bearing Fault Diagnosis Using Trace Ratio Linear Discriminant Analysis, IEEE Trans. Ind. Electron., 2014, 61(5), 2441–2451, DOI:10.1109/TIE.2013.2273471.
- D. Yu and B. Xiang, Discovering topics and trends in the field of Artificial Intelligence: Using LDA topic modeling, Expert Syst. Appl., 2023, 225, 120114, DOI:10.1016/j.eswa.2023.120114.
- Y. Mo, G. Kontonatsios and S. Ananiadou, Supporting systematic reviews using LDA-based document representations, Syst. Rev., 2015, 4(1), 172, DOI:10.1186/s13643-015-0117-0.
- R. Souissi, B. Bouricha, N. Bouguila, L. El Mir, A. Labidi and M. Abderrabba, Chemical VOC sensing mechanism of sol–gel ZnO pellets and linear discriminant analysis for instantaneous selectivity, RSC Adv., 2023, 13(30), 20651–20662, 10.1039/d3ra03042c.
- H. Li, D. Luo, Y. Sun and H. GholamHosseini, Classification and Identification of Industrial Gases Based on Electronic Nose Technology, Sensors, 2019, 19(22), 5033, DOI:10.3390/s19225033.
- Y. Li, B. Liu, Y. Yu, H. Li, J. Sun and J. Cui, 3E-LDA, ACM Trans. Knowl. Discov. Data, 2021, 15(4), 1–20, DOI:10.1145/3442347.
| This journal is © The Royal Society of Chemistry 2024 |

