 Open Access Article
Preparation of a CPVC composite loose nanofiltration membrane based on plant polyphenols for effective dye wastewater treatment
Noor Khatoon a,
Nadir Alib,
Sagar Alic,
Zhang Chena,
Wang Jun*a and
Honghai Yang*d
aCollege of Environmental Science and Engineering, Donghua University, Shanghai, 201620, China. E-mail: wangj@dhu.edu.cn
bDepartment of Textile Engineering, Mehran University of Engineering & Technology, Jamshoro, 76060, Pakistan
cDepartment of Environmental Engineering, Mehran University of Engineering & Technology, Jamshoro, 76060, Pakistan
dDepartment of Civil Engineering, Donghua University, Shanghai, 201620, China. E-mail: yhh@dhu.edu.cn
First published on 24th July 2024
Abstract
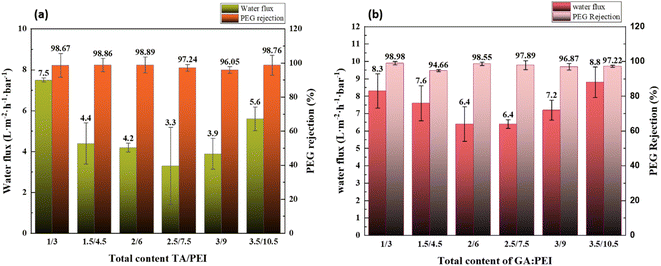
The textile industry's high-salinity wastewater presents a significant difficulty for fractioning salts and dyes. To fractionate the dyes and salts, a high-performance CPVC composite loose nanofiltration membrane (LNM) was fabricated by interfacial polymerization. The organic phase was obtained by crosslinking polyethylenimine (PEI) with tannic acid (TA) and gallic acid (GA) using TMC. The resultant composite LNM performance was enhanced by adjusting the coating parameters, which included TA and GA concentrations as well as coating time. The study examined the effects of the total content of TA/PEI and GA/PEI concentrations on the chemical structure, surface roughness, and microstructure of the selective layer of LNM using SEM, AFM, FTIR, and water contact angle measurements. It also investigated the filtration performance of the membrane's selective layer, including pure water flux, PEG800 rejection rate, and membrane fouling analysis. However, the resultant membrane treated simulated reactive black 5 (RB5) dye wastewater. When the total content of TA/PEI is 4 kg L−1, the permeability of pure water flux is high at 7.5 L per m2 per h per bar when the total content of GA/PEI is 14 kg L−1 and the pure water flux is high at 8.8 L per m2 per h per bar. The overall PEG800 rejection rates were 97–98.98%. The optimal TA![[thin space (1/6-em)]](https://www.rsc.org/images/entities/char_2009.gif) :
:![[thin space (1/6-em)]](https://www.rsc.org/images/entities/char_2009.gif) PEI ratios reached a good pure water permeability up to 6.4 L per (m2 per h per bar) with a high rejection rate of 99.69% for a ratio 1/3 to dye, and GA
PEI ratios reached a good pure water permeability up to 6.4 L per (m2 per h per bar) with a high rejection rate of 99.69% for a ratio 1/3 to dye, and GA![[thin space (1/6-em)]](https://www.rsc.org/images/entities/char_2009.gif) :
:![[thin space (1/6-em)]](https://www.rsc.org/images/entities/char_2009.gif) PEI ratios reached a good water permeability at 5.5 and 6.5 L per (m2 per h per bar) with rejection rates of 99.21% and 98.88% for ratio 1/3 and 3.5/10.5 for simulated RB5 dye, and the NaCl retention rate gradually decreased from 4% to 3%. The resultant LNM demonstrated promising applications in dye and salt fractionation.
PEI ratios reached a good water permeability at 5.5 and 6.5 L per (m2 per h per bar) with rejection rates of 99.21% and 98.88% for ratio 1/3 and 3.5/10.5 for simulated RB5 dye, and the NaCl retention rate gradually decreased from 4% to 3%. The resultant LNM demonstrated promising applications in dye and salt fractionation.
1. Introduction
Concern over the lack of clean water resources is spreading around the world.1 An estimated 67% of the world's population is predicted to face water stress by 2025.2 Meanwhile, the excessive release of hazardous dye-containing textile wastewater into the environment has drawn a lot of attention.3 The effluent from textiles typically comprises sodium sulfate (Na2SO4) or sodium chloride (NaCl).4,5 Conventional techniques like chemical oxidation, absorption, and coagulation often lead to low separation efficiency, resource waste, and secondary pollution.6 Upgrading is indicated for efficient recovery and cyclic use of high-value-added commodities.7 Consequently, if this effluent is not handled properly, it will seriously harm both the environment and people.Membrane technologies have been explored as a viable option for wastewater treatment that is sustainable due to their various benefits, including high separation efficiency, minimal energy use, and flexibility in operations.8–15 As one of the common membrane technologies, nanofiltration (NF) has been crucial in the removal of heavy metals from wastewater and pharmaceutical reclamation.16,17 The pore size of NF membranes was typically between 0.5 and 2.0 nm, which made it possible for the membranes to efficiently remove organic materials or multivalent salts with molecular weights between 200 and 1000 Da.18,19 To separate inorganic salts and organic molecules with less pressure and more flow, loose nanofiltration membranes (LNMs), a form of pressure-driven membrane, are an alternative to NF developed in 2004, according to Van der Bruggen et al.20–23
Compared to a typical TFC NF membrane, composite LNMs had a looser skin layer, which allowed for better permeability and effective salt permeation while maintaining a high rejection rate for organic dyes.16,17,20,24–28 The aforementioned skin layer was attempted to be obtained using interfacial polymerization.29–31 In order to loosen the skin layer, the focus of these experiments was on developing extended monomers or adding suitable nanofillers. Even though significant advances were made in obtaining better loose nanofiller performance, several innate problems remained. These included the absence of efficient interactions between fillers and the matrix, the agglomeration of nanoparticles, and intricate pre-synthesis protocols for certain monomers.32 As such, the issue of developing straightforward and trustworthy methods for the preparation of long nanomaterials persists. Numerous LNMs have been described as a result of the advancement of membrane fabrication technology.33 Polymeric membranes were a common choice among them because of the vast variety of materials with various properties, low cost, and simplicity of manufacture.34 Plant polyphenol-inspired coatings enhance membrane surface stability and hydrophilicity by forming strong cross-links with membrane surfaces. This creates a dense network of chemical bonds, sealing the surface and enhancing adhesion. The concentration of plant polyphenols also impacts the selective layer of nanofiltration membranes, enhancing their separation capabilities. These compounds work synergistically, enhancing membrane stability and selectivity.
It has been strongly shown that polyphenols are an effective alternative for developing and modifying polymeric membranes.35–37 Because polyphenols naturally include either pyrogallol or catechol structures, they are useful reagents for surface engineering and functionalization. Tannic acid (TA), an affordable and easily obtainable polyphenol, has demonstrated flexibility in membrane production. TA can be used as a modifier of polymeric membranes,35,38,39 an addition in the casting solution of non-solvent-induced phase separation (NIPS),38,40,41 or even as a monomer during the IP procedure.42 TA can undergo oxidation to TA-quinone in alkaline conditions, subsequently engaging in reactions with amino groups through Michael addition/Schiff base reactions.22,43 These reactions find extensive applications in functional coating, surface immobilization, and selective layer development in aqueous environments.15,44–48 These characteristics enable TA to interact with amino monomers such as PIP and polyethyleneimine (PEI), producing products notably longer than those derived from PIP/PEI or TA alone. The extended polymer chains and slow diffusion rates of longer monomers impede the dense packing of the active layer, resulting in a looser active layer and larger pores after polymerization with TMC.49,50 However, no research has been published on the manufacture of composite CPVC loose nanofiltration membranes as basis materials with TA and GA added to aqueous phase monomers.
This work is inspired by the properties of plant polyphenols such as TA and GA. The study looks into the development and use of a CPVC composite loose nanofiltration membrane infused with plant polyphenols, such as tannic acid (TA) and gallic acid (GA), to treat dye wastewater. By combining CPVC, TA, and GA, the membrane gains improved capabilities for filtering dye molecules while preserving water permeability. This environmentally friendly strategy makes use of natural substances and appears to be a promising solution for tackling environmental issues caused by dye wastewater pollution. The study's findings emphasize the membrane's potential for efficient and sustainable wastewater treatment applications.
2. Materials and methods
2.1 Materials
Donghui Plasticizing Raw Materials Co., LTD. supplied chlorinated polyvinyl chloride (CPVC). N,N-Dimethylacetamide (DMAc, analytically pure), hydrogen peroxide (H2O2, 30%), n-hexane (C6H14, analytically pure), reactive black 5 dye (RB5), sodium chloride (NaCl, superior pure) was supplied by Sinopod Chemical Reagents Co., LTD. Gallic acid (Rowan's reagent); tannic acid, polyethyleneimine (PEI, relative molecular mass 1800), Tris-HCl buffer solution (pH = 8.5), trimesoyl chloride (TMC, 98%), polyethylene glycol (PEG800) was bought from Shanghai McLean Biochemical Technology Co., LTD.2.2 Instruments and characterization
The MSC cup ultrafilter (300 mL, Motorcycle Science Equipment Co., LTD) is used alongside a conductivity meter (DDS-11A, Shanghai Letchi Company, China). Also, a field emission scanning electron microscope (SEM, Model S-4800, Carl Zeiss, Germany), an atomic force microscope (AFM, Dimension Icon, Bruker, Germany), an Ultraviolet-visible spectrophotometer (UV-vis, UV-7504PC, Shimadzu, Japan), a Fourier infrared spectrometer (FTIR, Nicolet 6700, Thermo Fisher Technology Co., LTD.), a total organic carbon analyzer (TOC-5000A, Manmerbol GMBH, Germany), and a Contact Angle Gauge (Model SL200KS) are utilized for analysis.2.3 Preparation of composite loose nanofiltration membrane
TA/GA![[thin space (1/6-em)]](https://www.rsc.org/images/entities/char_2009.gif) : :![[thin space (1/6-em)]](https://www.rsc.org/images/entities/char_2009.gif) PEI PEI |
TA/GA (g L−1) | PEI (g L−1) | TMC (%) | Crosslinking time/min | Deposition time/h |
|---|---|---|---|---|---|
1![[thin space (1/6-em)]](https://www.rsc.org/images/entities/char_2009.gif) : :![[thin space (1/6-em)]](https://www.rsc.org/images/entities/char_2009.gif) 3 3 |
0.02 | 0.3 | 0.2 | 5 min | 1 h |
1.5![[thin space (1/6-em)]](https://www.rsc.org/images/entities/char_2009.gif) : :![[thin space (1/6-em)]](https://www.rsc.org/images/entities/char_2009.gif) 4.5 4.5 |
0.03 | 0.45 | 0.2 | 5 min | 1 h |
2![[thin space (1/6-em)]](https://www.rsc.org/images/entities/char_2009.gif) : :![[thin space (1/6-em)]](https://www.rsc.org/images/entities/char_2009.gif) 6 6 |
0.04 | 0.6 | 0.2 | 5 min | 1 h |
2.5![[thin space (1/6-em)]](https://www.rsc.org/images/entities/char_2009.gif) : :![[thin space (1/6-em)]](https://www.rsc.org/images/entities/char_2009.gif) 7.5 7.5 |
0.05 | 0.75 | 0.2 | 5 min | 1 h |
3![[thin space (1/6-em)]](https://www.rsc.org/images/entities/char_2009.gif) : :![[thin space (1/6-em)]](https://www.rsc.org/images/entities/char_2009.gif) 9 9 |
0.06 | 0.9 | 0.2 | 5 min | 1 h |
3.5![[thin space (1/6-em)]](https://www.rsc.org/images/entities/char_2009.gif) : :![[thin space (1/6-em)]](https://www.rsc.org/images/entities/char_2009.gif) 10.5 10.5 |
0.07 | 1.05 | 0.2 | 5 min | 1 h |
2.4 Characterization of CPVC composite loose nanofiltration membrane
Attenuated total reflection Fourier transform infrared spectrometer (ATR-FTIR) was used to analyze the chemical structure of the nanofiltration membrane and the functional groups of selective layers of the loose nanofiltration membrane. The surface and cross-sectional morphologies of the CPVC composite loose nanofiltration membrane were examined using scanning electron microscopy (SEM, Model S-4800). Furthermore, the atomic force microscope (AFM) was used to determine the surface microstructure and morphology of the samples.2.5 Hydrophilicity test of composite loose nanofiltration membrane
The hydrophilicity of the composite nanofiltration membrane was measured through a contact angle meter using the static droplet method, and the measurement results were recorded by Young–Laplace fitting. The hydrophilicity of the membrane is determined by measuring its water contact angle. The surface of the nanofiltration membrane is hydrophilic if the contact angle is less than 90° and hydrophobic if it is larger than 90°.2.6 Filtration performance test of CPVC composite LNF membrane
The performance of the membrane was evaluated on a pure water flux test and a molecular weight cut-off test. With an effective permeable area of 36.6 × 10⁻⁴ m2, the nanofiltration membrane was fixed in the ultrafiltration cup (MSC cup type) after being trimmed to the proper size. First, the membrane was pre-pressurized for 60 minutes at a pressure of 0.15 MPa using deionized water. Subsequently, the nanofiltration membrane's pure water flux was assessed at a pressure of 0.1 MPa, and the filtrate volume was recorded for one hour. Eqn (1) provides the calculation of the pure water flux.
 | (1) |
The molecular mass cutoff is when a substance's rejection rate reaches 90%, determining the molecular weight cutoff of a membrane. For a composite nanofiltration membrane, the molecular mass cutoff is 1 g L−1 of PEG800. The TOC analyzer was used to determine the concentration of PEG800 in the stock solution and filtrate. The PEG800 rejection rate was then computed using the following eqn (2):
 | (2) |
2.7 Membrane fouling analysis
Membrane fouling affects membrane-based separation performance in practical applications, negatively impacting permeability, use of energy, and durability. The membrane fouling was caused by RB5 dye adsorption and electrostatic attraction to the CPVC composite LNF membrane surface during the filtration of simulated RB5 dye wastewater. Higher membrane surface roughness led to increased RB5 dye adsorption and more severe fouling, resulting in higher filtration resistance (Rr + Rir), where Rr and Rir represent reversible and irreversible filtration resistance, respectively. If the membrane surface charge differs from the dye charge, electrostatic attraction increases fouling and resistance. RB5 dye carries a negative charge, so a positively charged membrane surface attracts it, increasing resistance. According to Darcy's law, eqn (3) is derived:
 | (3) |
ΔP is the transmembrane pressure (MPa), and μ is the solution's dynamic viscosity (Pa s). Rm denotes the intrinsic membrane resistance (m−1). Rir is the irreversible contamination resistance (m−1), whereas Rr is the reversible contamination resistance (m−1).
Using eqn (1) and (3), Rm, Rir, and Rr can be calculated as follows:
 | (4) |
 | (5) |
2.8 CPVC nanofiltration membrane simulation for RB5 and NaCl in dye wastewater
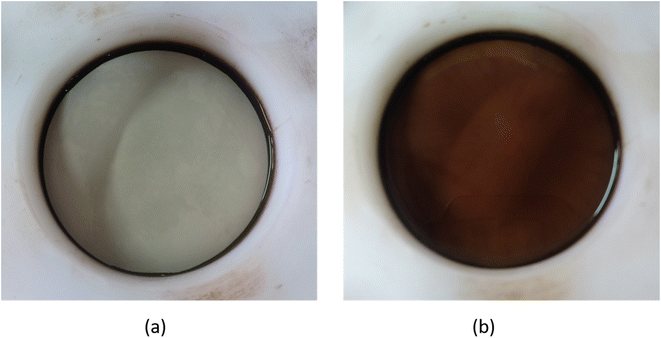
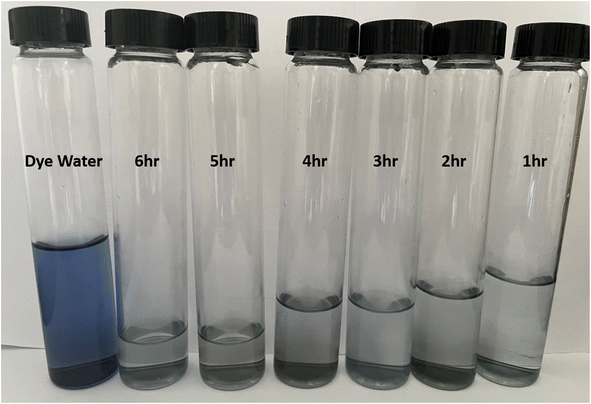
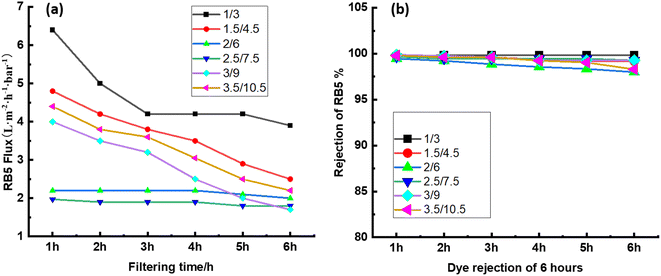
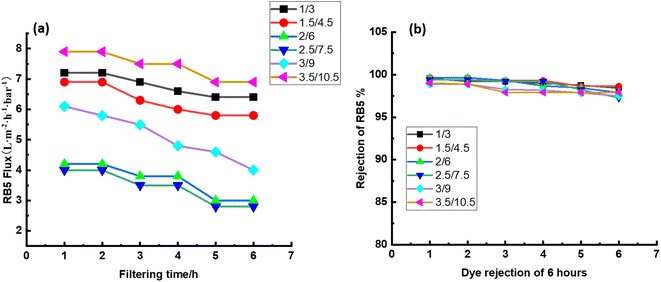
The methodologies used to determine the dye wastewater flux, dye, and salt rejection rates are identical to those used to determine the pure water flux and PEG800, respectively. Using a distilled water solution containing 0.1 g L−1 of RB5 and 0.05 g L−1 of NaCl, the simulated dye wastewater was treated. After 1 hour of pre-pressurization at 0.15 MPa for the CPVC composite loose nanofiltration membrane, the filtrate volume of the dye wastewater simulation was observed at 0.1 MPa and recorded hourly for six continuous hours. Eqn (1) was used to calculate the flux of dye wastewater. While eqn (2) was used to calculate the retention rate of salt and RB5 dye. A conductivity meter was used to determine the concentration of salt, and a UV-7504PC UV-visible spectrophotometer was used to measure the absorbance dye molecules at 593 nm of the RB5 in both the stock solution and filtrate. Filtration of dye wastewater for six hours can be seen in Fig. 2.3. Results and discussion
3.1 Formation and chemical structures of selective layer of CPVC composite LNF membrane
The chemical structure of the selective layer the of CPVC composite loose nanofiltration membrane is reflected in the ATR-FTIR spectra presented in Fig. 3. Fig. 3(a) shows the stretching vibration of the C–Cl group is responsible for the characteristic peak of the CPVC base membrane at 645 cm−1. In the composite loose nanofiltration membrane, the distinctive PEI peak at 2929 cm−1 disappears, which belongs to the amine peak. Additionally, it demonstrates that the composite CPVC loose nanofiltration membrane's surface forms polyamide (PA). It can be seen that the vibration peaks of the amine group and the phenolic hydroxyl group of TA/PEI disappear after 1700 cm−1. A new peak belongs to the benzene ring C![[double bond, length as m-dash]](https://www.rsc.org/images/entities/char_e001.gif) C resonance vibration, the amide C
C resonance vibration, the amide C![[double bond, length as m-dash]](https://www.rsc.org/images/entities/char_e001.gif) N overlap of tensile vibrations, and TMC and TA. The characteristic peak from 630 cm−1 to 3359 cm−1 belongs to the TA/PEI CPVC loose nanofiltration membrane.
N overlap of tensile vibrations, and TMC and TA. The characteristic peak from 630 cm−1 to 3359 cm−1 belongs to the TA/PEI CPVC loose nanofiltration membrane.
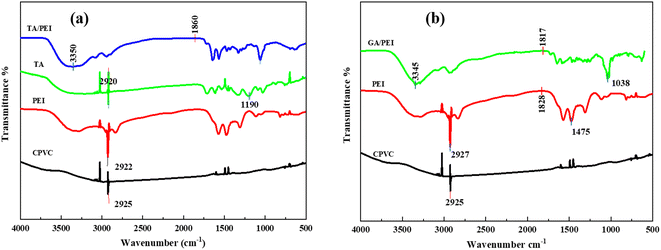 | ||
Fig. 3 (a) ATR-FTIR spectra of TA![[thin space (1/6-em)]](https://www.rsc.org/images/entities/char_2009.gif) : :![[thin space (1/6-em)]](https://www.rsc.org/images/entities/char_2009.gif) PEI CPVC composite loose nanofiltration membrane; (b) ATR-FTIR spectra of GA PEI CPVC composite loose nanofiltration membrane; (b) ATR-FTIR spectra of GA![[thin space (1/6-em)]](https://www.rsc.org/images/entities/char_2009.gif) : :![[thin space (1/6-em)]](https://www.rsc.org/images/entities/char_2009.gif) PEI CPVC composite loose nanofiltration membrane. PEI CPVC composite loose nanofiltration membrane. | ||
Fig. 3(b) shows the chemical structure of the selective layer of the CPVC/GA/PEI composite loose nanofiltration membrane as reflected in the ATR-FTIR spectra. The CPVC base membrane's distinctive peak at 645 cm−1 is caused by the stretching vibration of the C–Cl group. The amine peak is located at 2929 cm−1, where the characteristic PEI peak vanishes in the composite loose nanofiltration membrane. It can be seen that the vibration peaks of the amine group and the phenolic hydroxyl group of GA/PEI disappear after 1800 cm−1. It is most likely because there are no substantial functional group vibrations in that range that account for the straight appearance of the curves for both TA and GA after 1800 cm−1 in the ATR-FTIR spectra, which results in a reasonably flat baseline for both materials. Less prominent or noticeable peaks could also arise from diminished sensitivity or instrumental limitations in this high wavenumber range.51 Moreover, the concentration of TA and GA in the composite membrane or the techniques used to prepare the sample may result in weaker signals that merge with the background noise to give the illusion of being straight.52 This appearance may also be caused by overlapping peaks that the instrument is unable to adequately resolve. Comprehending these variables aids in elucidating the studied occurrences that were observed.
3.2 Morphology of CPVC composite LNF membrane
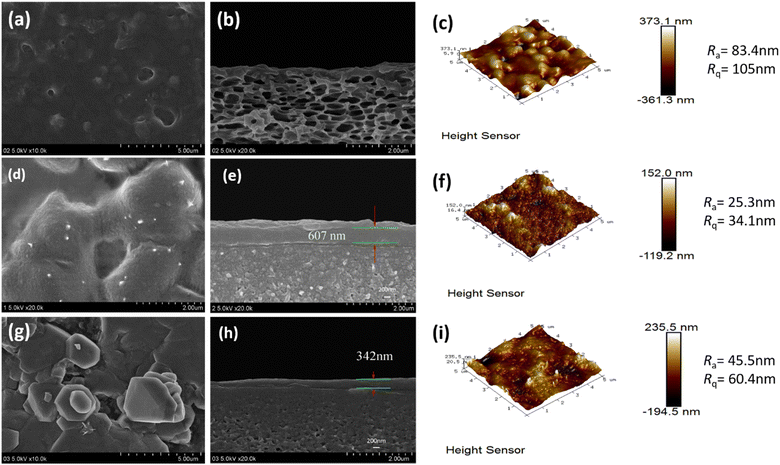
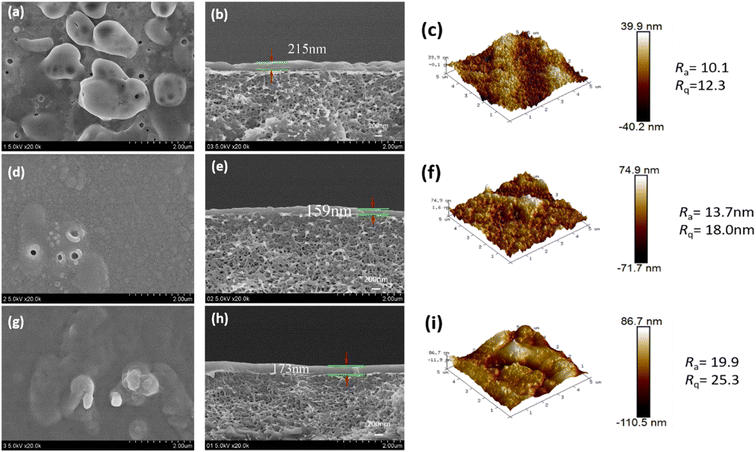
The cross-sectional microstructure and surface roughness of the CPVC composite LNM selective layer were characterized by FESEM and AFM images, as shown in Fig. 4 and 5. When the content of TA/PEI is higher, it leads to an increase in the surface roughness of the selection layer of the CPVC composite loose nanofiltration membrane. Along with this, the thickness of the selective layer also increases. As we can see in Fig. 4(a) and (b) at ratio 1![[thin space (1/6-em)]](https://www.rsc.org/images/entities/char_2009.gif) :
:![[thin space (1/6-em)]](https://www.rsc.org/images/entities/char_2009.gif) 3, when the total content of TA is less than at ratios 2.5
3, when the total content of TA is less than at ratios 2.5![[thin space (1/6-em)]](https://www.rsc.org/images/entities/char_2009.gif) :
:![[thin space (1/6-em)]](https://www.rsc.org/images/entities/char_2009.gif) 7.5 and 3
7.5 and 3![[thin space (1/6-em)]](https://www.rsc.org/images/entities/char_2009.gif) :
:![[thin space (1/6-em)]](https://www.rsc.org/images/entities/char_2009.gif) 9 in Fig. 4(d), (e) and (g), (h), the thickness of the selective layer is also increasing. This phenomenon arises due to tannic acid possessing a significantly higher hydroxyl content compared to gallic acid (GA). Moreover, TA, being a larger molecule with a higher molecular mass and hydroxyl content, tends to contribute to the formation of thicker selective layers in CPVC composite membranes. Consequently, during the reaction between tannic acid, polyethyleneimine (PEI), and trimesoyl chloride (TMC), more aggregates form on the membrane surface, consequently enhancing the membrane's roughness and causing a thickening of the selective layer.
9 in Fig. 4(d), (e) and (g), (h), the thickness of the selective layer is also increasing. This phenomenon arises due to tannic acid possessing a significantly higher hydroxyl content compared to gallic acid (GA). Moreover, TA, being a larger molecule with a higher molecular mass and hydroxyl content, tends to contribute to the formation of thicker selective layers in CPVC composite membranes. Consequently, during the reaction between tannic acid, polyethyleneimine (PEI), and trimesoyl chloride (TMC), more aggregates form on the membrane surface, consequently enhancing the membrane's roughness and causing a thickening of the selective layer.
When we come to the effects of GA/PEI on the surface roughness of the selective layer of the CPVC composite loose nanofiltration membrane. GA, on the other hand, may not contribute considerably to the creation of thicker selective layers due to its smaller molecular size, lower hydroxyl content, and molecular mass when compared to TA. The interaction of GA with PEI and TMC may not lead to as many aggregates on the membrane surface compared to TA, potentially resulting in a less pronounced increase in the membrane roughness and thickness of the selective layer. As we can see in Fig. 5(a) and (b), the thickness of the layer is less than in Fig. 5(d), (e) and (g), (h) because of the concentration of GA/PEI.
Size exclusion is one of the main methods of separation in nanofiltration membranes. Atomic force microscopy (AFM) and scanning electron microscopy (SEM) were used to examine the pore size distribution of the membranes. The pore diameters of the CPVC/TA/PEI and CPVC/GA/PEI membranes, as depicted in Fig. 4 and 5, are within the range that permits the passage of smaller ions, such as NaCl, while effectively allowing the rejection of dye molecules, such as reactive black 5.53
3.3 Hydrophilic characterization of CPVC composite LNF membrane
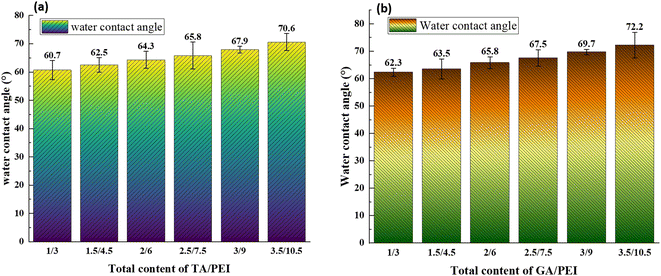
The surface hydrophilicity of the composite LNM is characterized by the water contact angle. The influence of water contact angle on the surface of the composite nanofiltration membrane is shown in Fig. 6. The hydrophilicity of the membrane surface decreased as the water contact angle increased with an increase in TA/PEI and the same with GA/PEI. Hence, the water contact angle on the surface of the membrane decreases; that is, the hydrophilicity of the surface of the membrane increases. The reason is that TA has a large number of carboxyl groups, which increases the hydrophilicity of the membrane surface.3.4 CPVC composite loose nanofiltration membrane filtration performance test
![[thin space (1/6-em)]](https://www.rsc.org/images/entities/char_2009.gif) :
:![[thin space (1/6-em)]](https://www.rsc.org/images/entities/char_2009.gif) PEI and GA
PEI and GA![[thin space (1/6-em)]](https://www.rsc.org/images/entities/char_2009.gif) :
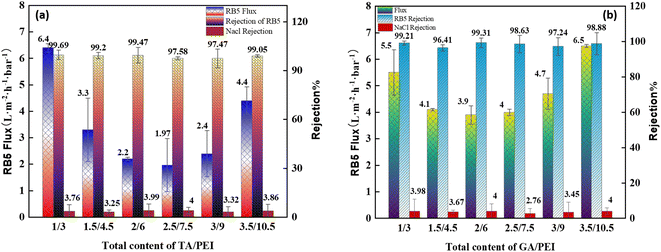
:![[thin space (1/6-em)]](https://www.rsc.org/images/entities/char_2009.gif) PEI on the filtration performance of CPVC composite loose nanofiltration membranes treating simulated RB5 dye wastewater are shown in Fig. 8(a) and (b). The coating parameters significantly affected the performance of the LNM. The filtration experiments used a 0.1 g L−1 CR aqueous solution. Previous research has explored the impact of average molecular weight and PEI percentage in coating solutions.54 As shown in Fig. 8(a), the flux of RB5 is increasing when the total content of TA/PEI is 4 kg L−1. As the total content of TA/PEI increases, the flux of the dye starts reducing, and the minimum flux of dye is at the total content of 10 kg L−1. However, as the total content reaches 12 kg L−1, it starts increasing again. Among these 6 concentrations, the highest flux rate is 6.4 L per (m2 per h per bar) when the total content of TA/PEI is 4 kg L−1, and it also has the highest rejection rate of 99.69%. The overall rejection rate of TA/PEI is 99%, and the NaCl retention rate gradually decreased from 4% to 3%. In Fig. 8(b), the flux of RB5 is increasing when the total content of GA/PEI is 4 kg L−1 and the flux is 5.5 L per (m2 per h per bar). Afterwards, as the total content of GA/PEI increases the flux of dye wastewater starts reducing and reaches the minimum flux rate at a total content of 8 kg L−1, which is 3.9 L per (m2 per h per bar). However, when the total content reaches 12 kg L−1, the flux of dye wastewater increases again and reaches the highest flux rate at 14 kg L−1, which is 6.5 L per (m2 per h per bar). The rejection rate of dye wastewater for GA/PEI is 97–99%. However, the flux of RB5 dye wastewater at all concentrations of GA
PEI on the filtration performance of CPVC composite loose nanofiltration membranes treating simulated RB5 dye wastewater are shown in Fig. 8(a) and (b). The coating parameters significantly affected the performance of the LNM. The filtration experiments used a 0.1 g L−1 CR aqueous solution. Previous research has explored the impact of average molecular weight and PEI percentage in coating solutions.54 As shown in Fig. 8(a), the flux of RB5 is increasing when the total content of TA/PEI is 4 kg L−1. As the total content of TA/PEI increases, the flux of the dye starts reducing, and the minimum flux of dye is at the total content of 10 kg L−1. However, as the total content reaches 12 kg L−1, it starts increasing again. Among these 6 concentrations, the highest flux rate is 6.4 L per (m2 per h per bar) when the total content of TA/PEI is 4 kg L−1, and it also has the highest rejection rate of 99.69%. The overall rejection rate of TA/PEI is 99%, and the NaCl retention rate gradually decreased from 4% to 3%. In Fig. 8(b), the flux of RB5 is increasing when the total content of GA/PEI is 4 kg L−1 and the flux is 5.5 L per (m2 per h per bar). Afterwards, as the total content of GA/PEI increases the flux of dye wastewater starts reducing and reaches the minimum flux rate at a total content of 8 kg L−1, which is 3.9 L per (m2 per h per bar). However, when the total content reaches 12 kg L−1, the flux of dye wastewater increases again and reaches the highest flux rate at 14 kg L−1, which is 6.5 L per (m2 per h per bar). The rejection rate of dye wastewater for GA/PEI is 97–99%. However, the flux of RB5 dye wastewater at all concentrations of GA![[thin space (1/6-em)]](https://www.rsc.org/images/entities/char_2009.gif) :
:![[thin space (1/6-em)]](https://www.rsc.org/images/entities/char_2009.gif) PEI is highest at the same concentrations as TA
PEI is highest at the same concentrations as TA![[thin space (1/6-em)]](https://www.rsc.org/images/entities/char_2009.gif) :
:![[thin space (1/6-em)]](https://www.rsc.org/images/entities/char_2009.gif) PEI, but the rejection of TA
PEI, but the rejection of TA![[thin space (1/6-em)]](https://www.rsc.org/images/entities/char_2009.gif) :
:![[thin space (1/6-em)]](https://www.rsc.org/images/entities/char_2009.gif) PEI is much better than that of GA
PEI is much better than that of GA![[thin space (1/6-em)]](https://www.rsc.org/images/entities/char_2009.gif) :
:![[thin space (1/6-em)]](https://www.rsc.org/images/entities/char_2009.gif) PEI. This is because of compared to gallic acid (GA), tannic acid has a substantially higher hydroxyl concentration. TA, being a larger molecule with a higher molecular mass and hydroxyl content, tends to contribute to the formation of thicker selective layers in CPVC composite membranes. In contrast, GA may not have a substantial effect on the development of larger selective layers because of its smaller molecular size, lower hydroxyl content, and lower molecular mass when compared to TA. The carbonyl groups in the PEI-TA layer can be attacked by nucleophiles and hydrolyzed using an acid or base catalyst. This could lead to increased permeability and a decrease in CR rejection by relaxing the skin layer.55 From the results, the best ratio of TA
PEI. This is because of compared to gallic acid (GA), tannic acid has a substantially higher hydroxyl concentration. TA, being a larger molecule with a higher molecular mass and hydroxyl content, tends to contribute to the formation of thicker selective layers in CPVC composite membranes. In contrast, GA may not have a substantial effect on the development of larger selective layers because of its smaller molecular size, lower hydroxyl content, and lower molecular mass when compared to TA. The carbonyl groups in the PEI-TA layer can be attacked by nucleophiles and hydrolyzed using an acid or base catalyst. This could lead to increased permeability and a decrease in CR rejection by relaxing the skin layer.55 From the results, the best ratio of TA![[thin space (1/6-em)]](https://www.rsc.org/images/entities/char_2009.gif) :
:![[thin space (1/6-em)]](https://www.rsc.org/images/entities/char_2009.gif) PEI is 1
PEI is 1![[thin space (1/6-em)]](https://www.rsc.org/images/entities/char_2009.gif) :
:![[thin space (1/6-em)]](https://www.rsc.org/images/entities/char_2009.gif) 3, whose flux as well as rejection rate are both high compared to other TA
3, whose flux as well as rejection rate are both high compared to other TA![[thin space (1/6-em)]](https://www.rsc.org/images/entities/char_2009.gif) :
:![[thin space (1/6-em)]](https://www.rsc.org/images/entities/char_2009.gif) PEI ratios. The optimal ratio from GA
PEI ratios. The optimal ratio from GA![[thin space (1/6-em)]](https://www.rsc.org/images/entities/char_2009.gif) :
:![[thin space (1/6-em)]](https://www.rsc.org/images/entities/char_2009.gif) PEI is 1/3 and 3.5/10.5, with 99.21% and 98.88% rejection rates and 5.5 and 6.5 L per (m2 per h per bar) flux rates, respectively.
PEI is 1/3 and 3.5/10.5, with 99.21% and 98.88% rejection rates and 5.5 and 6.5 L per (m2 per h per bar) flux rates, respectively.
3.5 Stability of CPVC composite LNF membrane in treating simulated RB5 dye wastewater
3.6 Membrane fouling analysis
Fig. 11(a) and (b) demonstrate the fluctuation of the sum of irreversible (Rir) and reversible (Rr) fouling resistance with TA/PEI and GA/PEI, respectively during the simulation of RB5 dye wastewater treatment by CPVC composite LNF membrane.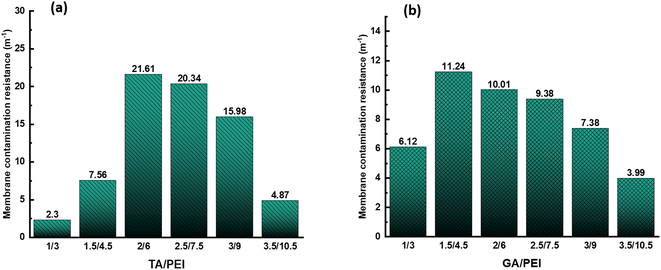 | ||
| Fig. 11 (a) Irreversible and reversible fouling resistance of TA/PEI CPVC composite LNF membrane; (b) irreversible and reversible fouling resistance of GA/PEI CPVC composite LNF membrane. | ||
Fig. 11(a) shows that when the total content of TA/PEI increases, the value of Rir + Rr first increases and got the highest value at ratio 2/6; after that, the value of Rir + Rr starts decreasing. The rise in Rir + Rr with an increase in TA/PEI content could be attributed to improved interaction or crosslinking between the TA/PEI molecules, resulting in greater resistance. However, excess TA/PEI may cause aggregation of the membrane selective layer, lowering the efficiency of the interactions and resulting in a decrease in Rir + Rr. While, as we can see in Fig. 11(b), the situation is the same. When the total content of GA/PEI increases, the value of Rir + Rr is also increasing initially, with the highest value at 1.5/4.5. Afterwards, the value of Rir + Rr start decreasing again. Hence, the initial increase followed by a decrease in Rir + Rr with increasing TA/PEI and GA/PEI content can be attributed to a balance between increased molecular interactions at lower ratios and the adverse effects of aggregation at higher ratios within the crosslinked network.
Long-term filtering tests were used to assess the membrane fouling resistance. The results demonstrate that the CPVC/GA/PEI and CPVC/TA/PEI membranes have a notable resistance to dye molecule fouling. Because hydrophilic surfaces are less likely to experience organic fouling, the hydrophilicity of the membranes—as demonstrated by measurements of the water contact angle (65°)—also helps to minimize fouling.56
A comparative analysis of the current CPVC composite LNF membrane's overall performance with that of other membranes that have been reported was carried out in light of the membrane's exceptional performance, and the results are presented in Table 2. Our CPVC composite membrane outperforms the majority of the other membranes listed, with a high dye rejection rate of 99.69%. Although competitive, the water flux is a little less than some others. Hence, we will continue to work on how to modify the permeability and hydrophilicity of membranes in our future work. This comparison places our work in the larger perspective of recent developments in membrane technology while also highlighting the efficacy of our membranes.
| Support membrane | Permeability (L per m2 per h![[thin space (1/6-em)]](https://www.rsc.org/images/entities/char_2009.gif) per per![[thin space (1/6-em)]](https://www.rsc.org/images/entities/char_2009.gif) bar) bar) |
Dye | Rejection (%) | Salt rejection (%) | Ref. |
|---|---|---|---|---|---|
| GA/PEI/PAN | 25.5 | Congo red | 97.1 | 5 NaCl | 57 |
| Sulfonated polyethylenimine (SPEI)-trimesoylchloride (TMC)/PSF | 26.0 | Congo red | 98 | 3.2 = NaCl | 58 |
| Nano-TiO2/PVA NF | 5.4 | Congo red | 94 | 15 = Na2SO4 | 59 |
| PVDF β-cyclodextrin | — | Brilliant green![[thin space (1/6-em)]](https://www.rsc.org/images/entities/char_2009.gif) : :![[thin space (1/6-em)]](https://www.rsc.org/images/entities/char_2009.gif) congo red congo red |
97.4 | NaCl = 15 | 60 |
| 96.4 | |||||
| PSF TMC/PIP, TA | — | Congo red![[thin space (1/6-em)]](https://www.rsc.org/images/entities/char_2009.gif) : :![[thin space (1/6-em)]](https://www.rsc.org/images/entities/char_2009.gif) rose bengal rose bengal |
99.4 | NaCl = 2.25 | 61 |
| 99.19 | |||||
| TMC/PEI, HACC, TiO2 | 9.1 | Reactive black 5 | 93.5 | NaCl = 1.2 | 62 |
| CPVC/TA/PEI | 6.4 | Reactive black 5 | 99.69 | NaCl = 3–4 | This work |
| CPVC/GA/PEI | 6.5 | Reactive black 5 | 99.31 | NaCl = 3–4 | This work |
4. Conclusion
In this work, a CPVC composite loose nanofiltration membrane incorporated with plant polyphenols like TA and GA with PEI was successfully synthesized by interfacial polymerization with TMC and incorporated into the membrane surface with efficient dye/salt separation performance and high permeability was prepared. The result shows that the CPVC composite loose nanofiltration membrane's pure water flux fluctuates with increasing TA![[thin space (1/6-em)]](https://www.rsc.org/images/entities/char_2009.gif) :
:![[thin space (1/6-em)]](https://www.rsc.org/images/entities/char_2009.gif) PEI and GA
PEI and GA![[thin space (1/6-em)]](https://www.rsc.org/images/entities/char_2009.gif) :
:![[thin space (1/6-em)]](https://www.rsc.org/images/entities/char_2009.gif) PEI concentrations, while the rejection rate of PEG800 remains consistent across all ratios. The flux and rejection rate of RB5 dye wastewater fluctuate with the changes in TA
PEI concentrations, while the rejection rate of PEG800 remains consistent across all ratios. The flux and rejection rate of RB5 dye wastewater fluctuate with the changes in TA![[thin space (1/6-em)]](https://www.rsc.org/images/entities/char_2009.gif) :
:![[thin space (1/6-em)]](https://www.rsc.org/images/entities/char_2009.gif) PEI and GA
PEI and GA![[thin space (1/6-em)]](https://www.rsc.org/images/entities/char_2009.gif) :
:![[thin space (1/6-em)]](https://www.rsc.org/images/entities/char_2009.gif) PEI concentrations. The optimal TA
PEI concentrations. The optimal TA![[thin space (1/6-em)]](https://www.rsc.org/images/entities/char_2009.gif) :
:![[thin space (1/6-em)]](https://www.rsc.org/images/entities/char_2009.gif) PEI ratios reached a good pure water permeability up to 6.4 L per (m2 per h per bar) with a high rejection rate of 99.69% to dye, and GA
PEI ratios reached a good pure water permeability up to 6.4 L per (m2 per h per bar) with a high rejection rate of 99.69% to dye, and GA![[thin space (1/6-em)]](https://www.rsc.org/images/entities/char_2009.gif) :
:![[thin space (1/6-em)]](https://www.rsc.org/images/entities/char_2009.gif) PEI reached a good water permeability at 5.5 and 6.5 L per (m2 per h per bar) with rejection rates of 99.31% and 99.21%, respectively, and the NaCl retention rate gradually decreased from 4% to 3%. In order to assess the loose nanofiltration application and fractionate dye and salts from textile wastewater, our CPVC/TA/GA/PEI composite loose nanofiltration membrane performed as a competitive choice.
PEI reached a good water permeability at 5.5 and 6.5 L per (m2 per h per bar) with rejection rates of 99.31% and 99.21%, respectively, and the NaCl retention rate gradually decreased from 4% to 3%. In order to assess the loose nanofiltration application and fractionate dye and salts from textile wastewater, our CPVC/TA/GA/PEI composite loose nanofiltration membrane performed as a competitive choice.
Data availability
The datasets created and/or analysed during the current investigation are accessible from the corresponding author upon reasonable request. The article and its accompanying materials provide all relevant data to support the study's findings. In addition, upon reasonable request, the corresponding author will provide any tools or code used for data analysis in this study.Conflicts of interest
The authors declare no conflict of interest.References
- M. Kummu, J. H. Guillaume, H. de Moel, S. Eisner, M. Flörke, M. Porkka, S. Siebert, T. I. Veldkamp and P. Ward, Sci. Rep., 2016, 6, 38495 CrossRef CAS PubMed.
- C. N. Murphy, The United Nations Development Programme: A Better Way?, Cambridge University Press, 2006 Search PubMed.
- M. Bilal, M. Asgher, R. Parra-Saldivar, H. Hu, W. Wang, X. Zhang and H. M. N. Iqbal, Sci. Total Environ., 2017, 576, 646–659 CrossRef CAS PubMed.
- J. Lin, W. Ye, M.-C. Baltaru, Y. P. Tang, N. J. Bernstein, P. Gao, S. Balta, M. Vlad, A. Volodin, A. Sotto, P. Luis, A. L. Zydney and B. Van der Bruggen, J. Membr. Sci., 2016, 514, 217–228 CrossRef CAS.
- S. Ali, A. Khatri, U. Baig, A. Javeed and N. Ali Rind, Color. Technol., 2020, 136, 427–434 CAS.
- C.-Z. Liang, S.-P. Sun, F.-Y. Li, Y.-K. Ong and T.-S. Chung, J. Membr. Sci., 2014, 469, 306–315 CrossRef CAS.
- J. Lin, W. Ye, H. Zeng, H. Yang, J. Shen, S. Darvishmanesh, P. Luis, A. Sotto and B. Van der Bruggen, J. Membr. Sci., 2015, 477, 183–193 CrossRef CAS.
- H. B. Park, J. Kamcev, L. M. Robeson, M. Elimelech and B. D. Freeman, Science, 2017, 356, eaab0530 CrossRef PubMed.
- J. H. Jhaveri and Z. V. P. Murthy, Desalination, 2016, 379, 137–154 CrossRef CAS.
- P. Moradihamedani, Polym. Bull., 2022, 79, 2603–2631 CrossRef CAS.
- S. P. Bera, M. Godhaniya and C. Kothari, J. Basic Microbiol., 2022, 62, 245–259 CrossRef CAS PubMed.
- A. M. Nasir, M. R. Adam, S. N. E. A. M. Kamal, J. Jaafar, M. H. D. Othman, A. F. Ismail, F. Aziz, N. Yusof, M. R. Bilad and R. Mohamud, Sep. Purif. Technol., 2022, 286, 120454 CrossRef CAS PubMed.
- A. W. Mohammad, Y. Teow, W. Ang, Y. Chung, D. Oatley-Radcliffe and N. Hilal, Desalination, 2015, 356, 226–254 CrossRef CAS.
- C. Fersi, L. Gzara and M. Dhahbi, Desalination, 2005, 185, 399–409 CrossRef CAS.
- J. Wang, J. Zhu, M. T. Tsehaye, J. Li, G. Dong, S. Yuan, X. Li, Y. Zhang, J. Liu and B. Van der Bruggen, J. Mater. Chem. A, 2017, 5, 14847–14857 RSC.
- L. Chen, J.-H. Moon, X. Ma, L. Zhang, Q. Chen, L. Chen, R. Peng, P. Si, J. Feng, Y. Li, J. Lou and L. Ci, Carbon, 2018, 130, 487–494 CrossRef CAS.
- A. W. Mohammad, Y. H. Teow, W. L. Ang, Y. T. Chung, D. L. Oatley-Radcliffe and N. Hilal, Desalination, 2015, 356, 226–254 CrossRef CAS.
- J. Lin, C. Y. Tang, W. Ye, S.-P. Sun, S. H. Hamdan, A. Volodin, C. V. Haesendonck, A. Sotto, P. Luis and B. Van der Bruggen, J. Membr. Sci., 2015, 493, 690–702 CrossRef CAS.
- N. Khatoon, N. Ali, H. Yang and W. Jun, Desalin. Water Treat., 2024, 317, 100092 CrossRef.
- B. Van der Bruggen, E. Curcio and E. Drioli, J. Environ. Manage., 2004, 73, 267–274 CrossRef CAS PubMed.
- S. Liu, Z. Wang and P. Song, ACS Sustainable Chem. Eng., 2018, 6, 4253–4263 CrossRef CAS.
- Q. Li, Z. Liao, X. Fang, D. Wang, J. Xie, X. Sun, L. Wang and J. Li, J. Membr. Sci., 2019, 584, 324–332 CrossRef CAS.
- M. Mozafari, S. F. Seyedpour, S. K. Salestan, A. Rahimpour, A. A. Shamsabadi, M. D. Firouzjaei, M. R. Esfahani, A. Tiraferri, H. Mohsenian and M. Sangermano, J. Membr. Sci., 2019, 588, 117200 CrossRef CAS.
- J. Zhu, A. Uliana, J. Wang, S. Yuan, J. Li, M. Tian, K. Simoens, A. Volodin, J. Lin, K. Bernaerts, Y. Zhang and B. Van der Bruggen, J. Mater. Chem. A, 2016, 4, 13211–13222 RSC.
- J. Zhu, M. Tian, Y. Zhang, H. Zhang and J. Liu, Chem. Eng. J., 2015, 265, 184–193 CrossRef CAS.
- P. Li, Z. Wang, L. Yang, S. Zhao, P. Song and B. Khan, J. Membr. Sci., 2018, 555, 56–68 CrossRef CAS.
- J. Zhu, J. Wang, A. A. Uliana, M. Tian, Y. Zhang, Y. Zhang, A. Volodin, K. Simoens, S. Yuan, J. Li, J. Lin, K. Bernaerts and B. Van der Bruggen, ACS Appl. Mater. Interfaces, 2017, 9, 28990–29001 CrossRef CAS PubMed.
- J. Wang, L. Wang, M. He, X. Wang, Y. Lv, D. Huang, J. Wang, R. Miao, L. Nie and J. Hao, RSC Adv., 2022, 12, 34245–34267 RSC.
- R. Zhang, Y. Liu, M. He, M. Wu, Z. Jiao, Y. Su, Z. Jiang, P. Zhang and X. Cao, J. Membr. Sci., 2018, 555, 337–347 CrossRef CAS.
- H. Zhang, L. Bin, J. Pan, Y. Qi, J. Shen, C. Gao and B. Van der Bruggen, J. Membr. Sci., 2017, 539, 128–137 CrossRef CAS.
- M. Li, Y. Yao, W. Zhang, J. Zheng, X. Zhang and L. Wang, Environ. Sci. Technol., 2017, 51, 9252–9260 CrossRef CAS PubMed.
- W. J. Lau, S. Gray, T. Matsuura, D. Emadzadeh, J. Paul Chen and A. F. Ismail, Water Res., 2015, 80, 306–324 CrossRef CAS PubMed.
- H. Zhang, B. Li, J. Pan, Y. Qi, J. Shen, C. Gao and B. Van der Bruggen, J. Membr. Sci., 2017, 539, 128–137 CrossRef CAS.
- X. Wei, S. Wang, Y. Shi, H. Xiang and J. Chen, Ind. Eng. Chem. Res., 2014, 53, 14036–14045 CrossRef CAS.
- L. Pan, H. Wang, C. Wu, C. Liao and L. Li, ACS Appl. Mater. Interfaces, 2015, 7, 16003–16010 CrossRef CAS PubMed.
- L. Pérez-Manríquez, P. Neelakanda and K.-V. Peinemann, J. Membr. Sci., 2017, 541, 137–142 CrossRef.
- M.-B. Wu, X.-L. Fan, H.-C. Yang, J. Yang, M.-M. Zhu, K.-F. Ren, J. Ji and Z.-K. Xu, J. Membr. Sci., 2019, 570–571, 270–277 CrossRef CAS.
- X. Fang, J. Li, X. Li, S. Pan, X. Sun, J. Shen, W. Han, L. Wang and B. Van der Bruggen, J. Colloid Interface Sci., 2017, 505, 642–652 CrossRef CAS PubMed.
- Z. Yang, Z.-w. Zhou, H. Guo, Z. Yao, X.-h. Ma, X. Song, S.-P. Feng and C. Y. Tang, Environ. Sci. Technol., 2018, 52, 9341–9349 CrossRef CAS.
- X. Zhao, N. Jia, L. Cheng, L. Liu and C. Gao, J. Membr. Sci., 2018, 563, 435–446 CrossRef CAS.
- X. Fang, J. Li, B. Ren, Y. Huang, D. Wang, Z. Liao, Q. Li, L. Wang and D. D. Dionysiou, J. Membr. Sci., 2019, 579, 190–198 CrossRef CAS.
- Y. Zhang, Y. Su, J. Peng, X. Zhao, J. Liu, J. Zhao and Z. Jiang, J. Membr. Sci., 2013, 429, 235–242 CrossRef CAS.
- M.-Y. Lim, Y.-S. Choi, J. Kim, K. Kim, H. Shin, J.-J. Kim, D. M. Shin and J.-C. Lee, J. Membr. Sci., 2017, 521, 1–9 CrossRef CAS.
- M. Li, W. van Keulen, M. van de Ven, A. Molenaar and G. Tang, Constr. Build. Mater., 2014, 59, 62–71 CrossRef.
- Y. Lv, H.-C. Yang, H.-Q. Liang, L.-S. Wan and Z.-K. Xu, J. Membr. Sci., 2015, 476, 50–58 CrossRef CAS.
- Z. Zhu, Y. Liu, H. Hou, W. Shi, F. Qu, F. Cui and W. Wang, Environ. Sci. Technol., 2018, 52, 3027–3036 CrossRef CAS PubMed.
- X. Q. Cheng, Z. X. Wang, J. Guo, J. Ma and L. Shao, ACS Sustainable Chem. Eng., 2018, 6, 1881–1890 CrossRef CAS.
- N. Zhang, X. Song, Y. Chen, B. Jiang, L. Zhang and H. Jiang, Environ. Sci. Water Res. Technol., 2021, 7, 956–968 RSC.
- J. Y. Sum, A. L. Ahmad and B. S. Ooi, J. Membr. Sci., 2014, 466, 183–191 CrossRef CAS.
- S. Li, Z. Wang, C. Zhang, M. Wang, F. Yuan, J. Wang and S. Wang, J. Membr. Sci., 2013, 436, 121–131 CrossRef CAS.
- B. C. Smith, Fundamentals of Fourier Transform Infrared Spectroscopy, CRC press, 2011 Search PubMed.
- M. S. Robert, X. W. Francis, J. K. David, and B. L. David, Spectrometric identification of organic compounds, John Wiley & Sons, Inc., 7 edn, 2005, vol. 106 Search PubMed.
- M. Khraisheh, S. Elhenawy, F. AlMomani, M. Al-Ghouti, M. K. Hassan and B. H. Hameed, Membranes, 2021, 11, 995 CrossRef CAS PubMed.
- Y. C. Xu, Z. X. Wang, X. Q. Cheng, Y. C. Xiao and L. Shao, Chem. Eng. J., 2016, 303, 555–564 CrossRef CAS.
- K. P. Lee, J. Zheng, G. Bargeman, A. J. B. Kemperman and N. E. Benes, J. Membr. Sci., 2015, 478, 75–84 CrossRef CAS.
- T. A. Geleta, I. V. Maggay, Y. Chang and A. Venault, Membranes, 2023, 13(1) DOI:10.3390/membranes13010058.
- S. Zhao and Z. Wang, J. Membr. Sci., 2017, 524, 214–224 CrossRef CAS.
- J. Ding, H. Wu and P. Wu, Chem. Eng. J., 2020, 396, 125199 CrossRef CAS.
- X. Li, Y. Chen, X. Hu, Y. Zhang and L. Hu, J. Membr. Sci., 2014, 471, 118–129 CrossRef CAS.
- J. Li, J.-L. Gong, G.-M. Zeng, B. Song, W.-C. Cao, S.-Y. Fang, S.-Q. Tang, Y. Guan, Z.-K. Tan, Z.-P. Chen, X.-Q. Mao and R.-L. Zhu, Sep. Purif. Technol., 2021, 276, 119352 CrossRef CAS.
- Q. Li, Z. Liao, X. Fang, J. Xie, L. Ni, D. Wang, J. Qi, X. Sun, L. Wang and J. Li, Desalination, 2020, 479, 114343 CrossRef CAS.
- X. Bai, Y. Zhang, H. Wang, H. Zhang and J. Liu, Desalination, 2013, 313, 57–65 CrossRef CAS.
| This journal is © The Royal Society of Chemistry 2024 |

