 Open Access Article
Highly efficient mobility, separation and charge transfer in black SnO2–TiO2 structures with co-catalysts: the key step for the photocatalytic hydrogen evolution† ‡
Ángeles Mantillaa,
Diana Guerrero-Araque*b,
Jhon Harrison Sierra-Uribec,
Luis Lartundo-Rojas d,
Ricardo Gómezc,
Héctor A. Calderon
 e,
Rodolfo Zanella
 f and
David Ramírez-Ortega
 *ag
*ag
aInstituto Politécnico Nacional, Laboratorio de Fotocatálisis, CICATA-Legaria, Legaria 694, Col. Irrigación, 11500, Mexico City, Mexico
bCONAHCyT-Universidad Autónoma Metropolitana, Departamento de Química, Av. San Rafael Atlixco 156, 09340, Mexico City, Mexico. E-mail: dianacga@msn.com
cUniversidad Autónoma Metropolitana, Departamento de Química, Av. San Rafael Atlixco 156, 09340, Mexico City, Mexico
dInstituto Politécnico Nacional, Centro de Nanociencias y Micro y Nanotecnología, Zacatenco, Mexico City, Mexico
eInstituto Politécnico Nacional, ESFM, Departamento de Física, UPALM, Miguel Othon de Mendizabal s/n, 07320, Mexico City, Mexico
fInstituto de Ciencias Aplicadas y Tecnología, Universidad Nacional Autónoma de México, Ciudad Universitaria, Circuito Exterior S/N, Coyoacan, 04510, Mexico City, Mexico
gInstituto Politécnico Nacional-ENCB, Edificio 8, Av. Luis Enrique Erro S/N, UPALM, 07738, Mexico City, Mexico. E-mail: divadql@gmail.com
First published on 19th August 2024
Abstract
Oxygen vacancies and co-catalysts enhance photocatalytic hydrogen production by improving the charge carrier separation. Herein, the black SnO2–TiO2 structure (BST) was synthesized for the first time by two consecutive methods. First, the sol–gel nucleation method allowed TiO2 to form on the SnO2 nanoparticles, creating a strong interaction and direct contact between them. Subsequently, this structure was reduced by NaBH4 during thermal treatment, generating (Ti3+/Sn2+) states to form the BST. Then, 2 wt% of Co, Cu or Pd was impregnated onto BST. The results showed that the activity raised with the presence of Ti3+/Sn2+ states, reaching a hydrogen generation rate of 147.50 μmol g−1 h−1 with BST in comparison with the rate of 99.50 μmol g−1 h−1 for white SnO2–TiO2. On the other hand, the interaction of the co-catalysts with the BST structure helped to increase the photocatalytic hydrogen production rates: 154.10 μmol g−1 h−1, 384.18 μmol g−1 h−1 and 480.20 μmol g−1 h−1 for cobalt-BST, copper-BST and palladium-BST, respectively. The results can be associated with the creation of Ti3+/Sn2+ at the BST interface that changes the lifetime of the charge carrier, improving the separation of photogenerated electrons and holes and the co-catalysts in the structures move the flat band position and increasing the photocurrent response to having electrons with greater reducing power.
Introduction
In recent years, some studies have focused on producing an efficient and clean source of energy as an alternative to fossil fuels.1–3 In this sense, different semiconductors have been probed in the photocatalytic generation of hydrogen.3 White TiO2 is one of the materials widely studied as a photocatalyst; nevertheless, its high recombination of charge carriers has been reported.2–4 Among the alternatives for optimizing the activity of white TiO2, this material has been coupled with other metal oxides (e.g., ZnO, WO3, ZrO2) to create heterojunctions. In that sense, recent research suggests that coupling white TiO2 with SnO2 could improve photocatalytic hydrogen production and decrease carrier pair recombination due to heterojunction formation.5 Another alternative is to decorate white TiO2 with co-catalyst nanoparticles (e.g., Pd, Cu or Co) to enhance the activity.6,7 Previously, we reported the degradation of 4-chlorophenol using SnO2–TiO2 heterojunctions synthesized from white TiO2 and different SnO2 contents; the results showed that the material with 6 mol% of SnO2 had the best behaviour.8 In another study, a SnO2–TiO2 heterojunction with Cu or/and Co as co-catalysts in the form of CuO and CoO species was studied, showing that the SnO2–TiO2 heterojunction material coupled with CuO–CoO exhibited higher photoactivity for hydrogen production.9Conversely, the reduction of white TiO2 to obtain black TiO2 has been reported, garnering attention for its superior properties in photochemical applications compared to white TiO2.10 Also, it has been reported that the generation of oxygen vacancies in black SnO2–TiO2 enhances the photocatalytic activity. In this regard, Yang et al. reported the transformation of Sn4+–Ti4+ to Sn2+–Ti3+ in the formation of a SnO2–TiO2 heterojunction.11 Hence, this study investigates the semiconducting properties of Cu, Pd or Co co-catalyst nanoparticles deposited by the impregnation method on black SnO2–TiO2 partially reduced structure by NaBH4 and their correlation with the photocatalytic hydrogen production.
Experimental
Synthesis of black SnO2–TiO2 (BST)
The white SnO2–TiO2 (WST) structure was obtained through sol–gel synthesis. Briefly, titanium butoxide, butanol, nitric acid, and nanoparticles of SnO2 were mixed under vigorous stirring (6 mol% of SnO2), as reported elsewhere.8 Then, a solution of methanol–water (1![[thin space (1/6-em)]](https://www.rsc.org/images/entities/char_2009.gif) :
:![[thin space (1/6-em)]](https://www.rsc.org/images/entities/char_2009.gif) 1 molar ratio) was added dropwise and maintained at 80 °C for 24 hours under reflux and stirring. The solid obtained was washed and dried at 80 °C. Afterward, the black SnO2–TiO2 structure was prepared by reduction using NaBH4.12,13 Initially, WST structure and NaBH4 (molar ratio of 1
1 molar ratio) was added dropwise and maintained at 80 °C for 24 hours under reflux and stirring. The solid obtained was washed and dried at 80 °C. Afterward, the black SnO2–TiO2 structure was prepared by reduction using NaBH4.12,13 Initially, WST structure and NaBH4 (molar ratio of 1![[thin space (1/6-em)]](https://www.rsc.org/images/entities/char_2009.gif) :
:![[thin space (1/6-em)]](https://www.rsc.org/images/entities/char_2009.gif) 3) were taken and ground for 30 min. Then, the blend was thermally treated at 400 °C under a nitrogen atmosphere for 30 min. Finally, the structure obtained was washed with an ethanol–water mixture 1
3) were taken and ground for 30 min. Then, the blend was thermally treated at 400 °C under a nitrogen atmosphere for 30 min. Finally, the structure obtained was washed with an ethanol–water mixture 1![[thin space (1/6-em)]](https://www.rsc.org/images/entities/char_2009.gif) :
:![[thin space (1/6-em)]](https://www.rsc.org/images/entities/char_2009.gif) 1 (molar ratio) to remove the NaBH4, and then it was dried to 80 °C. The black SnO2–TiO2 structure obtained was labelled as BST.
1 (molar ratio) to remove the NaBH4, and then it was dried to 80 °C. The black SnO2–TiO2 structure obtained was labelled as BST.
Synthesis of MxOy-BST (M: Cu, Co or Pd)
Copper, cobalt or palladium nanoparticles on BST material were deposited employing the incipient wetness impregnation method. The required amount of copper, cobalt or palladium nitrate was dissolved in water containing BST in suspension and stirred for 4 hours (metal content was kept at 2 wt%). The materials were dried at 80 °C. Then, the materials were mixed with NaBH4 and thermally treated as mentioned above. The solids were labelled as Cu-BST, Co-BST and Pd-BST.Characterization
The crystal structure of the materials was analyzed in a Bruker D-2 Advance diffractometer employing Kα radiation with l = 0.154 nm. The UV-vis diffuse reflectance spectroscopy was performed to establish the band gap energies using a Cary 100 spectrophotometer. Surface areas were performed on a 3P meso 222 instrument device. The XPS measurements of the synthesized materials were carried out on an X-ray photoelectron spectrometer with monochromatic Al Kα from a Thermo Fisher Scientific K-Alpha; for details of the measurement conditions, see the ESI.‡Transmission electron microscopy (TEM) was performed on a model JEM2100 (criotem) microscope, LaB6 200 kV in high-resolution mode. Images are taken under low-dose conditions to avoid beam damage to the samples.
The (photo)electrochemical measurements were performed in an AUTOLAB 302 N potentiostat; for details of the measurement conditions, see the ESI.‡ Fluorescence measurements were performed in a Fluorolog-3 spectrofluorometer with a Xe lamp at room temperature, using a 218 nm excitation wavelength with an excitation slit width of 5 nm. Emission spectra were collected from 300 to 700 nm with emission slit width at 5 nm.
Photocatalytic activity
The photocatalytic hydrogen generation was evaluated in a homemade reactor using as irradiation source a UV-Pen Ray lamp (254 nm wavelength and 3.6 mW cm−2 intensity) 12 mg of photocatalyst and a methanol![[thin space (1/6-em)]](https://www.rsc.org/images/entities/char_2009.gif) :
:![[thin space (1/6-em)]](https://www.rsc.org/images/entities/char_2009.gif) water solution (1
water solution (1![[thin space (1/6-em)]](https://www.rsc.org/images/entities/char_2009.gif) :
:![[thin space (1/6-em)]](https://www.rsc.org/images/entities/char_2009.gif) 1 ratio). The solution was stirred, maintained at room temperature, and irradiated for 5 hours. The hydrogen generated was quantified employing a gas chromatograph GOW-MAC Series 580 equipped with a column of SiO2 and a thermal conductivity detector (TCD) .
1 ratio). The solution was stirred, maintained at room temperature, and irradiated for 5 hours. The hydrogen generated was quantified employing a gas chromatograph GOW-MAC Series 580 equipped with a column of SiO2 and a thermal conductivity detector (TCD) .
Results and discussion
Structure and textural properties of the synthesized materials
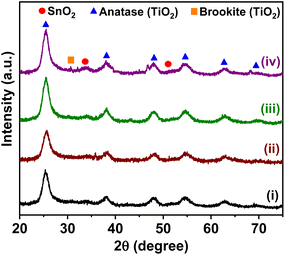
XRD was used to study the crystalline structure of the synthesized materials. Fig. 1 displays the XRD patterns of all materials; the peaks at 2θ = 25.3°, 37.9°, 47.8°, 54.6°, 62.7° and 69.3° were indexed to the crystal planes (101), (004), (200), (105), (204), (116) of anatase-TiO2 phase.14 The brookite phase of TiO2 was detected by a peak at 2θ = 30.8°, associated with the (211) plane.15,16 It has been observed that anatase can be directly transformed into brookite under similar reduction and thermal conditions.16 Also, the SnO2 peaks detected at 2θ = 26.5°, 33.9° and 51.7° were assigned to the (110), (101) and (211) planes, respectively.17,18 The cobalt, copper and palladium nanoparticles peaks were not observed, which might result from the low loading of co-catalyst nanoparticles.19The average crystallite size of the BST structures with co-catalyst was estimated by applying the Scherrer equation to the dominant peak (101) of the anatase-TiO2 phase of the XRD patterns (see Fig. 1 and Table 1). The average crystallite size of the BST structure was 5.64 nm. The impregnation of Cu, Pd and Co led to a slight decrease in average crystallite size, which may be related to the fact that they are highly dispersed and that their presence on the semiconductor inhibits the crystallization.20
| Materials | Real co-catalyst contenta (wt%) | Crystal sizeb (nm) | SBETc (m2 g−1) | dporec (nm) | Vporec (cm3 g−1) | Band gap energyd (eV) |
|---|---|---|---|---|---|---|
| a Average content estimated by EDS and XPS analysis.b Estimated by XRD analysis.c Estimated by the BET method of N2 adsorption.d Estimated by diffuse reflectance spectra. | ||||||
| BST | __ | 5.64 | 81 | 3.55 | 0.072 | 2.98 |
| Co-BST | 2.08 | 5.37 | 84.58 | 3.80 | 0.080 | 2.67 |
| Cu-BST | 2.14 | 5.47 | 122.47 | 3.69 | 0.113 | 3.04 |
| Pd-BST | 1.83 | 5.39 | 75.84 | 4.56 | 0.086 | 3.07 |
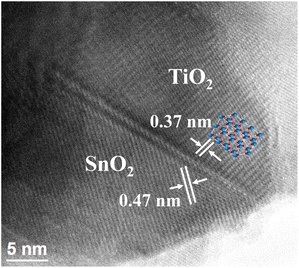
High-resolution transmission electron microscopy was used to confirm the interfacial interaction between SnO2 and TiO2 in the BST structure. In Fig. 2, the image shows the lattice fringes of the (101) plane of TiO2 and the (100) plane of SnO2 with spacings of 0.37 and 0.47 nm, respectively.21,22 These results confirm the formation of the heterojunction between SnO2 and TiO2.
To evaluate the impact of copper, cobalt, and palladium on textural properties of BST structure, we conducted a comprehensive collection of N2 adsorption isotherms at 77 K. The BST structure showed a specific surface area of 81 m2 g−1, pore size of 3.55 nm, and a pore volume of 0.072 cm3 g−1. This value increased for the presence of Cu and Co co-catalysts; however, the specific surface area decreased slightly for Pd-BST material. These results may be associated with the fact that the Pd crystals were deposited in some of the pores of TiO2, as has been observed in other studies under different TiO2 crystal phases.20–23 Also, depending on the type of co-catalyst incorporated in the BST structure, a variation was observed, indicating an influence of the co-catalyst on the BST crystallization and its textural properties. The crystal sizes decrease for all samples, and pore volumes increased in the following order: Cu > Pd ≈ Co. The presence of metal atoms obstructs the mobility of Ti ions20 and the unrestrained growth of BST crystals when carrying out calcination, causing an inefficient packing of subunits and the rearrangement of the crystals and their co-catalysts, creating pores between molecules that give rise to an increased in extrinsic porosity24 and, therefore, a slight increase in pore volume. These findings are detailed in Table 1.
Despite this, it is important to highlight that the specific surface area of the synthesized materials is high enough to have the active sites necessary to carry out the redox processes on the surface of the BST structures.
Optical properties and chemical environment
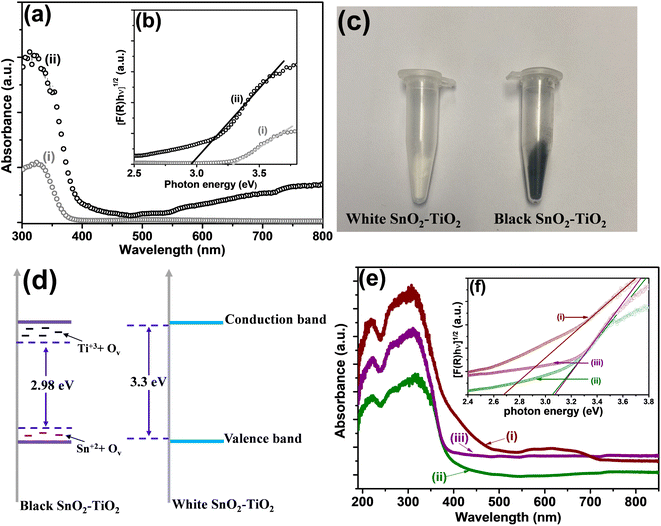
The optical properties of materials were studied to establish the effect of copper, palladium and cobalt nanoparticles on BST structure. Fig. 3a exhibits the UV-visible absorption spectra of the white SnO2–TiO2 (WST) vs. BST structures. The band gap energies (Eg) of WST and BST, which were estimated from Tauc plots derived for an indirect transition, are shown in Fig. 3b. It can be seen that the band gap energy of the BST structure was 2.98 eV, which was significantly narrowed compared with the WST structure (3.30 eV) and can be associated with the Ti3+ and Sn2+ atoms/oxygen vacancies (intra-band states) originated during the reduction process.25,26In the case of the BST structure, it is possible to observe a broad absorption tail in the visible light region that does not occur with the WST structure. Also, the higher absorption at a wavelength of 337 nm in BST compared with WST is associated with the reduction of Ti4+ to Ti3+ ions and the creation of oxygen vacancies.16
Furthermore, it can be seen that the absorption spectrum of the BST structure occurred a red shift compared to the WST structure, and the extended absorption is consistent with the color change of the structure from white to black (as seen in Fig. 3c).
Hence, the Ti3+ states/oxygen vacancies and Sn2+ states/oxygen vacancies provoked a modification in the electronic structure of BST material. Therefore, Ti3+ states in TiO2 can introduce energy levels in the band gap localized below the conduction band.26 Also, in the case of SnO2, Sn2+ states introduce energy levels at the top of the valence band.27–29 Consequently, the band gap narrowing is related to the presence of Ti3+/Sn2+ states and oxygen vacancies, which induce the formation of intermediate energy levels in the band gap, as shown in Fig. 3d.
Furthermore, the impregnation of BST with copper, cobalt and palladium species causes a slight increase in the adsorption visible region and a slight blue shift (as seen in Fig. 3e). This shift is related to inserting the metal 3d orbitals within the forbidden band and the charge transfer between the metal transitions 3d electrons and the conduction band of the BST structure.30–32 The band gap energy values calculated for BST with co-catalyst are listed in Table 1. The band gap energy values were slightly modified with the Cu and Pd co-catalysts compared to those reported for the BST structure (see Table 1). However, in the case of Co species, the band gap energy changed from 2.98 to 2.67 eV. This modification may be related to higher interaction between the band electrons and the localized d electrons of the Co2+ ions substituting Ti4+ cations. The interactions of the p–d and s–d exchange led to the upward transformation of the valence band edge and the downward transition of the conduction band edge, which reduced the band gap.33
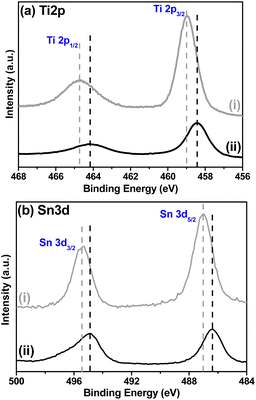
X-ray photoelectron spectroscopy (XPS) analysis was performed in order to identify the differences between WST and BST structure on the surface, electronic states and the impact of the reduction process with NaBH4 during the thermal treatment at 400 °C in N2 atmosphere.
Fig. 4a shows the high-resolution XPS spectra for the Ti 2p region. Regarding the WST structure (Fig. 4a(i)), two peaks were identified with the binding energies at 458.9 and 464.7 ± 0.2 eV, corresponding to Ti 2p3/2 and Ti 2p1/2, respectively. After being reduced to form BST structure, the characteristic peaks of Ti 2p3/2 and Ti 2p1/2 showed a noticeable shift toward lower binding energies at 458.4 and 464.2 ± 0.2 eV, confirming the formation of Ti3+ states, indicating that oxygen vacancies are generated in the BST structure during the reduction process.34–38
Regarding the high-resolution Sn 3d spectra (Fig. 4b), a similar result is observed, i.e., the two peaks identified with the binding energies corresponding to Sn 3d3/2 and Sn 3d5/2 are also shifted to lower energies, from 495.4 and 487.0 ± 0.2 eV (WST) to 494.9 and 486.4 ± 0.2 eV (BST), respectively. The presence of oxygen vacancies near the Sn atoms can generate this displacement. Therefore, the BST structure is rich in oxygen vacancies and contains some reduced Sn cations (Sn2+ states), but maintains the rutile structure, as reported in several works37,39,40
To determine the chemical composition and to confirm the oxidation states of titanium and tin in the BST structure, high-resolution XPS spectra were analyzed in the Ti 2p and Sn 3d regions (Fig. 5). The Ti 2p spectra can be deconvoluted by assuming contribution from Ti3+ and Ti4+ as shown in Fig. 5a. In this spectrum, two dominant peaks located at 458.8 and 464.5 ± 0.2 eV were observed, which correspond to the Ti 2p3/2 and Ti 2p1/2 signals characteristic for the TiO2 with oxidation state 4+.41,42 Besides, two peaks located at 459.38 and 465.1 ± 0.2 eV could be attributed to the Ti–O bond or Ti–O–Sn interaction at the interface between TiO2 and SnO2 nanoparticles43,44
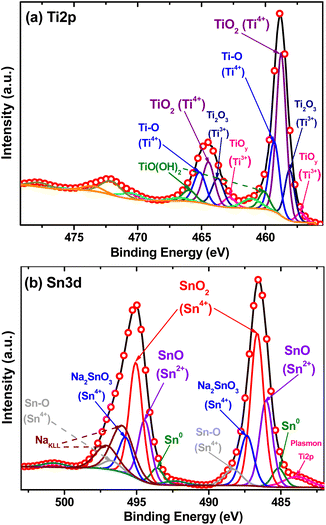 | ||
| Fig. 5 XPS high-resolution spectra of: (a) Ti 2p region and (b) Sn 3d region for black SnO2–TiO2 structure. | ||
On the other hand, the smaller doublet contribution in the binding energy at 457.28 for Ti 2p3/2 and 462.82 ± 0.2 eV for Ti 2p1/2, is characteristic of Tix–Oy species, specifically in the TiO form. This sub-oxide titanium species is commonly reported with Ti2+ oxidation state, with a binding energy of approximately 455.1 ± 0.2 eV for Ti 2p3/2 signal.45–48 However, it presents a shift of 2.2 eV. This shift may be due to the instability of TiO, which begins to transform into other sub-oxides (TiOy) until it becomes Ti2O3, which is more stable, obtaining an average oxidation state of Ti3+, as reported in other works.49–52 In addition to this, two extra signals with binding energies at 458.0 and 463.7 ± 0.2 eV are consistent with the characteristic Ti 2p3/2 and Ti 2p1/2 peaks corresponding to Ti2O3 form with oxidation state of Ti3+.53–55 The presence of Ti3+ in the nonstoichiometric Ti oxide species (Tix–Oy) emerged due to the reduction of Ti4+ (TiO2) induced by the thermal decomposition of NaBH4 and lead to the formation of oxygen vacancies.12,56 Finally, it is possible to observe a last contribution in two signals with binding energies at 460.1 and 465.95 ± 0.2 eV, corresponding to TiO(OH)2 species formed due to the conversion of titanium butoxide, butanol and other OH− species adsorbed during the sol–gel method.57
Fig. 5b presents the narrow scan of the Sn 3d spectra, it can be seen that the shape of the spectrum is asymmetric. Thus, it is evident that the Sn ions are present in different oxidation states. The main contribution was observed in the binding energies at 486.6 and 495.05 ± 0.2 eV, which are consistent with the characteristic Sn 3d5/2 and Sn 3d3/2 peaks. The binding energy difference between these two peaks is 8.5 eV, which confirms the main oxidation state of tin as 4+.58–62 In addition, two signals with binding energies at 485.9 and 494.5 ± 0.2 eV are consistent with the characteristic Sn 3d5/2 and Sn 3d3/2 peaks. These peaks are associated with the presence of Sn2+ in the form of SnO and are confirmed by the binding energy difference of ∼0.7 eV between the Sn2+ and Sn4+ (Sn 3d5/2) peaks.63–65 The smaller contribution in the two peaks with binding energies at 485.20 and 496.6 ± 0.2 eV are characteristics of metallic tin (Sn0).66–69 Moreover, the peaks that are centered at the binding energies of 487.4 and 495.8 ± 0.2 eV, corresponding to Sn 3d5/2 and Sn 3d3/2, respectively, are associated with the Na2SnO3 species that are formed due to the presence of NaBH4 during the thermal reduction to obtain the black structure.70,71 Likewise, the double contribution with the binding energies at 488.3 for Sn 3d5/2 and 496.8 ± 0.2 eV Sn 3d3/2 can be attributed to the Sn4+ valence state of Sn–O bonds and/or Sn–O–Ti interaction between SnO2 and TiO2 nanoparticles.72,73
Hence, these results confirm that the presence of Ti3+/Sn2+ states and oxygen vacancies on the BST structure contribute to the decrease in the band gap energy, as it was previously proposed by the analysis of the optical properties.
To identify the oxidation states and species of the Pd, Cu and Co on the BST structures, the high-resolution spectra of these co-catalysts were evaluated (Fig. 6).
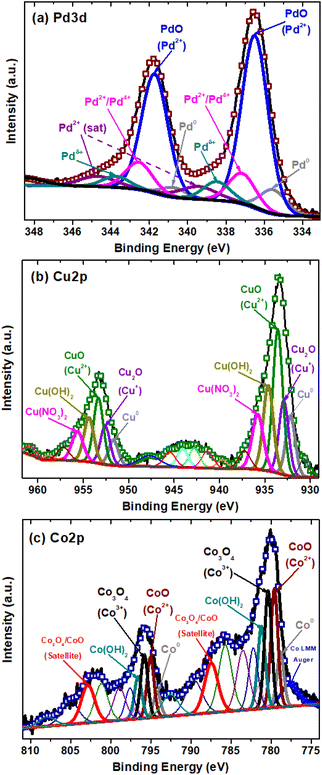 | ||
| Fig. 6 XPS high-resolution spectra of: (a) Pd 3d of Pd-BST structure, (b) Cu 2p of Cu-BST structure, (c) Co 2p of Co-BST structure. | ||
For the Pd-BST structure, the high-resolution Pd spectrum is shown in Fig. 6a. A small double contribution, with binding energies at 335.5 and 340.7 ± 0.2 eV for Pd 3d5/2 and Pd 3d3/2, is related to the presence of metallic Pd (Pd0) nanoparticles.74,75 The other observed peaks at binding energy positions of 336.5 and 341.7 ± 0.2 eV show Pd 3d5/2 and Pd 3d3/2 spin doublet due to the formation of PdO with an oxidation state of 2+.76,77
Furthermore, the peaks with binding energies at 337.2 and 342.6 ± 0.2 eV for Pd 3d5/2 and Pd 3d3/2 can be related to the formation of a mixture of palladium oxides PdO/PdO2 with oxidation states Pd2+/Pd4+.78 On the other hand, other peaks are detected at 338.5 and 343.7 ± 0.2 eV for Pd 3d5/2 and Pd 3d3/2, but their assignment is more complex. These signals have been assigned to the presence of Pd2+ species in the form of Pd(NO3)2, which can be a residue of the impregnation process used in this work or Pd cationic species that have a strong interaction with BST structure.79,80 In the end, it is possible to observe the signals at 339.5 and 344.8 ± 0.2 eV for Pd 3d5/2 and Pd3d3/2, which correspond to the satellites of the Pd2+ species.
In the case of Cu-BST structure, the narrow scan of the Cu 2p region was identified in three different oxidation states of copper (Fig. 6b). First, two small signals located at 932.2 and 951.5 ± 0.2 eV were associated with metallic copper (Cu0) nanoparticles, corresponding to Cu 2p3/2 and Cu 2p1/2, respectively.81 Besides, Cu1+ in the form of Cu2O is identified with peaks centered at 932.8 and 952.6 ± 0.2 eV, attributed to Cu 2p3/2 and Cu 2p1/2. In like manner, the main contribution of the Cu species in the BST structure is in the form of CuO dispersed on the surface, as indicated by the characteristic peaks at the binding energies in 933.5 and 953.5 ± 0.2 eV, associated with Cu 2p3/2 and Cu 2p1/2.81 On the other hand, other Cu2+ species in the structure are in the form of Cu(OH)2 and Cu(NO3)2, which may correspond to remnants of the impregnation process. These signals are centered at 934.6 and 954.4 ± 0.2 eV for Cu(OH)2, and 935.8 and 955.7 ± 0.2 eV for Cu(NO3)2.82 Finally, some shake-up satellite peaks are observed at higher binding energies (937–950 eV), which confirm the presence of Cu2+, the main oxidation state of copper on the structure.82
Fig. 6c shows the high-resolution spectra of Co 2p region for the Co-BST structure. A detailed analysis of the region with deconvolution demonstrates the presence of three different oxidation states of cobalt in the structure. The first two signals centered at 778.6 and 794.2 ± 0.2 eV, related to Co 2p3/2 and Co 2p1/2, respectively, indicate the presence of cobalt metallic nanoparticles (Co0).83 In addition, there are two peaks at binding energy positions of 779.6 and 795 ± 0.2 eV, associated with Co 2p3/2 and Co 2p1/2, which can be attributed to CoO with oxidation state 2+.83 Similarly, the characteristics signals for Co3+ in the form of Co3O4 spinel are found at binding energies of 780.3 and 795.8 ± 0.2 eV.84 The presence of shake-up satellite peak at binding energies of 787.4 and 802.8 ± 0.2 eV, related to Co 2p3/2 and Co 2p1/2, confirms the presence of a mixed phase of cobalt oxides (CoO/Co3O4) on the Co-BST structure.85,86 Additionally, the characteristic peaks of Co(OH)2 species are observed at 781.2 and 796.7 ± 0.2 eV, corresponding to Co 2p3/2 and Co 2p1/2.87 It is important to mention that most cobalt oxides and hydroxides (e.g., CoO, Co3O4 and Co(OH)2) have similar binding energy values. Thus, determining the oxidation states of cobalt solely through the Co 2p main peaks is challenging. For this reason, the other unmentioned peaks are considered multi-satellites and satellites, confirming the presence of the cobalt species already mentioned above.
Photocatalytic hydrogen generation
Photocatalytic hydrogen generation was evaluated in a homemade reactor employing 12 mg of photocatalyst and a methanol–water solution (1![[thin space (1/6-em)]](https://www.rsc.org/images/entities/char_2009.gif) :
:![[thin space (1/6-em)]](https://www.rsc.org/images/entities/char_2009.gif) 1 ratio). The suspension was irradiated for 5 h. The results of all materials are shown in Fig. 7.
1 ratio). The suspension was irradiated for 5 h. The results of all materials are shown in Fig. 7.
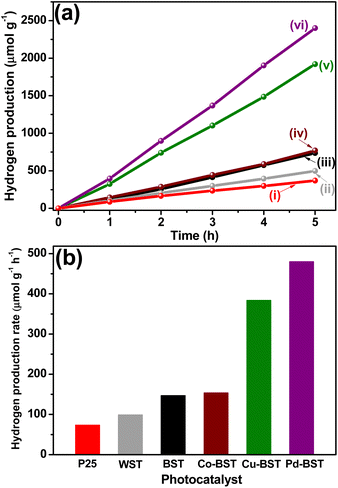 | ||
| Fig. 7 (a) Hydrogen generation of: (i) Degussa P25, (ii) WST, (iii) BST, (iv) Co-BST, (v) Cu-BST and (vi) Pd-BST and (b) hydrogen generation rate of structures with co-catalyst. | ||
The photocatalytic hydrogen generation without photocatalyst under UV-light irradiation (photolysis) was investigated. The hydrogen generation in the photolysis process is very low compared to that generated with the synthesized materials, reaching 2.44 μmol at 5 h, which corresponds to a hydrogen generation rate of 0.48 μmol h−1.
The photocatalytic hydrogen generation with WST structure was 497.49 μmol g−1 with a hydrogen generation rate of 99.49 μmol g−1 h−1, demonstrating better photocatalytic performance than that obtained with TiO2 Evonik P25, 368.99 μmol g−1, with a hydrogen generation rate of 73.80 μmol g−1 h−1, (Fig. 7a and b). The improved hydrogen generation can be attributed to the synthesis method (sol–gel-nucleation) used in the present work to form the SnO2–TiO2 structure. The formation of TiO2 over the SnO2 nanoparticles during the hydrolysis establishes a deep bond between SnO2 and TiO2 and strong interaction is guaranteed to increase the separation of photogenerated electron–hole pairs (e−–h+) and improve the photocatalytic behavior of the raw materials, as discussed in detail in previous studies.8,9
Simultaneously, enhanced photocatalytic hydrogen generation for BST compared with WST structure is observed. As seen in Fig. 7a and b, BST exhibits a hydrogen generation rate of 147.50 μmol g−1 h−1 (737 μmol g−1), this value is 1.5 times higher than the results obtained for the WST, evaluated under the same experimental conditions. This increase in the photocatalytic activity of BST is not only related to the deep interaction between SnO2 and TiO2 caused by the synthesis method used in this work. Moreover, the presence of the Ti3+/Sn2+ states and the oxygen vacancies in the structure (as has been established in UV-vis and XPS measurements) can help improve the efficiency in the mobility, separation and transport of photogenerated (e−–h+) for hydrogen generation.88,89
Furthermore, the photocatalytic activity increased in presence of the co-catalysts, compared to the BST structure. Although the content of the co-catalyst deposited on the BST structure was the same, the hydrogen generation rate was 480.20, 384.18, and 154.10 μmol g−1 h−1 for Pd-BST, Cu-BST, and Co-BST, respectively. While the impregnation using Co nanoparticles does not significantly increase activity, the notable impact was reflected with Cu and Pd nanoparticles. These results can be attributed to different factors: (i) the nature of the co-catalyst, (ii) the redox potential, (iii) the surface energy, and (iv) the transformation of the chemical medium of the synthesized structures and their interaction with the solution to generate hydrogen.90,91 However, it is noticeable that all the deposited materials showed greater activity than the BST structure and this improvement in the separation and transport of photogenerated (e−–h+) may be related to the formation of n–p structure between the BST and the co-catalyst.
In addition, the apparent quantum yield (AQY %) is another key factor in evaluating the hydrogen generation performance of a photocatalyst. In this way, AQY % was obtained following the methodology described in detail in this previous study.92 The AQY % for the materials is shown in Table 2.
| Materials | Hydrogen generation rate (μmol g−1 h−1) | Apparent quantum yield (AQY %) |
|---|---|---|
| Evonik P25 | 73.80 | 0.54 |
| WST | 99.50 | 0.73 |
| BST | 147.50 | 1.08 |
| Co-BST | 154.10 | 1.13 |
| Cu-BST | 384.18 | 2.83 |
| Pd-BST | 480.20 | 3.54 |
With these efficiency values, we can conclude two crucial points: (i) the impact of the Ti3+/Sn2+ states generation and oxygen vacancies on the photocatalytic activity, as evidenced by the improved H2 generation, when comparing BST and WST structures and, (ii) the effect of the co-catalyst on the mobility, separation, and transport of the photogenerated (e−–h+), with higher efficiency observed in the case of the Pd-BST material.
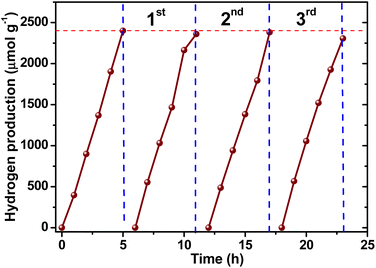
According to these results, the reproducibility and photostability of Pd-BST material (the most active photocatalyst) for hydrogen production was evaluated in three consecutive cycles. Only after more than 20 h of irradiation, the hydrogen generation decreased slightly, obtaining a minimal percentage of activity loss of ∼3.9% and the production rate was 461.38 μmol g−1 h−1, which is close to the initial value (480.20 μmol g−1 h−1), confirming the extraordinary stability and reusability of the photocatalyst (see Fig. 8).
(Photo)electrochemical characterization
To further investigate the mobility, separation and transfer of (e−–h+) between these n–p structures and elucidate the influence of the co-catalyst on the BST structure in photocatalytic hydrogen generation, the semiconductor properties of the synthesized materials were evaluated using Mott–Schottky curves. The flat-band potential (Efb) values, as shown in Table 3, were obtained by extrapolating the linear region of the curves to the potential axis in Fig. 9.| Materials | Efb versus (Ag/AgCl SAT) (V) |
|---|---|
| BST | −0.65 |
| Co-BST | −0.70 |
| Cu-BST | −0.63 |
| Pd-BST | −0.85 |
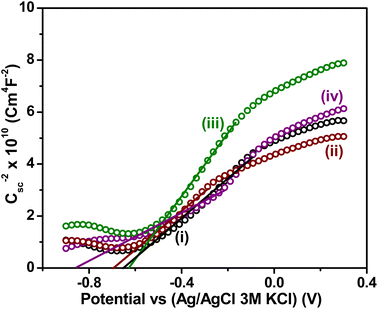 | ||
Fig. 9 Mott–Schottky plots of: (i) BST, (ii) Co-BST, (iii) Cu-BST and (iv) Pd-BST. The Csc was obtained at 400 Hz in a methanol–water solution (1![[thin space (1/6-em)]](https://www.rsc.org/images/entities/char_2009.gif) : :![[thin space (1/6-em)]](https://www.rsc.org/images/entities/char_2009.gif) 1 ratio) with 0.05 M KClO4. 1 ratio) with 0.05 M KClO4. | ||
The Mott–Schottky results revealed an n-type semiconductor behavior for all synthesized materials, consistent with the typical n-type behavior of TiO2, which comprises the largest proportion in the BST structure. When the co-catalyst (Co, Cu, or Pd) was impregnated on the surface of the BST structure, the flat band potential (Efb) and the semiconductor properties were modified depending on the co-catalyst. The incorporation of Co and Pd altered the Efb values of the structure toward more negative values, as observed in Table 3 and Fig. 6. The Cu co-catalyst deposited on the BST structure exhibited a contrasting behavior, with a less negative shift in Efb (refer to Table 3). The phenomenon above is attributed to the alignment of the Fermi level across the composite. It is understood that the shifts in the Efb values in the BST with co-catalyst are associated with the presence of energy states formed at the interface between the BST structure and the co-catalyst.9,91,93 The existence and distribution of these energy states induce a shift in the Efb potential, thereby promoting the hydrogen evolution reaction (at −0.62 V versus Ag/AgCl with 3.0 M KCl) under neutral pH conditions.
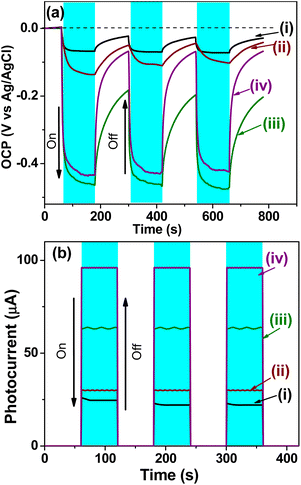
Further (photo)electrochemical measurements were performed to assess the semiconductor properties and the influence of energy states induced by the co-catalyst nanoparticles (Co, Cu, and Pd) on charge carrier generation, separation, and transport. In this context, open circuit potential (OCP) measurements depicted in Fig. 10a were conducted under dark and irradiation conditions. When all synthesized materials were irradiated, the photoexcited electrons accumulated in the conduction band and/or in energy levels below it, causing a shift in the OCP towards more negative values, which is typical behavior of n-type semiconductors. All BST films with a co-catalyst exhibit a significant potential shift compared to BST in its pristine state, indicating a higher availability of electrons for the hydrogen reduction reaction.9,91,93 This behavior is most pronounced for Cu-BST and Pd-BST materials. During constant irradiation, more photogenerated electrons accumulate in the conduction band, while more holes accumulate in the valence band, indicating efficient separation and transport of (e−–h+) in all structures. By interrupting the irradiation of the films, the OCP slightly changed toward a less negative potential, indicating a recombination or trapping process suggestive of the recuperation of the films. The Pd-BST film presents better recuperation than Cu-BST, indicating less energy lost in hot or related forms. The OCP measurements were repeated for three cycles, and the analysis indicates that all samples exhibit outstanding stability.9,91,93
The photocurrent measurements of the BST structure with and without co-catalyst shown in Fig. 10b were conducted to evaluate the (photo)electrochemical behavior. The presence of co-catalysts enhanced the photocurrent mainly due to the more efficient (e−–h+) separation they promoted. The coupling of Pd and Cu co-catalysts with the BST structure improves the generation, separation, and transfer of photogenerated electrons, resulting in higher photocurrent values for these samples.
Thus, the presence of these co-catalysts considerably improved the photocatalytic hydrogen production, creating the active sites necessary for the reduction reaction to generate hydrogen, which is confirmed by photoelectrochemical analysis. These results show that the nature of the Co co-catalyst is expected to catalyze oxidation reaction more efficiently than the reduction reaction.9,94,95
Therefore, the increase in the photocatalytic activity of the BST structures with the co-catalysts can be attributed to: (i) the oxygen vacancies (Ti3+/Sn2+) formed during the reduction process, which helps the separation and transport of (e−–h+) and, (ii) the presence of co-catalysts that help create the active sites to improve the oxidation–reduction reactions and likewise to improve the mobility, separation and transport of (e−–h+).9,94,95
In this way, photoluminescence (PL) spectra were used to evaluate the separation efficiency of photogenerated charge carriers in photocatalysts. These measurements were carried out to verify the effect of oxygen vacancies and co-catalysts on the separation of charge carriers. Fig. 11 shows the PL spectra of the synthesized materials. Commonly, a lower emission intensity implies a decrease in the recombination process and, therefore, a higher and faster separation of (e−–h+) for a photocatalyst.96–98 In the case of the BST structure, it is observed that there is a higher separation of the photogenerated (e−–h+) compared to the WST structure (See Fig. 11i and (ii)).
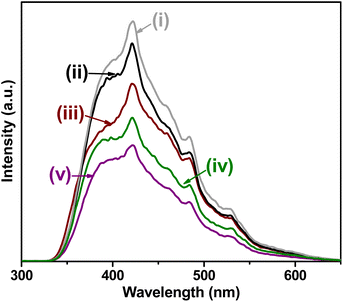 | ||
| Fig. 11 PL spectra of: (i) white SnO2–TiO2 (WST), (ii) black SnO2–TiO2 (BST), (iii) Co-BST, (iv) Cu-BST and (v) Pd-BST. | ||
It was observed that the PL intensity of Pd-BST was much lower than that in the other deposited co-catalyst, due to higher delocalization of charge carriers, which reduced the reduction in the recombination rate. Since the lifetime of the charge carriers and the presence of energy states are key factors determining the photocatalytic efficiency of the photocatalysts, it has been concluded that Cu and Pd helped to improve the separation of photogenerated (e−–h+) and the creation of more active sites, as evidenced by their higher photocatalytic activities.
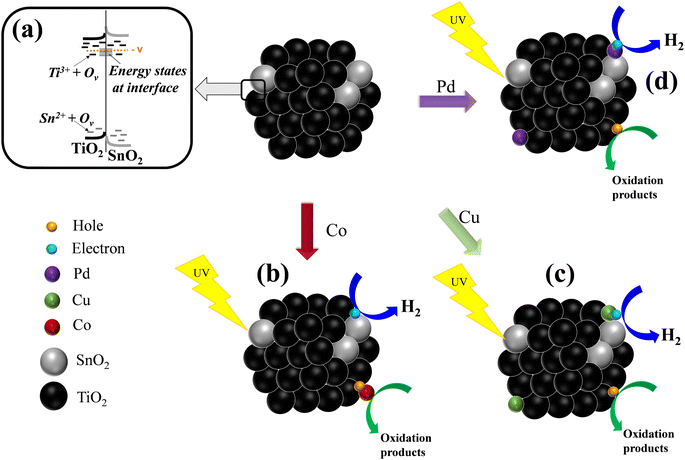
Thereby, it is confirmed that the transfer and internal separation of electrons is accelerated due to oxygen vacancies and the presence of co-catalysts. First, by irradiation of the BST structure, the presence of states (Ti3+/Sn2+), oxygen vacancies and energy states at the SnO2–TiO2 interface helped to decrease the recombination process (e−–h+) and increased the photocatalytic efficiency of the material to generate hydrogen (see Scheme 1a). Afterward, the interactivity between the metallic species and the BST material is analyzed as follows: By irradiating the BST impregnated with cobalt species, the holes photogenerated in the valence band (VB) of BST material are transferred to Co species in order to catalyze the oxidation reaction and the electrons migrated to the BST surface and carried out the reduction reaction9,95–99 (see Scheme 1b).
In the case of BST and copper species, electrons are separated and moved throughout the structure and can take 2 paths: (i) move to the surface of BST and perform the photocatalytic hydrogen generation or (ii) move to the Cu species. In the second path, the electrons increase their mobility and are transferred rapidly with the help of the Cu species on the surface, creating the active sites to catalyze the hydrogen generation or/and reduce Cu2+ to Cu+ (reaction (1) and Scheme 1c).9,91
| 2CuO + H2O + 2e− → Cu2O + 2OH− | (1) |
| Cu2O + 2OH− + 2h+ → 2CuO + H2O | (2) |
In the case of photogenerated holes in the structure, these can be reoxidize Cu+ to Cu2+ species or the methanol–water solution.9,91 Besides, the presence of Cu0 nanoparticles in the BST material helped to improve the mobility, separation and transport of electrons, thus increasing its photocatalytic activity.
On the other hand, in the interaction between the BST structure with the Pd species after irradiation, the electrons are separated and can take three routes: (i) move to the BST surface and catalyze the reduction reaction in order to generate hydrogen, (ii) move to the surface of BST and reduce Pd2+ into Pd0 species (see Scheme 1d and reaction (3)) or (iii) move to Pd0 nanoparticles, improving the mobility, separation and transport of electrons and catalyzing hydrogen generation.91–100
Besides, the photogenerated holes can also take two routes: (i) move to the surface of the BST material and carry out the oxidation reaction or (ii) migrate towards the metallic Pd species and carry out its in situ oxidation (see reaction (4) and Scheme 1d).
| PdO + H2O + 2e− → Pd0 + 2OH− | (3) |
| Pd0 + 2h+ + 2OH− → PdO + H2O | (4) |
Conclusion
The inclusion of SnO2 nanoparticles during the formation of TiO2 (sol–gel nucleation method), establishes a deep bond between SnO2 and TiO2 and a strong interaction, forming a white SnO2–TiO2 structure. Afterward, this structure was reduced by NaBH4 during the thermal treatment, generating (Ti3+/Sn2+) states and oxygen vacancies to form the black SnO2–TiO2 structure. Compared to the non-reduced one (white SnO2–TiO2), the black structure improved the separation and transport of electron–hole pairs, increasing the photocatalytic hydrogen generation. The interaction of a co-catalysts onto the surface of black SnO2–TiO2 caused an increase in the surface area, creating active sites for reduction reaction, additional defect states, and decreasing the recombination process of photogenerated charge carriers.The photocatalytic activity for H2 generation showed that the use of cobalt species favored the oxidation process and therefore, a substantial increase in the photocatalytic production of hydrogen was not observed. This behavior was verified with photoelectrochemical characterization through open circuit potential and photocurrent measurements. In contrast, the interaction with copper and palladium on black SnO2–TiO2 favors hydrogen generation because these co-catalysts improve the separation, mobility and transfer of electrons to the solution in order to catalyze the hydrogen reaction.
Data availability
The authors confirm that the data supporting the findings of this study are available within the article. These data were derived from the following resources: an X-ray diffractometer (Bruker D-2 Advance), a UV-vis diffuse reflectance spectroscopy Cary 100 spectrophotometer, a 3P Meso 222 Instrument Device, an X-ray photoelectron spectrometer with monochromatic Al Kα from a Thermo Fisher Scientific K-Alpha; for details of the measurement conditions, see the ESI,‡ transmission electron microscopy (TEM) was performed on a model JEM2100 (criotem) microscope, LaB6 200 kV in high-resolution mode. Images were taken under low-dose conditions to avoid beam damage to the samples. The (photo)electrochemical measurements were performed in an AUTOLAB 302 N potentiostat; for details of the measurement conditions, see the ESI.‡ Fluorescence measurements were performed in a Fluorolog-3 spectrofluorometer with a Xe lamp at room temperature, using a 218 nm excitation wavelength with an excitation slit width of 5 nm. Emission spectra were collected from 300 to 700 nm with the emission slit width at 5 nm. The data supporting this article have been included as part of the ESI.‡Conflicts of interest
The authors declare that they have no known competing financial interests or personal relationships that could have appeared to influence the work reported in this paper.Acknowledgements
Authors thank financial support of IPN 20240548, 20241042 and 20240484 SIP projects, the projects CONAHCYT CB 285711 and A1-S-18269, DGAPA PAPIIT-IN104022 and project NanoenRed of the “Convocatoria PRORED IPN 2024” and David A. Ramírez Ortega (CVU 329398) thanks CONAHCYT for the scholarship “Estancia Postdoctoral para la formación y consolidación de las y los Investigadores por México′′. Diana Guerrero-Araque acknowledges the Program of “Investigadoras e Investigadores por México” CONAHCYT-UAMI, ID-Investigador: 73698. We also thank the Laboratorio Universitario de Caracterización Espectroscópica (LUCE-UNAM), the Laboratorio Universitario de Nanotecnología Ambiental (LUNA-UNAM) and Electrochemistry Laboratory in UAM-I and the technical support provided by Mtra. Viridiana Maturano Rojas, Dra. Selene Islas Sánchez and Dr Ignacio González Martínez.References
- V. Kumaravel, S. Mathew, J. Bartlett and S. C. Pillai, Appl. Catal., B, 2019, 244, 1021–1064 CrossRef CAS.
- P. Ganguly, M. Harb, Z. Cao, L. Cavallo, A. Breen, S. Dervin, D. D. Dionysiou and S. C. Pillai, ACS Energy Lett., 2019, 4, 1687–1709 CrossRef CAS.
- M. Ismael, Fuel, 2021, 303, 121207 CrossRef CAS.
- J. Schneider, M. Matsuoka, M. Takeuchi, J. Zhang and Y. Horiuchi, Chem. Rev., 2014, 19, 9919–9986 CrossRef PubMed.
- H. Wang, J. Liu, X. Xiao, H. Meng, J. Wu, C. Guo, M. Zheng, X. Wang, S. Guo and B. Jiang, Chin. Chem. Lett., 2023, 34, 107125 CrossRef CAS.
- V. Etacheri, C. D. Valentin, J. Schneider, D. Bahnemann and S. C. Pillai, J. Photochem. Photobiol., C, 2015, 24, 1–29 CrossRef.
- R. Qian, H. Zong, J. Schneider, G. Zhou, T. Zhao, Y. Li, J. Yang, D. W. Bahnemann and J. H. Pan, Catal. Today, 2019, 335, 78–90 CrossRef CAS.
- D. Ramírez-Ortega, P. Acevedo-Peña, F. Tzompantzi, R. Arroyo, F. González and I. González, J. Mater. Sci., 2017, 52, 260–275 CrossRef.
- D. Guerrero-Araque, P. Acevedo-Peña, D. Ramírez-Ortega, L. Lartundo-Rojas and R. Gómez, J. Chem. Technol. Biotechnol., 2017, 92, 1531–1539 CrossRef CAS.
- B. Li, Q. Li, B. Gupta, C. He and J. Yang, Catal. Sci. Technol., 2020, 10, 7914–7921 RSC.
- J. Yang, J. Zhang, B. Zou, H. Zhang, J. Wang, U. Schubert and Y. Rui, ACS Appl. Nano Mater., 2020, 3, 4265–4273 CrossRef CAS.
- H. Tan, Z. Zhao, M. Niu, C. Mao, D. Cao, D. Cheng, P. Feng and Z. A. Sun, Nanoscale, 2014, 6, 10216–10223 RSC.
- S. Biswas, H. Y. Lee, M. Prasad, A. Sharma, J. S. Yu, S. Sengupta, D. D. Pathak and A. Sinhamahapatra, ACS Appl. Nano Mater., 2021, 4, 4441–4451 CrossRef CAS.
- H. Wang, X. Li and L. Tang, Phys. B, 2019, 556, 31–35 CrossRef CAS.
- H. Kusama, M. Kurashige, K. Sayama, M. Yanagida and H. Sugihara, J. Photochem. Photobiol., A, 2007, 189, 100–104 CrossRef CAS.
- S. M. K. Abdelmaksoud and A. Sayed, J. Mater. Res., 2021, 36, 2118–2131 CrossRef.
- S. P. Kim, M. Y. Choi and H. C. Choi, Mater. Res. Bull., 2016, 74, 85–89 CrossRef CAS.
- L. P. Chikhale, F. I. Shaikh, I. S. Mulla and S. S. Suryavanshi, J. Mater. Sci.: Mater. Electron., 2017, 28, 12063–12069 CrossRef CAS.
- M. P. De la Flor, R. Camarillo, F. Martínez, C. Jiménez, R. Quiles and J. Rincon, J. Environ. Chem. Eng., 2022, 10, 107245 CrossRef CAS.
- V. G. Deshmane, S. L. Owen, R. Y. Abrokwah and D. Kuila, J. Mol. Catal. A: Chem., 2015, 408, 202–213 CrossRef CAS.
- R. W. D. Wei, X. Y. Liu, S. C. Cui and J. G. Liu, RSC Adv., 2017, 7, 25650–25656 RSC.
- H. W. Kim, H. S. Kim, M. A. Kebede, H. G. Na and J. C. Yang, Met. Mater. Int., 2010, 16, 77–81 CrossRef CAS.
- J. Panpranot, K. Kontapakdee and P. Praserthdam, J. Phys. Chem. B, 2006, 110(15), 8019–8024 CrossRef CAS PubMed.
- M. O'Shaughnessy, P. R. Spackman, M. A. Little, L. Catalano, A. James, G. M. Day and A. Copper, Chem. Commun., 2022, 58, 13254–13257 RSC.
- Z. Wang, C. Yang, T. Lin, H. Yin, P. Chen, D. Wan, F. Xu, F. Huang, J. Lin, X. Xie and M. Jiang, Energy Environ. Sci., 2013, 6, 3007–3014 RSC.
- A. Naldoni, M. Altomare, G. Zoppellaro, N. Liu, Š. Kment, R. Zbořil and P. Schmuki, ACS Catal., 2019, 9, 345–364 CrossRef CAS PubMed.
- J. Long, W. Xue, X. Xie, Q. Gu, Y. Zhou, Y. Chi, W. Chen, Z. Ding and X. Wang, Catal. Commun., 2011, 16, 215–219 CrossRef CAS.
- Y. Duan, W. Yang, W. Zheng, G. He, M. Chen and M. Tian, Nanoscale Res. Lett., 2019, 14, 302 CrossRef PubMed.
- Q. Liu, H. Zhan, X. Huang, Y. Song, S. He, X. Li, C. Wang and Z. Xie, Eur. J. Inorg. Chem., 2021, 42, 4370–4376 CrossRef.
- B. Liu, J. Wang, I. P. Parkin and X. Zhao, Phys. Chem. Chem. Phys., 2021, 23, 8300–8308 RSC.
- C. Cheng, W. H. Fang, R. Long and O. V. Prezhdo, JACS Au, 2021, 1, 550–559 CrossRef CAS PubMed.
- F. Platero, A. López-Martín, A. Caballero, T. C. Rojas, M. Nolan and G. Colón, ACS Appl. Nano Mater., 2021, 4, 3204–3219 CrossRef CAS.
- V. Ramakrishnan, H. Kim, J. Park and B. Yang, RSC Adv., 2016, 6, 9789–9795 RSC.
- J. Y. Eom, S. J. Lim, S. M. Lee, W. H. Ryu and H. S. Kwon, J. Mater. Chem., 2015, 3, 11183 RSC.
- Z. Pei, M. Zhu, Y. Huang, Y. Huang, Q. Xue, H. Geng and C. Zhi, Nano Energy, 2016, 20, 254–263 CrossRef CAS.
- H. Song, C. Li, Z. Lou, Z. Ye and L. Zhu, ACS Sustainable Chem. Eng., 2017, 5, 8982–8987 CrossRef CAS.
- Z. W. Zhou, L. Pan, Y. T. Liu, X. D. Zhuc and X. M. Xie, Chem. Commun., 2018, 54, 4790 RSC.
- S. H. Kang, Y. N. Jo, K. Prasanna, P. Santhoshkumar, Y. C. Joe, K. Vediappan, R. Gnanamuthu and C. W. Lee, J. Ind. Eng. Chem., 2019, 71, 177–183 CrossRef CAS.
- W. Dong, J. Xu, C. Wang, Y. Lu, X. Liu, X. Wang, X. Yuan, Z. Wang, T. Lin, M. Sui, I. W. Chen and F. Huang, Adv. Mater., 2017, 29, 1700136 CrossRef PubMed.
- X. Guan, P. Luo, X. Li, Y. Yu, D. Chen and L. Zhang, Int. J. Electrochem. Sci., 2018, 13, 5667–5680 CrossRef CAS.
- Q. Liu, F. Fei, Y. Xu, L. Gu, X. Ding, K. Wang, K. Du, S. Wang, X. Dong, L. Li, B. Li, N. Yuan and J. Ding, Org. Electron., 2023, 120, 106815 CrossRef CAS.
- M. Pisarek, M. Krawczyk, M. Hołdyński and W. Lisowski, ACS Omega, 2020, 5, 8647–8658 CrossRef CAS PubMed.
- T. Wang and L. Cheng, Sens. Actuators, B, 2021, 334, 129644 CrossRef CAS.
- X. Guo, J. Wan, X. Yu and Y. Lin, Chemosphere, 2016, 164, 421–429 CrossRef CAS PubMed.
- M. P. Chávez-Díaz, R. M. Luna-Sánchez and J. Vazquez-Arenas, J. Solid State Electrochem., 2019, 23, 3187–3196 CrossRef.
- M. C. Biesinger, L. W. M. Lau, A. R. Gerson, R. St and C. Smart, Appl. Surf. Sci., 2010, 257, 887–898 CrossRef CAS.
- H. Idriss and M. A. Barteau, Catal. Lett., 1994, 26, 123–139 CrossRef CAS.
- A. F. Carley, P. R. Chalker, J. C. Riviere and M. W. Roberts, J. Chem. Soc., Faraday Trans., 1987, 83, 351–370 RSC.
- M. Z. Abid, K. Rafiq, A. Rauf, R. H. Althomali and E. Hussain, Mater. Adv., 2024, 5, 2238–2252 RSC.
- W. C. Peng, Y. C. Chen, J. L. He, S. L. Ou, R. H. Horng and D. S. Wuu, Sci. Rep., 2018, 8, 9255 CrossRef PubMed.
- R. Gouttebaron, D. Cornelissen, R. Snyders, J. P. Dauchot, M. Wautelet and M. Hecq, Surf. Interface Anal., 2000, 30, 527–530 CrossRef CAS.
- B. Siemensmeyer and J. W. Schultze, Surf. Interface Anal., 1990, 16, 309–314 CrossRef CAS.
- C. N. Bell, D. C. Lee, M. N. Drexler, C. M. Rouleau, K. Sasaki, S. D. Senanayake, M. D. Williams and F. M. Alamgir, Thin Solid Films, 2021, 717, 138437 CrossRef CAS.
- C. He, S. Chang, X. Huang, Q. Wang, A. Mei and P. K. Shen, Nanoscale, 2015, 7, 2856–2861 RSC.
- V. Natu, M. Benchakar, C. Canaff, A. Habrioux and S. Celerier, Matter, 2021, 4, 1224–1251 CrossRef CAS.
- X. Jiang, Z. Yan, J. Zhang, J. Gao, W. Huang, Q. Shi and H. Zhang, RSC Adv., 2019, 9, 36907–36914 RSC.
- L. L. Hench and J. K. West, Chem. Rev., 1990, 90, 33–72 CrossRef CAS.
- M. Kwoka and M. Krzywiecki, Beilstein J. Nanotechnol., 2017, 8, 514–521 CrossRef CAS PubMed.
- A. Kumar, L. Rout, L. Satish, K. Achary, A. Mohanty, R. S. Dhaka and P. Dash, RSC Adv., 2016, 6, 32074–32088 RSC.
- M. Kwoka, G. Czempik and J. Szuber, Acta Phys. Slovaca, 2005, 55, 331–339 CAS.
- J. Szuber, G. Czempik, R. Larciprete, D. Koziej and B. Adamowicz, Thin Solid Films, 2001, 391, 198–203 CrossRef CAS.
- P. A. Grutsch, M. V. Zeller and T. P. Fehlner, Inorg. Chem., 1973, 12, 1431–1433 CrossRef CAS.
- Q. Zeng, Y. Cui, L. Zhu and Y. Yao, Mater. Sci. Semicond. Process., 2020, 111, 104962 CrossRef CAS.
- F. A. Akgul, C. Gumus, O. E. Ali, A. H. Farha, G. Akgul, Y. Ufuktepe and Z. Liu, J. Alloys Compd., 2013, 579, 50–56 CrossRef CAS.
- M. Kwoka, L. Ottaviano, M. Passacantando, S. Santucci, G. Czempik and J. Szuber, Thin Solid Films, 2005, 490, 36–42 CrossRef CAS.
- G. Korotcenkov, V. Brinzari, P. Hanyš and V. Nehasil, Surf. Interface Anal., 2018, 50, 795–801 CrossRef CAS.
- F. Lu, X. Ji, Y. Yang, W. Deng and C. E. Banks, RSC Adv., 2013, 3, 18791–18793 RSC.
- J. M. Themlin, M. Chtaïb, L. Henrard, P. Lambin, J. Darville and J. M. Gilles, Phys. Rev. B, 1992, 46, 2460–2466 CrossRef CAS PubMed.
- S. Süzer, Pure Appl. Chem., 1997, 69, 163–168 CrossRef.
- D. Shuttleworth, J. Phys. Chem., 1980, 84, 1629–1634 CrossRef CAS.
- R. O. Ansell, T. Dickinson, A. F. Povey and P. M. A. Sherwood, J. Electrochem. Soc., 1977, 124, 1360 CrossRef CAS.
- D. Kolokolov, A. Podurets, A. Fomkina, N. Bobrysheva, M. Osmolowsky, M. Voznesenskiy and O. Osmolovskaya, J. Phys. Chem. Solids, 2024, 185, 11750 CrossRef.
- S. Tair, P. R. Ghediya, A. N. Ech-Chergui, M. Guezzoul, S. K. Mukherjee, K. Driss-Khodja, R. Singh, J. Ray and B. Amrani, Phys. Scr., 2022, 97, 095810 CrossRef CAS.
- M. A. Gunawan, O. Moncea, D. Poinsot, M. Keskes, B. Domenichini, O. Heintz, R. Chassagnon, F. Herbst, R. M. K. Carlson, J. E. P. Dahl, A. A. Fokin, P. R. Schreiner and J. C. Hierso, Adv. Funct. Mater., 2018, 28, 1705786 CrossRef.
- Á. Prekob, G. Muránszky, I. Kocserha, B. Fiser, F. Kristály, G. Halasi, Z. Kónya, B. Viskolcz and L. Vanyorek, Catal. Lett., 2020, 150, 505–513 CrossRef.
- L. P. A. Guerrero-Ortega, E. Ramírez-Meneses, R. Cabrera-Sierra, L. M. Palacios-Romero, K. Philippot, C. R. Santiago-Ramírez, L. Lartundo-Rojas and A. Manzo-Robledo, J. Mater. Sci., 2019, 54, 13694–13714 CrossRef CAS.
- B. Chen, J. Lin, X. Chen, Y. Chen, Y. Xu, Z. Wang, W. Zhang and Y. Zheng, ACS Omega, 2019, 4, 18582–18592 CrossRef CAS PubMed.
- Y. Xiao, J. Li, C. Wang, F. Zhong, Y. Zheng and L. Jiang, Catal. Sci. Technol., 2021, 11, 836–845 RSC.
- L. S. Kibis, A. I. Titkov, A. I. Stadnichenko, S. V. Koscheev and A. I. Boronin, Appl. Surf. Sci., 2009, 255, 9248–9254 CrossRef CAS.
- F. Yin, S. Ji, P. Wu, F. Zhao and C. Li, J. Catal., 2008, 257, 108–116 CrossRef CAS.
- K. Dong, J. He, J. Liu, F. Li, L. Yu, Y. Zhang, X. Zhou and H. Ma, J. Phys. Chem. C, 2020, 114, 22181–22189 Search PubMed.
- O. Akhavan, R. Azimirad, S. Safad and E. Hasanie, J. Mater. Chem., 2011, 21, 9634–9640 RSC.
- L. Wang, C. Hou, H. Yu, Q. Zhang, Y. Li and H. Wang, ChemElectroChem, 2020, 7, 4446–4452 CrossRef CAS.
- J. I. Jung and D. D. Edwards, J. Solid State Chem., 2011, 184, 2238–2243 CrossRef CAS.
- A. Kumar and P. C. Srivastava, Mater. Sci., 2019, 37, 116–121 CAS.
- L. Fu, Y. Chen, Z. Liu and J. Mol, Catal A. Chem, 2015, 408, 91–97 CrossRef CAS.
- Z. Y. Wang, L. Wang, S. Liu, G. R. Li and X. P. Gao, Adv. Funct. Mater., 2019, 29, 1901051 CrossRef.
- H. Song, C. Li, Z. Lou, Z. Ye and L. Zhu, ACS Sustainable Chem. Eng., 2017, 5, 8982–8987 CrossRef CAS.
- C. Yuan, Y. Shen, C. Zhu, P. Zhu, F. Yang, J. Liu and C. An, ACS Sustainable Chem. Eng., 2022, 10, 10311–10317 CrossRef CAS.
- C. Xu, X. Wang and J. Zhu, J. Phys. Chem. C, 2008, 50, 19841–19845 CrossRef.
- D. Ramírez-Ortega, D. Guerrero-Araque, P. Acevedo-Peña, L. Lartundo-Rojas and R. Zanella, J. Mater. Sci., 2020, 55, 16641–16658 CrossRef.
- Y. Piña-Pérez, E. Samaniego-Benítez, J. H. Sierra-Uribe, F. González, F. Tzompantzi, L. Lartundo-Rojas and A. Mantilla, J. Environ. Chem. Eng., 2023, 11, 109760 CrossRef.
- D. Ramírez-Ortega, D. Guerrero-Araque, J. H. Sierra-Uribe, R. Camposeco, R. Gómez and R. Zanella, Int. J. Hydrogen Energy, 2023, 48, 15956–15966 CrossRef.
- C. P. Plaisance and R. A. van Santen, J. Am. Chem. Soc., 2015, 46, 14660–14672 CrossRef PubMed.
- H. Li, J. Han, N. Guo and H. Yu, Chem. Commun., 2016, 52, 4080–4083 RSC.
- S. Song, Z. Liang, W. Fu and T. Peng, ACS Appl. Mater. Interfaces, 2017, 9, 17013–17023 CrossRef CAS PubMed.
- S. Song, J. Wang, T. Peng, W. Fu and L. Zan, Appl. Catal., B, 2018, 228, 39–46 CrossRef CAS.
- X. Zhang, J. Xiao, C. Peng, Y. Xiang and H. Chen, Appl. Surf. Sci., 2019, 465, 288–296 CrossRef CAS.
- S. Bala, I. Mondal, A. Goswami, U. Pal and R. Mondal, J. Mater. Chem. A, 2015, 3, 20288–20296 RSC.
- H. Bahruji, M. Bowker, P. R. Davies, D. J. Morgan, C. A. Morton, T. A. Egerton, J. Kennedy and W. Jones, Top. Catal., 2015, 58, 70–76 CrossRef CAS.
Footnotes |
| † In memoriam this work is dedicated to Professor Dr Ricardo Gómez Romero. |
| ‡ Electronic supplementary information (ESI) available. See DOI: https://doi.org/10.1039/d4ra03731f |
| This journal is © The Royal Society of Chemistry 2024 |

