 Open Access Article
Orthorhombic–tetragonal phase coexistence and enhanced piezoelectric properties at room temperature in Zn and Ta modified (Ba0.95Ca0.05)(Zr0.05Ti0.95)O3 ceramics through the synergistic effect of lattice distortion
Nabil Dhifallah *,
Mohamed Amin Hentati and
Hamadi Khemakhem
Laboratory of Multifunctional Materials and Applications (LaMMA), University of Sfax, Faculty of Sciences of Sfax, Soukra Road PB 1171, Sfax, 3000, Tunisia. E-mail: dhifallahnabil@yahoo.fr
First published on 27th August 2024
Abstract
This study provides a fundamental understanding of the enhanced piezoelectric properties in ABO3 perovskite based lead-free piezoelectric materials. For this we synthesized (Ba0.95Ca0.05)(Zr0.05Ti0.95−x(Zn1/3Ta2/3)x)O3((1 − x)BCZT–(x)ZT) (x = 0.00, 0.005, 0.01, and 0.02) solid solutions exhibiting high piezoelectric response. The (1 − x)BCZT–xZT materials are synthesized by a high-temperature solid-state ceramic reaction method by varying x in the full range (x = 0.00–0.02). In-depth exploratory research is performed on the structural, dielectric, ferroelectric, and piezoelectric properties of (1 − x)BCZT–(x)ZT ceramics. The formation of perovskite structure for all ceramics without the presence of any impurity phases is confirmed by X-ray diffraction (XRD) analyses, which also reveals that the Ca2+, Zr4+, Zr2+ and Ta5+ are well dispersed within the BaTiO3 lattice. For all (1 − x)BCZT–(x)ZT ceramics, thorough investigation of phase formation and phase-stability using XRD, Rietveld refinement, Raman spectroscopy, and temperature-dependent dielectric measurements provide conclusive evidence for the coexistence of orthorhombic + tetragonal (Amm2 + P4mm) phases at room temperature. The steady transition of Amm2 crystal symmetry to P4mm crystal symmetry with increasing x content is also demonstrated by Rietveld refinement data and related analyses. The c/a ratio of the tetragonal phase greatly influenced the electric properties of the ceramics. The c/a ratio of the tetragonal phase increases from 1.0112 for x = 0 to 1.0157 for x = 0.005 and subsequently decreases to 1.0038 for x = 0.02. When the c/a of the tetragonal phase reaches its maximum value, the ceramic with x = 0.005 has the best piezoelectricity (d33 ∼ 297 pC N−1). The calculated degree of relaxation (γ) increases with the increase in BZT content, indicating that the BCZT–xBZT ceramics are ferroelectric materials with diffuse phase transition. Main dielectric, piezoelectric and ferroelectric parameters of (1−x)BCZT–xZT ceramics were optimized around x = 0.005 with a high piezoelectric coefficient (d33 = 297 pC N−1), a remnant polarization (Pr = 7.58 μC cm−2), spontaneous polarization (Ps = 10.25 μC cm−2) and a high dielectric constant (εmax,Tc = 4449 at Tc and 2330 near RT) at 1 kHz, indicating promising applications for lead-free piezoelectric ceramics.
1. Introduction
Lead zirconate titanate (PZT) based piezoelectric ceramics have played a role in the piezoelectric applications because of their outstanding piezoelectric properties and good temperature stability.1,2 However, due to the toxicity of lead compounds, several research groups have focused on developing new lead-free alternative materials with comparable piezoelectric and electromechanical properties to their lead-based counterparts.3,4 Barium titanate (BaTiO3) is one of the most widely studied lead-free piezoelectric materials.5,6 It has a relatively simple structure and show polymorphic phase transitions.7 At atmospheric pressure, it undergoes structural phase transitions from cubic-to-tetragonal phase at 405 K, tetragonal-to-orthorhombic phase at 273 K, and finally orthorhombic-to-rhombohedral phase at 200 K. The high temperature cubic phase is paraelectric, and all low temperature phases are ferroelectric. The reported piezoelectric charge coefficient (d33) of pure BaTiO3 ceramic is 190 pC N−1.8 However, this value increases to as high as 420 and 300 pC N−1 in the vicinity of tetragonal-to-orthorhombic and orthorhombic-to-rhombohedral transition temperature, respectively.9 This observation suggests that high piezoelectric coefficient can be achieved by bringing the T–O phase transition temperature near the room temperature with the help of a dopant or by making a solid solution.5 Yu et al.10 has observed optimum piezoelectric properties from 5 mol% Zr4+ substitution in BaTiO3, i.e., Ba(Zr0.05Ti0.95)O3. The tetragonal-to-orthorhombic phase transition temperature is nearly 58 °C in this composition having orthorhombic symmetry at room temperature (27 °C). For this composition, the reported tetragonal-to-orthorhombic phase transition temperatures are nearly 331 K having orthorhombic symmetry at room temperature (300 K). Recently, Li et al..11 have shown that the piezoelectric properties of Ba(Zr0.05Ti0.95)O3 can further be improved by doping with calcium (Ca2+). The key advantage of calcium doping is that it decreases the tetragonal-to-orthorhombic and orthorhombic-to-rhombohedral phase transition temperatures of Ba(Zr0.05Ti0.95)O3 without affecting the cubic-to-tetragonal transition temperature. Therefore, tailoring of tetragonal-to-orthorhombic transition temperature can be achieved without lowering the cubic-to-tetragonal transition temperature. We have recently investigated dielectric, piezoelectric and structural behaviour of (Ba1−xCax)(Zr0.05Ti0.95)O3 ceramic, showing a phase transition TO–T at RT for x = 0.05, and revealing high electro-mechanical properties11 and thermal stability of piezoelectric coefficients12 and has a Curie temperature (TC ∼ 120 °C) higher than that of Ba0.85Ca0.15Ti0.9 Zr0.1O3 (TC ∼ 93 °C).13 It is, therefore, expected that this ceramic will give a better electro-caloric effect.Current methods to optimize the performance of piezoelectric ceramics include the construction of morphotropic phase boundaries (MPBs),14,15 ionic doping,16 and the introduction of local structural heterogeneities.16,17 Tracing back to the source, the essence of these methods is based on ease of domain flipping during polarization, which is influenced by the deformation of oxygen octahedra in the perovskite structures (ABO3). It is found that most stable octahedral structures are not ideal positive octahedral structures, having instead undergone distortions that change the symmetry and energy band structure of the perovskite structures while bringing about entirely new properties. Octahedral distortion and displacement of A/B sites are the origins of spontaneous polarization of ferroelectrics, which directly affects the piezoelectric response behavior. Li et al.18 have confirmed that the high piezoelectric properties originate from the high lattice distortion of textured ceramics under the action of applied electric fields, providing an intrinsic contribution to the piezoelectric response. Wang et al.19 have induced octahedral tilt by BaSnO3 doping with a large tolerance factor, rendering excellent piezoelectricity (d33 ∼ 354 pC N−1) and high thermal stability (20–100 °C). Therefore, it is feasible to obtain high piezoelectric properties and good thermal stability by the rational arrangement of the crystal structure. It has been shown that effective doping could bring suitable octahedral distortion.20,21 The octahedral distortion can be explained by the Juhn–Teller effect (JTE), which reveals the conformational deformation of the electronic cloud of a nonlinear molecule under certain circumstances, leading to a further decrease in the system energy by reducing the symmetry and orbital simplicity of the molecule.22 When different ions are doped into the ceramic lattice, they render different hybridization effects with surrounding atoms because of the different electronegativity and ionic radii, influencing the lattice distortion of ion-doped ceramics.
In addition to XRD, Raman spectroscopy has also been used to determine the structural modifications and the phase transitions in perovskite-like materials, including the BaTiO3 family,23 oxide spinel ferrites,24 and was established as a powerful tool to study correlated materials.25 Numerous Raman studies engaged in the correlation of the observed Raman modes to the presence of Jahn–Teller (JT) distortions in the manganite system.26,27 This technique is non-destructive and versatile, allowing measurements with adjusted spatial resolution and under different conditions of temperature, pressure, and electric field, in order to enhance the understanding about chemical bonding and local distortion of BO6 octahedra, causing different macroscopic responses.28–31 For example, Buscaglia et al.29 identified the ferroelectric-to-paraelectric transition in Ba(Zr,Ti)O3 compounds by using temperature-dependent Raman spectroscopy. More recently, Coondoo et al.32 reported a detailed temperature-dependent Raman investigation only of a 0.5Ba(Ti0.8Zr0.2)O3–0.5(Ba0.7Ca0.3)TiO3 ceramic, identifying the phase transitions by using the intensity, frequency position and width of the main stretching vibrational mode of the bond in [TiO6] octahedra. In addition, for high-power applications, defect dipoles play a unique and important role in achieving a high piezoelectric coefficient d33. As we all know, the introduction of acceptor-doped piezoelectric ceramics leads to the “hardening” effect.33,34 The acceptor ion possesses a lower valence status compared to the substituted ion, as in the case of ZnO-doped BCZT.35,36 Consequently, defect dipoles are formed through charge compensation and external electric field to reduce the electrostatic field and create a pinning effect. B-site off centering displacement controls the tetragonality and is only weakly dependent on the A-site displacements.37 This implies the contribution of local structural distortions due to B-site substitutions towards enhanced piezoelectric response. In order to avoid the degradation of electrical performance, compensation for the B-site vacancies is urgently required. In the modication of BCZT-based ceramics, Ta with high Pauling electronegativity leads to significant improvements in the piezoelectric performance.38 When donor ions were added to ceramics, the oxygen vacancy concentration was restricted. As a result, the pinning of domains is reduced and the domain wall motion is promoted, which improves the electrical properties of ceramics.
In this work, a series of Zn an Ta will be introduced (Ba0.95Ca0.05)(Zr0.05Ti0.95)O3 (BCZT) ceramics, with the aim of achieving high piezoelectric performance. We have introduced different amounts of ZT, as a dopant, in the BCZT system to investigate the relationship between tetragonality degree (c/a), microstructure, lattice parameters, phase content and piezoelectric properties. Understanding this relationship is an important basis for modification operations. The successful preparation of ZT-doped BCZT piezoelectric ceramics will provide guidance to further improve the piezoelectric properties of different piezoelectric materials.
2. Experimental procedures
The (Ba0.95Ca0.05)(Zr0.05Ti0.95−x(Zn1/3Ta2/3)x)O3 (x = 0.00, 0.005, 0.01, and 0.02) (BCZT–xZT) ceramics were prepared by the conventional solid-state reaction technique. The reagent grade materials of BaCo3, CaCo3, TiO2, ZrO2, ZnO and Ta2O5 powders were weighed as starting powders according to the nominal stoichiometric ratio. All these materials were preheated at 150 °C for 4 h, weighted; mixed, and then grounded in an agate mortar using ethanol for 4 h.Then, the mixed powder was dried and calcined at 1250 °C for 12 h. Then, the obtained chamottes were remixed for 2 h with 5% by mass of polyvinylidene alcohol (PVA). After grinding, the mixture of powders was pressed 50 MPa into a pellet of 8 mm of diameter and 1 mm of thickness. After binder release at 600 °C for 4 h, the resulting disk ceramics were sintered at 1500 °C for 4 h. The phase structures of sintered ceramics were detected by X-ray diffraction (XRD, Panalytical X′Pert, using Cu-Kα (λ ∼ 1.5406 Å) radiation). The microstructure was examined by means of scanning electron microscopy analysis (SEM: JEOL SEM JCM 7000). The average grain size distribution was evaluated using Image J software. Raman spectra of sintered samples were recorded from 50 to 1000 cm−1 in a micro-Raman Spectrometer (LABRAM HR-800), working in a backscattering configuration, equipped with an He+ ion (λ = 633 nm) laser. The spectral resolution of the system was 3 cm−1.
Temperature dependence of dielectric properties of the ceramic samples was measured using an LCR meter (Agilent HP4284) in the temperature range from 300 K to 450 K and at different frequencies (1 kHz–1 MHz). The (P–E) loop was computed at a frequency of 15 Hz at room temperature with an applied electric field of 30 kV cm−1). The ferroelectric hysteresis loops were recorded using a high voltage amplifier with a current amplifier (GX 320 matrix) at the frequency of 15 Hz at room temperature under an applied electric field of 30 kV cm−1. The value of the piezoelectric constant (d33) was measured using Polyc quasi-static piezoelectric constant d33 meter.
3. Results and discussion
Fig. 1(a) shows the X-ray diffraction patterns of the (1−x)BCZT–xZT ceramics measured at room temperature, which all exhibit a pure perovskite structure without any trace of impurity phase, suggesting that both Ca, Zr, Zn and Ta diffuse into the host lattice to form a solid solution. The diffraction peaks at x = 0 correspond well with PDF#81-2200,39 suggesting that the crystalline structure of sample orthorhombic symmetry,40 in which two peaks of (022)O and (200)O are visible around 44.84°–45.09° in the enlarged Fig. 1(b).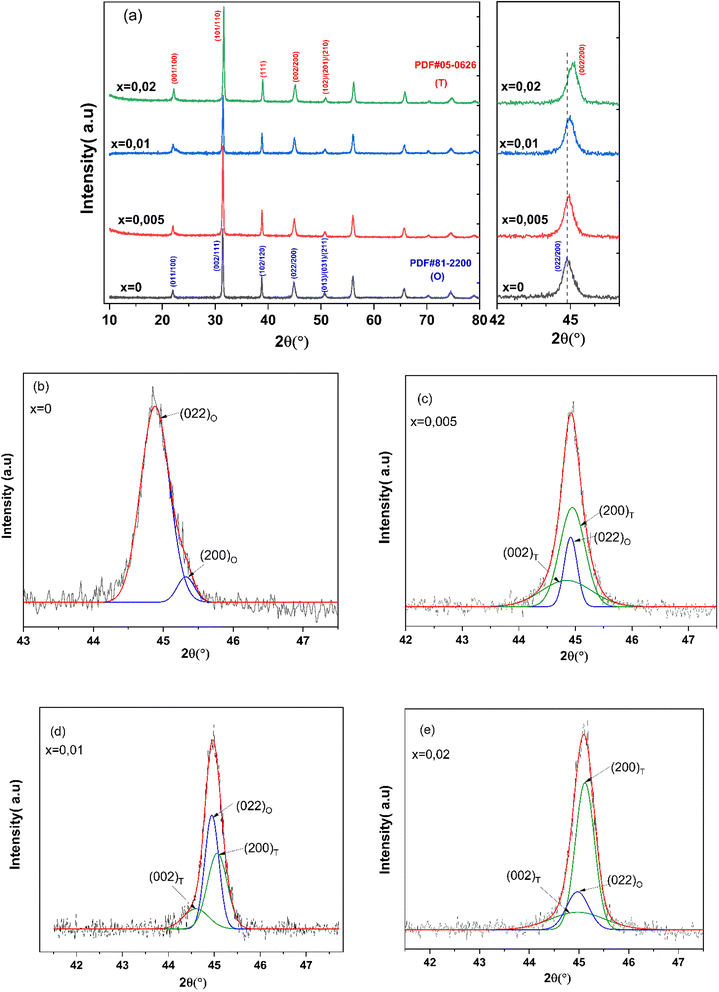 | ||
| Fig. 1 (a) X-ray diffraction patterns of the BCZT–xBZT ceramics. (b)–(e) X-ray diffraction patterns and fitting curves in the 2θ range of 44°–46°. | ||
Meanwhile, the coexistence of tetragonal and orthorhombic phases for x = 0.005, 0.010 and 0.02 at RT, confirms the morphotropic phase boundary (MPB) nature of these compositions. In fact, to observe the (200) peaks clearly, XRD patterns of the (1 − x)BCZT–xZT ceramics in the 2θ range of 44.84°–45.09° are shown in Fig. 1(c)–(e), respectively. The Voigt function is used to separate the overlapped (200) lines. Concerning the peaks, they can be regarded as the mixture of the three peaks. The splitting of two peaks (002) and (200) corresponds to the tetragonal phase; the orthorhombic symmetry is indicated by an obvious peak (022). The radius of Zn2+ (r = 0.74, ionic radius) and Ta5+ (r = 0.64, ionic radius) is lightly greater than that Ti4+ (r = 0.605, ionic radius) and Zr4+ (r = 0.72, ionic radius).41 That is why Zn2+ and Ta5+ occupying B site were added with Ti4+.
The diffraction peaks of BCZT–xZT ceramics exhibits pure orthorhombic structure (x = 0) with obvious splitting of the (022)/(200) peaks at ∼2θ = 44.84°, this imply that ZT doping induces the lattice distortion and forms morphotropic phase boundary (MPB) at room temperature.42,43 According to the report of the tolerance factors by Li et al.,44 take Zn2+ (r = 0.74 Å) and Ta5+ (r = 0.64 Å) into consideration, it is concluded that Zn2+/Ta5+ occupy B site, resulting in a change for the lattice parameter and oxygen vacancies. The oxygen vacancies contribute to the mass transport and improve the density during sintering process. These results confirm that the Zn2+/Ta5+ partially enters the B site in the lattice and changes the crystal structure,43,45 which affects that the peaks shift to higher angles.
To probe the structural transformations and provide a thorough analysis of phase formation and stabilization, we performed the Rietveld refinement of XRD patterns. Fig. 2(a)–(d) shows Rietveld fitted XRD patterns of (1 − x)BCZT–xZT materials with orthorhombic (Amm2) (PDF#81-2200) and tetragonal (P4mm) (PDF#05-0626) crystal structure. For x = 0, phase analyses reveal that the Amm2 phase percentage (68%) is larger than the P4mm phase (32%). However, as the amount of x (ZT-content) increases, the proportion of tetragonal phase symmetry gradually rises. This observation indicates that the ZT-concentration in the ceramics influences the specific phase formation and the sequence of phase-transformation. The refined structural parameters, such as lattice parameters, respective phase percentages, are presented in Table 1. Rietveld refinement analyses clearly authenticate the coexistence of both the Amm2 (O) and P4mm (T) phases which can play a vital role in enhancing the piezoelectric properties.44–46 Thus, combined XRD and Rietveld refinement analyses demonstrate the ability to control the structure and phase, which in turn influence the properties and performance, of resulting (1 − x)BCZT–xZT materials.47,48
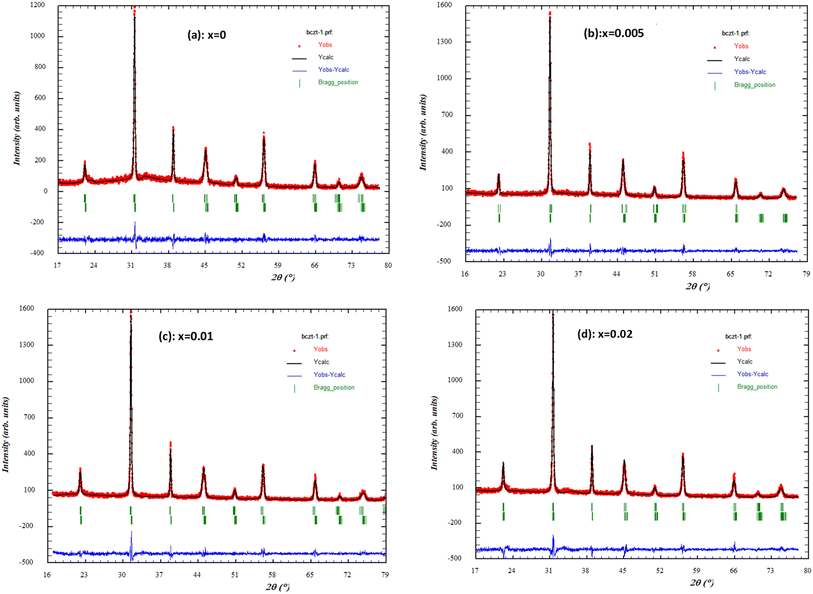 | ||
| Fig. 2 Rietveld fitted XRD patterns of (1 − x)BCZT–(x)ZT samples. (a) x = 0.0; (b) x = 0.005; (c) x = 0.01; (d) x = 0.02. | ||
| Parameters | x = 0 | x = 0.005 | x = 0.01 | x = 0.02 | |
|---|---|---|---|---|---|
| Lattice constants (a, b, c) of orthorhombic (O) phase with space group, Amm2 | a | 4![[thin space (1/6-em)]](https://www.rsc.org/images/entities/char_2009.gif) 005 005![[thin space (1/6-em)]](https://www.rsc.org/images/entities/char_2009.gif) 998 998 |
3.999910 | 400![[thin space (1/6-em)]](https://www.rsc.org/images/entities/char_2009.gif) 502 502 |
400![[thin space (1/6-em)]](https://www.rsc.org/images/entities/char_2009.gif) 208 208 |
| b | 3![[thin space (1/6-em)]](https://www.rsc.org/images/entities/char_2009.gif) 993 993![[thin space (1/6-em)]](https://www.rsc.org/images/entities/char_2009.gif) 685 685 |
4.004676 | 400![[thin space (1/6-em)]](https://www.rsc.org/images/entities/char_2009.gif) 762 762 |
397![[thin space (1/6-em)]](https://www.rsc.org/images/entities/char_2009.gif) 905 905 |
|
| c | 402![[thin space (1/6-em)]](https://www.rsc.org/images/entities/char_2009.gif) 678 678 |
4.024212 | 402![[thin space (1/6-em)]](https://www.rsc.org/images/entities/char_2009.gif) 174 174 |
40![[thin space (1/6-em)]](https://www.rsc.org/images/entities/char_2009.gif) 159 159 |
|
| Lattice constants (a, b, c) of tetragonal (T) phase with space group, P4mm | a | 4![[thin space (1/6-em)]](https://www.rsc.org/images/entities/char_2009.gif) 004 004![[thin space (1/6-em)]](https://www.rsc.org/images/entities/char_2009.gif) 152 152 |
398![[thin space (1/6-em)]](https://www.rsc.org/images/entities/char_2009.gif) 249 249 |
398![[thin space (1/6-em)]](https://www.rsc.org/images/entities/char_2009.gif) 753 753 |
400![[thin space (1/6-em)]](https://www.rsc.org/images/entities/char_2009.gif) 208 208 |
| b | 4![[thin space (1/6-em)]](https://www.rsc.org/images/entities/char_2009.gif) 004 004![[thin space (1/6-em)]](https://www.rsc.org/images/entities/char_2009.gif) 152 152 |
398![[thin space (1/6-em)]](https://www.rsc.org/images/entities/char_2009.gif) 249 249 |
398![[thin space (1/6-em)]](https://www.rsc.org/images/entities/char_2009.gif) 753 753 |
400![[thin space (1/6-em)]](https://www.rsc.org/images/entities/char_2009.gif) 208 208 |
|
| c | 4![[thin space (1/6-em)]](https://www.rsc.org/images/entities/char_2009.gif) 049 049![[thin space (1/6-em)]](https://www.rsc.org/images/entities/char_2009.gif) 344 344 |
404![[thin space (1/6-em)]](https://www.rsc.org/images/entities/char_2009.gif) 934 934 |
40![[thin space (1/6-em)]](https://www.rsc.org/images/entities/char_2009.gif) 426 426 |
401![[thin space (1/6-em)]](https://www.rsc.org/images/entities/char_2009.gif) 753 753 |
|
| c/a (P4mm) | 101![[thin space (1/6-em)]](https://www.rsc.org/images/entities/char_2009.gif) 129 129 |
101![[thin space (1/6-em)]](https://www.rsc.org/images/entities/char_2009.gif) 572 572 |
101![[thin space (1/6-em)]](https://www.rsc.org/images/entities/char_2009.gif) 381 381 |
100![[thin space (1/6-em)]](https://www.rsc.org/images/entities/char_2009.gif) 386 386 |
|
| Phase (%) | O | 68 | 59 | 54 | 41 |
| T | 32 | 41 | 46 | 59 | |
| Density ρ (g cm−3) | 5.37 | 5.55 | 5.44 | 5.43 | |
| Average grain size g (μm) | 11.31 | 20.54 | 15.36 | 13.78 | |
| Crystallite size D (nm) | 5![[thin space (1/6-em)]](https://www.rsc.org/images/entities/char_2009.gif) 753 753![[thin space (1/6-em)]](https://www.rsc.org/images/entities/char_2009.gif) 278 278 |
3![[thin space (1/6-em)]](https://www.rsc.org/images/entities/char_2009.gif) 677 677![[thin space (1/6-em)]](https://www.rsc.org/images/entities/char_2009.gif) 825 825 |
343![[thin space (1/6-em)]](https://www.rsc.org/images/entities/char_2009.gif) 203 203 |
3![[thin space (1/6-em)]](https://www.rsc.org/images/entities/char_2009.gif) 573 573![[thin space (1/6-em)]](https://www.rsc.org/images/entities/char_2009.gif) 557 557 |
|
| Microstrain ε | 1.1 × 10⁻³ | 1.92 × 10⁻³ | 1.47 × 10⁻³ | 1.69 × 10⁻³ | |
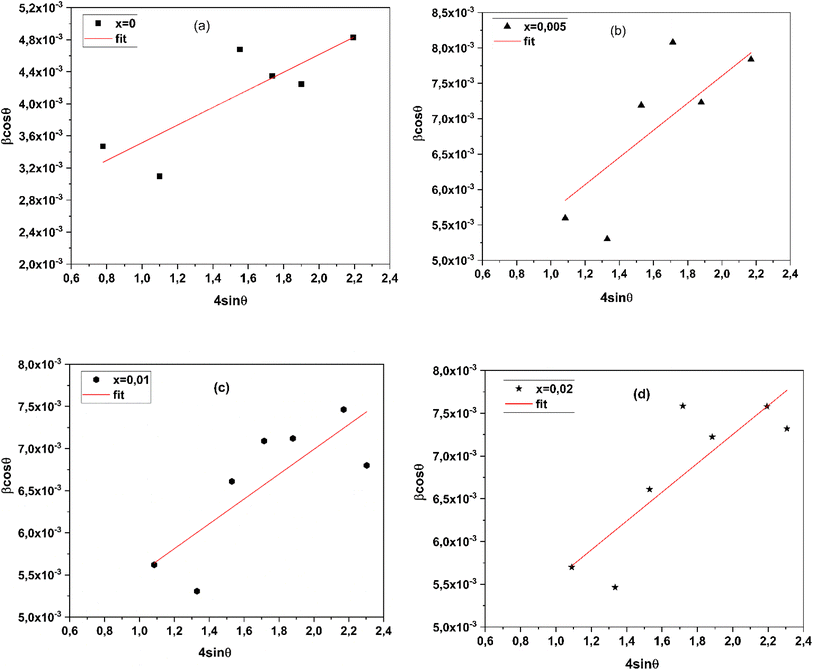
According to the XRD results, the average crystallite size D and the constraint ε of the (1 − x)BCZT–xZT materials could be estimated using the Williamson–Hall (W–H) approach:49
 represents the enlargement due to the crystallite size and 4ε
![[thin space (1/6-em)]](https://www.rsc.org/images/entities/char_2009.gif) sin
sin![[thin space (1/6-em)]](https://www.rsc.org/images/entities/char_2009.gif) θ represents the enlargement due to the distortion of the crystal lattice. The linear plot of β
θ represents the enlargement due to the distortion of the crystal lattice. The linear plot of β![[thin space (1/6-em)]](https://www.rsc.org/images/entities/char_2009.gif) cos
cos![[thin space (1/6-em)]](https://www.rsc.org/images/entities/char_2009.gif) θ versus 4
θ versus 4![[thin space (1/6-em)]](https://www.rsc.org/images/entities/char_2009.gif) sin
sin![[thin space (1/6-em)]](https://www.rsc.org/images/entities/char_2009.gif) θ yields the intercept as the crystallite size and the slope as the strain, as shown in Fig. 3(a)–(d). The observed positive slope confirmed the tensile strain experienced in the smaller sized grain. The values of D and ε were calculated from the y-intercept and slope of the fitted line, respectively, and are presented in Table 1. These values of lattice distortion were comparable with those previously reported for the ABO3 structure.50
θ yields the intercept as the crystallite size and the slope as the strain, as shown in Fig. 3(a)–(d). The observed positive slope confirmed the tensile strain experienced in the smaller sized grain. The values of D and ε were calculated from the y-intercept and slope of the fitted line, respectively, and are presented in Table 1. These values of lattice distortion were comparable with those previously reported for the ABO3 structure.50
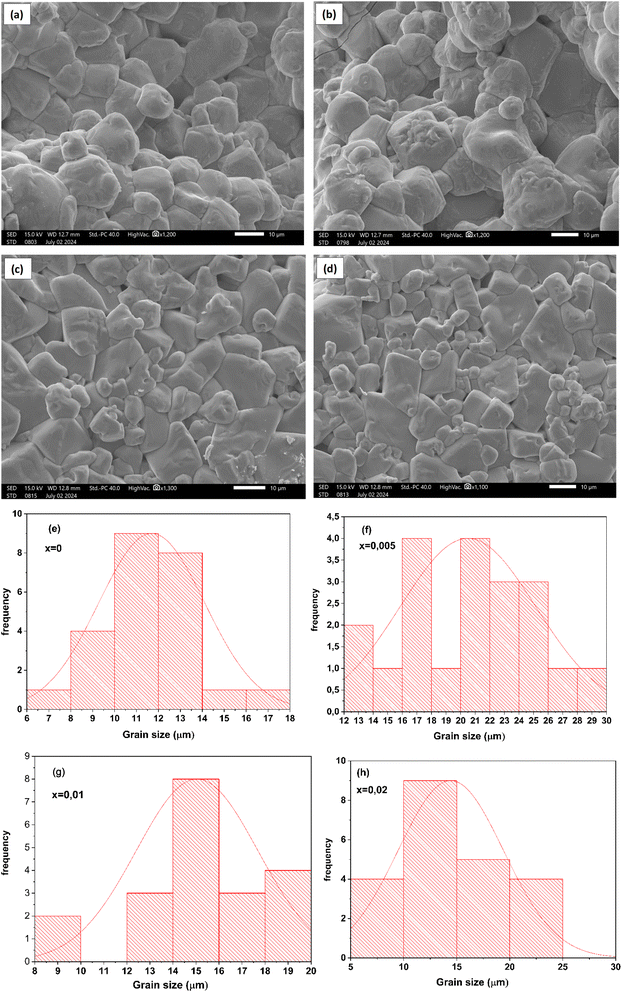
Fig. 4(a)–(d) shows the SEM micrographs of the surface of the BCZT–xZT ceramics (x = 0, 0.005, 0.01, 0.02) including the histogram that illustrates the variation of grain size spectra for various x contents are shown in Fig. 4(e)–(h), respectively. It can be observed that all samples showed high density with low porosity and the grain size was gradually increased by increasing the BZT content. The BCZT ceramic has the smallest average grain size, 10.42 μm, without any addition of ZnO/Ta2O5.
Table 1 lists the density ρ and average grain size g of BCZT–xZT ceramics. The pure BCZT ceramics possess lower density than that of samples with ZnO/Ta2O5 addition. For those BCZT ceramics doped ZnO/Ta2O5 less than x = 0.005, the density ρ and average grain size g increase with adding ZnO/Ta2O5. The average grain size g increased from 11.31 μm to 20.54 μm. The BCZT–0.005ZT ceramics shows the largest density ρ. However, further doping the ZnO/Ta2O5 (>0.005) the density ρ and average grain size g decrease. However, when the concentration of BZT is greater than x = 0.005, the grains become much smaller, because ZnO/Ta2O5 may stockpile in the grain boundary and suppress the grain growth. According to Han's report,51 the Zn2+/Ta5+ substitution into the (Ti)4+ site results in the generation of oxygen vacancy. Therefore, we believe that the grain growth of ZnO/Ta2O5-doped BCZT ceramics is due to the presence of oxygen vacancy that helps the mass transport.52
Raman spectroscopy is a nondestructive probe of the structure of ferroelectric materials owing to its sensitivity to local symmetry. Raman scattering also provides information about local heterogeneities related to compositional and structural disorder because of the shorter coherence length and time scale of phonons. Therefore, the Raman spectra of the BCZT–xZT system have been studied as a function of composition for realizing ZT doping effects to local heterogeneities structure of BCZT–xZT ceramics. The reduced intensity, corrected for the Bose–Einstein phonon population, was reckoned from stokes components of observed Raman scattering intensity, I(ω) as follows.53
 represents the Bose–Einstein population factor, ħ and kB indicate Dirac and Boltzmann constants, respectively.
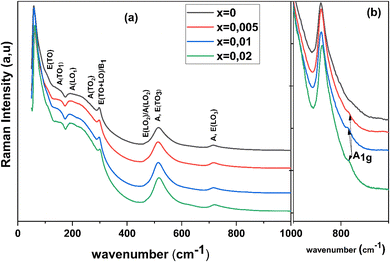
The composition dependent Raman spectra measured at room temperature of the BCZT–xZT is shown in Fig. 5(a). The observed Raman spectra exhibit a similar profile of the pure BaTiO3 (BT).54,55 Therefore, the effective vibrational modes of BCZT–xZT ceramics are similar to that of pure BT. Pure BT is a typical ferroelectric material and it has tetragonal structure at room temperature. In the paraelectric cubic phase, the Raman modes of BT transform as the 3F1u + F2u irreducible presentations of the Pm![[3 with combining macron]](https://www.rsc.org/images/entities/char_0033_0304.gif) m symmetry. The F2u mode is silent and F1u modes are only infrared active. Therefore, the Raman activity is not allowed in the paraelectric phase with perfect cubic symmetry. A ferroelectric tetragonal phase with P4mm symmetry has 3A1 and 3E modes, which comes from infrared active F1u modes and one silent (E + B1) mode arises from F2u mode. Each of the A and E modes splits into transverse optic (TO) and longitudinal optic (LO) modes due to long-range electrostatic forces associated with lattice ionicity. The detailed mode symmetry assignments of BaTiO3 are reported elsewhere.56
m symmetry. The F2u mode is silent and F1u modes are only infrared active. Therefore, the Raman activity is not allowed in the paraelectric phase with perfect cubic symmetry. A ferroelectric tetragonal phase with P4mm symmetry has 3A1 and 3E modes, which comes from infrared active F1u modes and one silent (E + B1) mode arises from F2u mode. Each of the A and E modes splits into transverse optic (TO) and longitudinal optic (LO) modes due to long-range electrostatic forces associated with lattice ionicity. The detailed mode symmetry assignments of BaTiO3 are reported elsewhere.56
The spectrum includes all modes allowed by Raman selection rules; however, except for the forbidden prominent peak near 555 cm−1 and broadening of bands associated with compositional disordering. The otherwise strong spectral dip observed in BTO near 180 cm−1 (ref. 57) and understood as a result of the anti-resonance effect owing to anharmonic coupling among three A(TO) phonons, is less pronounced in the BCZT composition. Dominant A(TO) character is evident for the peaks observed near 265 cm−1 and 512 cm−1; the former being associated with polar Ti–O vibrations while the latter is related to distortion in the TiO4 plane and bending of the Ti ion and apical oxygen atoms. Another band at around 297 cm−1 assigned to a combined mode [B1, E (TO + LO)] is also considered as a particular distinctive of the tetragonal phase. The Raman mode assignments are considered to be the same as those for pure BaTiO3,54,55 whereas a clear mode was labeled at 190 cm−1 for the all compounds and reported to be assigned to the A (LO) mode.58,59 This band is reported to be more noticeable in the rhombohedral (R) and orthorhombic(O) phases, and it disappears in the tetragonal phase,58–60 which suggests the co-existence of orthorhombic and tetragonal phases in accordance with the X-ray diffraction data. Generally, additional phonon modes appear owing to size effects, change in inter-atomic forces due to chemical substitution and high mechanical pressure which causes disorder in the position of Ti atoms that breaks the Raman selection rules.61,62 The characteristic LO mode at ∼716 cm−1 is due to the bending and stretching of BO6 octahedra giving it a mixed A and E character. The appearance of an additional phonon mode at 755 cm−1, is splitting of the LO mode attributed to the heavier B-site substitution.63,64 The lower Raman band ∼716 cm−1 corresponds to Ti–O stretching whereas the 755 cm−1 band represents Nb–O stretching.65 In such system the vibration associated with two band modes do not couple due to their different chemical origin. The appearance of a mode at 755 cm−1 was considered as local counterpart of the A1(LO3) mode appearing at 716 cm−1 in pure BCZT and is related to the internal deformation of the BO6 octahedra due to the different cation substitutions on B site. The difference in the ionic radii of Zn2+ (0.74 Å) and Ta5+ (0.64 Å) substituted on Ti4+ (0.605 Å) site would give rise to elastic dipole like distortion in the surrounding region.66 An alternative explanation for the occurrence of mode at 755 cm−1 was provided by Lazarevic et al.,67 who claimed it to be due to the multiphonon process. The broad mode at ∼829 cm−1 (A1g) (in Fig. 5(b)) is an octahedral breathing-like mode resulting from the presence of two or more B-site species68 and it may appear regardless of the presence or absence of a ferroelectric phase.64 The B-site substituted by Ta5+ ions are more covalently bound to oxygen than Ti4+ ions and Zn2+ ions resulting in a strong off-centered axially perturbed octahedral crystal field. This perturbation can also be seen in A1g (∼829 cm−1) modes of Raman spectra of BZT doped BCZT. This can be rationalized by considering that atomic positional disorder in general; and of niobium and copper in particular at the lower concentration of Zn2+ and Ta5+. The disorder increases as the population of polar to non-polar phase evolves. The perturbation of nanopolar regions is higher with increased concentration of B-site transition metal ions. Raman analysis also indicates an increase in the spatial range to which local tetragonal distortions can propagate coherently with increase in B-site substitutions which in turns increases the mean free path of the phonons associated with polar distortions. It is interesting to note that such a small compositional changes substantially modulates the local dynamics and distortions favoring a piezoelectric response.69
It is well established fact that during polymorphic phase transition in BaTiO3, Raman bands in the region 100 to 300 cm−1 are most affected. Therefore, much of our investigation will be in this region. A closer view of Raman band at 152 and 234 cm−1 is presented in Fig. 6(a)–(d). It is clear from the Fig. 6(a)–(d) that Raman band near 152 cm−1 consist of two sub-bands centered at 140 and 160 cm−1. The low frequency mode near 140 cm−1 does not exist in pure BaTiO3. The presence of low frequency modes were reported in modified BaTiO3 ceramics but with somewhat inconsistent clarification. For example, Shimazu et al.70 ascribed them to acoustic modes presented at zone centre due to inherent disorder in the system, whereas Puli et al.71 considered it as A(TO1) mode with low-frequency shift. Moreover, the asymmetric band near 234 cm−1 (Fig. 6(a)–(d)) also shows high and low frequency shoulder at 190 and 272 cm−1.
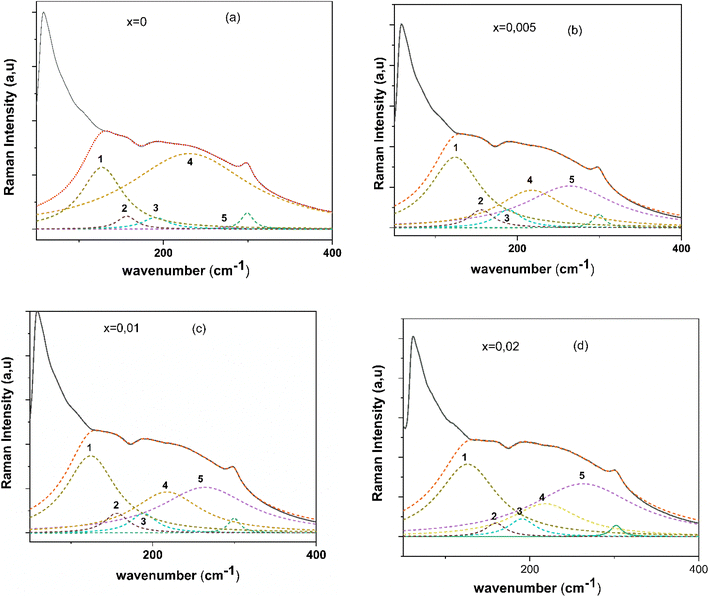 | ||
| Fig. 6 (a–d) Room temperature Raman spectra of BCZT–xZT in the range (a) 50 to 300 cm−1 along with spectra de-convolution. | ||
To understand the ZT doping effects on BCZT–xZT, the quantitative analysis of bands at 160 and 234 cm−1 was carried out by de-convoluting peaks using Lorentzian function. The best fitted peaks are presented by dotted lines in Fig. 6(a)–(d). The peaks for sub-band are marked by number 1 to 5 (Fig. 6(a)–(d)). The peak number “1” and “2” corresponds to bands at 140 and 160 cm−1. The peaks “3”, “4”, and “5” corresponds to bands at 190, 234, and 272 cm−1. It is clear from the Fig. 3(a) and (b) that the height of peak “2”, “3”, and “4” is decreasing and of “1” and “5” is increasing with increase in ZT content. The most noticeable change is considerable fall in the intensity of peak number “3”, i.e., band at 190 cm−1.The vibration band near 190 cm−1 was assigned to A(LO1) mode by Xiao et al..72 The temperature dependent Raman investigation of BaTiO3 reveals that A(LO1) mode is more prominent in rhombohedral or orthorhombic phase and it vanished for tetragonal phase.72,73 Another interesting feature of Fig. 6(a)–(d) is presence of modes at 234 and 272 cm−1. The lattice dynamics analysis of BaTiO3 elucidate that there is only one vibration mode,74 i.e., A(TO2) between 200 and 280 cm−1. For orthorhombic phase the A(TO2) mode has vibration frequency near 234 cm−1 and it shifts to 272 cm−1 for tetragonal phase.73 Based on our observations on A(LO1) and A(TO2) mode, it is inferred that BCZT–xBZT has co-existence of tetragonal and orthorhombic phase at room temperature. More importantly, the intensity variation of peaks “3”, “4”, and “5” further indicate that fraction of tetragonal phase increases with increase in ZT content. These results are in concurrence with the structural analysis on same system.75
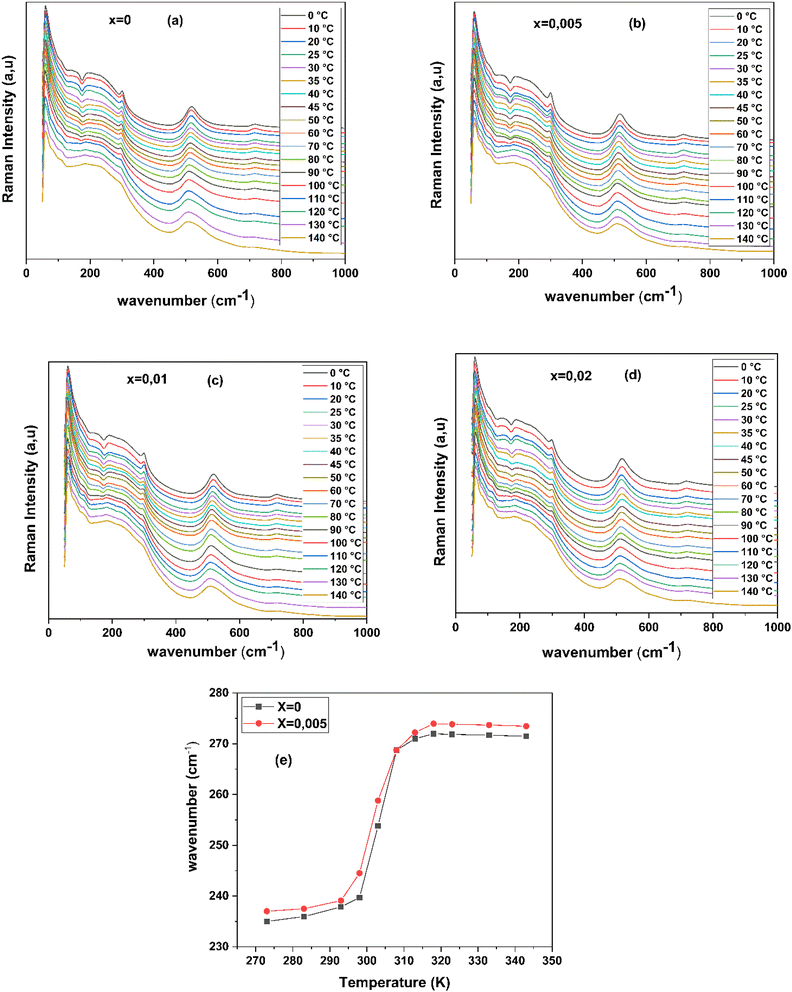
The temperature dependent Raman spectra are shown in Fig. 7(a)–(d). The temperature range of interest was from 273 to 333 K as it covers orthorhombic-to-tetragonal phase transition. Although, we did measurements in the temperature range of 273 to 323 K with 5 K step, data was presented for every 10 K in the range 323 to 413 K for sake of clarity. The evolution of Raman spectra with temperature shows some interesting changes. As temperature is increased the bands at 297, 512, and 716 cm−1 do not show frequency shift but broadened. The broadening of bands indicates that the Raman selection rule is relaxed ascribed to the disorder in the positions of the Ti/Zr/Ta/Zn atoms in the unit cells of the polycrystalline samples. The asymmetric band near 542 cm−1 show reasonable change in the line-shape due to emergence of weak band at 468 cm−1 [E(TO4)/E(LO3)/A(LO2)] and significant broadening at higher temperature. With increase in temperature, the sharpness of dip at 180 cm−1 weakens reasonably. The weakening of interference dip at 173 cm−1 is an indication of reduced coupling between A(TO) modes.76 The two major changes observed in Raman spectra are: first, a sudden increase in the frequency of A(TO2) mode from 234 to 272 cm−1 was observed. This increase in frequency occur near 308 K for x = 0 and 0.05. Here we have presented the closer view A(TO2) mode at two temperatures in vicinity of orthorhombic-to-tetragonal phase transition. Second, the peak height of A(LO1) mode at 190 cm−1 decreases with increase in temperature. The decrease in the intensity of A(LO1) mode with temperature reveals that system moves from orthorhombic to tetragonal, as mentioned above. The observed frequency change of A(TO2) mode for x = 0 and x = 0.005 are presented in Fig. 7(e). It is clear from the figure that frequency of A(TO2) mode almost constant a lower temperature, it increases rapidly from 234 to 272 cm−1 in the temperature range of 308 for x = 0 and 0.05. With further increase in the temperature the frequency of A(TO2) mode decreases gradually. Both these results are in agreement with the temperature dependent Raman study on pure BaTiO3.73 It is known that BaTiO3 based systems with orthorhombic structure have A(TO2) mode near 230 cm−1 and for tetragonal structure it is shifted near 265 cm−1.73
However, we have observed the presence of peak at 267 cm−1 even in orthorhombic phase, (Ba0.95Ca0.05)(Zr0.05Ti0.95)O3 is having an orthorhombic structure as clear from above and from previous studies.75 The presence of Raman band at 267 cm−1 was observed by Osada et al.77 in orthorhombic phase of BaTiO3 and they attributed it to the splitting of A(TO2) mode due to strain fields at domain walls. More importantly, the mode at 267 cm−1 was observed only at domain boundaries. The material under investigation, i.e., (Ba0.95Ca0.05)(Zr0.05Ti0.95)O3, is a normal ferroelectric below 400 K and have randomly oriented domain at lower temperatures. Therefore, we believe that at lower temperature, i.e., below temperature range of orthorhombic and tetragonal phase co-existence, the presence Raman peak at 267 cm−1 is due to splitting of A(TO2) mode by strain fields at domain walls,77 as mentioned above. Interestingly, the split mode is observed exactly at the same frequency as of A(TO2) mode in tetragonal phase. Therefore, it can be conjectured that domain walls may have tetragonal structure. However, the two strongest Raman modes, at 512 cm−1 (A/E(TO)) and 716 cm−1 (A/E(LO)) remain in the cubic phase, this can be related to the existence of ferroelectric clusters or polar nano-regions (PNRs).78–80
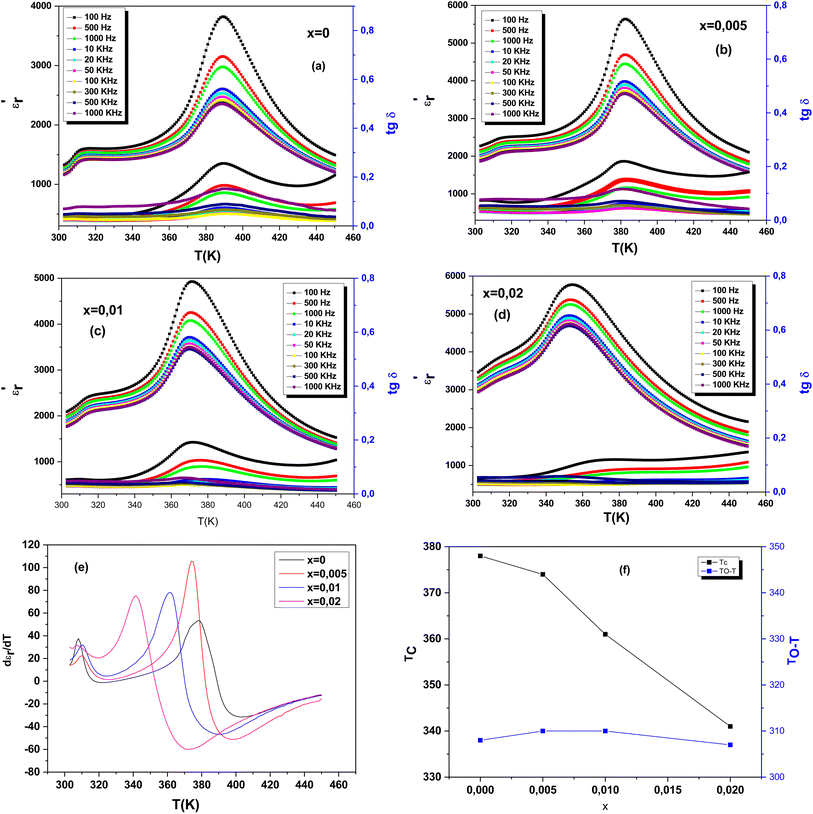
The temperature and frequency variations of the dielectric constant of BCZT–xZT are shown in Fig. 8(a)–(d). To determine the phase transitions, the curve of the differential dielectric constant (∂εr/∂T) as a function of temperature,81,82 presented in Fig. 8(e), shows two obvious peaks are detected around 389 K corresponds to the ferroelectric–paraelectric phase transition from tetragonal phase to cubic phase (Tc) and 313 K corresponds to the ferroelectric–ferroelectric phase transition from orthorhombic phase to tetragonal phase (TO–T) at x = 0.
In Fig. 8(f), a simplified phase diagram based on our dielectric measurements shows that a small amount of BZT (x = 0.005), slightly shifts the temperature of the orthorhombic–tetragonal (TO–T) phase transition peaks towards a high temperature but almost unchanged. However, when the BZT content increases (x ≥ 0.020), the TO–T peaks shift to low temperatures and the Tc peaks obviously decrease.
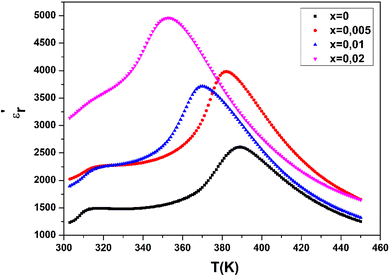
Temperature dependence of the dielectric properties for the BCZT–xZT ceramics (x = 0, 0.005, 0.01, 0.02) measured at 10 kHz is shown in Fig. 9. With the addition of ZT, the dielectric constant peak becomes broader and weaker, indicating that the existence of the diffuse phase transition behavior. As we know, the dielectric permittivity of the ferroelectric above the Curie temperature should obey the Curie Weiss law:
| ΔTM = TB − TM |
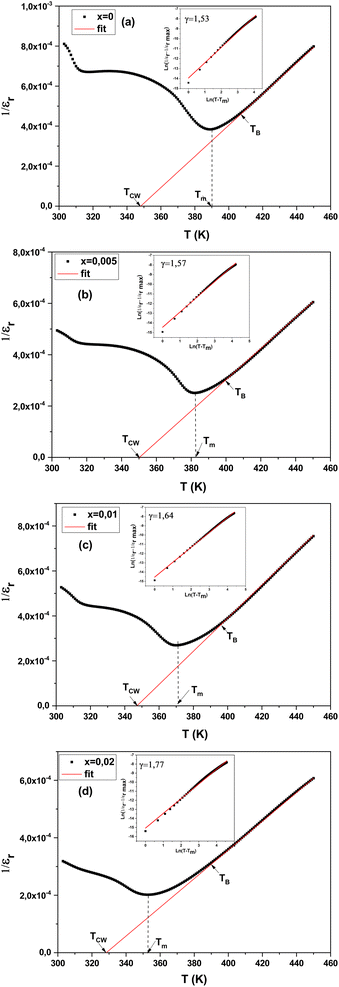 | ||
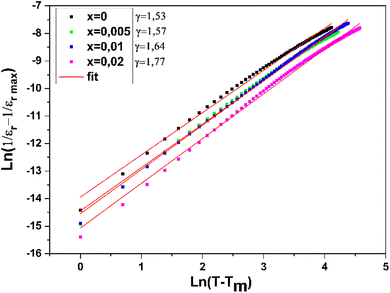
Fig. 10 Inverse dielectric constant at 1 kHz as a function of temperature for the BCZT–xZT ceramics. The inset shows the  against log(T – Tm) at 1 kHz. against log(T – Tm) at 1 kHz. | ||
Table 2 lists the results of TCW, TB, TM and ΔTM for the BCZT–xZT ceramics. The value of ΔTM increases with ZT addition, indicating that the ZT doped BCZT ceramics need higher temperature to make ferroelectric–paraelectric phase transition completely than pure BCZT ceramics after above the TM.83
| x | TCW | TB | TM | ΔTM | γ | Pr | Ps | Ec |
|---|---|---|---|---|---|---|---|---|
| 0 | 348 | 405 | 390 | 57 | 1.53 | 6.91 | 8.97 | 6.9 |
| 0.005 | 350 | 399 | 382 | 49 | 1.57 | 7.59 | 10.36 | 7.9 |
| 0.01 | 347 | 396 | 371 | 49 | 1.64 | 6.33 | 8.51 | 7.47 |
| 0.02 | 328 | 389 | 353 | 61 | 1.77 | 5.24 | 8.26 | 6.61 |
Uchino and Nomura84 had proposed a modified empirical expression to further study the diffuse phase transition.
Fig. 12 shows the relative dielectric constant εr at room temperature (100 Hz) and piezoelectric coefficient d33 of the BCZT–xZT ceramics. The composition dependence of piezoelectric properties (d33) get maximum value of 297 pC N−1 at x = 0.005. It was thought that the observed high piezoelectric properties should be attributed to the first-order phase transition near room temperature which is the origin of the coexistence of tetragonal and orthorhombic phases.85–87 According to Table 1 and Fig. 4, BCZT–0.005ZT has the highest piezoelectric coefficient compared to other compositions, which may be due to the highest density and particle size which was considered to be at the origin of this phenomenon.83,87 It is evident that the grain size as well as density improvements occur with the ZT content in (1 − x)BCZT–xZT. This is an essential feature as BaTiO3-based materials with grain size ≥10 μm exhibit better ferroelectric and piezoelectric properties.88 In general, piezoelectric materials with higher grain size display larger domains with thinner domain walls whereas materials with lower grain size possess smaller domains having thicker domain walls which make domain reorientation more difficult and thus degrades piezoelectric response.89,90 Therefore, it is considered that the piezoelectric materials with larger grain size show improved domain movement response to an applied external stress or electric field.89,90 Alternatively, dielectric, ferroelectric, and piezoelectric properties can be improved with proper care during synthesis. For example, uniform and higher sintering temperature helps to fully grow the grains so that the materials become denser and pores-free microstructures which are beneficial to enhance the electrical, dielectric, and piezoelectric properties.89,91,92
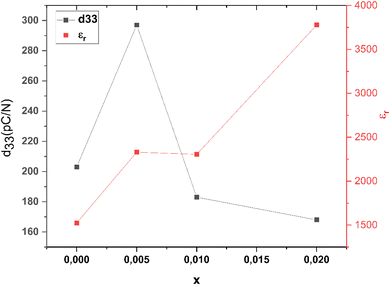 | ||
| Fig. 12 The relative dielectric constant εr at room temperature (100 Hz) and piezoelectric coefficient d33 of the BCZT–xZT ceramics. | ||
An interesting phenomenon was found: by fitting the XRD patterns, the full-width at half maxima (FWHM) of the diffraction peaks at (100), (110), (111), and (200) was obtained and is shown in Fig. 13. The FWHM increased first and then decreased with the doping of BZT ions, and reached their maximum values at x = 0.005. The largest FWHM, for x = 0.005 was possibly related to large lattice distortions and structure asymmetry. With the corresponding better piezoelectric and electrical properties obtained at x = 0.005, it may be suggested that large lattice distortions favor these properties.93
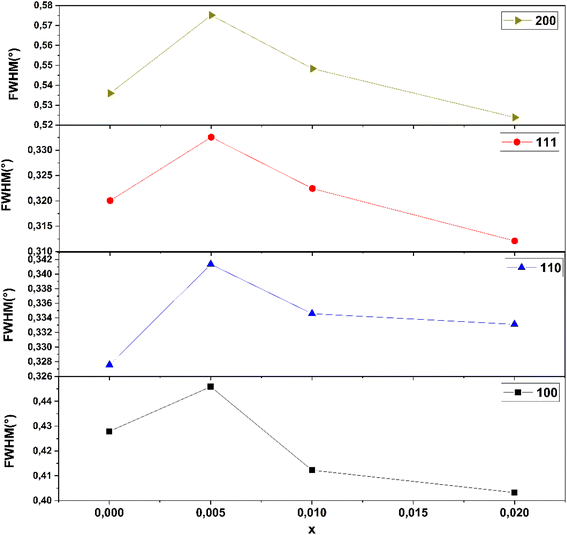 | ||
| Fig. 13 FWHM for the (100), (110), (111) and (200) diffraction peaks of BCZT–ZT ceramics from the Rietveld refinement. | ||
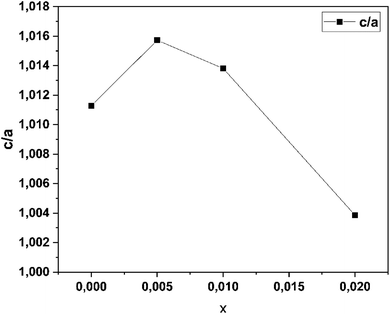
Considering the high piezoelectric performance at x = 0.005, it was not difficult to conclude that this was beneficial to the improvement of piezoelectricity. After ZT ions entered the lattice sites, it is believed that their influences mainly occurred in the following two aspects: firstly, the substitution of ZT ions enhanced the octahedral tiling of TiO6, resulting in a nonuniform lattice distortion. The size mismatch between ZrO6 and TiO6, and the local-structure heterogeneity were the important reasons for the occurrence of local random strain, which further promoted polarization rotation and an enhanced piezoelectric effect. Secondly, the large lattice distortion directly enhanced the local displacement of B-site ions. The ratio of the C to a lattice constants of T phase are summarized in Fig. 14. The maximum (c/a) obtained at x = 0.005. Considering the phase fraction and c/a, the highly tetragonal structure was conducive to the displacement enhancement of B-site ions, which enhances the piezoelectric response. This view coincided with the results on lattice parameter expansion obtained from the Rietveld refinement results and this mechanism was expected to be applicable to other piezoelectric materials.94
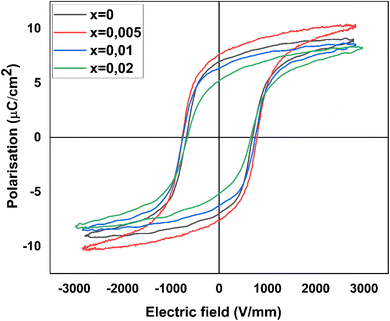
Fig. 15 shows the P–E loops of the BCZT–xZT ceramics measured at 15 Hz at room temperature, being typical ferroelectric polarization hysteresis loops for all ceramic samples. The effect of ZT concentration dopant to the remnant polarization Pr, spontaneous polarization Ps and the coercive field Ec is shown in Table 2. It could be seen that the pure BCZT ceramics exhibited a worse ferroelectric polarization hysteresis loop, and the P–E loops became ameliorative with increased x. Ec increased initially until x = 0.005–7.9 kV cm−1, then subsequently doped at x = 0.02–6.61 kV cm−1. This decreases indicates that the BCZT–xZT ceramics become more and more “soft”.95 Besides, Pr increased initially, reaching the maximum value at x = 0.005–7.59 μC cm−2, and then decreased until x = 0.02–5.24 μC cm−2. The results of the coercive field (Ec) showed that the Zn2+/Ta5+ doped BCZT ceramics became softer and the ferroelectric properties strongly depended on Zn2+ and Ta5+ content. Distinctly, the sample with x = 0.005 had the largest Pr, suggesting that the increase oxygen vacancies would pin the domain to switch. It was well known that high Pr and low Ec might be ascribed to the coexistence of orthorhombic and tetragonal phases. Generally speaking, large remnant polarization usually facilitated the piezoelectric properties of the ceramics.96
4. Conclusions
Lead-free (1 − x)BCZT–xZT (x = 0.00, 0.005, 0.01, and 0.02) electroceramics were successfully synthesized using solid-state reaction method. The structure, phase, microstructure, dielectric, ferroelectric, piezoelectric, and electrostrictive properties of (1 − x)BCZT–xZT have all been thoroughly investigated as a function of variable composition (x). The XRD and Rietveld refinement analyses confirmed the formation of a perovskite structure without the presence of any impurity phases, indicating that Ca2+, Zr4+, Zn2+ and Ta5+ had effectively diffused into the BaTiO3 lattice. SEM analyses showed the development of a dense microstructure with grains that ranged in size from 11.31 μm to 20.54 μm. Studies using XRD, Rietveld refinement, Raman and dielectric measurements validate and confirm that the crystal symmetry of the orthorhombic (O, Amm2) and tetragonal (T, P4mm) mixed phase in the (1 − x)BCZT–xZT materials. When x increases, the ceramics experienced a series of phase transitions, and the c/a ratio of the T phase increased first and then decreased. When the c/a of the tetragonal phase reaches its maximum value, the ceramic with x = 0.005 has the best piezoelectricity (d33 ∼ 297 pC N−1).The ceramic with x = 0.005 exhibits the optimum piezoelectric and ferroelectric properties i.e., remnant polarization (Pr = 7.58 μC cm−2), spontaneous polarization (Ps = 10.25 μC cm−2) and piezoelectric coefficient (d33 = 297 pC N−1), showing the potential possibilities for lead-free piezoelectric application. This research can contribute to the understanding of BCZT ceramics, which improves dielectric, piezoelectric and ferroelectric properties with elements doping and provides an approach to design high-performance lead-free piezoelectric ceramics.Data availability
The data that support the findings of this study are openly available within the article.Conflicts of interest
The authors declare that they have no known competing financial interests or personal relationships that could have appeared to influence the work reported in this paper.Acknowledgements
The authors would like to thank Dr Slimani Ahmed, Sorbonne University, Abu Dhabi for the Scanning Electron Microscopy analysis.References
- B. Jaffe, W. R. Cook and H. Jaffe, Piezoelectric Ceramics, Academic Press, New York, 1971. DOI:10.1016/0022-460X(72)90684-0.
- G. H. Haertling, Ferroelectric ceramics: history and technology, J. Am. Ceram. Soc., 1999, 82, 797–818 CrossRef.
- J. Rodel, W. Jo, K. T. P. Seifert, E. M. Anton, T. Granzow and D. Damjanovic, Perspective on the Development of Lead-free Piezoceramics, J. Am. Ceram. Soc., 2009, 92, 1153, DOI:10.1111/j.1551-2916.2009.03061.x.
- S. J. Zhang, R. Xia and T. R. Shrout, Piezoelectric properties in perovskite 0.948(K0.5Na0.5)NbO3-0.052LiSbO3 lead-free ceramics, J. Appl. Phys., 2006, 100, 104108, DOI:10.1063/1.2382348.
- T. Takenaka, H. Nagata and Y. Himura, Current Developments and Prospective of Lead-Free Piezoelectric Ceramics, Jpn. J. Appl. Phys., 2008, 47, 3787, DOI:10.1143/JJAP.47.3787.
- Y. Choi, T. Hoshina, H. Takeda, T. Teranishi and T. Tsurumi, Effects of oxygen vacancies and grain sizes on the dielectric response of BaTiO3, Appl. Phys. Lett., 2010, 97, 212907, DOI:10.1063/1.3508947.
- R. Clarke, J. Appl. Crystallogr., 1976, 9, 335 CrossRef.
- D. Berlincourt and H. H. A. Krueger, Dependence of the Ratio of Piezoelectric Coefficients on Density and Composition of Barium Titanate Ceramics, Phys. Rev., 1957, 105, 56, DOI:10.1103/PhysRev.105.56.
- H. Takahashi, Y. Numamoto, J. Tani, K. Matsuta, J. Qiu and S. Tsurekawa, Jpn. J. Appl. Phys., 2006, 45, L30 CrossRef CAS.
- Z. Yu, C. Ang, R. Guo and A. S. Bhalla, J. Appl. Phys., 2002, 92, 1489 CrossRef.
- W. Li, Z. Xu, R. Chu, P. Fu and G. Zang, Braz. J. Phys., 2010, 40, 353 CrossRef.
- G. Singh, V. S. Tiwari and P. K. Gupta, Thermal stability of piezoelectric coefficients in (Ba1−xCax)(Zr0.05Ti0.95)O3: A lead-free piezoelectric ceramic, Appl. Phys. Lett., 2013, 102, 162905, DOI:10.1063/1.480297.
- W. Liu and X. Ren, Large piezoelectric effect in Pb-free ceramics, Phys. Rev. Lett., 2009, 103, 257602 CrossRef.
- H. L. Wang, F. F. Zhang, Y. Chen, C. T. Huang, X. Y. Wang, X. J. Wu, Y. L. Chen, Y. G. Xu, S. Y. Guan, J. G. Zhu, Q. Chen and J. Xing, Ceram. Int., 2021, 47, 12284–12291 CrossRef CAS.
- L. F. Zhu, B. P. Zhang, S. Li and G. L. Zhao, J. Alloys Compd., 2017, 727, 382–389 CrossRef CAS.
- C. C. Li, B. Xu, D. B. Lin, S. J. Zhang, L. Bellaiche, T. R. Shrout and F. Li, Phys. Rev. B, 2020, 101, 140102 CrossRef CAS.
- Q. Liu, Y. C. Zhang, J. Gao, Z. Zhou, H. Wang, K. Wang, X. W. Zhang, L. T. Li and J. F. Li, Science, 2018, 11, 3531–3539 CAS.
- P. Li, J. W. Zhai, B. Shen, S. J. Zhang, X. L. Li, F. Y. Zhu and X. M. Zhang, Adv. Mater., 2018, 30, 1705171 CrossRef PubMed.
- L. Wang, S. D. Sun, H. J. Luo, Y. Ren, H. Liu, X. R. Xing and J. Chen, J. Mater. Chem. A, 2021, 9, 2367–2374 RSC.
- N. Zhang, X. Lv, X. X. Zhang, J. Lyu, S. W. Yang and J. Wu, J. Mater. Sci. Technol., 2022, 115, 189–198 CrossRef.
- K. B. Xi, Y. L. Li, Y. Sun, C. Li, Z. Q. Li, N. Vetri, Z. S. Zheng, C. Yang, D. D. Wang and P. W. Jia, J. Am. Ceram. Soc., 2022, 106, 466–475 CrossRef.
- Y. J. Shi, X. Y. Dong, K. Y. Zhao, W. W. Yang, K. Zhu, R. Hu, H. R. Zeng, B. Shen and J. W. Zhai, ACS Appl. Mater. Interfaces, 2021, 13, 14385–14393 CrossRef.
- M. Deluca and A. Gajovic, Raman Spectroscopy of Nanostructured Ferroelectric Materials, in Nanoscale Ferroelectrics and Multiferroics, John Wiley & Sons, Ltd, 2016, pp. 325–374 Search PubMed.
- J.-M. Li, X.-L. Zeng and Z.-An Xu, Partial cationic inversion-induced magnetic hardening of densely packed 23-nm-sized nanocrystallite-interacting nickel ferrite electrospun nanowires, Appl. Phys. Lett., 2013, 103, 232410, DOI:10.1063/1.4840320.
- T. P. Devereaux and R. Hackl, Inelastic light scattering from correlated electrons, Rev. Mod. Phys., 2007, 79, 175 CrossRef CAS.
- J.-M. Li, C. H. A. Huan, Y. W. Huan, D. Feng and Z. X. Shen, Magnetic-field-tunable charge carrier localization in sintered polycrystalline La0.75Ca0.25MnO3, Phys. Rev. B, 2000, 63, 024416, DOI:10.1103/PhysRevB.63.024416.
- M. N. Iliev, M. V. Abrashev, J. Laverdière, S. Jandl, M. M. Gospodinov, Y.-Q. Wang and Y.-Y. Sun, Distortion-dependent Raman spectra and mode mixing in RMnO3 perovskites (R = La, Pr, Nd, Sm, Eu, Gd, Tb, Dy, Ho, Y), Phys. Rev. B: Condens. Matter Mater. Phys., 2006, 73, 064302 CrossRef.
- N. K. Karan, R. S. Katiyar, T. Maiti, R. Guo and A. S. Bhalla, Raman spectral studies of Zr 4+ -rich BaZr x Ti 1− x O 3 (0.5⩽ x ⩽1.00) phase diagram, J. Raman Spectrosc., 2009, 40, 370–375, DOI:10.1002/jrs.2134.
- V. Buscaglia, S. Tripathi, V. Petkov, M. Dapiaggi, M. Deluca, A. Gajovic and Y. Ren, Average and local atomic-scale structure in BaZrxTi(1-x)O3 (x = 0. 10, 0.20, 0.40) ceramics by high-energy x-ray diffraction and Raman spectroscopy, J. Phys.: Condens. Matter, 2014, 26, 65901, DOI:10.1088/0953-8984/26/6/065901.
- V. K. Veerapandiyan, M. Deluca, S. T. Misture, W. A. Schulze, S. M. Pilgrim and S. C. Tidrow, Dielectric and structural studies of ferroelectric phase evolution in dipole-pair substituted barium titanate ceramics, J. Am. Ceram. Soc., 2020, 103, 287–296, DOI:10.1111/jace.16713.
- N. H. Khansur, U. R. Eckstein, M. Bergler, A. Martin, K. Wang, J.-F. Li, M. R. Cicconi, K. Hatano, K. Kakimoto, D. de Ligny and K. G. Webber, In situ combined stress- and temperature-dependent Raman spectroscopy of Li-doped (Na,K)NbO 3, J. Am. Ceram. Soc., 2022, 105, 2735–2743, DOI:10.1111/jace.18269.
- I. Coondoo, N. Panwar, S. Krylova, A. Krylov, D. Alikin, S. K. Jakka, A. Turygin, V. Y. Shur and A. L. Kholkin, Temperature-dependent Raman spectroscopy, domain morphology and photoluminescence studies in lead-free BCZT ceramic, Ceram. Int., 2021, 47, 2828–2838, DOI:10.1016/j.ceramint.2020.09.137.
- N. Luo, S. Zhang, Q. Li, Q. Yan, Y. Zhang, T. Ansell, J. Luo and T. R. Shrout, Crystallographic dependence of internal bias in domain engineered Mn-doped relaxor-PbTiO3 single crystals, J. Mater. Chem. C, 2016, 4, 4568–4576 RSC.
- J. Zeng, K. Zhao, X. Shi, X. Ruan, L. Zheng and G. Li, Large strain induced by the alignment of defect dipoles in (Bi3+, Fe3+) co-doped Pb (Zr, Ti)O3 ceramics, Scr. Mater., 2018, 142, 20–22 CrossRef CAS.
- J. Wu, D. Xiao, W. Wu, Q. Chen, J. Zhu, Z. Yang and J. Wang, Role of room-temperature phase transition in the electrical properties of (Ba,Ca)(Ti,Zr)O3 ceramics, Scr. Mater., 2011, 65, 771–774 CrossRef CAS.
- Z. Zhao, X. Li, H. Ji, Y. Dai and T. Li, Microstructure and electrical properties in Zn-doped Ba0.85Ca0.15Ti0.90Zr0.10O3 piezoelectric ceramics, J. Alloys Compd., 2015, 637, 291–296 CrossRef CAS.
- T. Qi, I. Grinberg and A. M. Rappe, Correlations between tetragonality, polarization, and ionic displacement in PbTiO3-derived ferroelectric perovskite solid solutions, Phys. Rev. B: Condens. Matter Mater. Phys., 2010, 82, 134113, DOI:10.1103/PhysRevB.82.134113.
- F. Zeng, Q. Liu, E. Cai, Y. Wang, A. Xue, S. Peng, S. Zhou and Y. Zhu, Relaxor phenomenon of (1-x)(Ba0.85Ca0.15)(Zr0.09Ti0.91)O3-xTa + 0.6wt.% Li2CO3 ceramics with high piezoelectric constant and Curie temperature, Ceram. Int., 2018, 44, 10677–10684, DOI:10.1016/j.ceramint.2018.03.098.
- Li-F. Zhu, Bo-P. Zhang, L. Zhao and J.-F. Li, High piezoelectricity of BaTiO3-CaTiO3-BaSnO3 lead-free ceramics, J. Mater. Chem. C, 2014, 2, 4764, 10.1039/c4tc00155a.
- K. H. Yoon, J. H. Kim, K. H. Jo, H. I. Song, S. O. Yoon and C. S. Kim, Effect of Ca2+ Ions on Electrical Properties of Ba1-xCaxTi0.90Sn0.10O3-0.05Y2O3 Ceramics, J. Mater. Sci., 1988, 23, 61, DOI:10.1007/s11664-018-6147-3.
- R. D. Shannon, Revised effective ionic radii and systematic studies of interatomic distances in halides and chalcogenides, Acta Crystallogr., Sect. A: Cryst. Phys., Diffr., Theor. Gen. Crystallogr., 1976, 32, 751–767, DOI:10.1107/S0567739476001551.
- A. Shandilya, R. S. Yadav, A. K. Gupta and K. Sreenivas, Effects of Yb3+ ion doping on lattice distortion, optical absorption and light upconversion in Er3+/Yb3+ co-doped SrMoO4 ceramics, Mater. Chem. Phys., 2021, 264, 124441, DOI:10.1016/j.matchemphys.2021.124441.
- M. V. Madhava Rao, Chen-Feng Kao, (Bi0.5Na0.5)0.93Ba0.07TiO3 lead-free ceramics with addition of Ga2O3, Phys. B, 2008, 403, 3596–3598, DOI:10.1016/j.physb.2008.05.039.
- W. Li, H. Jigong, W. Bai, Xu Zhijun, R. Chu and J. Zhai, Enhancement of the temperature stabilities in yttrium doped (Ba0.99Ca0.01)(Ti0.98Zr0.02)O3 ceramics, J. Alloys Compd., 2012, 531, 46–49, DOI:10.1016/j.jallcom.2012.03.110.
- L. Zheng, Mu Liu, H. Zhang, Z. Zheng, Z. Wang, H. Cheng, P. Wang, Y. Liu and B. Huang, Fabrication of ZnO Ceramics with Defects by Spark Plasma Sintering Method and Investigations of Their Photoelectrochemical Properties, Nanomaterials, 2021, 11, 2506, DOI:10.3390/nano11102506.
- L.-F. Zhu, B.-P. Zhang, X.-K. Zhao, L. Zhao, P.-F. Zhou and J.-F. Li, J. Am. Ceram. Soc., 2013, 96, 241 CrossRef CAS.
- A. K. Kalyani, K. Brajesh, A. Senyshyn and R. Ranjan, Orthorhombic-tetragonal phase coexistence and enhanced piezo-response at room temperature in Zr, Sn, and Hf modified BaTiO3, Appl. Phys. Lett., 2014, 104, 252906, DOI:10.1063/1.4885516.
- M. Abebe, K. Brajesh, A. Mishra, A. Senyshyn and R. Ranjan, Structural perspective on the anomalous weak-field piezoelectric response at the polymorphic phase boundaries of (Ba,Ca)(Ti,M)O3 lead-free piezoelectrics (M=Zr, Sn, Hf), Phys. Rev. B, 2017, 96, 014113, DOI:10.1103/PhysRevB.96.014113.
- L. Li, J. Deng, J. Chen, X. Sun, R. Yu, G. Liu and X. X. Wire, Chem. Mater., 2009, 21(7), 1207–1213 CrossRef.
- R. Verma, A. Chauhan, K. M. Batoo, R. Kumar, M. Hadi and E. H. Raslan, Structural, morphological, and optical properties of strontium doped lead-free BCZT ceramics, Ceram. Int., 2021, 47, 15442–15457, DOI:10.1016/j.ceramint.2021.02.110.
- C. Han, J. Wu, P. Chaohui, S. Qiao, B. Wu, J. Zhu and D. Xiao, Ceram. Int., 2012, 38, 6359–6363 CrossRef CAS.
- A. Watcharapasorn and S. Jiansirisomboon, Ceram. Int., 2008, 34, 769–772 CrossRef CAS.
- M. P. Fontana and M. Lambert, Linear disorder and temperature dependence of Raman scattering in BaTiO3, Solid State Commun., 1972, 10, 1 CrossRef CAS.
- U. D. Venkateswaran and V. M. Naik, High-pressure Raman studies of polycrystalline, Phys. Rev. B: Condens. Matter Mater. Phys., 1998, 58, 14256–14260, DOI:10.1103/PhysRevB.58.14256.
- M. Srivastava, B. Kumar, R. Prasad, N. Kumari and S. N. Prasad, Spectral studies of some transition metal chelates with thiolactic anilide and thiolactic-p-toluidide, Part-II, Asian J. Chem., 1999, 11, 1501–1504, DOI:10.1002/jrs.
- P. Hermet, M. Veithen and P. Ghosez, Raman scattering intensities in BaTiO3 and PbTiO3 prototypical ferroelectrics from density functional theory, J. Phys.: Condens.Matter, 2009, 21, 215901, DOI:10.1088/0953-8984/21/21/215901.
- P. S. Dobal, A. Dixit, R. S. Katiyar, D. Garcia, R. Guo and A. S. Bhalla, Micro-Raman study of Ba1-xSrxTiO3 ceramics, J. Raman Spectrosc., 2001, 32, 147 CrossRef CAS.
- C. J. Xiao, Z. H. Chi, W. W. Zhang, F. Y. Li, S. M. Feng, C. Q. Jin, X. H. Wang, X. Y. Deng and L. T. Li, The phase transitions and ferroelectric behavior of dense nanocrystalline BaTiO3 ceramics fabricated by pressure assisted sintering, J. Phys. Chem. Solids, 2007, 68, 311–314, DOI:10.1016/j.jpcs.2006.11.014.
- G. Singh, V. Sathe and V. S. Tiwari, Investigation of orthorhombic-to-tetragonal structural phase transition scattering, J. Appl. Phys., 2014, 115, 044103 CrossRef.
- S. Liu, L. Zhang, J. Wang, X. Shi, Y. Zhao and D. Zhang, Rapid stability of ferroelectric polarization in the Ca, Ce hybrid doped BaTiO3ceramics, Sci. Rep., 2016, 6, 1–8, DOI:10.1038/srep38354.
- F. M. Pontes, M. T. Escote, C. C. Escudeiro, E. R. Leite, E. Longo, A. J. Chiquito, P. S. Pizani and J. A. Varela, Characterization of BaTi1-xZrxO3 thin films obtained by a soft chemical spin-coating technique, J. Appl. Phys., 2004, 96, 4386 CrossRef.
- T. Hoshina, H. Kakemoto, T. Tsurumi, S. Wada and M. Yashima, Size and temperature induced phase transition behaviors of barium titanate nanoparticles, J. Appl. Phys., 2006, 99, 054311 CrossRef.
- P. S. Dobal, A. Dixit, R. S. Katiyar, Z. Yu, R. Guo and A. S. Bhalla, Phase transition behavior of BaZrxTi1-xO3 ceramics, J. Raman Spectrosc., 2001, 32, 69 CrossRef CAS.
- R. Farhi, M. EI Marssi, A. Simon and J. Ravez, A Raman and dielectric study of ferroelectric ceramics, Eur. Phys. J. B, 1999, 9, 599 CrossRef CAS.
- A. Slodczyk and P. Colomban, Probing the Nanodomain Origin and Phase Transition Mechanisms in (Un)Poled PMN-PT Single Crystals and Textured Ceramics, Materials, 2010, 3, 5007, DOI:10.3390/ma3125007.
- A. Slodczyk, P. Daniel and A. Kania, Phys. Rev. B: Condens. Matter Mater. Phys., 2008, 77, 184114 CrossRef.
- Z. Ž. Lazarević, M. M. Vijatović, B. D. Stojanović, M. J. Romčević and N. Ž. Romčević, Structure study of nanosized La- and Sb-doped BaTiO3, J. Alloys Compd., 2010, 494, 472 CrossRef.
- J. Kreisel, P. Bouvier, M. Maglione, B. Dkhil and A. Simon, High-pressure Raman investigation of the Pb-free relaxor BaTi0.65Zr0.35O3, Phys. Rev. B, 2004, 69, 092104 CrossRef.
- D. Maurya, A. Kumar, V. Petkov, J. E. Mahaney, R. S. Katiyare and S. Priya, Local structure and piezoelectric instability in lead free (1- x)BaTiO3-xA(Cu1/3Nb2/3)O3 (A=Sr, Ca, Ba) solid solutions, RSC Adv., 2014, 4, 1283, 10.1039/c3ra44886.
- T. Shimizu, D. Fu, H. Taniguchi, T. Taniyama and M. Itoh, Appl. Phys. Lett., 2012, 100, 102908 CrossRef.
- V. S. Puli, A. Kumar, D. B. Chrisey, M. Tomozawa, J. F. Scott and R. S. Katiyar, J. Phys. D: Appl. Phys., 2011, 44, 395403 CrossRef.
- C. J. Xiao, Z. H. Chi, W. W. Zhang, F. Y. Li, S. M. Feng, C. Q. Jin, X. H. Wang, X. Y. Deng and L. T. Li, J. Phys. Chem. Solids, 2007, 68, 311 CrossRef CAS.
- C. H. Perry and D. B. Hall, Temperature Dependence of the Raman Spectrum of BaTiO3, Phys. Rev. Lett., 1965, 15, 700, DOI:10.1103/PhysRevLett.15.700.
- J. D. Freire and R. S. Katiyar, Lattice dynamics of crystals with tetragonal BaTiO3 structure, Phys. Rev. B: Condens. Matter Mater. Phys., 1988, 37, 2074, DOI:10.1103/PhysRevB.37.2074.
- G. Singh, V. S. Tiwari and P. K. Gupta, Evaluating the polymorphic phase transition in calcium-doped Ba(Zr0.05Ti0.95)O3: a lead-free piezoelectric ceramic, J. Appl. Crystallogr., 2013, 46, 324, DOI:10.1107/S0021889813000666.
- S. Y. Kuo, W. Y. Liao and W. F. Hsieh, Phys. Rev. B: Condens. Matter Mater. Phys., 2001, 64, 224103 CrossRef.
- M. Osada, M. Kakihana, S. Wada, T. Noma and W. S. Cho, Appl. Phys. Lett., 1999, 75, 3393 CrossRef CAS.
- L. H. F. Bijun, L. Xing, L. Xiaobing, D. Jianning and Z. Xiangyong, Temperature-dependent Raman spectra and electrical propertiesof 0.69Pb(Mg1/3Nb2/3)O3 –0.31PbTiO 3 single crystals, Appl. Phys. A, 2016, 122, 1–9, DOI:10.1007/s00339-016-0340-0.μ.
- G. Ramesh, M. S. Ramachandra Rao, V. Sivasubramanian and V. Subramanian, Electrocaloric effect in (1-x)PIN-xPT relaxor ferroelectrics, J. Alloys Compd., 2016, 663, 444–448, DOI:10.1016/j.jallcom.2015.11.028.
- S. Praharaj, D. Rout, S. Anwar and V. Subramanian, Polar nano regions in lead free (Na0.5Bi0.5)TiO3-SrTiO3-BaTiO3 relaxors: An impedance spectroscopic study, J. Alloys Compd., 2017, 706, 502–510, DOI:10.1016/j.jallcom.2017.02.257.
- H. Abdmouleh, I. Kriaa, N. Abdelmoula, Z. Sassi and H. Khemakhem, The effect of Zn2+ and Nb5+ substitution on structural, dielectric, electrocaloric properties, and energy storage density of Ba0.95Ca0.05Ti0.95Zr0.05O3 ceramics, J. Alloys Compd., 2021, 878, 160355, DOI:10.1016/j.jallcom.2021.160355.
- M. Zhou, R. Liang, Z. Zhou, C. Xu, X. Nie and X. Dong, Enhanced Curie temperature and piezoelectric properties of (Ba0.85Ca0.15)(Zr0.10Ti0.90)O3 lead-free ceramics after the addition of LiTaO3, Mater. Res. Bull., 2018, 106, 213–219, DOI:10.1016/j.materresbull.2018.05.036.
- H. Zhao, W. Ma, J. Guo, X. Zang, P. Miao, M. Ma and F. Zhang, Low temperature sintering and role of room-temperature phase transition in the electrical properties of (Ba0.85Ca0.15)(Zr0.10Ti0.90)1-x(Cu1/3Nb2/3)xO3 ceramics, J. Mater. Sci.: Mater. Electron., 2018, 29, 2949–2957, DOI:10.1007/s10854-017-8225-3.
- K. Uchino and S. Nomura, Critical exponents of the dielectric constants in diffused phase-transition crystals, Ferroelectrics, 1982, 44, 55–61 CrossRef CAS.
- Y. Cui, C. Yuan and X. Liu, et al., Lead-free (Ba0.85Ca0.15)(Ti0.9Zr0.1)O3-Y2O3 ceramics with large piezoelectric coefficient obtained by low-temperature sintering, J. Mater. Sci.: Mater. Electron., 2013, 24, 654–657, DOI:10.1007/s10854-012-0785-7.
- J. G. Wu, D. Q. Xiao, W. J. Wu, Q. Chen, J. G. Zhu, Z. C. Yang and J. Wang, Composition and poling condition-induced electrical behavior of (Ba0.85Ca0.15)(Ti1-xZrx)O3 lead-free piezoelectric ceramics, J. Eur. Ceram. Soc., 2012, 32, 891–898, DOI:10.1016/j.jeurceramsoc.2011.11.003.
- P. Wang, Y. X. Li and Y. Q. Lu, Enhanced Piezoelectric Properties of (Ba0.85Ca0.15)(Ti0.9Zr0.1)O3 Lead-Free Ceramics by Optimizing Calcination and Sintering Temperature, J. Eur. Ceram. Soc., 31(201), 2005–2012, DOI:10.1016/j.jeurceramsoc.2011.04.023.
- X. Liu, Z. Chen, B. Fang, J. Ding, X. Zhao, H. Xu and H. Luo, J. Alloys Compd., 2015, 640, 128 CrossRef.
- L.-F. Zhu, B.-P. Zhang, L. Zhao and J.-F. Li, J. Mater. Chem. C, 2014, 2, 4764 RSC.
- Y. Tan, G. Viola, V. Koval, C. Yu, A. Mahajan, J. Zhang, H. Zhang, X. Zhou, N. V. Tarakina and H. Yan, J. Eur. Ceram. Soc., 2019, 39, 2064 CrossRef.
- V. Bijalwan, J. Erhart, Z. Spotz, D. Sobola, V. Prajzler, P. Tofel and K. Maca, J. Am. Ceram. Soc., 2021, 104, 1088 CrossRef.
- V. Bijalwan, P. Tofel, J. Erhart and K. Maca, Ceram. Int., 2019, 45, 317 CrossRef CAS.
- Y. Ma, M. Zhao, D. Zhang, Z. Li, M. Zhang, L. Jin and Y. Yan, Enhanced piezoelectricity in Pb(Zr0.48Ti0.52)O3-Pb(Mn1/3Sb2/3)O3-Pb(Mg1/3Ta2/3)O3 ceramics through the synergistic effect of defect engineering and lattice distortion, J. Alloys Compd., 2023, 967, 171779, DOI:10.1016/j.jallcom.2023.171779.
- X. Wang, Yu Huan, S. Ji, Y. Zhu, T. Wei and Z. Cheng, Ultra-high piezoelectric performance by rational tuning of heterovalent-ion doping in lead-free piezoelectric ceramics, Nano Energy, 2022, 101, 107580, DOI:10.1016/j.nanoen.2022.107580.
- Z.-hui Chen, Z.-wei Li, C. Fang, J.-hua Qiu, J.-ning Ding, W.-qin Zhu and J.-jun Xu, Dielectric and ferroelectric properties of Ba0.87Ca0.10La0.03Ti1-xSnxO3, Lead-free ceramics, J. Phys. Chem. Solids, 2017, 111, 311–316 CrossRef CAS.
- X. F. Wang, P. F. Liang, X. L. Chao and Z. P. Yang, Polymorphic phase transition and enhanced electrical properties of (Ba0.91Ca0.09-xSrx)(Ti0.92Sn0.08)O3 lead-free ceramics, Ceram. Int., 2014, 40, 9389–9394, DOI:10.1016/j.ceramint.2014.02.008.
| This journal is © The Royal Society of Chemistry 2024 |


