DOI:
10.1039/D4RA04012K
(Paper)
RSC Adv., 2024,
14, 24574-24584
A phytic acid-based CoMn bimetallic metal–organic aerogel (PA–CoMn-1![[thin space (1/6-em)]](https://www.rsc.org/images/entities/h2_char_2009.gif) :
:![[thin space (1/6-em)]](https://www.rsc.org/images/entities/h2_char_2009.gif) x
x![[thin space (1/6-em)]](https://www.rsc.org/images/entities/h2_char_2009.gif) :
:![[thin space (1/6-em)]](https://www.rsc.org/images/entities/h2_char_2009.gif) 2 − x) as a modifier for electrochemical detection of non-steroidal anti-inflammatory drug 4-acetaminophenol†
2 − x) as a modifier for electrochemical detection of non-steroidal anti-inflammatory drug 4-acetaminophenol†
Received
31st May 2024
, Accepted 18th July 2024
First published on 6th August 2024
1 Introduction
Drug safety in the environment has always been a widespread concern for humanity and is crucial to living organisms and ecosystem stability.1 Drugs that stay unregulated or remain in the regularization cycle can cause an increase in the concentration of synthetic toxins in water bodies, creating a hidden risk of drinking water contamination.2 Additionally, the physio-compound properties of acidic drugs may bring them through water treatment and filtration process, consequently creating a threat to drinking water supplies. In recent years, a large number of new trace pollutants, including pharmaceutical and personal care products (PPCPs), have been discovered in surface and groundwater sources of drinking water. PPCPs have high biological activity, which makes them difficult to completely remove through natural and biological degradation; hence, they have strong persistence in the environment.3 The non-steroidal anti-inflammatory drug, 4-AP, has the characteristics of low toxicity, good curative effect, and few side effects. It is a typical PPCP pollutant and has been detected in many rivers in my country. It not only harms the balance of the aquatic ecosystem but also poses a threat to human health.4 Currently, many methods, such as spectrophotometry,5 high-performance liquid chromatography,6 chemiluminescence,7 fluorescence spectroscopy,8 and capillary electrophoresis,9 have been employed for the detection of 4-AP. However, the above methods have many shortcomings, including the need for complex preprocessing, being time-consuming, expensive, and requiring professionals. Therefore, the development of a facile and rapid analytical method with high selectivity and sensitivity for the sensing of 4-AP is particularly crucial in diagnostic applications and pharmaceutical fields. However, there are reports that portability, storage stability, and real-time sensing in electrochemical detection of 4-AP still need to be improved using an electrocatalyst.
The design of nanomaterials-based electrocatalysts with outstanding activity and a facile design of the electrochemical sensor is vital to accurately determine and quantify 4-AP. Metal phosphides and phosphate-based materials have recently been considered to be competitive candidates for electrocatalysis due to their high electrocatalytic activity, adjustable structural composition and stability.10,11 Phosphates have been prepared through hydrothermal,12 co-precipitation,13,14 solvothermal,15 atomic layer deposition,16 and electrodeposition17 methods. Organophosphorus-containing ligands have been used as precursors, including O-phospho-DL-serine18 and PA. PA is a natural organic phosphorus resource containing six phosphoric acid groups, which can be obtained from plant seeds and grains and has a strong chelating ability. Currently, PA-based polymer gels have been developed19 and PA-based materials are usually employed as precursors for further pyrolysis for electrocatalysis.20–22 García-Dalí et al. exploited PA as a biosourced molecule and successfully prepared P-doped carbon-based hydrogen evolution reaction electrocatalysts with enhanced catalytic activity.23 Huo et al. used PA as a doping biosourced molecule with two-dimensional PA doped co-metal–organic frameworks nanosheets for sensitive application in non-contact and multifunctional humidity sensors.24 Feng et al. prepared bimetallic gel materials derived from PA and mixed Fe3+/Co2+ transition metal ions and explored their performance in electrocatalytic oxygen evolution reaction, which has significant catalytic activity.25 Incorporation of P into the carbon structure can have substantial effects on the chemical and physical properties of carbon materials. The presence of P modifies the electronic structure of carbons, thereby impacting the chemical reactivity of the material and altering the electrocatalytic properties.26 Furthermore, the inclusion of P atoms in carbon materials has also been demonstrated to enhance chemical and electrochemical stability, rendering them more robust against degradation and deactivation.27 Consequently, P has been considered “the next heteroatom to be explored” by the scientific community. Wang et al. exploited metal–organic aerogels (MOAs) with porous properties for colorimetric sensing of glucose.28 Niu et al. prepared metal–organic framework Ni2(BDC)2(DABCO) (Ni-MOF)/porous graphene aerogel (PGA) for application in simultaneous electrochemical determination of nitrochlorobenzene isomers with partial least squares.29 Nevertheless, to our knowledge, few reports explore the preparation of PA–CoMn organic gel for drug sensing.
In this work, we prepared the PA–CoMn-1![[thin space (1/6-em)]](https://www.rsc.org/images/entities/char_2009.gif) :
:![[thin space (1/6-em)]](https://www.rsc.org/images/entities/char_2009.gif) x
x![[thin space (1/6-em)]](https://www.rsc.org/images/entities/char_2009.gif) :
:![[thin space (1/6-em)]](https://www.rsc.org/images/entities/char_2009.gif) 2 − x (x = 0, 0.5, 1 and 1.5) gel from PA and mixed Co2+/Mn2+ transition metal ions by facile and green one-pot synthesis under mild conditions. The resulting compounds exhibited promising properties, including high proton conductivity and self-foaming. To promote stability of the PA–CoMn-1
2 − x (x = 0, 0.5, 1 and 1.5) gel from PA and mixed Co2+/Mn2+ transition metal ions by facile and green one-pot synthesis under mild conditions. The resulting compounds exhibited promising properties, including high proton conductivity and self-foaming. To promote stability of the PA–CoMn-1![[thin space (1/6-em)]](https://www.rsc.org/images/entities/char_2009.gif) :
:![[thin space (1/6-em)]](https://www.rsc.org/images/entities/char_2009.gif) x
x![[thin space (1/6-em)]](https://www.rsc.org/images/entities/char_2009.gif) :
:![[thin space (1/6-em)]](https://www.rsc.org/images/entities/char_2009.gif) 2 − x (x = 0, 0.5, 1 and 1.5) aerogel, we used the high-temperature carbonization method. We exploited PA–CoMn-1
2 − x (x = 0, 0.5, 1 and 1.5) aerogel, we used the high-temperature carbonization method. We exploited PA–CoMn-1![[thin space (1/6-em)]](https://www.rsc.org/images/entities/char_2009.gif) :
:![[thin space (1/6-em)]](https://www.rsc.org/images/entities/char_2009.gif) x
x![[thin space (1/6-em)]](https://www.rsc.org/images/entities/char_2009.gif) :
:![[thin space (1/6-em)]](https://www.rsc.org/images/entities/char_2009.gif) 2 − x (x = 0, 0.5, 1 and 1.5) aerogel as a matrix and dropped it on the surface of SPCE for the sensitive detection of 4-AP. The conductive and electrocatalytic properties of PA–CoMn-1
2 − x (x = 0, 0.5, 1 and 1.5) aerogel as a matrix and dropped it on the surface of SPCE for the sensitive detection of 4-AP. The conductive and electrocatalytic properties of PA–CoMn-1![[thin space (1/6-em)]](https://www.rsc.org/images/entities/char_2009.gif) :
:![[thin space (1/6-em)]](https://www.rsc.org/images/entities/char_2009.gif) x
x![[thin space (1/6-em)]](https://www.rsc.org/images/entities/char_2009.gif) :
:![[thin space (1/6-em)]](https://www.rsc.org/images/entities/char_2009.gif) 2 − x (x = 0, 0.5, 1 and 1.5) aerogel were analyzed using the CV and EIS technique. The experimental parameters for PA–CoMn-1
2 − x (x = 0, 0.5, 1 and 1.5) aerogel were analyzed using the CV and EIS technique. The experimental parameters for PA–CoMn-1![[thin space (1/6-em)]](https://www.rsc.org/images/entities/char_2009.gif) :
:![[thin space (1/6-em)]](https://www.rsc.org/images/entities/char_2009.gif) x
x![[thin space (1/6-em)]](https://www.rsc.org/images/entities/char_2009.gif) :
:![[thin space (1/6-em)]](https://www.rsc.org/images/entities/char_2009.gif) 2 − x (x = 0, 0.5, 1 and 1.5) aerogel detection were optimized using the CV technique. With the optimized parameters, the DPV technique was used to achieve the low detection limit of 4-AP and it was applied to monitoring the 4-AP level in real samples of the commercialized tablet.
2 − x (x = 0, 0.5, 1 and 1.5) aerogel detection were optimized using the CV technique. With the optimized parameters, the DPV technique was used to achieve the low detection limit of 4-AP and it was applied to monitoring the 4-AP level in real samples of the commercialized tablet.
2 Experimental
2.1. Materials
Phytic acid solution (70% w/w H2O), Nafion® (5% w/w in H2O), Co(NO3)2·6H2O, (CH3COO)2Mn, N,N-dimethylformamide (DMF), and 4-acetaminophenol (4-AP) were purchased from Sigma-Aldrich. All chemicals were analytical grade and used without further purification. Phosphate buffer solution (PBS; 5 mM) was prepared by mixing the standard stock solutions of mono and disodium phosphate (NaH2PO4 and Na2HPO4). Diluted hydrochloric acid (HCl aq.) and sodium hydroxide (NaOH) were used for the preparation of solutions with different pH values. A real sample of the commercial drug was procured from local drug stores. All the solutions were prepared using doubly distilled (DD) water.
2.2. Instrumentation
To examine the formation and the phase of the material, X-ray diffraction (XRD) studies were carried out using the Empyrean (Cu Kα = 1.54 nm) instrument. Nicolet 6700 (Thermo Scientific) used to analyze FTIR analysis. Transmission electron microscopy (TEM) and energy-dispersive X-ray spectroscopy (EDS) of the sample were obtained using JEOL F200. The morphology was analyzed using a scanning electron microscope (SEM) (JSM-7610F Plus). The oxidation state and chemical composition of the material was identified using an ESCALAB 250 X-ray photoelectron spectroscopy (XPS) analyzer. The charge transfer resistance of the sensor was recorded using electrochemical impedance spectroscopy (EIS). The electrochemical characteristics of the electrodes were scrutinized by cyclic voltammetry (CV) and differential pulse voltammetry (DPV) instruments. All electrochemical tests were performed using Metrohm PGSTAT302N.
2.3. Preparation of PA–CoMn-1![[thin space (1/6-em)]](https://www.rsc.org/images/entities/h3_char_2009.gif) :
:![[thin space (1/6-em)]](https://www.rsc.org/images/entities/h3_char_2009.gif) x
x![[thin space (1/6-em)]](https://www.rsc.org/images/entities/h3_char_2009.gif) :
:![[thin space (1/6-em)]](https://www.rsc.org/images/entities/h3_char_2009.gif) 2 − x (x = 0, 0.5, 1 and 1.5) organic gels
2 − x (x = 0, 0.5, 1 and 1.5) organic gels
Preparation of PA–CoMn-1![[thin space (1/6-em)]](https://www.rsc.org/images/entities/char_2009.gif) :
:![[thin space (1/6-em)]](https://www.rsc.org/images/entities/char_2009.gif) x
x![[thin space (1/6-em)]](https://www.rsc.org/images/entities/char_2009.gif) :
:![[thin space (1/6-em)]](https://www.rsc.org/images/entities/char_2009.gif) 2 − x (x = 0, 0.5, 1 and 1.5). When x = 1.5, the organic gel had the molecular formula PA–CoMn-1
2 − x (x = 0, 0.5, 1 and 1.5). When x = 1.5, the organic gel had the molecular formula PA–CoMn-1![[thin space (1/6-em)]](https://www.rsc.org/images/entities/char_2009.gif) :
:![[thin space (1/6-em)]](https://www.rsc.org/images/entities/char_2009.gif) 1.5
1.5![[thin space (1/6-em)]](https://www.rsc.org/images/entities/char_2009.gif) :
:![[thin space (1/6-em)]](https://www.rsc.org/images/entities/char_2009.gif) 0.5. The main preparation steps were as follows: a solution of PA (660.0 mg, 1 mmol) in DMF (1.0 mL) and a solution of Co(NO3)2·6H2O (436.5 mg, 1.5 mmol) and (CH3COO)2Mn (86.5 mg, 0.5 mmol) in DMF (1.0 mL) were fully mixed, and then heated at 80 °C for about 2.5 h. The solution mixture became turbid over time and a brown gel was obtained. The wet gel was soaked in DMF for one day to remove unreacted reactants, then subjected to solvent exchange in deionized water, and finally freeze-dried for 24 h to obtain the powder of aerogel PA–CoMn-1
0.5. The main preparation steps were as follows: a solution of PA (660.0 mg, 1 mmol) in DMF (1.0 mL) and a solution of Co(NO3)2·6H2O (436.5 mg, 1.5 mmol) and (CH3COO)2Mn (86.5 mg, 0.5 mmol) in DMF (1.0 mL) were fully mixed, and then heated at 80 °C for about 2.5 h. The solution mixture became turbid over time and a brown gel was obtained. The wet gel was soaked in DMF for one day to remove unreacted reactants, then subjected to solvent exchange in deionized water, and finally freeze-dried for 24 h to obtain the powder of aerogel PA–CoMn-1![[thin space (1/6-em)]](https://www.rsc.org/images/entities/char_2009.gif) :
:![[thin space (1/6-em)]](https://www.rsc.org/images/entities/char_2009.gif) 1.5
1.5![[thin space (1/6-em)]](https://www.rsc.org/images/entities/char_2009.gif) :
:![[thin space (1/6-em)]](https://www.rsc.org/images/entities/char_2009.gif) 0.5 gel.
0.5 gel.
Following a similar procedure, PA–Co-1![[thin space (1/6-em)]](https://www.rsc.org/images/entities/char_2009.gif) :
:![[thin space (1/6-em)]](https://www.rsc.org/images/entities/char_2009.gif) 2 gel was prepared from PA (660.0 mg, 1 mmol) and Co(NO3)2·6H2O (582.0 mg, 2.0 mmol). PA–Mn-1
2 gel was prepared from PA (660.0 mg, 1 mmol) and Co(NO3)2·6H2O (582.0 mg, 2.0 mmol). PA–Mn-1![[thin space (1/6-em)]](https://www.rsc.org/images/entities/char_2009.gif) :
:![[thin space (1/6-em)]](https://www.rsc.org/images/entities/char_2009.gif) 2 gel was prepared from PA (660.0 mg, 1 mmol) and (CH3COO)2Mn (346.0 mg, 2.0 mmol). PA–CoMn-1
2 gel was prepared from PA (660.0 mg, 1 mmol) and (CH3COO)2Mn (346.0 mg, 2.0 mmol). PA–CoMn-1![[thin space (1/6-em)]](https://www.rsc.org/images/entities/char_2009.gif) :
:![[thin space (1/6-em)]](https://www.rsc.org/images/entities/char_2009.gif) 1
1![[thin space (1/6-em)]](https://www.rsc.org/images/entities/char_2009.gif) :
:![[thin space (1/6-em)]](https://www.rsc.org/images/entities/char_2009.gif) 1 gel was prepared from Co(NO3)2·6H2O (291.0 mg, 1.0 mmol) and (CH3COO)2Mn (173.0 mg, 1.0 mmol). PA–CoMn-1
1 gel was prepared from Co(NO3)2·6H2O (291.0 mg, 1.0 mmol) and (CH3COO)2Mn (173.0 mg, 1.0 mmol). PA–CoMn-1![[thin space (1/6-em)]](https://www.rsc.org/images/entities/char_2009.gif) :
:![[thin space (1/6-em)]](https://www.rsc.org/images/entities/char_2009.gif) 0.5
0.5![[thin space (1/6-em)]](https://www.rsc.org/images/entities/char_2009.gif) :
:![[thin space (1/6-em)]](https://www.rsc.org/images/entities/char_2009.gif) 1.5 gel was prepared from Co(NO3)2·6H2O (145.5 mg, 0.5 mmol) and (CH3COO)2Mn (259.5 mg, 1.5 mmol).
1.5 gel was prepared from Co(NO3)2·6H2O (145.5 mg, 0.5 mmol) and (CH3COO)2Mn (259.5 mg, 1.5 mmol).
2.4. PA–CoMn-1![[thin space (1/6-em)]](https://www.rsc.org/images/entities/h3_char_2009.gif) :
:![[thin space (1/6-em)]](https://www.rsc.org/images/entities/h3_char_2009.gif) x
x![[thin space (1/6-em)]](https://www.rsc.org/images/entities/h3_char_2009.gif) :
:![[thin space (1/6-em)]](https://www.rsc.org/images/entities/h3_char_2009.gif) 2 − x (x = 0,0.5, 1 and 1.5) gel carbonized at 800 °C
2 − x (x = 0,0.5, 1 and 1.5) gel carbonized at 800 °C
The resulting PA–CoMn-1![[thin space (1/6-em)]](https://www.rsc.org/images/entities/char_2009.gif) :
:![[thin space (1/6-em)]](https://www.rsc.org/images/entities/char_2009.gif) x
x![[thin space (1/6-em)]](https://www.rsc.org/images/entities/char_2009.gif) :
:![[thin space (1/6-em)]](https://www.rsc.org/images/entities/char_2009.gif) 2 − x (x = 0, 0.5, 1 and 1.5) gel was heated under N2 atmosphere at a heating rate of 5 °C min−1 to 800 °C, and kept at 800 °C for 2 h. After natural cooling, black powders of PA–CoMn-1
2 − x (x = 0, 0.5, 1 and 1.5) gel was heated under N2 atmosphere at a heating rate of 5 °C min−1 to 800 °C, and kept at 800 °C for 2 h. After natural cooling, black powders of PA–CoMn-1![[thin space (1/6-em)]](https://www.rsc.org/images/entities/char_2009.gif) :
:![[thin space (1/6-em)]](https://www.rsc.org/images/entities/char_2009.gif) x
x![[thin space (1/6-em)]](https://www.rsc.org/images/entities/char_2009.gif) :
:![[thin space (1/6-em)]](https://www.rsc.org/images/entities/char_2009.gif) 2 − x (x = 0.5, 1 and 1.5) aerogel were obtained. The entire synthesis method of the electrode modifier and the detection mechanism of 4-AP are shown in Scheme 1.
2 − x (x = 0.5, 1 and 1.5) aerogel were obtained. The entire synthesis method of the electrode modifier and the detection mechanism of 4-AP are shown in Scheme 1.
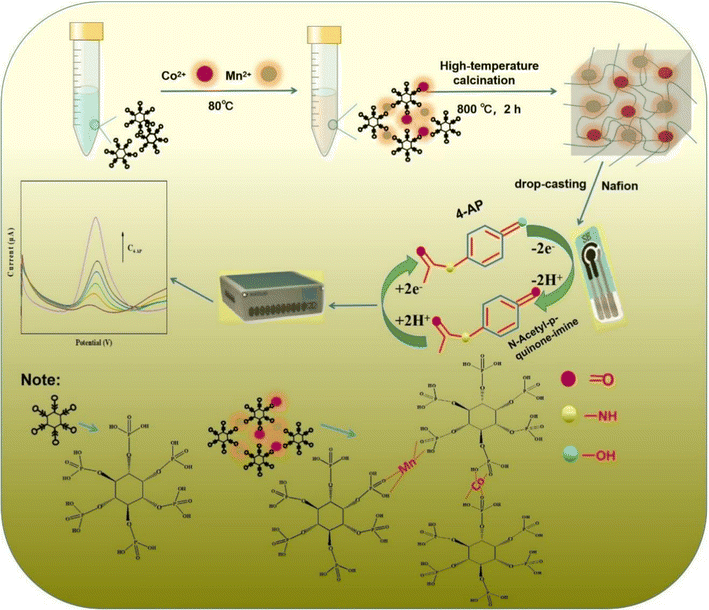 |
| | Scheme 1 Illustration of the synthesis of PA–CoMn-1![[thin space (1/6-em)]](https://www.rsc.org/images/entities/char_2009.gif) : :![[thin space (1/6-em)]](https://www.rsc.org/images/entities/char_2009.gif) x x![[thin space (1/6-em)]](https://www.rsc.org/images/entities/char_2009.gif) : :![[thin space (1/6-em)]](https://www.rsc.org/images/entities/char_2009.gif) 2 − x (x = 0, 0.5, 1 and 1.5) aerogel nanocomposite and the application of sensing 4-AP. 2 − x (x = 0, 0.5, 1 and 1.5) aerogel nanocomposite and the application of sensing 4-AP. | |
3 Results and discussion
3.1. XRD analysis
The crystallinity and structural property of PA–CoMn-1![[thin space (1/6-em)]](https://www.rsc.org/images/entities/char_2009.gif) :
:![[thin space (1/6-em)]](https://www.rsc.org/images/entities/char_2009.gif) x
x![[thin space (1/6-em)]](https://www.rsc.org/images/entities/char_2009.gif) :
:![[thin space (1/6-em)]](https://www.rsc.org/images/entities/char_2009.gif) 2 − x (x = 0 and 1.5) aerogel were characterized by XRD. As displayed in Fig. 1, the diffraction peaks of PA–CoMn-1
2 − x (x = 0 and 1.5) aerogel were characterized by XRD. As displayed in Fig. 1, the diffraction peaks of PA–CoMn-1![[thin space (1/6-em)]](https://www.rsc.org/images/entities/char_2009.gif) :
:![[thin space (1/6-em)]](https://www.rsc.org/images/entities/char_2009.gif) 1.5
1.5![[thin space (1/6-em)]](https://www.rsc.org/images/entities/char_2009.gif) :
:![[thin space (1/6-em)]](https://www.rsc.org/images/entities/char_2009.gif) 0.5 aerogel matched well with the simulated PA–Co-1
0.5 aerogel matched well with the simulated PA–Co-1![[thin space (1/6-em)]](https://www.rsc.org/images/entities/char_2009.gif) :
:![[thin space (1/6-em)]](https://www.rsc.org/images/entities/char_2009.gif) 2 and PA–Mn-1
2 and PA–Mn-1![[thin space (1/6-em)]](https://www.rsc.org/images/entities/char_2009.gif) :
:![[thin space (1/6-em)]](https://www.rsc.org/images/entities/char_2009.gif) 2, whereby the diffraction peaks appearing at 2θ = 29.60°, 31.10° and 34.6° can be assigned to (011), (101) and (111), respectively.30,31 The aerogel PA–Mn-1
2, whereby the diffraction peaks appearing at 2θ = 29.60°, 31.10° and 34.6° can be assigned to (011), (101) and (111), respectively.30,31 The aerogel PA–Mn-1![[thin space (1/6-em)]](https://www.rsc.org/images/entities/char_2009.gif) :
:![[thin space (1/6-em)]](https://www.rsc.org/images/entities/char_2009.gif) 2 exhibited a characteristic peak confirming the presence of Mn2O3 particles in the PA–CoMn-1
2 exhibited a characteristic peak confirming the presence of Mn2O3 particles in the PA–CoMn-1![[thin space (1/6-em)]](https://www.rsc.org/images/entities/char_2009.gif) :
:![[thin space (1/6-em)]](https://www.rsc.org/images/entities/char_2009.gif) 1.5
1.5![[thin space (1/6-em)]](https://www.rsc.org/images/entities/char_2009.gif) :
:![[thin space (1/6-em)]](https://www.rsc.org/images/entities/char_2009.gif) 0.5 nanocomposite. Due to the presence of a small amount Mn2O3 in the PA–CoMn-1
0.5 nanocomposite. Due to the presence of a small amount Mn2O3 in the PA–CoMn-1![[thin space (1/6-em)]](https://www.rsc.org/images/entities/char_2009.gif) :
:![[thin space (1/6-em)]](https://www.rsc.org/images/entities/char_2009.gif) 1.5
1.5![[thin space (1/6-em)]](https://www.rsc.org/images/entities/char_2009.gif) :
:![[thin space (1/6-em)]](https://www.rsc.org/images/entities/char_2009.gif) 0.5 nanocomposite, the XRD patterns of Mn2O3 NPs were relatively poor. The PXRD pattern of PA–FeCo-1
0.5 nanocomposite, the XRD patterns of Mn2O3 NPs were relatively poor. The PXRD pattern of PA–FeCo-1![[thin space (1/6-em)]](https://www.rsc.org/images/entities/char_2009.gif) :
:![[thin space (1/6-em)]](https://www.rsc.org/images/entities/char_2009.gif) 2
2![[thin space (1/6-em)]](https://www.rsc.org/images/entities/char_2009.gif) :
:![[thin space (1/6-em)]](https://www.rsc.org/images/entities/char_2009.gif) 2 consisted of Co2P4O12 (PDF#84-2208), revealing that PA–FeCo-1
2 consisted of Co2P4O12 (PDF#84-2208), revealing that PA–FeCo-1![[thin space (1/6-em)]](https://www.rsc.org/images/entities/char_2009.gif) :
:![[thin space (1/6-em)]](https://www.rsc.org/images/entities/char_2009.gif) 2
2![[thin space (1/6-em)]](https://www.rsc.org/images/entities/char_2009.gif) :
:![[thin space (1/6-em)]](https://www.rsc.org/images/entities/char_2009.gif) 2 had a Co2P4O12 structure, which confirmed the successful fabrication of samples.
2 had a Co2P4O12 structure, which confirmed the successful fabrication of samples.
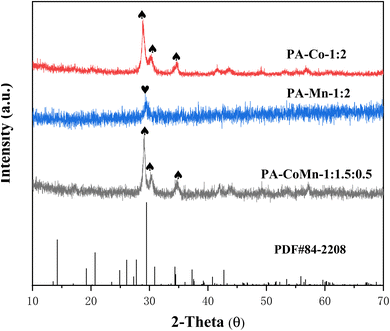 |
| | Fig. 1 PWXRD patterns of PA–Co-1![[thin space (1/6-em)]](https://www.rsc.org/images/entities/char_2009.gif) : :![[thin space (1/6-em)]](https://www.rsc.org/images/entities/char_2009.gif) 2, PA–Mn-1 2, PA–Mn-1![[thin space (1/6-em)]](https://www.rsc.org/images/entities/char_2009.gif) : :![[thin space (1/6-em)]](https://www.rsc.org/images/entities/char_2009.gif) 2 and PA–CoMn-1 2 and PA–CoMn-1![[thin space (1/6-em)]](https://www.rsc.org/images/entities/char_2009.gif) : :![[thin space (1/6-em)]](https://www.rsc.org/images/entities/char_2009.gif) 1.5 1.5![[thin space (1/6-em)]](https://www.rsc.org/images/entities/char_2009.gif) : :![[thin space (1/6-em)]](https://www.rsc.org/images/entities/char_2009.gif) 0.5 aerogel. 0.5 aerogel. | |
3.2. FESEM analysis
The morphology of the synthesized material and its composite were analyzed by SEM (Fig. 2). Single metal–PA aerogel of Mn and Co are shown in Fig. 2a and b. PA–Co-1![[thin space (1/6-em)]](https://www.rsc.org/images/entities/char_2009.gif) :
:![[thin space (1/6-em)]](https://www.rsc.org/images/entities/char_2009.gif) 2 had a morphology of cross-linked network structure aggregated by irregular nanoparticles, with a particle diameter of about 50 nm. PA–Co-1
2 had a morphology of cross-linked network structure aggregated by irregular nanoparticles, with a particle diameter of about 50 nm. PA–Co-1![[thin space (1/6-em)]](https://www.rsc.org/images/entities/char_2009.gif) :
:![[thin space (1/6-em)]](https://www.rsc.org/images/entities/char_2009.gif) 2 exhibited a stacked three-dimensional structure composed of irregular nanosheets and nanoparticles. Compared with single metal–PA aerogel, the PA–CoMn-1
2 exhibited a stacked three-dimensional structure composed of irregular nanosheets and nanoparticles. Compared with single metal–PA aerogel, the PA–CoMn-1![[thin space (1/6-em)]](https://www.rsc.org/images/entities/char_2009.gif) :
:![[thin space (1/6-em)]](https://www.rsc.org/images/entities/char_2009.gif) 1.5
1.5![[thin space (1/6-em)]](https://www.rsc.org/images/entities/char_2009.gif) :
:![[thin space (1/6-em)]](https://www.rsc.org/images/entities/char_2009.gif) 0.5 aerogel displayed a more tightly cross-linked porous structure, with irregular bore diameter (Fig. 2c and d). Moreover, the energy-dispersive spectroscopy (EDS) elemental mapping images and spectrum of PA–CoMn-1
0.5 aerogel displayed a more tightly cross-linked porous structure, with irregular bore diameter (Fig. 2c and d). Moreover, the energy-dispersive spectroscopy (EDS) elemental mapping images and spectrum of PA–CoMn-1![[thin space (1/6-em)]](https://www.rsc.org/images/entities/char_2009.gif) :
:![[thin space (1/6-em)]](https://www.rsc.org/images/entities/char_2009.gif) 1.5
1.5![[thin space (1/6-em)]](https://www.rsc.org/images/entities/char_2009.gif) :
:![[thin space (1/6-em)]](https://www.rsc.org/images/entities/char_2009.gif) 0.5 demonstrated that Co, Mn, P, O and C elements were all present (Fig. 3a–g). This confirmed that PA–CoMn-1
0.5 demonstrated that Co, Mn, P, O and C elements were all present (Fig. 3a–g). This confirmed that PA–CoMn-1![[thin space (1/6-em)]](https://www.rsc.org/images/entities/char_2009.gif) :
:![[thin space (1/6-em)]](https://www.rsc.org/images/entities/char_2009.gif) 1.5
1.5![[thin space (1/6-em)]](https://www.rsc.org/images/entities/char_2009.gif) :
:![[thin space (1/6-em)]](https://www.rsc.org/images/entities/char_2009.gif) 0.5 was successfully prepared by high temperature carbonization. Moreover, TEM images of PA–CoMn-1
0.5 was successfully prepared by high temperature carbonization. Moreover, TEM images of PA–CoMn-1![[thin space (1/6-em)]](https://www.rsc.org/images/entities/char_2009.gif) :
:![[thin space (1/6-em)]](https://www.rsc.org/images/entities/char_2009.gif) 1.5
1.5![[thin space (1/6-em)]](https://www.rsc.org/images/entities/char_2009.gif) :
:![[thin space (1/6-em)]](https://www.rsc.org/images/entities/char_2009.gif) 0.5 (Fig. 4a–c) aerogel and mapping images (Co, Mn, P, O and C) (g–i) are shown in Fig. S1(g–i).† The calculated lattice distance d = 0.325 nm is also correlated with the plane (111) in PA–CoMn-1
0.5 (Fig. 4a–c) aerogel and mapping images (Co, Mn, P, O and C) (g–i) are shown in Fig. S1(g–i).† The calculated lattice distance d = 0.325 nm is also correlated with the plane (111) in PA–CoMn-1![[thin space (1/6-em)]](https://www.rsc.org/images/entities/char_2009.gif) :
:![[thin space (1/6-em)]](https://www.rsc.org/images/entities/char_2009.gif) 1.5
1.5![[thin space (1/6-em)]](https://www.rsc.org/images/entities/char_2009.gif) :
:![[thin space (1/6-em)]](https://www.rsc.org/images/entities/char_2009.gif) 0.5 and matched with the XRD data.
0.5 and matched with the XRD data.
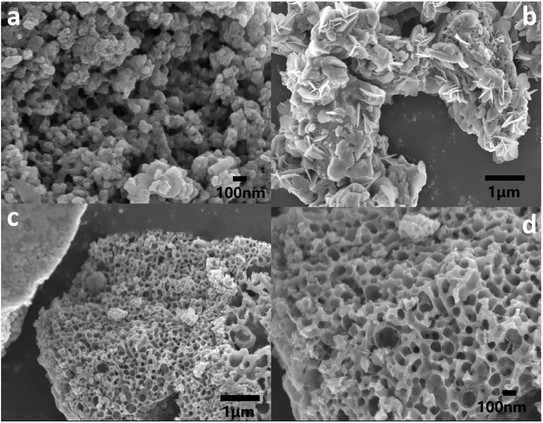 |
| | Fig. 2 SEM images of PA–Co-1![[thin space (1/6-em)]](https://www.rsc.org/images/entities/char_2009.gif) : :![[thin space (1/6-em)]](https://www.rsc.org/images/entities/char_2009.gif) 2 (a), PA–Mn-1 2 (a), PA–Mn-1![[thin space (1/6-em)]](https://www.rsc.org/images/entities/char_2009.gif) : :![[thin space (1/6-em)]](https://www.rsc.org/images/entities/char_2009.gif) 2 (b) and PA–CoMn-1 2 (b) and PA–CoMn-1![[thin space (1/6-em)]](https://www.rsc.org/images/entities/char_2009.gif) : :![[thin space (1/6-em)]](https://www.rsc.org/images/entities/char_2009.gif) 1.5 1.5![[thin space (1/6-em)]](https://www.rsc.org/images/entities/char_2009.gif) : :![[thin space (1/6-em)]](https://www.rsc.org/images/entities/char_2009.gif) 0.5 (c and d) aerogel. 0.5 (c and d) aerogel. | |
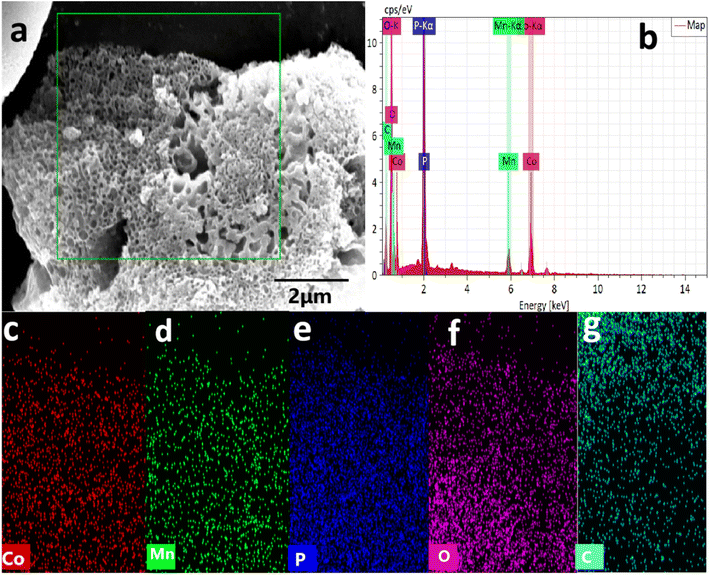 |
| | Fig. 3 EDS-based element district (a) and mapping images (Co, Mn, P, O and C) (c–g), (b) EDS spectrum of PA–FeCo-1![[thin space (1/6-em)]](https://www.rsc.org/images/entities/char_2009.gif) : :![[thin space (1/6-em)]](https://www.rsc.org/images/entities/char_2009.gif) 1.5 1.5![[thin space (1/6-em)]](https://www.rsc.org/images/entities/char_2009.gif) : :![[thin space (1/6-em)]](https://www.rsc.org/images/entities/char_2009.gif) 0.5 aerogel. 0.5 aerogel. | |
 |
| | Fig. 4 (a–c) TEM images of PA–CoMn-1![[thin space (1/6-em)]](https://www.rsc.org/images/entities/char_2009.gif) : :![[thin space (1/6-em)]](https://www.rsc.org/images/entities/char_2009.gif) 1.5 1.5![[thin space (1/6-em)]](https://www.rsc.org/images/entities/char_2009.gif) : :![[thin space (1/6-em)]](https://www.rsc.org/images/entities/char_2009.gif) 0.5 aerogel. 0.5 aerogel. | |
3.3. FT-IR spectra
Fourier transform infrared spectroscopy (FT-IR) was used to further explore the detailed chemical structures of PA–CoMn-1![[thin space (1/6-em)]](https://www.rsc.org/images/entities/char_2009.gif) :
:![[thin space (1/6-em)]](https://www.rsc.org/images/entities/char_2009.gif) x
x![[thin space (1/6-em)]](https://www.rsc.org/images/entities/char_2009.gif) :
:![[thin space (1/6-em)]](https://www.rsc.org/images/entities/char_2009.gif) 2 − x (x = 0, 0.5, 1 and 1.5) aerogel (Fig. 5). Four bands appeared at 610 and 530 cm−1 which can be attributed to the asymmetric stretching and bending mode of vibrations of Mn–O.32 The absorptions of PA–CoMn-1
2 − x (x = 0, 0.5, 1 and 1.5) aerogel (Fig. 5). Four bands appeared at 610 and 530 cm−1 which can be attributed to the asymmetric stretching and bending mode of vibrations of Mn–O.32 The absorptions of PA–CoMn-1![[thin space (1/6-em)]](https://www.rsc.org/images/entities/char_2009.gif) :
:![[thin space (1/6-em)]](https://www.rsc.org/images/entities/char_2009.gif) x
x![[thin space (1/6-em)]](https://www.rsc.org/images/entities/char_2009.gif) :
:![[thin space (1/6-em)]](https://www.rsc.org/images/entities/char_2009.gif) 2 − x (x = 0, 0.5, 1 and 1.5) aerogel at 1510 and 1070 cm−1 are attributed to the stretching vibrations of P
2 − x (x = 0, 0.5, 1 and 1.5) aerogel at 1510 and 1070 cm−1 are attributed to the stretching vibrations of P![[double bond, length as m-dash]](https://www.rsc.org/images/entities/char_e001.gif) O and P–O–C, respectively. It indicates that high temperature carbonization destroyed most of the P
O and P–O–C, respectively. It indicates that high temperature carbonization destroyed most of the P![[double bond, length as m-dash]](https://www.rsc.org/images/entities/char_e001.gif) O groups, which may be the cause of particle agglomeration.
O groups, which may be the cause of particle agglomeration.
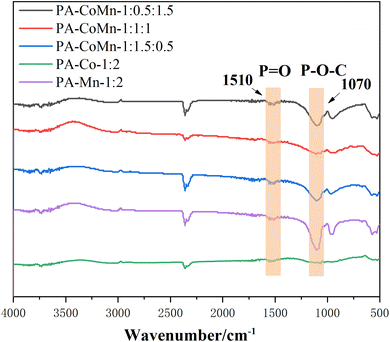 |
| | Fig. 5 FT-IR images of PA–CoMn-1![[thin space (1/6-em)]](https://www.rsc.org/images/entities/char_2009.gif) : :![[thin space (1/6-em)]](https://www.rsc.org/images/entities/char_2009.gif) x x![[thin space (1/6-em)]](https://www.rsc.org/images/entities/char_2009.gif) : :![[thin space (1/6-em)]](https://www.rsc.org/images/entities/char_2009.gif) 2 − x (x = 0, 0.5, 1 and 1.5) aerogel. 2 − x (x = 0, 0.5, 1 and 1.5) aerogel. | |
3.4. XPS spectra analysis
X-ray photoelectron spectroscopy (XPS) was utilized to explore elemental composition and surface chemical valence of PA–FeCo-1![[thin space (1/6-em)]](https://www.rsc.org/images/entities/char_2009.gif) :
:![[thin space (1/6-em)]](https://www.rsc.org/images/entities/char_2009.gif) 1.5
1.5![[thin space (1/6-em)]](https://www.rsc.org/images/entities/char_2009.gif) :
:![[thin space (1/6-em)]](https://www.rsc.org/images/entities/char_2009.gif) 0.5 aerogel. The obtained survey spectrum displayed in Fig. 6 confirmed the presence of Mn, Co, P, C & O elements. As shown in Fig. 7a, the C 1s high-resolution peak revealed that two types of carbon bond arise at binding energies of 284.48 and 286.42 eV for C–C and C–O bonds, respectively. The metal phosphide bond was confirmed with the high-resolution XPS peak of P 2p shown in Fig. 7b; a peak at 132.9 eV represents the existence of the Mn–P bond and Co–P, and another peak observed at 133.90 eV for the surface oxidation of metal phosphide. Fig. 7c displays the 2p1/2 orbital of Mn at the binding energies of 653.46 eV and 655.14 eV, followed by the 2p3/2 orbital of Mn at the binding energies of 641.71 eV and 643.83 eV, confirming the presence of Mn in both +2 and +3 oxidation states, respectively. The high-resolution XPS of Co 2p (Fig. 7d) exhibited main peaks at 781.01 eV and 796.64 eV attributed to Co 2p3/2 and Co 2p1/2 of Co in +2 state. Moreover, the two satellite peaks of Co-atom are observed at binding energies of 786.33 eV and 802.91 eV. As obtained in P 2p, the peaks confirm that PA effectively interacts with the MnCo through its affinity with the metal.
0.5 aerogel. The obtained survey spectrum displayed in Fig. 6 confirmed the presence of Mn, Co, P, C & O elements. As shown in Fig. 7a, the C 1s high-resolution peak revealed that two types of carbon bond arise at binding energies of 284.48 and 286.42 eV for C–C and C–O bonds, respectively. The metal phosphide bond was confirmed with the high-resolution XPS peak of P 2p shown in Fig. 7b; a peak at 132.9 eV represents the existence of the Mn–P bond and Co–P, and another peak observed at 133.90 eV for the surface oxidation of metal phosphide. Fig. 7c displays the 2p1/2 orbital of Mn at the binding energies of 653.46 eV and 655.14 eV, followed by the 2p3/2 orbital of Mn at the binding energies of 641.71 eV and 643.83 eV, confirming the presence of Mn in both +2 and +3 oxidation states, respectively. The high-resolution XPS of Co 2p (Fig. 7d) exhibited main peaks at 781.01 eV and 796.64 eV attributed to Co 2p3/2 and Co 2p1/2 of Co in +2 state. Moreover, the two satellite peaks of Co-atom are observed at binding energies of 786.33 eV and 802.91 eV. As obtained in P 2p, the peaks confirm that PA effectively interacts with the MnCo through its affinity with the metal.
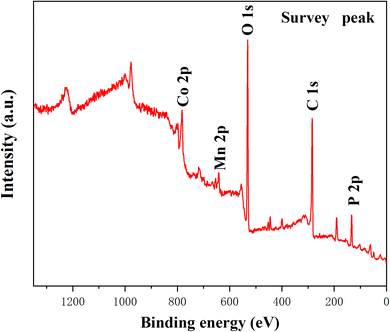 |
| | Fig. 6 XPS spectra of PA–CoMn-1![[thin space (1/6-em)]](https://www.rsc.org/images/entities/char_2009.gif) : :![[thin space (1/6-em)]](https://www.rsc.org/images/entities/char_2009.gif) 1.5 1.5![[thin space (1/6-em)]](https://www.rsc.org/images/entities/char_2009.gif) : :![[thin space (1/6-em)]](https://www.rsc.org/images/entities/char_2009.gif) 0.5 aerogel. 0.5 aerogel. | |
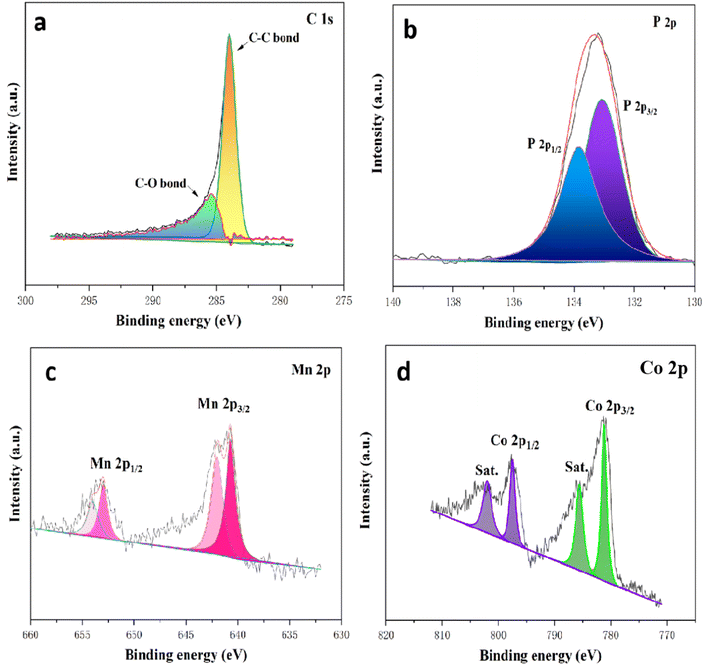 |
| | Fig. 7 Survey spectrum and high-resolution core spectrum for (a) C 1s, (b) P 2p, (c) Mn 2p and (d) Co 2p. | |
3.5. Electrochemical characterization
3.5.1. Electrocatalysis of modified electrodes. The electrocatalytic performance of the PA–CoMn-1![[thin space (1/6-em)]](https://www.rsc.org/images/entities/char_2009.gif) :
:![[thin space (1/6-em)]](https://www.rsc.org/images/entities/char_2009.gif) x
x![[thin space (1/6-em)]](https://www.rsc.org/images/entities/char_2009.gif) :
:![[thin space (1/6-em)]](https://www.rsc.org/images/entities/char_2009.gif) 2 − x (x = 0.5, 1 and 1.5) aerogel/SPCE sensors was analyzed using cyclic voltammetry(CV). The sensor orderly was investigated in the presence of 0.1 M KCl and 5 mM [Fe (CN)6]3−/4− redox probe electrolyte. The CV electrocatalytic performances of PA–CoMn-1
2 − x (x = 0.5, 1 and 1.5) aerogel/SPCE sensors was analyzed using cyclic voltammetry(CV). The sensor orderly was investigated in the presence of 0.1 M KCl and 5 mM [Fe (CN)6]3−/4− redox probe electrolyte. The CV electrocatalytic performances of PA–CoMn-1![[thin space (1/6-em)]](https://www.rsc.org/images/entities/char_2009.gif) :
:![[thin space (1/6-em)]](https://www.rsc.org/images/entities/char_2009.gif) x
x![[thin space (1/6-em)]](https://www.rsc.org/images/entities/char_2009.gif) :
:![[thin space (1/6-em)]](https://www.rsc.org/images/entities/char_2009.gif) 2 − x (x = 0.5, 1 and 1.5) aerogel/SPCE sensor can be seen in Fig. 8a, which shows the electron charge conductivity of varied modified electrodes. From Fig. 8a, the PA–CoMn-1
2 − x (x = 0.5, 1 and 1.5) aerogel/SPCE sensor can be seen in Fig. 8a, which shows the electron charge conductivity of varied modified electrodes. From Fig. 8a, the PA–CoMn-1![[thin space (1/6-em)]](https://www.rsc.org/images/entities/char_2009.gif) :
:![[thin space (1/6-em)]](https://www.rsc.org/images/entities/char_2009.gif) 1.5
1.5![[thin space (1/6-em)]](https://www.rsc.org/images/entities/char_2009.gif) :
:![[thin space (1/6-em)]](https://www.rsc.org/images/entities/char_2009.gif) 0.5 aerogel/SPCE(black) exhibited electrocatalytic activity in the presence of a 5 mM [Fe(CN)6]3−/4− redox probe. Therefore, the modified electrodes resulted in high electron charge and rapid electron transfer between the electrode and the electrolyte. Furthermore, the electron transport capacity of modified electrodes was further evaluated by EIS as shown in Fig. 8b. The Nyquist plot was obtained with an open circuit potential of 0.20 V. The charge transfer resistance (Rct) calculated from the diameter of the semicircle, notably the smaller semicircle exhibited by the PA–CoMn-1
0.5 aerogel/SPCE(black) exhibited electrocatalytic activity in the presence of a 5 mM [Fe(CN)6]3−/4− redox probe. Therefore, the modified electrodes resulted in high electron charge and rapid electron transfer between the electrode and the electrolyte. Furthermore, the electron transport capacity of modified electrodes was further evaluated by EIS as shown in Fig. 8b. The Nyquist plot was obtained with an open circuit potential of 0.20 V. The charge transfer resistance (Rct) calculated from the diameter of the semicircle, notably the smaller semicircle exhibited by the PA–CoMn-1![[thin space (1/6-em)]](https://www.rsc.org/images/entities/char_2009.gif) :
:![[thin space (1/6-em)]](https://www.rsc.org/images/entities/char_2009.gif) 1.5
1.5![[thin space (1/6-em)]](https://www.rsc.org/images/entities/char_2009.gif) :
:![[thin space (1/6-em)]](https://www.rsc.org/images/entities/char_2009.gif) 0.5 aerogel/SPCE shows a higher rate of electron transfer in electrochemical performance. This may be ascribed to the fact that Co–P bonds were generated and increased the electron carrier mobility.
0.5 aerogel/SPCE shows a higher rate of electron transfer in electrochemical performance. This may be ascribed to the fact that Co–P bonds were generated and increased the electron carrier mobility.
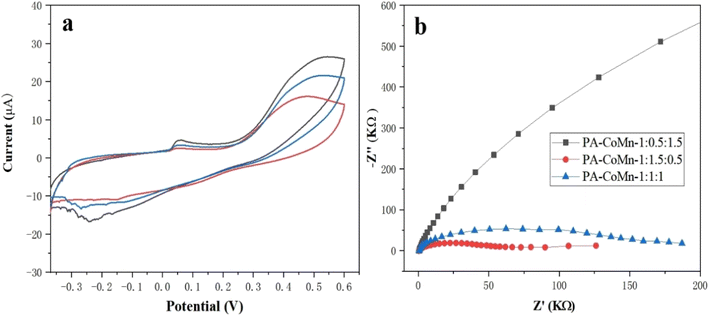 |
| | Fig. 8 (a) CV performance of PA–CoMn-1![[thin space (1/6-em)]](https://www.rsc.org/images/entities/char_2009.gif) : :![[thin space (1/6-em)]](https://www.rsc.org/images/entities/char_2009.gif) 0.5 0.5![[thin space (1/6-em)]](https://www.rsc.org/images/entities/char_2009.gif) : :![[thin space (1/6-em)]](https://www.rsc.org/images/entities/char_2009.gif) 1.5 (red), PA–CoMn-1 1.5 (red), PA–CoMn-1![[thin space (1/6-em)]](https://www.rsc.org/images/entities/char_2009.gif) : :![[thin space (1/6-em)]](https://www.rsc.org/images/entities/char_2009.gif) 1 1![[thin space (1/6-em)]](https://www.rsc.org/images/entities/char_2009.gif) : :![[thin space (1/6-em)]](https://www.rsc.org/images/entities/char_2009.gif) 1.5 (blue) and PA–CoMn-1 1.5 (blue) and PA–CoMn-1![[thin space (1/6-em)]](https://www.rsc.org/images/entities/char_2009.gif) : :![[thin space (1/6-em)]](https://www.rsc.org/images/entities/char_2009.gif) 1.5 1.5![[thin space (1/6-em)]](https://www.rsc.org/images/entities/char_2009.gif) : :![[thin space (1/6-em)]](https://www.rsc.org/images/entities/char_2009.gif) 0.5 (black) aerogel/SPCE and EIS (b). 0.5 (black) aerogel/SPCE and EIS (b). | |
Electrochemical investigation of modified electrodes was performed to test for catalytic performance using CV towards the 4-AP, it is performed with the 100 μM of 4-AP on 0.1 M PBS solution. As displayed in Fig. 9, PA–CoMn-1![[thin space (1/6-em)]](https://www.rsc.org/images/entities/char_2009.gif) :
:![[thin space (1/6-em)]](https://www.rsc.org/images/entities/char_2009.gif) 1.5
1.5![[thin space (1/6-em)]](https://www.rsc.org/images/entities/char_2009.gif) :
:![[thin space (1/6-em)]](https://www.rsc.org/images/entities/char_2009.gif) 0.5 aerogel/SPCE has the highest catalytic activity in the electrochemical redox performance of 4-AP than the PA–CoMn-1
0.5 aerogel/SPCE has the highest catalytic activity in the electrochemical redox performance of 4-AP than the PA–CoMn-1![[thin space (1/6-em)]](https://www.rsc.org/images/entities/char_2009.gif) :
:![[thin space (1/6-em)]](https://www.rsc.org/images/entities/char_2009.gif) 1
1![[thin space (1/6-em)]](https://www.rsc.org/images/entities/char_2009.gif) :
:![[thin space (1/6-em)]](https://www.rsc.org/images/entities/char_2009.gif) 1 and PA–CoMn-1
1 and PA–CoMn-1![[thin space (1/6-em)]](https://www.rsc.org/images/entities/char_2009.gif) :
:![[thin space (1/6-em)]](https://www.rsc.org/images/entities/char_2009.gif) 0.5
0.5![[thin space (1/6-em)]](https://www.rsc.org/images/entities/char_2009.gif) :
:![[thin space (1/6-em)]](https://www.rsc.org/images/entities/char_2009.gif) 1.5 aerogels.
1.5 aerogels.
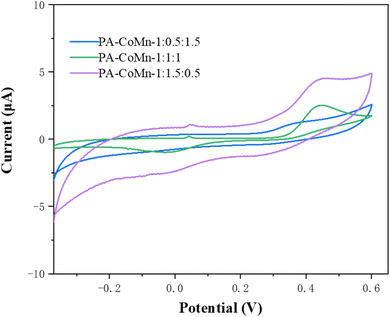 |
| | Fig. 9 CV performance of PA–CoMn-1![[thin space (1/6-em)]](https://www.rsc.org/images/entities/char_2009.gif) : :![[thin space (1/6-em)]](https://www.rsc.org/images/entities/char_2009.gif) x x![[thin space (1/6-em)]](https://www.rsc.org/images/entities/char_2009.gif) : :![[thin space (1/6-em)]](https://www.rsc.org/images/entities/char_2009.gif) 2 − x (x = 0.5, 1 and 1.5) aerogel/SPCE in 100 μM 4-AP. 2 − x (x = 0.5, 1 and 1.5) aerogel/SPCE in 100 μM 4-AP. | |
3.5.2. Effect of scan rate. To investigate the reaction kinetics of the modified electrode, the influence of scan rate was performed. Fig. 10a portrayed the CV curve of 100 μM 4-AP in 0.1 M of PBS at different scan rates varies from 10 to 200 mV s−1. It can be seen that the reduction peak intensity linearly increases with increase in scan rates. Furthermore, the relationship between oxidation peak current and scan rate were plotted and the correlation coefficient values from the linear relationship for anodic current and the cathodic current were obtained as I (μA) = 0.0446x + 1.5909, R2 = 0.9908 and I (μA) = −0.0249x + 1.229R2 = 0.9949 respectively (Fig. 10b) which illustrates that the oxidation of 4-AP on PA–CoMn-1![[thin space (1/6-em)]](https://www.rsc.org/images/entities/char_2009.gif) :
:![[thin space (1/6-em)]](https://www.rsc.org/images/entities/char_2009.gif) 1.5
1.5![[thin space (1/6-em)]](https://www.rsc.org/images/entities/char_2009.gif) :
:![[thin space (1/6-em)]](https://www.rsc.org/images/entities/char_2009.gif) 0.5 aerogel/SPCE was a surface controlled process.
0.5 aerogel/SPCE was a surface controlled process.
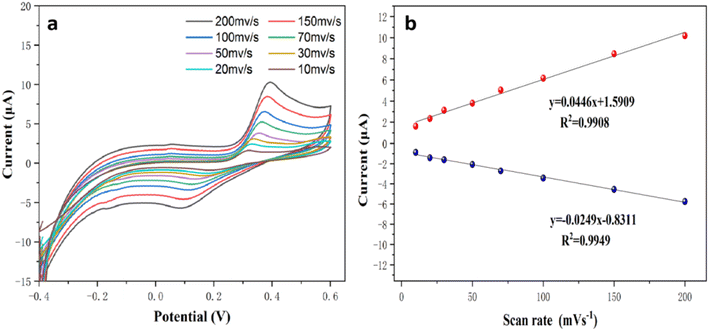 |
| | Fig. 10 (a) The different scan rate CV performances using PA–CoMn-1![[thin space (1/6-em)]](https://www.rsc.org/images/entities/char_2009.gif) : :![[thin space (1/6-em)]](https://www.rsc.org/images/entities/char_2009.gif) 1.5 1.5![[thin space (1/6-em)]](https://www.rsc.org/images/entities/char_2009.gif) : :![[thin space (1/6-em)]](https://www.rsc.org/images/entities/char_2009.gif) 0.5 aerogel/SPCE from the range of 10 to 200 mV s−1 and (b) their scan rate against its current response linear plot. 0.5 aerogel/SPCE from the range of 10 to 200 mV s−1 and (b) their scan rate against its current response linear plot. | |
3.5.3. Influence of different pH. To elucidate the 4-AP oxidation mechanism, the pH effect was investigated for pH range 6.5–9.0 using 50 μM 4-AP with CV test. In Fig. 11, the current peak of 4-AP was shown in the bar chart, which showed varied pH of PBS buffer solution have no significant impact on sensing 4-AP. Furthermore, the pH = 7.5 value was utilized for further experiments.
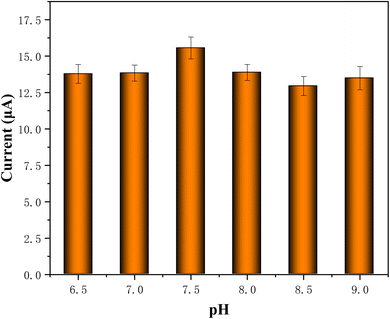 |
| | Fig. 11 Graphical plot of PA–CoMn-1![[thin space (1/6-em)]](https://www.rsc.org/images/entities/char_2009.gif) : :![[thin space (1/6-em)]](https://www.rsc.org/images/entities/char_2009.gif) 1.5 1.5![[thin space (1/6-em)]](https://www.rsc.org/images/entities/char_2009.gif) : :![[thin space (1/6-em)]](https://www.rsc.org/images/entities/char_2009.gif) 0.5 aerogel/SPCE in 0.1 M of different pH (6.5–9) solutions containing 50 μM of 4-AP at scan rate 50 mV s−1. 0.5 aerogel/SPCE in 0.1 M of different pH (6.5–9) solutions containing 50 μM of 4-AP at scan rate 50 mV s−1. | |
3.5.4. Quantitative analysis. DPV was employed for the sensitive detection of PA–CoMn-1![[thin space (1/6-em)]](https://www.rsc.org/images/entities/char_2009.gif) :
:![[thin space (1/6-em)]](https://www.rsc.org/images/entities/char_2009.gif) 1.5
1.5![[thin space (1/6-em)]](https://www.rsc.org/images/entities/char_2009.gif) :
:![[thin space (1/6-em)]](https://www.rsc.org/images/entities/char_2009.gif) 0.5 aerogel/SPCE and was recorded by varying the concentrations of 4-AP in 0.1 M PBS (pH 7.5) at a scan rate of 100 mV s− 1. Fig. 12a shows the response of DPV curve for the oxidation of 4-AP with different initial concentrations with optimal condition. Here at lower concentration, a sharp oxidation peak potential was obtained at 0.39 V. It can be witnessed that the oxidation peak current linearly increases with increase in the 4-AP concentration from 1 μM to 0.1 mM. Besides, a linear plot of reduction current versus the concentration of 4-AP displayed two linear relationships in the range of 1 μM to 0.1 mM (Fig. 12b). The corresponding linear equation with correlation coefficient was expressed as I (μA) = 0.098 + 0.07C4-AP, R2 = 0.9956. Further, the lowest limit of detection (LOD) was calculated from the lowest concentration using the following eqn (1).where σ specifies the standard deviation response from the lowest concentration and slope denotes the slope obtained from the calibration curve. The slope value from the first linear equation is 0.07 and the LOD was found to be 0.2133 μM. A comparison of our sensor with the previously reported sensor is presented in Table 1.
0.5 aerogel/SPCE and was recorded by varying the concentrations of 4-AP in 0.1 M PBS (pH 7.5) at a scan rate of 100 mV s− 1. Fig. 12a shows the response of DPV curve for the oxidation of 4-AP with different initial concentrations with optimal condition. Here at lower concentration, a sharp oxidation peak potential was obtained at 0.39 V. It can be witnessed that the oxidation peak current linearly increases with increase in the 4-AP concentration from 1 μM to 0.1 mM. Besides, a linear plot of reduction current versus the concentration of 4-AP displayed two linear relationships in the range of 1 μM to 0.1 mM (Fig. 12b). The corresponding linear equation with correlation coefficient was expressed as I (μA) = 0.098 + 0.07C4-AP, R2 = 0.9956. Further, the lowest limit of detection (LOD) was calculated from the lowest concentration using the following eqn (1).where σ specifies the standard deviation response from the lowest concentration and slope denotes the slope obtained from the calibration curve. The slope value from the first linear equation is 0.07 and the LOD was found to be 0.2133 μM. A comparison of our sensor with the previously reported sensor is presented in Table 1.
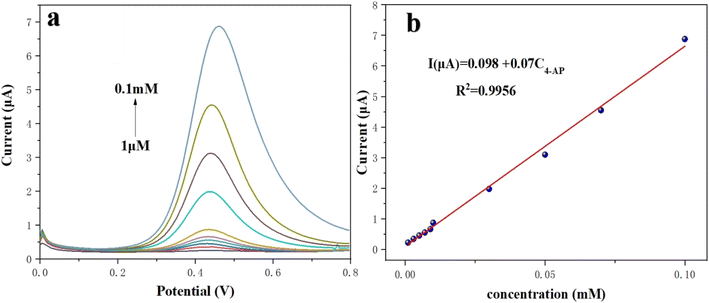 |
| | Fig. 12 (a) DPV responses of PA–CoMn-1![[thin space (1/6-em)]](https://www.rsc.org/images/entities/char_2009.gif) : :![[thin space (1/6-em)]](https://www.rsc.org/images/entities/char_2009.gif) 1.5 1.5![[thin space (1/6-em)]](https://www.rsc.org/images/entities/char_2009.gif) : :![[thin space (1/6-em)]](https://www.rsc.org/images/entities/char_2009.gif) 0.5 aerogel/SPCE in 0.1 M pH 7.5 solution by successive addition of 4-AP (1 μM to 0.1 mM). (b) Linear plot of current response vs. 4-AP. 0.5 aerogel/SPCE in 0.1 M pH 7.5 solution by successive addition of 4-AP (1 μM to 0.1 mM). (b) Linear plot of current response vs. 4-AP. | |
Table 1 Comparison of 4-AP determination with different electrodesa
| Sensors |
Methods |
Linear range |
LOD |
References |
| 1,3,5-Triformylphloroglucinol (TFP) and 2,6-diaminoanthraquinone (DAAQ) and named as TFP–DAAQ-COF, Lt/fMWCNT = luteolin on a functionalized multi-wall carbon nanotube. |
| Hollow Fe3O4–rGO/GCE |
SWV |
5 × 10⁻⁷ to 10−4 M |
0.11 μM |
33 |
| Ag-ZIF-67/GCE |
DPV |
0.1–70.0 μM |
0.04 μM |
34 |
| Sa-TN50/Cu3(BTC)2/GCE |
DPV |
4.0–153.0 μM |
0.7 μM |
35 |
| Lt/fMWCNT |
DPV |
0.9–80 μM |
0.78 μM |
36 |
| NiO–CuO/GR |
SWV |
4.0–400 μM |
1.33 μM |
37 |
| MB/Cu/N–C/GCE |
SWV |
0.5–150.0 μM |
0.4 μM |
38 |
| AuNP–PGA/SWCNT film |
DPV |
50–300 μM |
15.0 μM |
39 |
| FeNi/rGO/GCE |
DPV |
1–100 μM, 100–3000 μM |
0.3 μM |
40 |
PA–CoMn-1![[thin space (1/6-em)]](https://www.rsc.org/images/entities/char_2009.gif) : :![[thin space (1/6-em)]](https://www.rsc.org/images/entities/char_2009.gif) x x![[thin space (1/6-em)]](https://www.rsc.org/images/entities/char_2009.gif) : :![[thin space (1/6-em)]](https://www.rsc.org/images/entities/char_2009.gif) 2 − x (x = 0, 0.5, 1 and 1.5)/SPCE 2 − x (x = 0, 0.5, 1 and 1.5)/SPCE |
DPV |
1 μM to 0.1 mM |
0.2133 μM |
This work |
3.5.5. Selectivity, stability and reproducibility of PA–CoMn-1![[thin space (1/6-em)]](https://www.rsc.org/images/entities/b_char_2009.gif) :
:![[thin space (1/6-em)]](https://www.rsc.org/images/entities/b_char_2009.gif) 1.5
1.5![[thin space (1/6-em)]](https://www.rsc.org/images/entities/b_char_2009.gif) :
:![[thin space (1/6-em)]](https://www.rsc.org/images/entities/b_char_2009.gif) 0.5 aerogel/SPCE modified SPCE. To investigate the anti-interference capability of PA–CoMn-1
0.5 aerogel/SPCE modified SPCE. To investigate the anti-interference capability of PA–CoMn-1![[thin space (1/6-em)]](https://www.rsc.org/images/entities/char_2009.gif) :
:![[thin space (1/6-em)]](https://www.rsc.org/images/entities/char_2009.gif) 1.5
1.5![[thin space (1/6-em)]](https://www.rsc.org/images/entities/char_2009.gif) :
:![[thin space (1/6-em)]](https://www.rsc.org/images/entities/char_2009.gif) 0.5 aerogel/SPCE, the corresponding graphical bar diagram is shown in Fig. 13. The graph shows the effect of 10-fold concentrations of ZnCl2, CuCl2, Co(NO3)2·6H2O, NiCl2·6H2O, urea and glucose on the electrochemical response of 50 μM 4-AP. There is no considerable change in the electrochemical peak current of 4-AP and the influence of interference species on 4-AP detection is less than 5%. Therefore, the proposed PA–CoMn-1
0.5 aerogel/SPCE, the corresponding graphical bar diagram is shown in Fig. 13. The graph shows the effect of 10-fold concentrations of ZnCl2, CuCl2, Co(NO3)2·6H2O, NiCl2·6H2O, urea and glucose on the electrochemical response of 50 μM 4-AP. There is no considerable change in the electrochemical peak current of 4-AP and the influence of interference species on 4-AP detection is less than 5%. Therefore, the proposed PA–CoMn-1![[thin space (1/6-em)]](https://www.rsc.org/images/entities/char_2009.gif) :
:![[thin space (1/6-em)]](https://www.rsc.org/images/entities/char_2009.gif) 1.5
1.5![[thin space (1/6-em)]](https://www.rsc.org/images/entities/char_2009.gif) :
:![[thin space (1/6-em)]](https://www.rsc.org/images/entities/char_2009.gif) 0.5 aerogel/SPCE shows good selectivity towards 4-AP sensor in (pH 7.5) PBS. The storage stability of the proposed sensor was determined using the same electrode for different number of days, which also showed peculiar results with limited change in the current.
0.5 aerogel/SPCE shows good selectivity towards 4-AP sensor in (pH 7.5) PBS. The storage stability of the proposed sensor was determined using the same electrode for different number of days, which also showed peculiar results with limited change in the current.
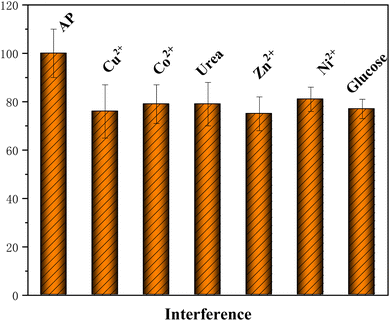 |
| | Fig. 13 Selectivity of PA–CoMn-1![[thin space (1/6-em)]](https://www.rsc.org/images/entities/char_2009.gif) : :![[thin space (1/6-em)]](https://www.rsc.org/images/entities/char_2009.gif) 1.5 1.5![[thin space (1/6-em)]](https://www.rsc.org/images/entities/char_2009.gif) : :![[thin space (1/6-em)]](https://www.rsc.org/images/entities/char_2009.gif) 0.5 aerogel/SPCE toward 4-AP (50 μM) in the presence of 10-fold concentration of different interfering substances. 0.5 aerogel/SPCE toward 4-AP (50 μM) in the presence of 10-fold concentration of different interfering substances. | |
4 Conclusion
In summary, the PA–CoMn-1![[thin space (1/6-em)]](https://www.rsc.org/images/entities/char_2009.gif) :
:![[thin space (1/6-em)]](https://www.rsc.org/images/entities/char_2009.gif) x
x![[thin space (1/6-em)]](https://www.rsc.org/images/entities/char_2009.gif) :
:![[thin space (1/6-em)]](https://www.rsc.org/images/entities/char_2009.gif) 2 − x (x = 0, 0.5, 1 and 1.5) aerogel was successfully prepared and applied in 4-AP sensing in real drug samples with excellent accuracy and applicability, demonstrating its practical precision and superb serviceability. Furthermore, the PA–CoMn-1
2 − x (x = 0, 0.5, 1 and 1.5) aerogel was successfully prepared and applied in 4-AP sensing in real drug samples with excellent accuracy and applicability, demonstrating its practical precision and superb serviceability. Furthermore, the PA–CoMn-1![[thin space (1/6-em)]](https://www.rsc.org/images/entities/char_2009.gif) :
:![[thin space (1/6-em)]](https://www.rsc.org/images/entities/char_2009.gif) x
x![[thin space (1/6-em)]](https://www.rsc.org/images/entities/char_2009.gif) :
:![[thin space (1/6-em)]](https://www.rsc.org/images/entities/char_2009.gif) 2 − x (x = 0, 0.5, 1 and 1.5) aerogel/SPCE exhibited satisfactory selectivity and stability, providing a great potential platform for the construction of 4-AP sensor in varied practical samples and complicated environments.
2 − x (x = 0, 0.5, 1 and 1.5) aerogel/SPCE exhibited satisfactory selectivity and stability, providing a great potential platform for the construction of 4-AP sensor in varied practical samples and complicated environments.
Data availability
Data for the study is openly available in a public repository.
Author contributions
H. J. Guo planned the experiments, conducted the experiments, and wrote the paper draft. Y. F. Qi supported and discussed the manuscript. G. X. Wang and Y. Zhang draw pictures of manuscript. S. Q. Li and B. Y. Tan analyzed the data.
Conflicts of interest
The authors declare no conflict of interest.
Acknowledgements
The authors gratefully acknowledge financial support from Jilin Provincial Department of Science and Technology Project [2021020142GX].
References
- E. A. Suarez, M. Nguyen and D. Zhang, et al., Novel methods for pregnancy drug safety surveillance in the FDA Sentinel System, Pharmacoepidemiol. Drug Saf., 2023, 32(2), 126–136 CrossRef.
- D. G. Serota, Book Review: Drug Safety Evaluation, Fourth Edition, Int. J. Toxicol., 2023,(4), 366–367 CrossRef.
- A. Clary, N. D. Lin and T. Lasky, et al., Considerations for defining medication exposure when analyzing real-world data, Pharmacoepidemiol. Drug Saf., 2023, 32(8), 933–937 CrossRef.
- I. Manov, H. Motanis and I. Frumin, et al., Hepatotoxicity of anti-inflammatory and analgesic drugs: ultrastructural aspects, Acta Pharmacol. Sin., 2010, 27(003), 259–272 CrossRef.
- J. R. Medina, A. Licea and M. Hurtado, An improved micromethod for plasma determination of acetaminophen by visible spectrophotometry: application to a pharmacokinetic study in rabbits, Int. J. Pharm., 2017, 9(4), 96–98 CAS.
- S. F. Cook, A. D. King and Y. Chang, et al., Quantification of a biomarker of acetaminophen protein adducts in human serum by high-performance liquid chromatography-electrospray ionization-tandem mass spectrometry: clinical and animal model applications, J. Chromatogr. B: Anal. Technol. Biomed. Life Sci., 2015, 985, 131–141 CrossRef CAS PubMed.
- Y. J. Chao, L. X. Xie and W. Cao, Chemiluminescence enhancement effect for the determination of acetaminophen with the catalysis of manganese deuteroporphyrin, Key Eng. Mater., 2014, 575–576, 249–252 CAS.
- H. Montaseri and P. B. C. Forbes, Fluorescence sensor probe for the detection of acetaminophen using L-cysteine CdSe/ZnS quantum dots and molecular imprinted polymer@quantum dots, IEEE Sens., 2017, 1–3 Search PubMed.
- Y. C. Liu, S. W. Chang and C. Y. Chen, et al., Separation and determination of cold medicine ingredients by capillary zone electrophoresis using sulfated β-cyclodextrin as an electrolyte modifier and chiral selector, J. Chin. Chem. Soc., 2015, 62(2), 191–196 CrossRef CAS.
- R. Zhang, G. van Straaten and V. Di Palma, et al., Electrochemical activation of atomic layer-deposited cobalt phosphate electrocatalysts for water oxidation, ACS Catal., 2021, 11(5), 2774–2785 CrossRef CAS.
- S. Jiang, L. Zhu and Z. Yang, et al., Enhanced electrocatalytic performance of FeNiCoP amorphous alloys as oxygen-evolving catalysts for electrolytic water splitting application, Electrochim. Acta, 2021, 368, 137618 CrossRef CAS.
- X. Ding, A. Li and F. Yang, et al., Beta-tricalcium phosphate and octacalcium phosphate composite bioceramic material for bone tissue engineering, J. Biomater. Appl., 2020, 9, 34 Search PubMed.
- L. Zhang, J. Peng and W. Zhang, et al., Rational introduction of borate and phosphate ions on NiCo2O4 surface for high-efficiency overall water splitting, J. Power Sources, 2021, 490, 229541 CrossRef CAS.
- S. Kagaya, M. Saiki and A. M. Zanariah, et al., Separation of Lead from Iron Matrix by Coprecipitation with Lanthanum Phosphate for ICP-AES Determination, J. Ecotech. Res., 2005, 11(4), 165–168 Search PubMed.
- S. S. Nandi, V. Adimule and S. A. Kadapure, et al., Rare Earth Based Nanocomposite Materials for Prominent Performance Supercapacitor: A Review, Appl. Mech. Mater., 2022, 908, 3–18 Search PubMed.
- S. Liang, H. Wang and Y. Li, et al., Rare-earth based nanomaterials and their composites as electrode materials for high performance supercapacitors: a review, Sustainable Energy Fuels, 2020, 4(8), 3825–3847 RSC.
- C. Gao, X. Guo and L. Nie, et al., A simple and rapid electrodeposition method to prepare seed layer of WOX on the ITO glass for solvothermal synthesis of WO3 nanowires film, Mater. Lett., 2022, 328, 133136 CrossRef CAS.
- S. D. Han, J. X. Hu and J. H. Li, et al., Anchoring polydentate N/O-ligands in metal phosphite/phosphate/phosphonate (MPO) for functional hybrid materials, Coord. Chem. Rev., 2023, 475, 214892 CrossRef CAS.
- P. A. Shabadrov, A. P. Safronov and N. M. Kurilova, et al., Design of Spherical Gel-Based Magnetic Composites: Synthesis and Characterization, J. Compos. Sci., 2023, 7(5), 177 CrossRef CAS.
- S. R. Murugavel, Compositional control as the key for achieving highly efficient OER electrocatalysis with cobalt phosphates decorated nanocarbon florets, Small, 2020, 16(12), 1903334 CrossRef.
- M. M. Khalaf, H. M. El-Lateef and A. Touny, et al., Electrocatalytic performance of inorganic nanoflakes nickel phosphates under adjusted synthetic parameters towards urea and methanol oxidation in alkaline media, Microchem. J., 2021, 163, 105901 CrossRef CAS.
- P. Bhanja, Y. Kim and B. Paul, et al., Facile synthesis of nanoporous transition metal-based phosphates for oxygen evolution reaction, ChemCatChem, 2020, 12(7), 2091–2096 CrossRef CAS.
- D. S. García, J. Q. Bermejo and J. C. Gutierrez, Green and easy synthesis of P-doped carbon-based hydrogen evolution reaction electrocatalysts, Carbon, 2023, 212, 118154 CrossRef.
- Y. Huo, M. Bu and Z. Ma, et al., Flexible, non-contact and multifunctional humidity sensors based on two-dimensional phytic acid doped co-metal organic frameworks nanosheets, J. Colloid Interface Sci., 2022, 607, 2010–2018 CrossRef CAS.
- X. Feng, Y. L. Xiao and H. H. Huang, et al., Phytic Acid-Based FeCo Bimetallic Metal-Organic Gels for Electrocatalytic Oxygen Evolution Reaction, Chem.–Asian J., 2021, 16(20), 3213–3220 CrossRef CAS PubMed.
- T. Zhang, T. Yang and B. Li, et al., MOF-derived formation of ultrafine FeP nanoparticles confined by N/P Co-doped carbon as an efficient and stable electrocatalyst for hydrogen evolution reaction, Appl. Surf. Sci., 2022, 597, 153662 CrossRef CAS.
- L. Ye, Y. Ying and D. Sun, et al., Ultrafine Mo2C nanoparticles embedded in an MOF derived N and P co-doped carbon matrix for an efficient electrocatalytic oxygen reduction reaction in zinc–air batteries, Nanoscale, 2022, 14(5), 2065–2073 RSC.
- Y. J. Wang, L. Lu and R. X. Tu, et al., Introduction of Cascade Biocatalysis Systems into Metal–Organic Aerogel Nanostructures for Colorimetric Sensing of Glucose, ACS Appl. Nano Mater., 2022, 5(6), 8154–8160 CrossRef CAS.
- X. Niu, J. Y. Lin and X. J. Bo, et al., Preparation of a novel Ni-MOF and porous graphene aerogel composite and application for simultaneous electrochemical determination of nitrochlorobenzene isomers with partial least squares, Microchim. Acta, 2020, 187(7), 1–10 CrossRef.
- J. Wu, Q. Wang and A. Umar, et al., Highly sensitive P-nitrophenol chemical sensor based on crystalline α-MnO2 nanotubes, New J. Chem., 2014, 38(9), 4420–4426 RSC.
- M. M. Rahman, M. M. Alam and A. M. Asiri, Detection of toxic choline based on Mn2O3/NiO nanomaterials by an electrochemical method, RSC Adv., 2019, 9(60), 35146–35157 RSC.
- J. Ahmed, M. Faisal and S. A. Alsareii, et al., Mn2O3 nanoparticle-porous silicon nanocomposite based amperometric sensor for sensitive detection and quantification of Acetaminophen in real samples, Ceram. Int., 2023, 49(1), 933–943 CrossRef CAS.
- L. Shen, J. Dong and B. Wen, et al., Facile Synthesis of Hollow Fe3O4-rGO Nanocomposites for the Electrochemical Detection of Acetaminophen, Nanomaterials, 2023, 13(4), 707 CrossRef CAS PubMed.
- J. Wang, F. Yin and W. Tang, et al., Electrochemical detection of acetaminophen and caffeine using Ag nanoparticles doped metal-organic framework (ZIF-67) composites, Int. J. Electrochem. Sci., 2023, 18(11), 100334 CrossRef.
- E. Mouafo-Tchinda, J. C. Kemmegne-Mbouguen and C. P. Nanseu-Njiki, et al., Solvothermal synthesis of organoclay/Cu-MOF composite and its application in film modified GCE for simultaneous electrochemical detection of deoxyepinephrine, acetaminophen and tyrosine, RSC Adv., 2023, 13(30), 20816–20829 RSC.
- M. Amiri-Aref, J. B. Raoof and R. Ojani, A highly sensitive electrochemical sensor for simultaneous voltammetric determination of noradrenaline, acetaminophen, xanthine and caffeine based on a flavonoid nanostructured modified glassy carbon electrode, Sens. Actuators, B, 2014, 192, 634–641 CrossRef CAS.
- B. Liu, X. Ouyang and Y. Ding, et al., Electrochemical preparation of nickel and copper oxides-decorated graphene composite for simultaneous determination of dopamine, acetaminophen and tryptophan, Talanta, 2016, 146, 114–121 CrossRef CAS PubMed.
- Y. Li, X. Liu and J. Zheng, A dual-ratiometric electrochemical sensor based on Cu/N-doped porous carbon derived from Cu-metal organic framework for acetaminophen determination, Microchem. J., 2023, 189, 108556 CrossRef CAS.
- S. H. Lee, J. H. Lee and V.-K. Tran, et al., Determination of acetaminophen using functional paper-based electrochemical devices, Sens. Actuators, B, 2016, 232, 514–522 CrossRef CAS.
- Y. Yan, S. Zeng and F. Xu, et al., Electrochemical Determination of Acetaminophen with a FeNi Nanoparticle Reduced Graphene Oxide (rGO) Nanocomposite and Differential Pulse Voltammetry (DPV), Anal. Lett., 2024, 57, 996–1007 CrossRef CAS.
|
| This journal is © The Royal Society of Chemistry 2024 |
Click here to see how this site uses Cookies. View our privacy policy here.  Open Access Article
![[thin space (1/6-em)]](https://www.rsc.org/images/entities/h2_char_2009.gif) :
:![[thin space (1/6-em)]](https://www.rsc.org/images/entities/h2_char_2009.gif) x
x![[thin space (1/6-em)]](https://www.rsc.org/images/entities/h2_char_2009.gif) :
:![[thin space (1/6-em)]](https://www.rsc.org/images/entities/h2_char_2009.gif) 2 − x) as a modifier for electrochemical detection of non-steroidal anti-inflammatory drug 4-acetaminophenol†
2 − x) as a modifier for electrochemical detection of non-steroidal anti-inflammatory drug 4-acetaminophenol† *,
Yifei Qi,
Guoxin Wang,
Yue Zhang,
Siqi Li and
Boyu Tan
![[thin space (1/6-em)]](https://www.rsc.org/images/entities/char_2009.gif) :
:![[thin space (1/6-em)]](https://www.rsc.org/images/entities/char_2009.gif) 1.5
1.5![[thin space (1/6-em)]](https://www.rsc.org/images/entities/char_2009.gif) :
:![[thin space (1/6-em)]](https://www.rsc.org/images/entities/char_2009.gif) 0.5 aerogel/Nafion/SPCE proved to be highly sensitive and selective towards the detection of 4-AP. A double linear response was recorded for 4-AP over the range of 1 μM to 0.1 mM and lower detection limits (LOD) of 0.2133 μM. The applicability of the PA–CoMn-1
0.5 aerogel/Nafion/SPCE proved to be highly sensitive and selective towards the detection of 4-AP. A double linear response was recorded for 4-AP over the range of 1 μM to 0.1 mM and lower detection limits (LOD) of 0.2133 μM. The applicability of the PA–CoMn-1![[thin space (1/6-em)]](https://www.rsc.org/images/entities/char_2009.gif) :
:![[thin space (1/6-em)]](https://www.rsc.org/images/entities/char_2009.gif) 1.5
1.5![[thin space (1/6-em)]](https://www.rsc.org/images/entities/char_2009.gif) :
:![[thin space (1/6-em)]](https://www.rsc.org/images/entities/char_2009.gif) 0.5 aerogel/Nafion/SPCE in the detection of 4-AP in commercial drug samples with good recoveries was investigated, confirming the great potential of PA–CoMn-1
0.5 aerogel/Nafion/SPCE in the detection of 4-AP in commercial drug samples with good recoveries was investigated, confirming the great potential of PA–CoMn-1![[thin space (1/6-em)]](https://www.rsc.org/images/entities/char_2009.gif) :
:![[thin space (1/6-em)]](https://www.rsc.org/images/entities/char_2009.gif) 1.5
1.5![[thin space (1/6-em)]](https://www.rsc.org/images/entities/char_2009.gif) :
:![[thin space (1/6-em)]](https://www.rsc.org/images/entities/char_2009.gif) 0.5 aerogel/SPCE in clinical applications.
0.5 aerogel/SPCE in clinical applications.![[thin space (1/6-em)]](https://www.rsc.org/images/entities/char_2009.gif) :
:![[thin space (1/6-em)]](https://www.rsc.org/images/entities/char_2009.gif) x
x![[thin space (1/6-em)]](https://www.rsc.org/images/entities/char_2009.gif) :
:![[thin space (1/6-em)]](https://www.rsc.org/images/entities/char_2009.gif) 2 − x (x = 0, 0.5, 1 and 1.5) gel from PA and mixed Co2+/Mn2+ transition metal ions by facile and green one-pot synthesis under mild conditions. The resulting compounds exhibited promising properties, including high proton conductivity and self-foaming. To promote stability of the PA–CoMn-1
2 − x (x = 0, 0.5, 1 and 1.5) gel from PA and mixed Co2+/Mn2+ transition metal ions by facile and green one-pot synthesis under mild conditions. The resulting compounds exhibited promising properties, including high proton conductivity and self-foaming. To promote stability of the PA–CoMn-1![[thin space (1/6-em)]](https://www.rsc.org/images/entities/char_2009.gif) :
:![[thin space (1/6-em)]](https://www.rsc.org/images/entities/char_2009.gif) x
x![[thin space (1/6-em)]](https://www.rsc.org/images/entities/char_2009.gif) :
:![[thin space (1/6-em)]](https://www.rsc.org/images/entities/char_2009.gif) 2 − x (x = 0, 0.5, 1 and 1.5) aerogel, we used the high-temperature carbonization method. We exploited PA–CoMn-1
2 − x (x = 0, 0.5, 1 and 1.5) aerogel, we used the high-temperature carbonization method. We exploited PA–CoMn-1![[thin space (1/6-em)]](https://www.rsc.org/images/entities/char_2009.gif) :
:![[thin space (1/6-em)]](https://www.rsc.org/images/entities/char_2009.gif) x
x![[thin space (1/6-em)]](https://www.rsc.org/images/entities/char_2009.gif) :
:![[thin space (1/6-em)]](https://www.rsc.org/images/entities/char_2009.gif) 2 − x (x = 0, 0.5, 1 and 1.5) aerogel as a matrix and dropped it on the surface of SPCE for the sensitive detection of 4-AP. The conductive and electrocatalytic properties of PA–CoMn-1
2 − x (x = 0, 0.5, 1 and 1.5) aerogel as a matrix and dropped it on the surface of SPCE for the sensitive detection of 4-AP. The conductive and electrocatalytic properties of PA–CoMn-1![[thin space (1/6-em)]](https://www.rsc.org/images/entities/char_2009.gif) :
:![[thin space (1/6-em)]](https://www.rsc.org/images/entities/char_2009.gif) x
x![[thin space (1/6-em)]](https://www.rsc.org/images/entities/char_2009.gif) :
:![[thin space (1/6-em)]](https://www.rsc.org/images/entities/char_2009.gif) 2 − x (x = 0, 0.5, 1 and 1.5) aerogel were analyzed using the CV and EIS technique. The experimental parameters for PA–CoMn-1
2 − x (x = 0, 0.5, 1 and 1.5) aerogel were analyzed using the CV and EIS technique. The experimental parameters for PA–CoMn-1![[thin space (1/6-em)]](https://www.rsc.org/images/entities/char_2009.gif) :
:![[thin space (1/6-em)]](https://www.rsc.org/images/entities/char_2009.gif) x
x![[thin space (1/6-em)]](https://www.rsc.org/images/entities/char_2009.gif) :
:![[thin space (1/6-em)]](https://www.rsc.org/images/entities/char_2009.gif) 2 − x (x = 0, 0.5, 1 and 1.5) aerogel detection were optimized using the CV technique. With the optimized parameters, the DPV technique was used to achieve the low detection limit of 4-AP and it was applied to monitoring the 4-AP level in real samples of the commercialized tablet.
2 − x (x = 0, 0.5, 1 and 1.5) aerogel detection were optimized using the CV technique. With the optimized parameters, the DPV technique was used to achieve the low detection limit of 4-AP and it was applied to monitoring the 4-AP level in real samples of the commercialized tablet.![[thin space (1/6-em)]](https://www.rsc.org/images/entities/h3_char_2009.gif) :
:![[thin space (1/6-em)]](https://www.rsc.org/images/entities/h3_char_2009.gif) x
x![[thin space (1/6-em)]](https://www.rsc.org/images/entities/h3_char_2009.gif) :
:![[thin space (1/6-em)]](https://www.rsc.org/images/entities/h3_char_2009.gif) 2 − x (x = 0, 0.5, 1 and 1.5) organic gels
2 − x (x = 0, 0.5, 1 and 1.5) organic gels![[thin space (1/6-em)]](https://www.rsc.org/images/entities/char_2009.gif) :
:![[thin space (1/6-em)]](https://www.rsc.org/images/entities/char_2009.gif) x
x![[thin space (1/6-em)]](https://www.rsc.org/images/entities/char_2009.gif) :
:![[thin space (1/6-em)]](https://www.rsc.org/images/entities/char_2009.gif) 2 − x (x = 0, 0.5, 1 and 1.5). When x = 1.5, the organic gel had the molecular formula PA–CoMn-1
2 − x (x = 0, 0.5, 1 and 1.5). When x = 1.5, the organic gel had the molecular formula PA–CoMn-1![[thin space (1/6-em)]](https://www.rsc.org/images/entities/char_2009.gif) :
:![[thin space (1/6-em)]](https://www.rsc.org/images/entities/char_2009.gif) 1.5
1.5![[thin space (1/6-em)]](https://www.rsc.org/images/entities/char_2009.gif) :
:![[thin space (1/6-em)]](https://www.rsc.org/images/entities/char_2009.gif) 0.5. The main preparation steps were as follows: a solution of PA (660.0 mg, 1 mmol) in DMF (1.0 mL) and a solution of Co(NO3)2·6H2O (436.5 mg, 1.5 mmol) and (CH3COO)2Mn (86.5 mg, 0.5 mmol) in DMF (1.0 mL) were fully mixed, and then heated at 80 °C for about 2.5 h. The solution mixture became turbid over time and a brown gel was obtained. The wet gel was soaked in DMF for one day to remove unreacted reactants, then subjected to solvent exchange in deionized water, and finally freeze-dried for 24 h to obtain the powder of aerogel PA–CoMn-1
0.5. The main preparation steps were as follows: a solution of PA (660.0 mg, 1 mmol) in DMF (1.0 mL) and a solution of Co(NO3)2·6H2O (436.5 mg, 1.5 mmol) and (CH3COO)2Mn (86.5 mg, 0.5 mmol) in DMF (1.0 mL) were fully mixed, and then heated at 80 °C for about 2.5 h. The solution mixture became turbid over time and a brown gel was obtained. The wet gel was soaked in DMF for one day to remove unreacted reactants, then subjected to solvent exchange in deionized water, and finally freeze-dried for 24 h to obtain the powder of aerogel PA–CoMn-1![[thin space (1/6-em)]](https://www.rsc.org/images/entities/char_2009.gif) :
:![[thin space (1/6-em)]](https://www.rsc.org/images/entities/char_2009.gif) 1.5
1.5![[thin space (1/6-em)]](https://www.rsc.org/images/entities/char_2009.gif) :
:![[thin space (1/6-em)]](https://www.rsc.org/images/entities/char_2009.gif) 0.5 gel.
0.5 gel.
![[thin space (1/6-em)]](https://www.rsc.org/images/entities/char_2009.gif) :
:![[thin space (1/6-em)]](https://www.rsc.org/images/entities/char_2009.gif) 2 gel was prepared from PA (660.0 mg, 1 mmol) and Co(NO3)2·6H2O (582.0 mg, 2.0 mmol). PA–Mn-1
2 gel was prepared from PA (660.0 mg, 1 mmol) and Co(NO3)2·6H2O (582.0 mg, 2.0 mmol). PA–Mn-1![[thin space (1/6-em)]](https://www.rsc.org/images/entities/char_2009.gif) :
:![[thin space (1/6-em)]](https://www.rsc.org/images/entities/char_2009.gif) 2 gel was prepared from PA (660.0 mg, 1 mmol) and (CH3COO)2Mn (346.0 mg, 2.0 mmol). PA–CoMn-1
2 gel was prepared from PA (660.0 mg, 1 mmol) and (CH3COO)2Mn (346.0 mg, 2.0 mmol). PA–CoMn-1![[thin space (1/6-em)]](https://www.rsc.org/images/entities/char_2009.gif) :
:![[thin space (1/6-em)]](https://www.rsc.org/images/entities/char_2009.gif) 1
1![[thin space (1/6-em)]](https://www.rsc.org/images/entities/char_2009.gif) :
:![[thin space (1/6-em)]](https://www.rsc.org/images/entities/char_2009.gif) 1 gel was prepared from Co(NO3)2·6H2O (291.0 mg, 1.0 mmol) and (CH3COO)2Mn (173.0 mg, 1.0 mmol). PA–CoMn-1
1 gel was prepared from Co(NO3)2·6H2O (291.0 mg, 1.0 mmol) and (CH3COO)2Mn (173.0 mg, 1.0 mmol). PA–CoMn-1![[thin space (1/6-em)]](https://www.rsc.org/images/entities/char_2009.gif) :
:![[thin space (1/6-em)]](https://www.rsc.org/images/entities/char_2009.gif) 0.5
0.5![[thin space (1/6-em)]](https://www.rsc.org/images/entities/char_2009.gif) :
:![[thin space (1/6-em)]](https://www.rsc.org/images/entities/char_2009.gif) 1.5 gel was prepared from Co(NO3)2·6H2O (145.5 mg, 0.5 mmol) and (CH3COO)2Mn (259.5 mg, 1.5 mmol).
1.5 gel was prepared from Co(NO3)2·6H2O (145.5 mg, 0.5 mmol) and (CH3COO)2Mn (259.5 mg, 1.5 mmol).![[thin space (1/6-em)]](https://www.rsc.org/images/entities/h3_char_2009.gif) :
:![[thin space (1/6-em)]](https://www.rsc.org/images/entities/h3_char_2009.gif) x
x![[thin space (1/6-em)]](https://www.rsc.org/images/entities/h3_char_2009.gif) :
:![[thin space (1/6-em)]](https://www.rsc.org/images/entities/h3_char_2009.gif) 2 − x (x = 0,0.5, 1 and 1.5) gel carbonized at 800 °C
2 − x (x = 0,0.5, 1 and 1.5) gel carbonized at 800 °C![[thin space (1/6-em)]](https://www.rsc.org/images/entities/char_2009.gif) :
:![[thin space (1/6-em)]](https://www.rsc.org/images/entities/char_2009.gif) x
x![[thin space (1/6-em)]](https://www.rsc.org/images/entities/char_2009.gif) :
:![[thin space (1/6-em)]](https://www.rsc.org/images/entities/char_2009.gif) 2 − x (x = 0, 0.5, 1 and 1.5) gel was heated under N2 atmosphere at a heating rate of 5 °C min−1 to 800 °C, and kept at 800 °C for 2 h. After natural cooling, black powders of PA–CoMn-1
2 − x (x = 0, 0.5, 1 and 1.5) gel was heated under N2 atmosphere at a heating rate of 5 °C min−1 to 800 °C, and kept at 800 °C for 2 h. After natural cooling, black powders of PA–CoMn-1![[thin space (1/6-em)]](https://www.rsc.org/images/entities/char_2009.gif) :
:![[thin space (1/6-em)]](https://www.rsc.org/images/entities/char_2009.gif) x
x![[thin space (1/6-em)]](https://www.rsc.org/images/entities/char_2009.gif) :
:![[thin space (1/6-em)]](https://www.rsc.org/images/entities/char_2009.gif) 2 − x (x = 0.5, 1 and 1.5) aerogel were obtained. The entire synthesis method of the electrode modifier and the detection mechanism of 4-AP are shown in Scheme 1.
2 − x (x = 0.5, 1 and 1.5) aerogel were obtained. The entire synthesis method of the electrode modifier and the detection mechanism of 4-AP are shown in Scheme 1.

![[thin space (1/6-em)]](https://www.rsc.org/images/entities/char_2009.gif) :
:![[thin space (1/6-em)]](https://www.rsc.org/images/entities/char_2009.gif) x
x![[thin space (1/6-em)]](https://www.rsc.org/images/entities/char_2009.gif) :
:![[thin space (1/6-em)]](https://www.rsc.org/images/entities/char_2009.gif) 2 − x (x = 0, 0.5, 1 and 1.5) aerogel nanocomposite and the application of sensing 4-AP.
2 − x (x = 0, 0.5, 1 and 1.5) aerogel nanocomposite and the application of sensing 4-AP.![[thin space (1/6-em)]](https://www.rsc.org/images/entities/char_2009.gif) :
:![[thin space (1/6-em)]](https://www.rsc.org/images/entities/char_2009.gif) x
x![[thin space (1/6-em)]](https://www.rsc.org/images/entities/char_2009.gif) :
:![[thin space (1/6-em)]](https://www.rsc.org/images/entities/char_2009.gif) 2 − x (x = 0 and 1.5) aerogel were characterized by XRD. As displayed in Fig. 1, the diffraction peaks of PA–CoMn-1
2 − x (x = 0 and 1.5) aerogel were characterized by XRD. As displayed in Fig. 1, the diffraction peaks of PA–CoMn-1![[thin space (1/6-em)]](https://www.rsc.org/images/entities/char_2009.gif) :
:![[thin space (1/6-em)]](https://www.rsc.org/images/entities/char_2009.gif) 1.5
1.5![[thin space (1/6-em)]](https://www.rsc.org/images/entities/char_2009.gif) :
:![[thin space (1/6-em)]](https://www.rsc.org/images/entities/char_2009.gif) 0.5 aerogel matched well with the simulated PA–Co-1
0.5 aerogel matched well with the simulated PA–Co-1![[thin space (1/6-em)]](https://www.rsc.org/images/entities/char_2009.gif) :
:![[thin space (1/6-em)]](https://www.rsc.org/images/entities/char_2009.gif) 2 and PA–Mn-1
2 and PA–Mn-1![[thin space (1/6-em)]](https://www.rsc.org/images/entities/char_2009.gif) :
:![[thin space (1/6-em)]](https://www.rsc.org/images/entities/char_2009.gif) 2, whereby the diffraction peaks appearing at 2θ = 29.60°, 31.10° and 34.6° can be assigned to (011), (101) and (111), respectively.30,31 The aerogel PA–Mn-1
2, whereby the diffraction peaks appearing at 2θ = 29.60°, 31.10° and 34.6° can be assigned to (011), (101) and (111), respectively.30,31 The aerogel PA–Mn-1![[thin space (1/6-em)]](https://www.rsc.org/images/entities/char_2009.gif) :
:![[thin space (1/6-em)]](https://www.rsc.org/images/entities/char_2009.gif) 2 exhibited a characteristic peak confirming the presence of Mn2O3 particles in the PA–CoMn-1
2 exhibited a characteristic peak confirming the presence of Mn2O3 particles in the PA–CoMn-1![[thin space (1/6-em)]](https://www.rsc.org/images/entities/char_2009.gif) :
:![[thin space (1/6-em)]](https://www.rsc.org/images/entities/char_2009.gif) 1.5
1.5![[thin space (1/6-em)]](https://www.rsc.org/images/entities/char_2009.gif) :
:![[thin space (1/6-em)]](https://www.rsc.org/images/entities/char_2009.gif) 0.5 nanocomposite. Due to the presence of a small amount Mn2O3 in the PA–CoMn-1
0.5 nanocomposite. Due to the presence of a small amount Mn2O3 in the PA–CoMn-1![[thin space (1/6-em)]](https://www.rsc.org/images/entities/char_2009.gif) :
:![[thin space (1/6-em)]](https://www.rsc.org/images/entities/char_2009.gif) 1.5
1.5![[thin space (1/6-em)]](https://www.rsc.org/images/entities/char_2009.gif) :
:![[thin space (1/6-em)]](https://www.rsc.org/images/entities/char_2009.gif) 0.5 nanocomposite, the XRD patterns of Mn2O3 NPs were relatively poor. The PXRD pattern of PA–FeCo-1
0.5 nanocomposite, the XRD patterns of Mn2O3 NPs were relatively poor. The PXRD pattern of PA–FeCo-1![[thin space (1/6-em)]](https://www.rsc.org/images/entities/char_2009.gif) :
:![[thin space (1/6-em)]](https://www.rsc.org/images/entities/char_2009.gif) 2
2![[thin space (1/6-em)]](https://www.rsc.org/images/entities/char_2009.gif) :
:![[thin space (1/6-em)]](https://www.rsc.org/images/entities/char_2009.gif) 2 consisted of Co2P4O12 (PDF#84-2208), revealing that PA–FeCo-1
2 consisted of Co2P4O12 (PDF#84-2208), revealing that PA–FeCo-1![[thin space (1/6-em)]](https://www.rsc.org/images/entities/char_2009.gif) :
:![[thin space (1/6-em)]](https://www.rsc.org/images/entities/char_2009.gif) 2
2![[thin space (1/6-em)]](https://www.rsc.org/images/entities/char_2009.gif) :
:![[thin space (1/6-em)]](https://www.rsc.org/images/entities/char_2009.gif) 2 had a Co2P4O12 structure, which confirmed the successful fabrication of samples.
2 had a Co2P4O12 structure, which confirmed the successful fabrication of samples.
![[thin space (1/6-em)]](https://www.rsc.org/images/entities/char_2009.gif) :
:![[thin space (1/6-em)]](https://www.rsc.org/images/entities/char_2009.gif) 2 had a morphology of cross-linked network structure aggregated by irregular nanoparticles, with a particle diameter of about 50 nm. PA–Co-1
2 had a morphology of cross-linked network structure aggregated by irregular nanoparticles, with a particle diameter of about 50 nm. PA–Co-1![[thin space (1/6-em)]](https://www.rsc.org/images/entities/char_2009.gif) :
:![[thin space (1/6-em)]](https://www.rsc.org/images/entities/char_2009.gif) 2 exhibited a stacked three-dimensional structure composed of irregular nanosheets and nanoparticles. Compared with single metal–PA aerogel, the PA–CoMn-1
2 exhibited a stacked three-dimensional structure composed of irregular nanosheets and nanoparticles. Compared with single metal–PA aerogel, the PA–CoMn-1![[thin space (1/6-em)]](https://www.rsc.org/images/entities/char_2009.gif) :
:![[thin space (1/6-em)]](https://www.rsc.org/images/entities/char_2009.gif) 1.5
1.5![[thin space (1/6-em)]](https://www.rsc.org/images/entities/char_2009.gif) :
:![[thin space (1/6-em)]](https://www.rsc.org/images/entities/char_2009.gif) 0.5 aerogel displayed a more tightly cross-linked porous structure, with irregular bore diameter (Fig. 2c and d). Moreover, the energy-dispersive spectroscopy (EDS) elemental mapping images and spectrum of PA–CoMn-1
0.5 aerogel displayed a more tightly cross-linked porous structure, with irregular bore diameter (Fig. 2c and d). Moreover, the energy-dispersive spectroscopy (EDS) elemental mapping images and spectrum of PA–CoMn-1![[thin space (1/6-em)]](https://www.rsc.org/images/entities/char_2009.gif) :
:![[thin space (1/6-em)]](https://www.rsc.org/images/entities/char_2009.gif) 1.5
1.5![[thin space (1/6-em)]](https://www.rsc.org/images/entities/char_2009.gif) :
:![[thin space (1/6-em)]](https://www.rsc.org/images/entities/char_2009.gif) 0.5 demonstrated that Co, Mn, P, O and C elements were all present (Fig. 3a–g). This confirmed that PA–CoMn-1
0.5 demonstrated that Co, Mn, P, O and C elements were all present (Fig. 3a–g). This confirmed that PA–CoMn-1![[thin space (1/6-em)]](https://www.rsc.org/images/entities/char_2009.gif) :
:![[thin space (1/6-em)]](https://www.rsc.org/images/entities/char_2009.gif) 1.5
1.5![[thin space (1/6-em)]](https://www.rsc.org/images/entities/char_2009.gif) :
:![[thin space (1/6-em)]](https://www.rsc.org/images/entities/char_2009.gif) 0.5 was successfully prepared by high temperature carbonization. Moreover, TEM images of PA–CoMn-1
0.5 was successfully prepared by high temperature carbonization. Moreover, TEM images of PA–CoMn-1![[thin space (1/6-em)]](https://www.rsc.org/images/entities/char_2009.gif) :
:![[thin space (1/6-em)]](https://www.rsc.org/images/entities/char_2009.gif) 1.5
1.5![[thin space (1/6-em)]](https://www.rsc.org/images/entities/char_2009.gif) :
:![[thin space (1/6-em)]](https://www.rsc.org/images/entities/char_2009.gif) 0.5 (Fig. 4a–c) aerogel and mapping images (Co, Mn, P, O and C) (g–i) are shown in Fig. S1(g–i).† The calculated lattice distance d = 0.325 nm is also correlated with the plane (111) in PA–CoMn-1
0.5 (Fig. 4a–c) aerogel and mapping images (Co, Mn, P, O and C) (g–i) are shown in Fig. S1(g–i).† The calculated lattice distance d = 0.325 nm is also correlated with the plane (111) in PA–CoMn-1![[thin space (1/6-em)]](https://www.rsc.org/images/entities/char_2009.gif) :
:![[thin space (1/6-em)]](https://www.rsc.org/images/entities/char_2009.gif) 1.5
1.5![[thin space (1/6-em)]](https://www.rsc.org/images/entities/char_2009.gif) :
:![[thin space (1/6-em)]](https://www.rsc.org/images/entities/char_2009.gif) 0.5 and matched with the XRD data.
0.5 and matched with the XRD data.

![[thin space (1/6-em)]](https://www.rsc.org/images/entities/char_2009.gif) :
:![[thin space (1/6-em)]](https://www.rsc.org/images/entities/char_2009.gif) 1.5
1.5![[thin space (1/6-em)]](https://www.rsc.org/images/entities/char_2009.gif) :
:![[thin space (1/6-em)]](https://www.rsc.org/images/entities/char_2009.gif) 0.5 aerogel.
0.5 aerogel.![[thin space (1/6-em)]](https://www.rsc.org/images/entities/char_2009.gif) :
:![[thin space (1/6-em)]](https://www.rsc.org/images/entities/char_2009.gif) x
x![[thin space (1/6-em)]](https://www.rsc.org/images/entities/char_2009.gif) :
:![[thin space (1/6-em)]](https://www.rsc.org/images/entities/char_2009.gif) 2 − x (x = 0, 0.5, 1 and 1.5) aerogel (Fig. 5). Four bands appeared at 610 and 530 cm−1 which can be attributed to the asymmetric stretching and bending mode of vibrations of Mn–O.32 The absorptions of PA–CoMn-1
2 − x (x = 0, 0.5, 1 and 1.5) aerogel (Fig. 5). Four bands appeared at 610 and 530 cm−1 which can be attributed to the asymmetric stretching and bending mode of vibrations of Mn–O.32 The absorptions of PA–CoMn-1![[thin space (1/6-em)]](https://www.rsc.org/images/entities/char_2009.gif) :
:![[thin space (1/6-em)]](https://www.rsc.org/images/entities/char_2009.gif) x
x![[thin space (1/6-em)]](https://www.rsc.org/images/entities/char_2009.gif) :
:![[thin space (1/6-em)]](https://www.rsc.org/images/entities/char_2009.gif) 2 − x (x = 0, 0.5, 1 and 1.5) aerogel at 1510 and 1070 cm−1 are attributed to the stretching vibrations of P
2 − x (x = 0, 0.5, 1 and 1.5) aerogel at 1510 and 1070 cm−1 are attributed to the stretching vibrations of P![[double bond, length as m-dash]](https://www.rsc.org/images/entities/char_e001.gif) O and P–O–C, respectively. It indicates that high temperature carbonization destroyed most of the P
O and P–O–C, respectively. It indicates that high temperature carbonization destroyed most of the P![[double bond, length as m-dash]](https://www.rsc.org/images/entities/char_e001.gif) O groups, which may be the cause of particle agglomeration.
O groups, which may be the cause of particle agglomeration.
![[thin space (1/6-em)]](https://www.rsc.org/images/entities/char_2009.gif) :
:![[thin space (1/6-em)]](https://www.rsc.org/images/entities/char_2009.gif) 1.5
1.5![[thin space (1/6-em)]](https://www.rsc.org/images/entities/char_2009.gif) :
:![[thin space (1/6-em)]](https://www.rsc.org/images/entities/char_2009.gif) 0.5 aerogel. The obtained survey spectrum displayed in Fig. 6 confirmed the presence of Mn, Co, P, C & O elements. As shown in Fig. 7a, the C 1s high-resolution peak revealed that two types of carbon bond arise at binding energies of 284.48 and 286.42 eV for C–C and C–O bonds, respectively. The metal phosphide bond was confirmed with the high-resolution XPS peak of P 2p shown in Fig. 7b; a peak at 132.9 eV represents the existence of the Mn–P bond and Co–P, and another peak observed at 133.90 eV for the surface oxidation of metal phosphide. Fig. 7c displays the 2p1/2 orbital of Mn at the binding energies of 653.46 eV and 655.14 eV, followed by the 2p3/2 orbital of Mn at the binding energies of 641.71 eV and 643.83 eV, confirming the presence of Mn in both +2 and +3 oxidation states, respectively. The high-resolution XPS of Co 2p (Fig. 7d) exhibited main peaks at 781.01 eV and 796.64 eV attributed to Co 2p3/2 and Co 2p1/2 of Co in +2 state. Moreover, the two satellite peaks of Co-atom are observed at binding energies of 786.33 eV and 802.91 eV. As obtained in P 2p, the peaks confirm that PA effectively interacts with the MnCo through its affinity with the metal.
0.5 aerogel. The obtained survey spectrum displayed in Fig. 6 confirmed the presence of Mn, Co, P, C & O elements. As shown in Fig. 7a, the C 1s high-resolution peak revealed that two types of carbon bond arise at binding energies of 284.48 and 286.42 eV for C–C and C–O bonds, respectively. The metal phosphide bond was confirmed with the high-resolution XPS peak of P 2p shown in Fig. 7b; a peak at 132.9 eV represents the existence of the Mn–P bond and Co–P, and another peak observed at 133.90 eV for the surface oxidation of metal phosphide. Fig. 7c displays the 2p1/2 orbital of Mn at the binding energies of 653.46 eV and 655.14 eV, followed by the 2p3/2 orbital of Mn at the binding energies of 641.71 eV and 643.83 eV, confirming the presence of Mn in both +2 and +3 oxidation states, respectively. The high-resolution XPS of Co 2p (Fig. 7d) exhibited main peaks at 781.01 eV and 796.64 eV attributed to Co 2p3/2 and Co 2p1/2 of Co in +2 state. Moreover, the two satellite peaks of Co-atom are observed at binding energies of 786.33 eV and 802.91 eV. As obtained in P 2p, the peaks confirm that PA effectively interacts with the MnCo through its affinity with the metal.

![[thin space (1/6-em)]](https://www.rsc.org/images/entities/char_2009.gif) :
:![[thin space (1/6-em)]](https://www.rsc.org/images/entities/char_2009.gif) x
x![[thin space (1/6-em)]](https://www.rsc.org/images/entities/char_2009.gif) :
:![[thin space (1/6-em)]](https://www.rsc.org/images/entities/char_2009.gif) 2 − x (x = 0.5, 1 and 1.5) aerogel/SPCE sensors was analyzed using cyclic voltammetry(CV). The sensor orderly was investigated in the presence of 0.1 M KCl and 5 mM [Fe (CN)6]3−/4− redox probe electrolyte. The CV electrocatalytic performances of PA–CoMn-1
2 − x (x = 0.5, 1 and 1.5) aerogel/SPCE sensors was analyzed using cyclic voltammetry(CV). The sensor orderly was investigated in the presence of 0.1 M KCl and 5 mM [Fe (CN)6]3−/4− redox probe electrolyte. The CV electrocatalytic performances of PA–CoMn-1![[thin space (1/6-em)]](https://www.rsc.org/images/entities/char_2009.gif) :
:![[thin space (1/6-em)]](https://www.rsc.org/images/entities/char_2009.gif) x
x![[thin space (1/6-em)]](https://www.rsc.org/images/entities/char_2009.gif) :
:![[thin space (1/6-em)]](https://www.rsc.org/images/entities/char_2009.gif) 2 − x (x = 0.5, 1 and 1.5) aerogel/SPCE sensor can be seen in Fig. 8a, which shows the electron charge conductivity of varied modified electrodes. From Fig. 8a, the PA–CoMn-1
2 − x (x = 0.5, 1 and 1.5) aerogel/SPCE sensor can be seen in Fig. 8a, which shows the electron charge conductivity of varied modified electrodes. From Fig. 8a, the PA–CoMn-1![[thin space (1/6-em)]](https://www.rsc.org/images/entities/char_2009.gif) :
:![[thin space (1/6-em)]](https://www.rsc.org/images/entities/char_2009.gif) 1.5
1.5![[thin space (1/6-em)]](https://www.rsc.org/images/entities/char_2009.gif) :
:![[thin space (1/6-em)]](https://www.rsc.org/images/entities/char_2009.gif) 0.5 aerogel/SPCE(black) exhibited electrocatalytic activity in the presence of a 5 mM [Fe(CN)6]3−/4− redox probe. Therefore, the modified electrodes resulted in high electron charge and rapid electron transfer between the electrode and the electrolyte. Furthermore, the electron transport capacity of modified electrodes was further evaluated by EIS as shown in Fig. 8b. The Nyquist plot was obtained with an open circuit potential of 0.20 V. The charge transfer resistance (Rct) calculated from the diameter of the semicircle, notably the smaller semicircle exhibited by the PA–CoMn-1
0.5 aerogel/SPCE(black) exhibited electrocatalytic activity in the presence of a 5 mM [Fe(CN)6]3−/4− redox probe. Therefore, the modified electrodes resulted in high electron charge and rapid electron transfer between the electrode and the electrolyte. Furthermore, the electron transport capacity of modified electrodes was further evaluated by EIS as shown in Fig. 8b. The Nyquist plot was obtained with an open circuit potential of 0.20 V. The charge transfer resistance (Rct) calculated from the diameter of the semicircle, notably the smaller semicircle exhibited by the PA–CoMn-1![[thin space (1/6-em)]](https://www.rsc.org/images/entities/char_2009.gif) :
:![[thin space (1/6-em)]](https://www.rsc.org/images/entities/char_2009.gif) 1.5
1.5![[thin space (1/6-em)]](https://www.rsc.org/images/entities/char_2009.gif) :
:![[thin space (1/6-em)]](https://www.rsc.org/images/entities/char_2009.gif) 0.5 aerogel/SPCE shows a higher rate of electron transfer in electrochemical performance. This may be ascribed to the fact that Co–P bonds were generated and increased the electron carrier mobility.
0.5 aerogel/SPCE shows a higher rate of electron transfer in electrochemical performance. This may be ascribed to the fact that Co–P bonds were generated and increased the electron carrier mobility.

![[thin space (1/6-em)]](https://www.rsc.org/images/entities/char_2009.gif) :
:![[thin space (1/6-em)]](https://www.rsc.org/images/entities/char_2009.gif) 0.5
0.5![[thin space (1/6-em)]](https://www.rsc.org/images/entities/char_2009.gif) :
:![[thin space (1/6-em)]](https://www.rsc.org/images/entities/char_2009.gif) 1.5 (red), PA–CoMn-1
1.5 (red), PA–CoMn-1![[thin space (1/6-em)]](https://www.rsc.org/images/entities/char_2009.gif) :
:![[thin space (1/6-em)]](https://www.rsc.org/images/entities/char_2009.gif) 1
1![[thin space (1/6-em)]](https://www.rsc.org/images/entities/char_2009.gif) :
:![[thin space (1/6-em)]](https://www.rsc.org/images/entities/char_2009.gif) 1.5 (blue) and PA–CoMn-1
1.5 (blue) and PA–CoMn-1![[thin space (1/6-em)]](https://www.rsc.org/images/entities/char_2009.gif) :
:![[thin space (1/6-em)]](https://www.rsc.org/images/entities/char_2009.gif) 1.5
1.5![[thin space (1/6-em)]](https://www.rsc.org/images/entities/char_2009.gif) :
:![[thin space (1/6-em)]](https://www.rsc.org/images/entities/char_2009.gif) 0.5 (black) aerogel/SPCE and EIS (b).
0.5 (black) aerogel/SPCE and EIS (b).![[thin space (1/6-em)]](https://www.rsc.org/images/entities/char_2009.gif) :
:![[thin space (1/6-em)]](https://www.rsc.org/images/entities/char_2009.gif) 1.5
1.5![[thin space (1/6-em)]](https://www.rsc.org/images/entities/char_2009.gif) :
:![[thin space (1/6-em)]](https://www.rsc.org/images/entities/char_2009.gif) 0.5 aerogel/SPCE has the highest catalytic activity in the electrochemical redox performance of 4-AP than the PA–CoMn-1
0.5 aerogel/SPCE has the highest catalytic activity in the electrochemical redox performance of 4-AP than the PA–CoMn-1![[thin space (1/6-em)]](https://www.rsc.org/images/entities/char_2009.gif) :
:![[thin space (1/6-em)]](https://www.rsc.org/images/entities/char_2009.gif) 1
1![[thin space (1/6-em)]](https://www.rsc.org/images/entities/char_2009.gif) :
:![[thin space (1/6-em)]](https://www.rsc.org/images/entities/char_2009.gif) 1 and PA–CoMn-1
1 and PA–CoMn-1![[thin space (1/6-em)]](https://www.rsc.org/images/entities/char_2009.gif) :
:![[thin space (1/6-em)]](https://www.rsc.org/images/entities/char_2009.gif) 0.5
0.5![[thin space (1/6-em)]](https://www.rsc.org/images/entities/char_2009.gif) :
:![[thin space (1/6-em)]](https://www.rsc.org/images/entities/char_2009.gif) 1.5 aerogels.
1.5 aerogels.![[thin space (1/6-em)]](https://www.rsc.org/images/entities/char_2009.gif) :
:![[thin space (1/6-em)]](https://www.rsc.org/images/entities/char_2009.gif) 1.5
1.5![[thin space (1/6-em)]](https://www.rsc.org/images/entities/char_2009.gif) :
:![[thin space (1/6-em)]](https://www.rsc.org/images/entities/char_2009.gif) 0.5 aerogel/SPCE was a surface controlled process.
0.5 aerogel/SPCE was a surface controlled process.
![[thin space (1/6-em)]](https://www.rsc.org/images/entities/char_2009.gif) :
:![[thin space (1/6-em)]](https://www.rsc.org/images/entities/char_2009.gif) 1.5
1.5![[thin space (1/6-em)]](https://www.rsc.org/images/entities/char_2009.gif) :
:![[thin space (1/6-em)]](https://www.rsc.org/images/entities/char_2009.gif) 0.5 aerogel/SPCE and was recorded by varying the concentrations of 4-AP in 0.1 M PBS (pH 7.5) at a scan rate of 100 mV s− 1. Fig. 12a shows the response of DPV curve for the oxidation of 4-AP with different initial concentrations with optimal condition. Here at lower concentration, a sharp oxidation peak potential was obtained at 0.39 V. It can be witnessed that the oxidation peak current linearly increases with increase in the 4-AP concentration from 1 μM to 0.1 mM. Besides, a linear plot of reduction current versus the concentration of 4-AP displayed two linear relationships in the range of 1 μM to 0.1 mM (Fig. 12b). The corresponding linear equation with correlation coefficient was expressed as I (μA) = 0.098 + 0.07C4-AP, R2 = 0.9956. Further, the lowest limit of detection (LOD) was calculated from the lowest concentration using the following eqn (1).
0.5 aerogel/SPCE and was recorded by varying the concentrations of 4-AP in 0.1 M PBS (pH 7.5) at a scan rate of 100 mV s− 1. Fig. 12a shows the response of DPV curve for the oxidation of 4-AP with different initial concentrations with optimal condition. Here at lower concentration, a sharp oxidation peak potential was obtained at 0.39 V. It can be witnessed that the oxidation peak current linearly increases with increase in the 4-AP concentration from 1 μM to 0.1 mM. Besides, a linear plot of reduction current versus the concentration of 4-AP displayed two linear relationships in the range of 1 μM to 0.1 mM (Fig. 12b). The corresponding linear equation with correlation coefficient was expressed as I (μA) = 0.098 + 0.07C4-AP, R2 = 0.9956. Further, the lowest limit of detection (LOD) was calculated from the lowest concentration using the following eqn (1).
![[thin space (1/6-em)]](https://www.rsc.org/images/entities/char_2009.gif) :
:![[thin space (1/6-em)]](https://www.rsc.org/images/entities/char_2009.gif) 1.5
1.5![[thin space (1/6-em)]](https://www.rsc.org/images/entities/char_2009.gif) :
:![[thin space (1/6-em)]](https://www.rsc.org/images/entities/char_2009.gif) 0.5 aerogel/SPCE in 0.1 M pH 7.5 solution by successive addition of 4-AP (1 μM to 0.1 mM). (b) Linear plot of current response vs. 4-AP.
0.5 aerogel/SPCE in 0.1 M pH 7.5 solution by successive addition of 4-AP (1 μM to 0.1 mM). (b) Linear plot of current response vs. 4-AP.![[thin space (1/6-em)]](https://www.rsc.org/images/entities/char_2009.gif) :
:![[thin space (1/6-em)]](https://www.rsc.org/images/entities/char_2009.gif) x
x![[thin space (1/6-em)]](https://www.rsc.org/images/entities/char_2009.gif) :
:![[thin space (1/6-em)]](https://www.rsc.org/images/entities/char_2009.gif) 2 − x (x = 0, 0.5, 1 and 1.5)/SPCE
2 − x (x = 0, 0.5, 1 and 1.5)/SPCE![[thin space (1/6-em)]](https://www.rsc.org/images/entities/b_char_2009.gif) :
:![[thin space (1/6-em)]](https://www.rsc.org/images/entities/b_char_2009.gif) 1.5
1.5![[thin space (1/6-em)]](https://www.rsc.org/images/entities/b_char_2009.gif) :
:![[thin space (1/6-em)]](https://www.rsc.org/images/entities/b_char_2009.gif) 0.5 aerogel/SPCE modified SPCE. To investigate the anti-interference capability of PA–CoMn-1
0.5 aerogel/SPCE modified SPCE. To investigate the anti-interference capability of PA–CoMn-1![[thin space (1/6-em)]](https://www.rsc.org/images/entities/char_2009.gif) :
:![[thin space (1/6-em)]](https://www.rsc.org/images/entities/char_2009.gif) 1.5
1.5![[thin space (1/6-em)]](https://www.rsc.org/images/entities/char_2009.gif) :
:![[thin space (1/6-em)]](https://www.rsc.org/images/entities/char_2009.gif) 0.5 aerogel/SPCE, the corresponding graphical bar diagram is shown in Fig. 13. The graph shows the effect of 10-fold concentrations of ZnCl2, CuCl2, Co(NO3)2·6H2O, NiCl2·6H2O, urea and glucose on the electrochemical response of 50 μM 4-AP. There is no considerable change in the electrochemical peak current of 4-AP and the influence of interference species on 4-AP detection is less than 5%. Therefore, the proposed PA–CoMn-1
0.5 aerogel/SPCE, the corresponding graphical bar diagram is shown in Fig. 13. The graph shows the effect of 10-fold concentrations of ZnCl2, CuCl2, Co(NO3)2·6H2O, NiCl2·6H2O, urea and glucose on the electrochemical response of 50 μM 4-AP. There is no considerable change in the electrochemical peak current of 4-AP and the influence of interference species on 4-AP detection is less than 5%. Therefore, the proposed PA–CoMn-1![[thin space (1/6-em)]](https://www.rsc.org/images/entities/char_2009.gif) :
:![[thin space (1/6-em)]](https://www.rsc.org/images/entities/char_2009.gif) 1.5
1.5![[thin space (1/6-em)]](https://www.rsc.org/images/entities/char_2009.gif) :
:![[thin space (1/6-em)]](https://www.rsc.org/images/entities/char_2009.gif) 0.5 aerogel/SPCE shows good selectivity towards 4-AP sensor in (pH 7.5) PBS. The storage stability of the proposed sensor was determined using the same electrode for different number of days, which also showed peculiar results with limited change in the current.
0.5 aerogel/SPCE shows good selectivity towards 4-AP sensor in (pH 7.5) PBS. The storage stability of the proposed sensor was determined using the same electrode for different number of days, which also showed peculiar results with limited change in the current.
![[thin space (1/6-em)]](https://www.rsc.org/images/entities/char_2009.gif) :
:![[thin space (1/6-em)]](https://www.rsc.org/images/entities/char_2009.gif) 1.5
1.5![[thin space (1/6-em)]](https://www.rsc.org/images/entities/char_2009.gif) :
:![[thin space (1/6-em)]](https://www.rsc.org/images/entities/char_2009.gif) 0.5 aerogel/SPCE was investigated using DPV performance with the addition of 0, 5, 10, and 20 μM of 4-AP to 0.1 M PBS solution. In general, the standard addition method was used to detect the 4-AP in the real drug sample. The data obtained are collectively exhibited in Table 2.
0.5 aerogel/SPCE was investigated using DPV performance with the addition of 0, 5, 10, and 20 μM of 4-AP to 0.1 M PBS solution. In general, the standard addition method was used to detect the 4-AP in the real drug sample. The data obtained are collectively exhibited in Table 2.
![[thin space (1/6-em)]](https://www.rsc.org/images/entities/char_2009.gif) :
:![[thin space (1/6-em)]](https://www.rsc.org/images/entities/char_2009.gif) x
x![[thin space (1/6-em)]](https://www.rsc.org/images/entities/char_2009.gif) :
:![[thin space (1/6-em)]](https://www.rsc.org/images/entities/char_2009.gif) 2 − x (x = 0, 0.5, 1 and 1.5) aerogel was successfully prepared and applied in 4-AP sensing in real drug samples with excellent accuracy and applicability, demonstrating its practical precision and superb serviceability. Furthermore, the PA–CoMn-1
2 − x (x = 0, 0.5, 1 and 1.5) aerogel was successfully prepared and applied in 4-AP sensing in real drug samples with excellent accuracy and applicability, demonstrating its practical precision and superb serviceability. Furthermore, the PA–CoMn-1![[thin space (1/6-em)]](https://www.rsc.org/images/entities/char_2009.gif) :
:![[thin space (1/6-em)]](https://www.rsc.org/images/entities/char_2009.gif) x
x![[thin space (1/6-em)]](https://www.rsc.org/images/entities/char_2009.gif) :
:![[thin space (1/6-em)]](https://www.rsc.org/images/entities/char_2009.gif) 2 − x (x = 0, 0.5, 1 and 1.5) aerogel/SPCE exhibited satisfactory selectivity and stability, providing a great potential platform for the construction of 4-AP sensor in varied practical samples and complicated environments.
2 − x (x = 0, 0.5, 1 and 1.5) aerogel/SPCE exhibited satisfactory selectivity and stability, providing a great potential platform for the construction of 4-AP sensor in varied practical samples and complicated environments.


