 Open Access Article
Creative Commons Attribution 3.0 Unported Licence
Confinement induced change of microemulsion phase structure in controlled pore glass (CPG) monoliths†
Margarethe Dahl a,
Cedric J. Gommes
 b,
René Haverkamp
 c,
Kathleen Wood
 d,
Sylvain Prévost
 e,
Pierre Schröer
 a,
Tomáš Omastaa,
Tim Julian Stank
 c,
Thomas Hellweg
 c and
Stefan Wellert
 *a
*a
aDepartment of Chemistry, Technische Universität Berlin, Straße des 17. Juni 124, 10623 Berlin, Germany. E-mail: s.wellert@tu-berlin.de
bDepartment of Chemical Engineering, University of Liège B6 A, 3 Allée du 6 Août, B-4000 Liège, Belgium
cDepartment of Physical and Biophysical Chemistry, University of Bielefeld, Universitätsstraße 25, 33615 Bielefeld, Germany
dAustralian Nuclear and Technology Organisation, New Illawarra Rd, Lucas Heights, NSW 2234, Australia
eInstitut Laue-Langevin, 71 Avenue des Martyrs, F-38042 Grenoble, France
First published on 4th September 2024
Abstract
We use small-angle neutron scattering (SANS) to investigate the structure and phase behavior of a complex fluid within meso- and macroporous matrices. Specifically, bicontinuous microemulsions of the temperature-dependent ternary system C10E4–water–n-octane are investigated in controlled pore glass (CPG) membranes with nominal pore diameters of 10 nm, 20 nm, 50 nm, and 100 nm. The scattering data were analyzed using the Teubner–Strey model and a multiphase generalization of clipped Gaussian-field models. The analysis indicates changes in the phase structure of the bicontinuous microemulsion in the membranes with the smallest pores. This is attributed to a shift in the ternary phase diagram toward a three-phase structure at lower surfactant concentrations. This effect is likely related to a larger internal surface area in the membranes with smaller pores, which enhances surfactant adsorption onto the pore walls.
1 Introduction
Investigations in the field of soft matter in confinement are very interdisciplinary in nature.1,2 Typical length scales of soft matter are in the range of nanometers and micrometers, and relevant thermal energies of the order of a few kBT. Forcing soft matter into geometric confinement can reduce its degrees of freedom, influence its phase behavior and structure, or induce changes in molecular interactions. Such systems include colloidal dispersions, polymer solutions or nanoscopically structured complex fluids inside pores or channels.1–3The confinement may be static, such as porous solid materials, channels, or membranes, or dynamic, such as a crowded environment or time-variant gradients in an external field.4 Static confinement effects depend on several material properties of the confining matrix, like the pore size, shape, and surface area, as well as the chemical composition of the pore walls, which affects the interaction between the solid surface and the confined soft matter.5,6 Confinement effects in solid porous materials include the hindered formation of ice, vapor condensation, etc.7,8 Confined liquids such as binary mixtures of simple liquids can deviate strongly from their behavior in bulk, including the absence of the macroscopic phase separation, shift, and shrinkage of the miscibility window.6 These effects can be accompanied by preferential wetting of one of the two phases, a suppression or slowing down of macroscopic separation, and a reduction of critical fluctuations inside the pores. Different from these binary mixtures exhibiting a miscibility gap are microemulsions, which are thermodynamically stable mixtures of oil and water in the presence of surfactant molecules. Here, the solid confinement and its extremely large internal surface area might affect the phase behavior and structural properties of the confined microemulsion due to interactions of these complex fluids with the solid interface.9–13
Microemulsions are thermodynamically stable colloidal systems spontaneously formed by water, oil, and an amphiphile. Their unique properties are desirable for a wide range of applications,14 including pharmaceutics,15 cosmetics,16 enhanced oil recovery (EOR),17,18 decontamination19,20 and remediation.21 In addition to its fundamental interest, the understanding of the behavior of microemulsions in porous materials is central for most applications. The microemulsion utilized in this study is a ternary system based on a non-ionic surfactant belonging to the alkyl oligoethylene oxide (CiEj) class. These systems have been extensively studied22–25 and they provide a valuable platform for studying fundamental aspects of phase behavior in confinement. The composition of the microemulsion and temperature in this study were selected to be in the center of the bicontinuous single-phase region. The water and oil domains are separated by a surfactant monolayer, which forms a sponge-like pattern. Droplet microemulsions were already explored inside cylindrical pores and reported deformation of these droplets when the pore size was smaller than the droplet.26 Several studies on the near-surface structure of bicontinuous microemulsions with a planar confining surface reported the existence of surface-induced lamellar ordering.9–13 Recently, we discovered that the temperature-dependent behavior of the microemulsion is suppressed in small pores.27
This study focuses on controlled pore glasses (CPG) as model porous materials. These are disordered sponge-like silica structures with a narrow pore size distribution.6,28 Their structure has been studied by different methods, including electron microscopy and small angle scattering (SAS).29,30 SAS is a unique tool to elucidate the nanometer-scale structure of soft matter inside a porous material,31–34 but it relies on suitable scattering data analysis methods. Traditional approaches include Cahn's decomposition model35 extended by Teubner and Strey (TS),36 which describe well the main feature of the scattering signal but are unable to describe the signal over the complete q-range. Other approaches are based on multi-phase generalizations of clipped Gaussian random field models,37,38 which enables one to reconstruct the microemulsion nanometer-scale structure inside the mesopores.39
To our knowledge, this complex fluid inside a disordered porous material has not been studied by small-angle neutron scattering (SANS). This study compares two distinct methodologies for analyzing the intricate SANS signal. The first approach is a conventional fitting method, and the second is modeling the invariant Q and applying plurigaussian fitting. Furthermore, the influence of the surface polarity and the pore size of the confining matrix is investigated. Such insights are crucial for advancing our understanding of confined soft matter systems and improving the design of novel materials for applications based on bicontinuous microemulsions.
2 Experimental
2.1 Materials
Water was purified using a Milli-Q system (Millipore), reaching a final resistance of 18 MΩ. Tetraethylene glycol monodecyl ether (C10E4) (>95%) was purchased from Bachem. n-Octane, dichlorodimethylsilane (DCDMS), and anhydrous toluene (99.8%) were purchased from Sigma-Aldrich. Sulfuric acid (95%) and aqueous solution of hydrogen peroxide (30%, stabilized) were purchased from VWR Chemicals. Deuterium oxide (D2O, 99.9%) was purchased from Deutero. Chemicals were used as received.Monolithic CPG membranes with dimensions 10 × 10 × 1.2 mm (L × W × H) were purchased from Boraglas GmbH. Pore diameter (dP,Hg), pore volume (VP), and porosity (ε = VP/V) were determined by Hg intrusion measurements from the supplier and can be found in the Table 2. The pore size distribution can be found in the ESI Fig. S1.† The CPGs were cleaned according to the following procedure. First, they were cleaned in Milli-Q water using an ultrasonic bath and dried under a nitrogen stream. Then the CPGs were immersed in a Piranha solution (v/v = 1![[thin space (1/6-em)]](https://www.rsc.org/images/entities/char_2009.gif) :
:![[thin space (1/6-em)]](https://www.rsc.org/images/entities/char_2009.gif) 1; H2SO4, H2O2aq.) for 20 min. To remove the Piranha solution from hard-to-reach pores, the CPGs were first thoroughly rinsed with water and placed in an ultrasonic bath for 15 min. Afterward, the CPGs were dried overnight in a vacuum furnace at 40 °C.
1; H2SO4, H2O2aq.) for 20 min. To remove the Piranha solution from hard-to-reach pores, the CPGs were first thoroughly rinsed with water and placed in an ultrasonic bath for 15 min. Afterward, the CPGs were dried overnight in a vacuum furnace at 40 °C.
2.2 Surface modification of CPG membranes
The surface polarity was altered following a modified procedure of Bosley and Clayton.40 25 mL Anhydrous toluene per CPG membrane was transferred into a glass reactor, purged with nitrogen for 30 min, and stirred at 300 rpm. Afterward, 7 mL DCDMS was added to the toluene and stirred for 5 min at 600 rpm. The cleaned and dried CPG membranes were placed separately in a PTFE tube. Then 25 mL of this solution was added to each PTFE tube and placed on an orbital shaker for 1 h at room temperature. The CPG membranes were subsequently washed twice with toluene, acetone, and Milli-Q water using an ultrasonic bath for 10 min and dried in a vacuum furnace at 40 °C.2.3 Methods
and a surfactant concentration of 12.84 wt% obtained from
To ensure that the samples are bicontinuous and monophasic, the microemulsion samples were stored in a thermostated cabinet at T = 22 °C prior to all measurements.
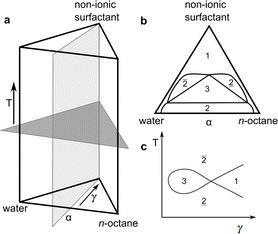 | ||
| Fig. 1 (a) Schematic representation of the three-dimensional phase prism formed by the ternary system C10E4–water–n-octane and temperature T in the vertical direction as tuning parameter for the curvature of the amphiphilic interface between water and oil. (b) With constant temperature, a two-dimensional horizontal cut through the prism is achieved, forming a ternary phase diagram. It shows the existence of single-, two-, and three-phase regions. (c) In the case of a fixed oil-to-water ratio α = 0.5, the phase prism is cut in the vertical direction, forming the well-known two-dimensional fish-type diagram. For further details on the phase behavior, see.22,23,41 | ||
![[thin space (1/6-em)]](https://www.rsc.org/images/entities/char_2009.gif) c of an aqueous C10E4 solution. For surfactant concentrations above the critical micellar concentration (cmc), the supernatant was diluted with water until the surface tension σ was higher than σcmc.
c of an aqueous C10E4 solution. For surfactant concentrations above the critical micellar concentration (cmc), the supernatant was diluted with water until the surface tension σ was higher than σcmc.The S-shaped isotherms are described by the equation by Gu and Zhu44 and can be found in the ESI in Fig. S2.†
 | (1) |
 , where θ is the scattering angle and λ is the neutron wavelength.
The Quokka instrument was used with three different configurations. The wavelength (λ) and sample-to-detector distance (lSD) were set to λ = 6 Å, lSD = 1.35 m (high q), λ = 6 Å, lSD = 8 m (mid q), λ = 8.1 Å with a lens focusing optics, lSD = 20 m (low q). With these configurations a q-range of 5 × 10⁻⁴ to 0.6 Å−1 was covered. At the D22 instrument a single configuration with a λ = 6 Å and two separate detectors at the distance of lSD = 17.6 m and lSD = 1.4 m with an angle of 20° was used which leads to a covered q-range of 2.6 × 10⁻³ to 0.64 Å−1.
The bicontinuous microemulsion was measured inside Hellma QS cells (path length of 1 mm). The CPG membranes were placed between two quartz windows in a sandwich cell for solids. A Viton spacer with a thickness of 1.4 mm was used as a sealing, which resulted in a path length of 1.2 mm. The required amount of microemulsion was adjusted according to the porosity and added to the CPG membrane before closing the sandwich cell with screws. All measurements were performed at 22 °C.
The data reduction at the D22 was performed using the Grasp v10.17 software, normalizing with monitor, subtracting the contribution from the empty cell, taking into account noise from the measurement with a sintered10B4C piece at the sample position, and using for transmission the intensity from the attenuated direct beam. At the Quokka instrument, the data reduction was performed using macros written in IGOR.47 The data were analyzed using Python and Matlab.
3 Scattering data analysis
The differential scattering cross-section dΣ/dΩ(q) per unit volume of the material is the Fourier transform of the scattering-length density correlation function. In the case of an isotropic structure, this takes the form
 | (2) |
| Cρ(r) = 〈ρ(x)ρ(x + r)〉 − 〈ρ〉2 | (3) |
 | (4) |
3.1 Scattering by two-phase structures
The expressions for the scattering of two-phase structures are well-known.48,49 For the purpose of later generalizing them to three-phase structures, it is useful to present them in a way that is mathematically more formal than their usual discussion.In a two-phase structure, comprising phases A and B with scattering-length densities ρA and ρB, the position-dependent scattering-length can be expressed as
 | (5) |
 is the indicator function of phase X, which is equal to 1 if point x is inside phase X and to 0 otherwise. Here X can be either A or B. Note that for a two-phase structure
  .
.
In terms of its indicator function, the volume fraction of any phase X is defined as
 | (6) |
 | (7) |
 | (8) |
In the case of two-phase A/B systems, the correlation function in eqn (7) is identical for phases A and B, namely
| CA(r) = CB(r) = ϕAϕBΓ(r) | (9) |
| Cρ(r) = [ρA − ρB]2CA(r). | (10) |
| Q = (2π)3[ρA − ρB]2ϕAϕB | (11) |
 | (12) |
For any phase X, the following identity holds
 | (13) |
 | (14) |
 | (15) |
 | (16) |
 | (17) |
The function in eqn (15) exhibits a scattering peak for ξ > d/(2π). In this case, d can be interpreted as the spacing between neighboring domains, and ξ is the correlation length that controls the sharpness of the scattering peak. The larger ξ, the more ordered the structure is.
For our present purpose, a Gaussian field can be conveniently thought of as a superposition of a larger number of waves, namely
 | (18) |
 ensures that the variance is equal to 1.
The field is comprehensively characterized by its spectral density fW(q), which in real space is mathematically equivalent to its correlation function
| gW(r) = 〈W(x)W(x + r)〉 | (19) |
 | (20) |
Clipping the Gaussian field at the value α boils down to defining the indicator function of phase X as
 | (21) |
 | (22) |
 | (23) |
3.2 Scattering by three-phase systems
Unlike the systems considered so far, confined microemulsions comprise three phases: the solid phase of the porous glass and the two confined liquids. To analyze the scattering by this type of system, we define the three indicator functions ,
,  and
and  , corresponding to the solid, the n-octane and the water, respectively. The space-dependent scattering-length density of the scattering system is now modeled as follows
 | (24) |
The scattering-length correlation function is obtained from the general definition in eqn (3), expressed in terms of the six possible self- and cross-correlation functions between three phases. In practice, only three out of these six correlation functions are independent, and the result can be expressed as follows in terms of the self-correlation functions alone39,59
| Cρ(r) = (ρS − ρO)(ρS − ρW)CS(r) + (ρO − ρS)(ρO − ρW)CO(r) + (ρW − ρO)(ρW − ρS)CW(r) | (25) |
Evaluating the correlation function Cρ(r) in eqn (25) for r = 0 provides the following general relation for the integrated scattering intensity of a three-phase system39
| Q = (2π)3{[ρS − ρO]2ϕSϕO + [ρS − ρW]2ϕSϕW + [ρO − ρW]2ϕOϕW}. | (26) |
![[W with combining macron]](https://www.rsc.org/images/entities/char_0057_0304.gif) . They are defined as if they are extended infinitely as in the microemulsion in bulk, and they should not be confused with actual confined phases O and W. The relation between the indicator functions of O/W and Ō/
. They are defined as if they are extended infinitely as in the microemulsion in bulk, and they should not be confused with actual confined phases O and W. The relation between the indicator functions of O/W and Ō/![[W with combining macron]](https://www.rsc.org/images/entities/char_0057_0304.gif) is
is
 | (27) |
 is the indicator function of the pores. It acts as a mathematical cookie-cutter and restricts the microemulsion structure to the pore space (see Fig. 3).
In eqn (27), the solid and microemulsion structures are assumed to be independent of one another so that the products can be factored out when evaluating averages. In particular, the volume fractions are
ϕO/W = (1 − ϕS)ϕŌ/![[W with combining macron]](https://www.rsc.org/images/entities/char_0057_0304.gif)
| (28) |
![[W with combining macron]](https://www.rsc.org/images/entities/char_0057_0304.gif) are the volume fractions of the unrestricted phases, which can also be thought of as the volume fractions within the pores.
are the volume fractions of the unrestricted phases, which can also be thought of as the volume fractions within the pores.
Before evaluating the correlation functions CO(r) and CW(r), it is useful to recall that Ō and ![[W with combining macron]](https://www.rsc.org/images/entities/char_0057_0304.gif) make up a two-phase system. Consequently, their correlation functions are equal, in line with eqn (9). We here refer to it as the correlation function of the microemulsion
make up a two-phase system. Consequently, their correlation functions are equal, in line with eqn (9). We here refer to it as the correlation function of the microemulsion
CME(r) = CŌ(r) = C![[W with combining macron]](https://www.rsc.org/images/entities/char_0057_0304.gif) (r). (r).
| (29) |
CO/W(r) = (1 − ϕS)2CME(r) + ϕ2Ō/![[W with combining macron]](https://www.rsc.org/images/entities/char_0057_0304.gif) CS(r) + CS(r)CME(r) CS(r) + CS(r)CME(r)
| (30) |
In practice, it is more instructive to make additional assumptions and to consider the two cases where the characteristic length of the solid is either much larger (dP ≫ dTS) or much smaller than that of the microemulsion (dP ≪ dTS). In the former large-pore approximation, the product of correlation functions in eqn (30) can be approximated as
| CS(r)CME(r) ≃ ϕS(1 − ϕS)CME(r) | (31) |
| Cρ(r) = [ρS − ρME]2CS(r) + (1 − ϕS)[ρO − ρW]2CME(r) | (32) |
ρME = ϕŌρO + ϕ![[W with combining macron]](https://www.rsc.org/images/entities/char_0057_0304.gif) ρW ρW
| (33) |
CS(r)CME(r) ≃ ϕŌϕ![[S with combining macron]](https://www.rsc.org/images/entities/char_0053_0304.gif) CS(r) CS(r)
| (34) |
Cρ(r) = [(1 − ϕS)(ρO − ρW)]2CME(r) + {ϕŌ[ρS − ρO]2 + ϕ![[W with combining macron]](https://www.rsc.org/images/entities/char_0057_0304.gif) [ρS − ρW]2}CS(r) [ρS − ρW]2}CS(r)
| (35) |
The total scattered intensities in the two regimes are obtained from eqn (4). The results are
Q(large pore) = (2π)3{[ρS − ρME]2ϕS(1 − ϕS) + (1 − ϕS)[ρO − ρW]2ϕŌϕ![[W with combining macron]](https://www.rsc.org/images/entities/char_0057_0304.gif) } }
| (36) |
Q(small pore) = (2π)3{[(1 − ϕS)(ρO − ρW)]2ϕŌϕ![[W with combining macron]](https://www.rsc.org/images/entities/char_0057_0304.gif) + (ϕŌ[ρS − ρO]2 + ϕ + (ϕŌ[ρS − ρO]2 + ϕ![[W with combining macron]](https://www.rsc.org/images/entities/char_0057_0304.gif) [ρS − ρW]2)ϕS(1 − ϕS)} [ρS − ρW]2)ϕS(1 − ϕS)}
| (37) |
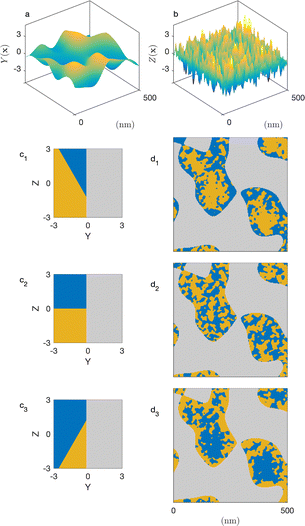
In a so-called plurigaussian approach,38,39,58 two independent Gaussian fields are considered, say Y(x) and Z(x) (see Fig. 4a and b). Structural correlations are introduced through the clipping procedure, by which the real-valued fields are converted to binary all-or-nothing phases. We use here the same criteria as developed in earlier work,39 which are illustrated in the flag-like sketches in Fig. 4c1–c3. These flags represent the specific phase assigned to any point x, as a function of the local values of GRF Y(x) and Z(x).
In all cases, the solid structure is modeled as a standard clipped GRF, namely as the points of space where Y(x) > α, independently of the value of Z(x). This is shown in grey in Fig. 4c1–c3. The particular case of the cookie-cutter model corresponds to Fig. 4c2. In that case, the points in the pore space are assigned to the water or oil phase based on the values of Z(x), independently of Y(x).
Spatial correlations between the pore-filling liquids and the solid are introduced through oblique boundaries in the model's flag. The case of Fig. 4c1 corresponds to a hydrophilic situation, where the pore region close to the surface is enriched in water. The inverse hydrophobic situation is shown in Fig. 4c3.
Compared to the cookie-cutter, the plurigaussian model has only one additional parameter, corresponding to the angle β between the water/oil and water/solid boundaries in the flag. The correlations turn from hydrophilic to hydrophobic when β increase from 0 to π. For any value of β, the position of the water/oil interface in the flag space is adjusted to match the volume fractions ϕŌ and ϕ![[W with combining macron]](https://www.rsc.org/images/entities/char_0057_0304.gif) . All equations of the plurigaussian model necessary to calculate the volume fractions and the correlation functions are provided in Appendix A of our earlier paper.39
. All equations of the plurigaussian model necessary to calculate the volume fractions and the correlation functions are provided in Appendix A of our earlier paper.39
4 Results and discussion
4.1 Bicontinuous microemulsion
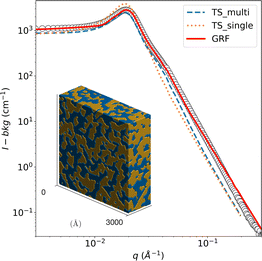
First, the known phase behavior from the literature was reproduced with the chemicals used. Good agreement was reached, and no further investigation of the bulk phase behavior was necessary. Fig. 5 shows the background-corrected small angle scattering intensity I(q) of a bicontinuous bulk sample at 22 °C. This SANS signal of the bicontinuous microemulsion in bulk shows the typical broad correlation peak, as shown in Fig. 5. The bicontinuous structure can be described with the Teubner–Strey (TS) model (eqn (15)).36The TS fit describes the broad correlation peak quite well but tends to fail in the high q-region. This is caused by a rougher oil–water interface and molecular protrusion.61 The bicontinuous microemulsion has a strong scattering signal, often resulting in multiple scattering events.42,62–64 This was considered in the analysis by using the semi-analytical convolution method described by Jensen and Barker65 and initially developed by Schelten and Schmatz.66 The correlation peak is flattened, and a shoulder appears at q ≈ 2qmax due to the multiple scattering; these features are clearly visible in the SANS signal of the bicontinuous microemulsion. The results of the TS fit can be found in Table 1; they are in good agreement with data in the literature.42
![[W with combining macron]](https://www.rsc.org/images/entities/char_0057_0304.gif) = 0.5, and for empty porous glasses. The errors associated with dTS and ξTS result from averaging over the hydrophilic and hydrophobic CPGs
= 0.5, and for empty porous glasses. The errors associated with dTS and ξTS result from averaging over the hydrophilic and hydrophobic CPGs
| Sample | dTS (nm) | ξTS (nm) | dGRF (nm) | ξGRF (nm) |
|---|---|---|---|---|
| a Corrected for multiple scattering. | ||||
| ME | 31.6 ± 1.5 | 15.2 ± 3.2 | 29.4 | 9.9 |
| 32.7 ± 3.3a | 22.2 ± 1.5a | |||
| CPG-10 | 34.3 ± 0.1 | 18.4 ± 0.1 | 33.6 | 16.9 |
| CPG-20 | 35.9 ± 3.7 | 26.2 ± 4.8 | 38.9 | 20.4 |
| CPG-50 | 124.3 ± 3.9 | 51.5. ± 1.5 | 120.8 | 59.7 |
| CPG-100 | 240.6 ± 8.1 | 126.5 ± 4.1 | 244.5 | 115.6 |
The SANS data of the microemulsion was also fitted with the clipped Gaussian Random Field (GRF) model, and the parameters are reported in Table 1. A three-dimensional realization of the model, exhibiting a bicontinuous structure, is displayed in the inset of Fig. 5 where the blue and yellow regions represent the octane and water domains, respectively.
4.2 CPG membranes
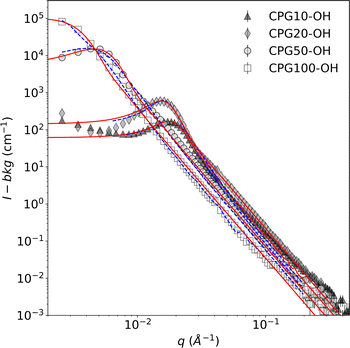
The disordered meso- and macroporous structure of the CPGs is qualitatively similar to the bicontinuous structure of the microemulsion. Hence, the TS fit was used to describe their SANS signal. The most prominent feature in the SANS curves is a broad correlation peak, as reported earlier.29 Fig. 6 summarizes the SANS data of the hydrophilic CPGs. The position of the peak is shifting to lower q with increasing pore diameter. The TS and GRF fits lead to a plateau in the low q region, which is not the case for the SANS signal of CPG10 and CPG20. This could result from an incomplete leaching process in the production of the CPG, as reported by Kim et al.67 Nonetheless, the position and broadness of the peak are well described by both fits.The SANS signal of the air-filled hydrophilic and hydrophobic CPG are shown in the ESI Fig S3.† The alteration of the surface polarity did not affect the overall shape of the SANS signal, indicating that the pore structure and size remained unchanged. Consequently, the average inter-domain distance obtained from applying the TS fit dTS is listed in Table 1. The pore diameter dP can be determined from the fits by multiplying dTS with the porosity (ε). The determined values are in good agreement with the pore diameter obtained from Hg-intrusion measurement dHg, as listed in Table 2.
| CPG | dHg (nm) | VP (mL g−1) | ε | AS(m2 g−1) | dP (nm) |
|---|---|---|---|---|---|
| 10 | 7.00 | 0.11 | 0.20 | 90.9 | 6.9 ± 0.1 |
| 20 | 16.2 | 0.21 | 0.31 | 60.8 | 11.3 ± 1.2 |
| 50 | 69.7 | 0.28 | 0.38 | 34.2 | 46.9 ± 1.5 |
| 100 | 131 | 0.36 | 0.44 | 21.1 | 106.8 ± 3.6 |
Application of the GRF fit to the SANS data of the CPG allows for the reconstruction of the disordered porous matrix, as shown in Fig. 7. The pore wall material and the empty pore volume are depicted in dark grey and white, respectively.
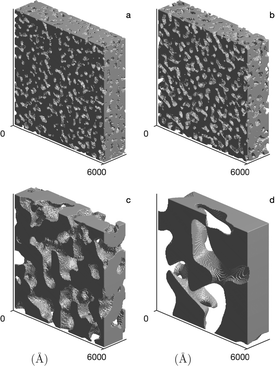 | ||
| Fig. 7 The reconstructed nanostructure of the CPG, (a–d) for CPG10, CPG20, CPG50 and CPG100, respectively. The reconstructions correspond to the GRF model of the SANS signal of the D2O-filled hydrophilic CPG shown in Fig. 6. | ||
4.3 Confined microemulsions
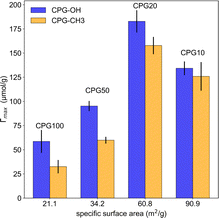
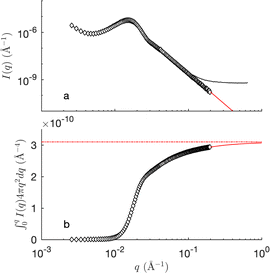
Fig. 8 shows the SANS of the CPGs filled with the microemulsion (ME). For comparison, the scattering of the bulk (unconfined) microemulsion is plotted on the same graphs (dashed blue), as well as that of the empty CPGs rescaled for the effective contrast between the silica and the average microemulsion. For the largest pores, the contributions of the solid and ME can be qualitatively identified (see Fig. 8d). For the smaller pores, however, the correlation peaks of the CPG and ME are almost at the same q-position, making it difficult to discriminate them (Fig. 8a).The invariant is determined experimentally following eqn (4), by integrating the SANS intensity.30,68 The procedure is illustrated in Fig. 9, and involves subtracting first a background contribution followed by an extrapolation using q−4 Porod's law. The so-obtained values of Q for the air- and D2O-filled CPGs are plotted systematically against the solid volume fraction in the ESI Fig. S4.† Comparison with the classical two-phase result in eqn (11) reveals an average relative error of 15%. This value is used hereafter as a confidence interval for Q. Deviations might result from adsorbed H2O on the silica walls, influencing the contrast. In the case of the large-pore samples CPG50 and CPG100, the SANS intensity might also be affected by neutron refraction.
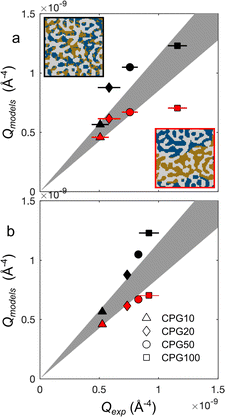
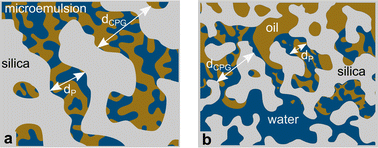
Fig. 10 plots the integrated intensities of the CPG-confined microemulsions, and compares them with two general models. In case the microemulsion in the pores would remain bicontinuous, the scattering signal would originate from pores filled with oil- and water domains, results in a three-phase system as depicted in the inset Fig. 10. In this case, the values of Q should be given by the general three-phase expression in eqn (26) as a function of the known volume fractions and scattering-length densities (black symbols in Fig. 10). Alternatively, we also consider the extreme case of macroscopic phase separation of the microemulsion as visualized in the bottom inset in Fig. 10. In that case, a significant fraction of the scattering by the confined microemulsion would occurs outside of the measured q range, and the detected scattering signal would originate from either a water-domain-filled pore or an oil-domain-filled pore. In this scenario the invariant Q would be expressed through eqn (37), and these values are plotted as red symbols in Fig. 10. In the same figure, the gray area is the ±15% confidence interval.
For the hydrophilic CPG100, it is clear that modeling the bicontinuous structure leads to good agreement. However, the modeled values for smaller pores exceed the experimentally determined values and fall outside the confidence interval. For CPG10, Qmodels for both scenarios fall within the confidence interval. This might be caused by the small contribution of the microemulsion to the scattering signal. Since the porosity of this sample is only 20%, meaning that the scattering signal mainly arises from the porous solid. Additionally, the pore diameter (dP) is 7 nm, much smaller than the size of one oil or water domain of the microemulsion. If a bicontinuous structure is assumed, this would still lead to a scattering from either a water-filled or an oil-filled pore. So, it is difficult to distinguish the two scenarios for very small pores. For the tested hydrophilic samples, it can be concluded that a phase separation of the microemulsion is likely to occur if the dP is less than 45 nm. In the case of the macroporous CPG100, no phase alteration is indicated, and the microemulsion structure remains bicontinuous.
The case for the hydrophobic CPG-CH3 is not as clear compared to CPG-OH. The Qmodels-values for the confined microemulsion inside the hydrophobic pores are shown in Fig. 10b). For these samples, the bicontinuous structure results in values above the confidence interval, while the phase-separated case results in values below. This may suggest that for the confined microemulsion, both scenarios are partially accurate, and a portion of the microemulsion remains bicontinuous while the other portion is phase-separated. This might be caused by the difference in the adsorption of the surfactant onto the CPG surfaces. Neutron reflectometry experiments might shed light on the near-surface structure of the microemulsions. This was done previously with bicontinuous microemulsions based on sugar surfactants.12,13 Only slight differences in the near-surface structure close to hydrophilic and hydrophobic surfaces were observed. These surfactants are known to adsorb barely on silica in contrast to the used surfactant in this work.69
These results show that the structure of the confined microemulsion is influenced by the pore diameter as well as the composition of the pore walls. The latter indicates a difference in the interactions of the microemulsion with a hydrophilic and a hydrophobic surface.
The red lines in Fig. 8 are calculated based on phase separation. Because phase separation is equivalent to assuming that the oil/water domains are much larger than that of the CPG, its scattering can be modelled using the small-pore approximation introduced in eqn (35). Furthermore, if the separation is macroscopic, oil/water structure contributes only to the forward scattering and the first term in eqn (35) can be ignored. The scattering is then proportional to that of the CPG. The so-calculated scattering – assuming the GRF model for the CPGs – captures reasonably the SANS of CPG10 and CPG20. Upwards deviation are observed at small q, which hints at the fact that phase separation is not quite macroscopic. In the case of the CPGs with largest pores, the differences between the calculated and experimental scattering, rule out phase separation.
The scattering of the ME in the CPG with the largest pore can be captured with the large-pore approximation model introduced in eqn (32). This results in additive contributions of the solid and microemulsion to the scattering, and the so-calculated patterns are plotted as black lines in Fig. 8. The agreement of these calculations with the SANS of the small-pore CPGs seems to be reasonable, but this is a coincidence resulting from the fact that characteristic sizes of the ME and CPGs are similar. In reality, the very assumption of the large-pore approximation do not apply to CPG20. In the case of CPG100, the two steps in the SANS are accounted for by the model, but the agreement is mostly qualitative at small q.
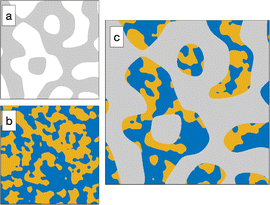
The two models presented in Fig. 8 are not fitted to the data, as they are not based on any adjusted parameter. Moreover, they are both based on the general cookie-cutting construction of Fig. 3, which cannot account for solid/microemulsion correlations. We now consider a more sophisticated plurigaussian model to fit the SANS of the microemulsion in macroporous CPG100 as illustrated in Fig. 11. For the fits, the characteristics of the CPGs are kept constant, but the parameters of the confined microemulsion ξ and d are adjusted as well as the angle β, characterizing the correlation between the solid and microemulsion structures (see Fig. 4). This latter parameter can also be thought of as an average contact angle between the water/oil and water/solid phases, and the fitted value is β ≃ 48°. The plurigaussian fits reveal that water is enriched at the pore walls while n-octane accumulates in the center of the pore, as depicted in Fig. 11b1 and b2. The fits and the corresponding reconstruction of the confined microemulsion inside the hydrophilic and hydrophobic pores are very similar. This counter-intuitive situation might be caused by surfactant adsorption on the pore walls, allowing water enrichment even at the hydrophobic pore walls.
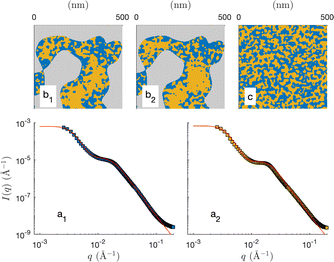 | ||
| Fig. 11 Plurigaussian fits of the confined microemulsions in CPG100, with OH- (a1) or CH3-coated (a2) surfaces. The dots are the data (same as Fig. 8d), and the solid lines are the plurigaussian fits. Two-dimensional realizations of the models with the fitted parameters are shown in b1 and b2. A two-dimensional realization of the unconfined microemulsion is shown in c for comparison. | ||
The surface area from the porous samples used in our experiments can be determined by multiplication of the specific surface area AS from Table 2 with the weight of the used CPGs. This surface area varies from 15 m2 for CPG10 to 3.6 m2 for CPG100. Considering an area per surfactant molecule of 54 Å2,42 3 × 10¹⁹ molecules for CPG10 and 7 × 10¹⁸ for CPG100 would be required to fully cover the entire surface of the porous solid. As the volume of the used microemulsion contains a few 1018 to 1019 surfactant molecules, the microemulsion would cease to exist, leaving only phase-separated oil and water. This ratio of internal surface area to surfactant molecules in this work is much higher than in performed neutron reflectometry experiments,10,13 which makes a comparison more difficult. The reported lamellar ordering10 was not observed in the presented SANS data.
Since we clearly observe contributions of bicontinuous structure at least from the confined microemulsion in CPG100, we can rule out that all of the surfactant of the microemulsion is adsorbed at the pore walls. More likely, a fraction of surfactant molecules will adsorb at the pore walls and shift the composition mainly towards lower values of γ without significant changes in the oil-to-water ratio. At least for CPG10 and CPG20, a minor shift of qmax towards lower values was observed. Such a shift towards lower γ is accompanied by an increase of dTS. If one takes into account that reducing γ by 0.5% leads to a change of the inter-domain distance ΔdTS of 1 nm, then a reduction of γ by 7% can be estimated from the shift in qmax in Fig. 8. At constant temperature, the single-phase bicontinuous structure of the microemulsion changes towards a three-phasic structure with a bicontinuous middle phase inside the porous material of CPG20 and CPG10. For a sufficiently large volume, some pores are filled with a bicontinuous phase while others are filled with pure bulk phases, creating the impression of partial phase separation. Since all experiments were performed at a constant temperature, a possible shift of the phase boundaries due to the confinement reported for binary systems33 was not observed.
These considerations lead to the hypothesis that the geometric pore size (dP) is not the decisive parameter but the inner surface area available for surfactant adsorption in the material. This size is determined by the pore diameter and the porosity ε. However, this effect differs from the influence of the pore size on the critical fluctuations in binary mixtures as soon as the characteristic length in the fluctuating system is comparable with the pore size.
5 Conclusion
This work investigates the behavior of a bicontinuous microemulsion confined in a porous material compared to other liquid systems like binary mixtures. SANS experiments revealed that confinement effects depend on the pore diameter, the porosity of the confining matrix, and its surface composition.Two potential scenarios were considered as extreme cases: first, where the confined microemulsion remains bicontinuous, and second, where the oil and water domains are separated. Structure-independent modeling based on the scattering invariant Q suggests that in hydrophilic pores the microemulsion is more likely to remain bicontinuous in larger pores, while smaller pores favor phase separation. In hydrophobic pores, both scenarios may be partially true. The deviation of the confined microemulsion inside the hydrophilic and hydrophobic pores shows that the interaction with the surface depends on its polarity. For the confined microemulsion inside the largest pores (CPG100), the results of the plurigaussian fits indicate that for both surface polarities, there is an enrichment of water at the pore walls and n-octane in the pore center.
It can be reasonably concluded that the most probable scenario is the adsorption of surfactant molecules at the pore walls, which would result in a shift in the microemulsion composition. This leads to a shift in the fish-type phase diagram towards lower surfactant concentrations and towards the three-phase region at constant temperature. That could be indistinguishable from a partial phase separation.
Neutron reflectometry experiments on both surfaces are necessary for a deeper understanding. Self-diffusion NMR and neutron spin echo experiments can further investigate the phase behavior of the microemulsion inside the pores. The observed behavior is relevant to all systems containing a bicontinuous microemulsion or a disordered porous material, especially for applications in soil remediation or enhanced oil recovery.
Data availability
Proposal number of the SANS measurements at the ILL, Grenoble, is 9-10-1736 (10.5291/ILL-DATA. 9-10-1736). Proposal number of the SANS measurements at ANSTO, Sydney, is 16582.Author contributions
The manuscript was written by MD, CG, and SW. MD, RH, TO, TJS, and SW performed the SANS experiments. SP and KW are the instrument responsibles for D22 and Quokka, respectively. The TS fits were performed by MD. The three-phase models were developed and fitted by CG. Data were evaluated and discussed by MD, CG, TH, and SW. PS performed the determination of the BET surface area. The surfactant adsorption was investigated by MD.Conflicts of interest
There are no conflicts to declare.Acknowledgements
The authors thank the Deutsche Forschungs Gesellschaft (DFG) for financial support (project number 455432427). CG is grateful to the F. R. S.-FNRS (Belgium) for a research associate position, and for supporting his contribution to this work through grant P.D.R. T.0100.22. Furthermore, we thank the Institut Laue-Langevin (ILL, Grenoble, France) and the Australian Nuclear and Technology Organisation (ANSTO, Sydney, Australia) for the allocation of beamtime through proposal numbers 9-10-1736 and 16582, respectively. We thank Julian Fischer for the fruitful discussion about the effects of multiple scattering and Dr Henrich Frielinghaus (Forschungszentrum Jülich) for the impact of neutron refraction.Notes and references
- K. Binder, J. Horbach, R. Vink and A. de Virgiliis, Soft Matter, 2008, 4, 1555–1568 RSC.
- P. Huber, J. Phys.: Condens. Matter, 2015, 27, 103102 CrossRef PubMed.
- S. Perkin and J. Klein, Soft Matter, 2013, 9, 10438 RSC.
- N. A. M. Araújo, L. M. C. Janssen, T. Barois, G. Boffetta, I. Cohen, A. Corbetta, O. Dauchot, M. Dijkstra, W. M. Durham, A. Dussutour, S. Garnier, H. Gelderblom, R. Golestanian, L. Isa, G. H. Koenderink, H. Löwen, R. Metzler, M. Polin, C. P. Royall, A. Šarić, A. Sengupta, C. Sykes, V. Trianni, I. Tuval, N. Vogel, J. M. Yeomans, I. Zuriguel, A. Marin and G. Volpe, Soft Matter, 2023, 19, 1695–1704 RSC.
- I. Grosse and K. Estel, Colloid Polym. Sci., 2000, 278, 1000–1006 CrossRef CAS.
- Y. B. Melnichenko, Small-angle Scattering from Confined and Interfacial Fluids, Springer, 2016 Search PubMed.
- D. Liu, Y. Zhang, C.-C. Chen, C.-Y. Mou, P. H. Poole and S.-H. Chen, Proc. Natl. Acad. Sci. U. S. A., 2007, 104, 9570–9574 CrossRef CAS.
- H.-J. Butt, K. Graf and M. Kappl, Physics and Chemistry of Interfaces, Wiley-VCH, 2003 Search PubMed.
- X.-L. Zhou, L.-T. Lee, S.-H. Chen and R. Strey, Phys. Rev. A: At., Mol., Opt. Phys., 1992, 46, 6479 CrossRef CAS PubMed.
- M. Kerscher, P. Busch, S. Mattauch, H. Frielinghaus, D. Richter, M. Belushkin and G. Gompper, Phys. Rev. E: Stat., Nonlinear, Soft Matter Phys., 2011, 83, 030401 CrossRef CAS PubMed.
- M. Berghaus, M. Paulus, P. Salmen, S. Al-Ayoubi, M. Tolan and R. Winter, J. Phys. Chem. B, 2016, 120, 7148–7153 CrossRef CAS PubMed.
- S. Vargas-Ruiz, O. Soltwedel, S. Micciulla, R. Sreij, A. Feoktystov, R. von Klitzing, T. Hellweg and S. Wellert, Langmuir, 2016, 32, 11928–11938 CrossRef CAS PubMed.
- S. Wellert, R. Stehle, S. Micciulla, M. Dahl, R. Steitz, T. Hellweg and O. Holderer, Front. Soft Matter, 2022, 2, 887610 CrossRef.
- M. Gradzielski, M. Duvail, P. M. de Molina, M. Simon, Y. Talmon and T. Zemb, Chem. Rev., 2021, 121, 5671–5740 CrossRef CAS PubMed.
- B. Nikolaev, L. Yakovleva, V. Fedorov, H. Li, H. Gao and M. Shevtsov, Pharmaceutics, 2023, 15, 1989–2028 CrossRef CAS PubMed.
- P. Boonme, J. Cosmet. Dermatol., 2007, 6, 223–228 CrossRef PubMed.
- J.-L. Salager, A. M. Forgiarini and J. Bullón, J. Surfactants Deterg., 2013, 16, 449–472 CrossRef CAS.
- A. Mahboob, S. Kalam, M. S. Kamal, S. S. Hussain and T. Solling, J. Pet. Sci. Eng., 2022, 208, 109312 CrossRef CAS.
- P. B. Warey, New Research on Hazardous Materials, Nova Science Publishers, 2007 Search PubMed.
- S. Wellert, H. Imhof, M. Dolle, H.-J. Altmann, A. Richardt and T. Hellweg, Colloid Polym. Sci., 2008, 286, 417–426 CrossRef CAS.
- A. V. Dos Santos, G. Simonelli and L. C. L. Dos Santos, Environ. Sci. Pollut. Res., 2023, 30, 32168–32183 CrossRef CAS PubMed.
- M. Kahlweit and R. Strey, Angew Chem. Int. Ed. Engl., 1985, 24, 654–668 CrossRef.
- K. Shinoda and B. Lindman, Langmuir, 1987, 3, 135–149 CrossRef CAS.
- R. Strey, Colloid Polym. Sci., 1994, 272, 1005–1019 CrossRef CAS.
- S. Burauer, T. Sachert, T. Sottmann and R. Strey, Phys. Chem. Chem. Phys., 1999, 1, 4299–4306 RSC.
- A. Prause, A. Hörmann, V. Cristiglio, G. J. Smales, A. F. Thünemann, M. Gradzielski and G. H. Findenegg, Mol. Phys., 2021, 119, e1913255 CrossRef.
- R. Haverkamp, M. Dahl, T. J. Stank, J. Hübner, P. Strasser, S. Wellert and T. Hellweg, RSC Adv., 2024, 14, 12735–12741 RSC.
- F. Janowski and W. Heyer, and P. Gläser, VEB Deutscher verlag für Grundstoffindustrie, 1st edn, 1982 Search PubMed.
- P. Wiltzius, F. S. Bates, S. B. Dierker and G. D. Wignall, Phys. Rev. A: At., Mol., Opt. Phys., 1987, 36, 2991–2994 CrossRef CAS PubMed.
- P. Levitz, G. Ehret, S. K. Sinha and J. M. Drake, J. Chem. Phys., 1991, 95, 6151–6161 CrossRef CAS.
- M. Y. Lin, S. K. Sinha, J. M. Drake, X. Wu, P. Thiyagarajan and H. B. Stanley, Phys. Rev. Lett., 1994, 72, 2207–2210 CrossRef CAS.
- F. Formisano and J. Teixeira, J. Phys.: Condens. Matter, 2000, 12, A351–A356 CrossRef CAS.
- T. Hellweg, S. Schemmel, G. Rother, A. Brûlet, H. Eckerlebe and G. H. Findenegg, Eur. Phys. J. E: Soft Matter Biol. Phys., 2003, 12(Suppl 1), S1–S4 CAS.
- S. Schemmel, G. Rother, H. Eckerlebe and G. H. Findenegg, J. Chem. Phys., 2005, 122, 244718 CrossRef PubMed.
- J. W. Cahn, J. Chem. Phys., 1965, 42, 93–99 CrossRef CAS.
- M. Teubner and R. Strey, J. Chem. Phys., 1987, 87, 3195–3200 CrossRef CAS.
- C. J. Gommes, Microporous Mesoporous Mater., 2018, 257, 62–78 CrossRef CAS.
- C. J. Gommes and A. P. Roberts, Phys. Chem. Chem. Phys., 2018, 20, 13646–13659 RSC.
- C. J. Gommes, J. Appl. Crystallogr., 2013, 46, 493–504 CrossRef CAS.
- J. A. Bosley and J. C. Clayton, Biotechnol. Bioeng., 1994, 43, 934–938 CrossRef CAS PubMed.
- M. Kahlweit, R. Strey and G. Busse, Phys. Rev. E: Stat. Phys., Plasmas, Fluids, Relat. Interdiscip. Top., 1993, 47, 4197–4209 CrossRef CAS PubMed.
- T. Sottmann, R. Strey and S.-H. Chen, J. Chem. Phys., 1997, 106, 6483–6491 CrossRef CAS.
- D. Lugo, J. Oberdisse, M. Karg, R. Schweins and G. H. Findenegg, Soft Matter, 2009, 5, 2928 RSC.
- T. Gu and B.-Y. Zhu, Colloids Surf., 1990, 44, 81–87 CrossRef CAS.
- E. Metwalli, K. Götz, T. Zech, C. Bär, I. Schuldes, A. Martel, L. Porcar and T. Unruh, Appl. Sci., 2021, 11, 5925 CrossRef CAS.
- K. Wood, J. P. Mata, C. J. Garvey, C.-M. Wu, W. A. Hamilton, P. Abbeywick, D. Bartlett, F. Bartsch, P. Baxter, N. Booth, W. Brown, J. Christoforidis, D. Clowes, T. d'Adam, F. Darmann, M. Deura, S. Harrison, N. Hauser, G. Horton, D. Federici, F. Franceschini, P. Hanson, E. Imamovic, P. Imperia, M. Jones, S. Kennedy, S. Kim, T. Lam, W. T. Lee, M. Lesha, D. Mannicke, T. Noakes, S. R. Olsen, J. C. Osborn, D. Penny, M. Perry, S. A. Pullen, R. A. Robinson, J. C. Schulz, N. Xiong and E. P. Gilbert, J. Appl. Crystallogr., 2018, 51, 294–314 CrossRef CAS.
- S. R. Kline, J. Appl. Crystallogr., 2006, 39, 895–900 CrossRef CAS.
- D. S. Sivia, Elementary Scattering Theory, Oxford University Press, First published, edn., 2011 Search PubMed.
- O. Glatter, Scattering Methods and Their Application in Colloid and Interface Science, Elsevier, 2018 Search PubMed.
- P. Debye, H. R. Anderson and H. Brumberger, J. Appl. Phys., 1957, 28, 679–683 CrossRef CAS.
- S. Torquato, in Random Heterogeneous Materials, ed. S. S. Antman, L. Sirovich, J. E. Marsden, S. Wiggins and S. Torquato, Springer, New York, 2002, vol. 16, of Interdisciplinary Applied Mathematics, pp. 23–58 Search PubMed.
- M. J. Lighthill, Introduction to Fourier Analysis and Generalised Functions, Cambridge University Press, 1958 Search PubMed.
- N. F. Berk, Phys. Rev. A: At., Mol., Opt. Phys., 1991, 44, 5069–5079 CrossRef CAS PubMed.
- P. Levitz, Adv. Colloid Interface Sci., 1998, 76–77, 71–106 CrossRef CAS.
- C. J. Gommes and A. P. Roberts, Phys. Rev. E: Stat., Nonlinear, Soft Matter Phys., 2008, 77, 041409 CrossRef PubMed.
- M. Teubner, Europhys. Lett., 1991, 14, 403–408 CrossRef CAS.
- N. F. Berk, Phys. Rev. Lett., 1987, 58, 2718–2721 CrossRef CAS PubMed.
- C. Lantuéjoul, Geostatistical Simulation, Springer, 2002 Search PubMed.
- C. J. Gommes, R. Zorn, S. Jaksch, H. Frielinghaus and O. Holderer, J. Chem. Phys., 2021, 155, 024121 CrossRef CAS PubMed.
- C. J. Gommes, G. Prieto and P. E. de Jongh, J. Phys. Chem. C, 2016, 120, 1488–1506 CrossRef CAS.
- S. Prévost, M. Gradzielski and T. Zemb, Adv. Colloid Interface Sci., 2017, 247, 374–396 CrossRef PubMed.
- J. A. Silas and E. W. Kaler, J. Colloid Interface Sci., 2003, 257, 291–298 CrossRef CAS PubMed.
- S. Jaksch, V. Pipich and H. Frielinghaus, J. Appl. Crystallogr., 2021, 54, 1580–1593 CrossRef CAS PubMed.
- M. Laupheimer, T. Sottmann, R. Schweins and C. Stubenrauch, Soft Matter, 2014, 10, 8744–8757 RSC.
- G. V. Jensen and J. G. Barker, J. Appl. Crystallogr., 2018, 51, 1455–1466 CrossRef CAS PubMed.
- J. Schelten and W. Schmatz, J. Appl. Crystallogr., 1980, 13, 385–390 CrossRef CAS.
- M.-H. Kim and C. J. Glinka, Microporous Mesoporous Mater., 2006, 91, 305–311 CrossRef CAS.
- Neutrons, X-rays and light, 2002, http://www.loc.gov/catdir/enhancements/fy0613/2002068374-d.html, Lindner, Peter (Hrsg.).
- R. Zhang and P. Somasundaran, Adv. Colloid Interface Sci., 2006, 123–126, 213–229 CrossRef CAS PubMed.
Footnote |
| † Electronic supplementary information (ESI) available. See DOI: https://doi.org/10.1039/d4ra04090b |
| This journal is © The Royal Society of Chemistry 2024 |


