 Open Access Article
Characterization of Cl-doped two-dimensional (PEA)2PbBr4 perovskite single crystals for fast neutron and gamma ray detection†
Wei Xie,
Sha Gong,
Fuyun Hu and
Liping Peng *
*
Physics and Electronic Information College, Huanggang Normal University, Huanggang 438000, China. E-mail: pengliping@hgnu.edu.cn
First published on 27th August 2024
Abstract
In this paper, a high-quality Cl-doped two-dimensional halide perovskite (PEA)2Pb(Br0.95Cl0.05)4 crystal was prepared using a seed-induced volatile solvent method. On optimizing the Cl− doping concentration, we found that 5% Cl-doping results in (PEA)2PbBr4 with the highest optical and photon yield. Based on the Cl-doped (PEA)2PbBr4 single crystal, the response characterization of the (PEA)2Pb(Br0.95Cl0.05)4 crystal in the mixed field of neutrons and gamma rays (n/γ) has been verified. Using the time-of-flight method and the linear relationship between integral charge and neutron yield, it was proved that (PEA)2Pb(Br0.95Cl0.05)4 crystal can be used for n/γ screening. The time difference between the fast neutron released by a single nuclear reaction and the γ photon arriving at the detector was 130 ns, and the arrival time of the γ photon is earlier than that of the fast neutron. This work has a broad application prospect in the study of nuclear reaction kinetics, the monitoring of the neutron yield of fusion devices and the total energy released by nuclear reactions.
1. Introduction
Fast neutron detectors are not only widely used in military scientific research fields such as nuclear explosion monitoring, cosmic ray detection, reactor monitoring and particle physics research1 but also in production and life fields such as container security,2 large fossil specimen detection3 and proton therapy.4 It is a type of detection approach that is widely used and important at present.Currently, neutron detection is divided into injection measurement and energy measurement; the former is used to determine the number of passing neutrons per unit area, whereas the latter is used to determine the incident neutron energy. In principle, neutron detection can be divided into four types: nuclear reaction, nuclear recoil, nuclear fission and nuclear activation methods. The main objects of neutron detection are slow neutrons and fast neutrons. The most suitable fast neutron detection method is the nuclear recoil method, which not only retains the direction information of the incident neutron but also determines the energy of the incident neutron.5 When fast neutrons collide with the target nucleus, the smaller the mass number of the target nucleus, the higher the energy deposited in a single collision, and the elements with small mass number can easily form a high density material and improve the cross section of fast neutrons; therefore, the nuclear recoil method mostly uses materials rich in carbon, hydrogen and other light elements.
In terms of detection technology, fast neutron detectors, such as other types of ray detectors, can be divided into direct detection and indirect detection. In direct detection, semiconductor materials ionize and excite a large number of electrons and holes under the irradiation of high-energy rays. These carriers are collected by an electric field, and then electrical signals are generated to achieve direct detection of high-energy rays.6 In indirect detection, the scintillator material ionizes and excites a large number of electrons and holes under the irradiation of high-energy rays, and then emits visible or ultraviolet light after recombination. Visible or ultraviolet light is detected by photomultiplier tube (PMT) or silicon photomultiplier tube (SiPM) to generate amplified electrical signals and realize indirect detection of high-energy rays.7 Compared with direct detection, indirect detection has the advantages of fast response speed, mature technology and strong environmental adaptability. Therefore, it is the mainstream of current market applications. The scintillator materials used in indirect detection can be divided into two categories: inorganic and organic scintillators.
Owing to their excellent photoelectric properties, the emerging perovskite materials are popular in solar cells,8 light-emitting diodes,9 visible light detection10 and X/gamma-ray detection,.11,12 In recent years, perovskites have made remarkable achievements.13,14 However, there are few studies on the application of perovskite materials for fast neutron detection, partly because the main object of current research is three-dimensional perovskite materials, which cannot accommodate large-sized organic groups due to the limitation of tolerance factors and thus do not have a large enough fast neutron cross-section.15 In contrast, two-dimensional perovskites not only have a considerable fast neutron cross section due to the introduction of large organic cations but also their natural multi-quantum well structure provides strong quantum and dielectric limiting effects. Two-dimensional perovskites can have high light yield and short luminous lifetime,16,17 and these characteristics make two-dimensional perovskites very suitable for fast neutron detection. See ESI in Tables S1 and S2† that show the performance parameters of some hot inorganic semiconductor materials and organic semiconductor materials in gamma-ray detection and fast neutron detection. It can be seen that our two-dimensional material (PEA)2PbBr4 has obvious advantages for fast neutron detection.
Herein, the (PEA)2PbBr4 perovskite single crystal was doped with chlorine (Cl) ion (Cl−), and (PEA)2Pb(Br0.95Cl0.05)4 with optimized Cl− doping concentration (5%) was used as the object; its fast neutron detection capability was confirmed using a pulse amplitude spectrum test. In a mixed field containing both fast neutrons and gamma rays (n/γ), (PEA)2Pb(Br0.95Cl0.05)4 crystals can be used for n/γ screening using the time-of-flight method and the linear relationship between integral charge and neutron yield. They play an important role in the study of nuclear reaction kinetics, neutron yield and total energy released by a nuclear reaction.
2. Experimentation and characterization
2.1 Preparation of (PEA)2PbBr4 two-dimensional perovskite single-crystal
Based on the 2![[thin space (1/6-em)]](https://www.rsc.org/images/entities/char_2009.gif) :
:![[thin space (1/6-em)]](https://www.rsc.org/images/entities/char_2009.gif) 1 molar ratio of PEABr
1 molar ratio of PEABr![[thin space (1/6-em)]](https://www.rsc.org/images/entities/char_2009.gif) :
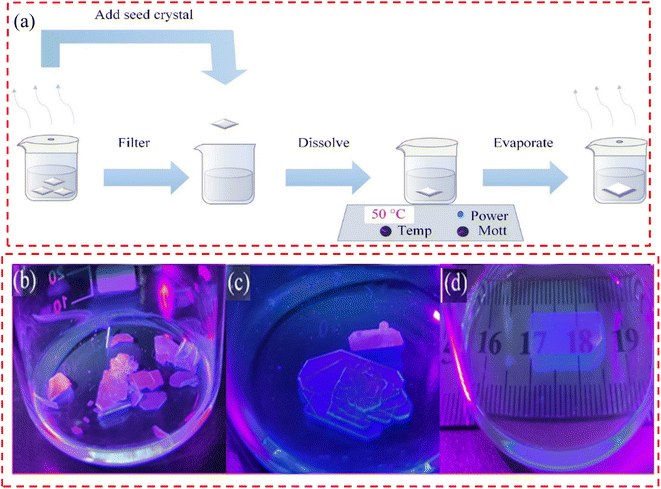
:![[thin space (1/6-em)]](https://www.rsc.org/images/entities/char_2009.gif) PbBr2, powders of 80.8 mg and 73.4 were weighed and dissolved in 1 ml of dimethylformamide (DMF), and the concentration of precursor solution was 1.14 M. Then, the solution was heated and stirred on a heating stirring table at 70 °C for more than 5 h to allow it to fully dissolve. A two-dimensional perovskite precursor solution with a concentration of 1.14 M was prepared for standby use, and a 0.22 μm filter was used before use. A 5 ml quantity of precursor liquid was added into a 25 ml small beaker using a pipette gun. The beaker was sealed with tin foil and the foil pieced with a needle to make 1 to 3 small holes. It was then placed in a quiet and dust-free place to grow the crystal, and millimeter-sized small crystals could be obtained after 1 week. The discrete and regular small crystals were taken as seed crystals, and the saturated solution obtained from the crystallization solution was added to a 50 ml clean small beaker. The foil was sealed and the beaker placed on a hot station at 50 °C. After the heating and dissolution process was completed, the beaker was transferred to a quiet and dust-free place, and a small hole was made using the needle of a 1 ml syringe. After volatilizing for a period of time, centimeter-level crystals were obtained. The flow chart of the entire single crystal growth process is shown in Fig. 1(a), and the actual image of a single crystal is shown in Fig. 1(b)–(d).
PbBr2, powders of 80.8 mg and 73.4 were weighed and dissolved in 1 ml of dimethylformamide (DMF), and the concentration of precursor solution was 1.14 M. Then, the solution was heated and stirred on a heating stirring table at 70 °C for more than 5 h to allow it to fully dissolve. A two-dimensional perovskite precursor solution with a concentration of 1.14 M was prepared for standby use, and a 0.22 μm filter was used before use. A 5 ml quantity of precursor liquid was added into a 25 ml small beaker using a pipette gun. The beaker was sealed with tin foil and the foil pieced with a needle to make 1 to 3 small holes. It was then placed in a quiet and dust-free place to grow the crystal, and millimeter-sized small crystals could be obtained after 1 week. The discrete and regular small crystals were taken as seed crystals, and the saturated solution obtained from the crystallization solution was added to a 50 ml clean small beaker. The foil was sealed and the beaker placed on a hot station at 50 °C. After the heating and dissolution process was completed, the beaker was transferred to a quiet and dust-free place, and a small hole was made using the needle of a 1 ml syringe. After volatilizing for a period of time, centimeter-level crystals were obtained. The flow chart of the entire single crystal growth process is shown in Fig. 1(a), and the actual image of a single crystal is shown in Fig. 1(b)–(d).
Fig. 1(b)–(d) show a comparison of the crystal growth results under different growth schemes. When seed induction is not used, a large number of crystals are precipitated and serious stacking occurs during subsequent growth (Fig. 1(b)). If the seed-induced but non-heated dissolution step is used, additional crystals grow superimposed with the added seed crystals, although the number of crystals in the final solution is significantly reduced (Fig. 1(c)). High-quality centimeter-sized (PEA)2PbBr4 crystals can be obtained stably only by seed induction and a heated dissolution step (Fig. 1(c)).
2.2 Preparation of Cl-doped (PEA)2PbBr4 two-dimensional perovskite single crystal
PEABr, PbBr2 and PbCl2 of different quantities were placed into a 50 ml small brown bottle with a molar ratio of 4![[thin space (1/6-em)]](https://www.rsc.org/images/entities/char_2009.gif) :
:![[thin space (1/6-em)]](https://www.rsc.org/images/entities/char_2009.gif) 1
1![[thin space (1/6-em)]](https://www.rsc.org/images/entities/char_2009.gif) :
:![[thin space (1/6-em)]](https://www.rsc.org/images/entities/char_2009.gif) 1, and 20 ml dimethyl sulfoxide (DMSO)
1, and 20 ml dimethyl sulfoxide (DMSO)![[thin space (1/6-em)]](https://www.rsc.org/images/entities/char_2009.gif) :
:![[thin space (1/6-em)]](https://www.rsc.org/images/entities/char_2009.gif) N,N-dimethylformamide (DMF) (1
N,N-dimethylformamide (DMF) (1![[thin space (1/6-em)]](https://www.rsc.org/images/entities/char_2009.gif) :
:![[thin space (1/6-em)]](https://www.rsc.org/images/entities/char_2009.gif) 1) was added. The solvent was mixed and the bottle placed on a hot table with a temperature of 90 °C and a rotating speed of 890 rpm to dissolve it. To fully dissolve the solution, a fully agitated magneton was added to the configured solution. A fully dissolved precursor solution was obtained after heating and dissolving overnight. A 22 μm nylon filter was used to obtain the precursor liquid required for crystal growth. The proportion of Cl− is Cl−/(Cl− + Br−). The liquid was then stored in a 25 ml beaker sealed with tin foil, placed in a quiet and dust-free place to grow the crystal, and millimeter-small seed crystals were obtained after one week. The seed crystals and the saturated solution obtained from the solution filtration was added into a 50 ml clean small beaker. The foil was sealed and placed on a hot station at 50 °C. After the dissolution process was over, the beaker was transferred to a quiet and dust-free place, and a small hole was pierced with the needle of a 1 ml syringe. After volatilizing for a period of time, centimeter-level crystals were obtained.
1) was added. The solvent was mixed and the bottle placed on a hot table with a temperature of 90 °C and a rotating speed of 890 rpm to dissolve it. To fully dissolve the solution, a fully agitated magneton was added to the configured solution. A fully dissolved precursor solution was obtained after heating and dissolving overnight. A 22 μm nylon filter was used to obtain the precursor liquid required for crystal growth. The proportion of Cl− is Cl−/(Cl− + Br−). The liquid was then stored in a 25 ml beaker sealed with tin foil, placed in a quiet and dust-free place to grow the crystal, and millimeter-small seed crystals were obtained after one week. The seed crystals and the saturated solution obtained from the solution filtration was added into a 50 ml clean small beaker. The foil was sealed and placed on a hot station at 50 °C. After the dissolution process was over, the beaker was transferred to a quiet and dust-free place, and a small hole was pierced with the needle of a 1 ml syringe. After volatilizing for a period of time, centimeter-level crystals were obtained.
A single crystal was prepared and the quality of the single crystal was evaluated by transmittance, X-ray diffraction (XRD) and swing curve test. For the assessed results of the single crystal, please see Fig. S1–S3.†
2.3 Characterization of Cl-doped (PEA)2PbBr4 two-dimensional perovskite single crystals
In this work, the absorption spectrum test instrument was SolidSpec-3700 UV-visible spectrophotometer produced by Shimadzu in Japan, and the PL test instrument was FLS-920 fluorescence spectrometer from Edinburgh, and the photoluminescence quantum yield (PLQY) test instrument was QuantaMaster 8000 from HORIBA, Canada.In perovskite materials, Cl− doping is often used to regulate the lattice structure of perovskite, reduce the density of defect states and change the energy band position.18,19 Therefore, this work firstly characterized and compared (PEA)2PbBr4 crystals with different contents of Cl− doping (this paper refers to the feed ratio) to examine the effect of Cl− doping on the scintillation properties of (PEA)2PbBr4 crystals and to identify the most suitable Cl− doping concentration.
Table 1 shows the relationship between the ingredient proportion of Cl− and the actual Cl− doping proportion in the X-ray photoelectron spectrometer. The actual doping ratio first increased with the increase of the ingredient proportion and was higher than the ingredient proportion when the ingredient proportion was low, indicating that Cl− was able to easily enter the lattice at this time. Subsequently, with the increase of the ingredient proportion, the actual doping concentration began to be lower than the ingredient proportion, indicating that the difficulty level for Cl− to enter the lattice began to increase, and the actual doping concentration at 10% feed ratio was lower than that at 7% ingredient proportion owing to the presence of (PEA)2PbCl4 phase separation in the precipitated crystal, which was confirmed by subsequent XRD.
| Ingredient proportion | Actual doping ratio |
|---|---|
| 0% | 0% |
| 1% | 1.82% |
| 3% | 3.21% |
| 5% | 4.50% |
| 7% | 4.71% |
| 10% | 4.32% |
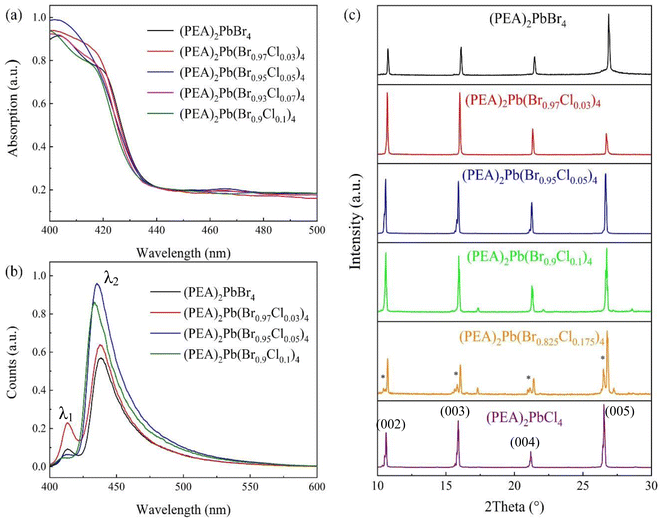
Fig. 2 show that the spectral and XRD results of different Cl− doping and doping concentrations were 0%, 3%, 5%, 10%, 17.5%, 100% respectively. Fig. 2(a) and (b) show the increase of Cl− doping concentration, the absorption edge and the fluorescence emission peak gradually shifting to blue owing to the increase of the band gap of (PEA)2PbBr4 by Cl− doping. Double peaks were observed in PL results, and with the reduction of Cl− content, the low-band broadband luminescence became more and more obvious. When Cl− is completely replaced by Br−, the (PEA)2PbBr4 crystal shows a narrow-band emission at 415 nm (λ1) in the high energy band and wide-band gap emission at 436 nm (λ2) in the low energy band, which is consistent with the research results in the literature.20 This is because with increase in the Cl− doping, lattice distortion occurs, resulting in the exciton–phonon coupling phenomenon. The interaction between excitons and phonons leads to the increase of self-trapped excitons, radiative recombination, and wide-band gap luminescence.21,22 The structure–property relationship of a series of two-dimensional hybrid perovskites containing various large organic cations shows that self-trapping exciton emission is closely related to the distortion of the inorganic sublattice. Under environmental conditions, the wideband emission of (PEA)2PbCl4 is observed from self-trapped excitons in highly twisted structures.21 However, the less distorted (PEA)2PBr4 only exhibits narrow free exciton emission.22
 | ||
| Fig. 2 Cl− doped (PEA)2PbBr4. (a) Absorption spectrum, (b) photoemission spectrum, and (c) powder XRD of (PEA)2PbBr4, (0, 3%, 5%, 10%, 17.5%, 100% doping concentration). | ||
Fig. 2(c) shows the XRD test results. First, it shows the 2D characteristics of (PEA)2PbBr4 perovskite because the corresponding X-ray diffraction angles are 10.6905°, 16.0477°, 21.4048° and 26.7882°.23 The corresponding crystal face indices are (002), (003), (004), and (005). XRD patterns of single crystal samples grown with different Cl content show that the crystal has a series of strong diffraction peaks with equal spacing perpendicular to the C-axis. Owing to the (PEA)2Pb(Br1−xClx)4 layered structure (00l = 1, 2, 3…), the lattice surface indicates that the crystal has better crystallinity and higher preferred orientation. The crystal face corresponding to the XRD characteristic peak of the perovskite single crystal with each Cl component content has been indicated in Fig. 2(c). By analyzing a series of XRD patterns, it is found that the diffraction peak on the (002) crystal plane (corresponding to the c lattice parameter) gradually moves to a lower diffraction angle with the increase of Cl component content, indicating that the method has successfully prepared double halide perovskite single crystals with different Cl components. As shown in Fig. 2(c), the diffraction peak on the (002) crystal plane gradually decreases with the increase of the x value of Br component content, which is caused by the change of c lattice constant in the crystal structure of (PEA)2Pb(Br1−xClx)4. This result conforms to the Bragg equation. Second, since the size of Cl− is smaller than that of Br−, the incorporation of Cl− reduces the crystal plane spacing; therefore, the diffraction peak shifts to a large angle.24 The analysis shows that in the single crystal structure of (PEA)2Pb(Br1−xClx)4, a ≠ b ≠ c, α ≠ β ≠ γ, both belong to a triclinic crystal system with space group P![[1 with combining macron]](https://www.rsc.org/images/entities/char_0031_0304.gif) , which is consistent with reported results.25,26 The basic structural unit of the (PEA)2PbBr4 two-dimensional perovskite inorganic layer comprises a layer of PbBr6 octahedra with shared angles. With the doping of Cl−, part of Br− is substituted and part of PbCl6 octahedron is produced. As the Cl− radius is smaller than the Br− radius, lattice shrinkage occurs throughout the crystal structure. When complete substitution of Cl− happens, i.e., the (PEA)2PbCl4 single crystal structure, the lattice constant is minimum. The analytical analysis of the crystallographic data of (PEA)2Pb(Br1−xClx)4 single crystal shows that the doping of Cl− distorts the crystal structure and changes the crystal structure. However, for the 17.5% doped sample, there are (PEA)2PbCl4 hybrid peaks, marked with * in Fig. 2(c), where 15° and 20° are the peaks of unreacted PbBr2 and PbCl2, and the other two are hybrid peaks of PEA2Pb(Br0.825Cl0.175)4.
, which is consistent with reported results.25,26 The basic structural unit of the (PEA)2PbBr4 two-dimensional perovskite inorganic layer comprises a layer of PbBr6 octahedra with shared angles. With the doping of Cl−, part of Br− is substituted and part of PbCl6 octahedron is produced. As the Cl− radius is smaller than the Br− radius, lattice shrinkage occurs throughout the crystal structure. When complete substitution of Cl− happens, i.e., the (PEA)2PbCl4 single crystal structure, the lattice constant is minimum. The analytical analysis of the crystallographic data of (PEA)2Pb(Br1−xClx)4 single crystal shows that the doping of Cl− distorts the crystal structure and changes the crystal structure. However, for the 17.5% doped sample, there are (PEA)2PbCl4 hybrid peaks, marked with * in Fig. 2(c), where 15° and 20° are the peaks of unreacted PbBr2 and PbCl2, and the other two are hybrid peaks of PEA2Pb(Br0.825Cl0.175)4.
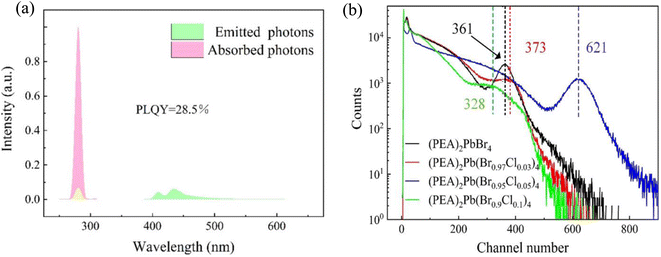
Furthermore, the absorption spectrum and the photoemission spectrum of (PEA)2PbBr4 crystals were measured with different Cl− doping content. We found that the PLQY test results of 5% doping concentration crystals was the maximum value of each doping concentration crystal (Fig. 3(a)), and its PLQY value was 28.5%. The PLQY values of samples with different doping concentrations were calculated in Table 2. Cl− doping increased the optical yield of (PEA)2PbBr4 crystal and PLQY. The reason for this is the incorporation of Cl− regulates the lattice of (PEA)2PbBr4 crystals, reducing the electron–phonon coupling and thus the non-radiative recombination. As shown in Fig. 3(b), taking 137Cs as a gamma-ray source of 662 keV, under the same test conditions, the photoelectric peak address of single crystals with different doping concentrations was different, although the photoelectric peak address of the crystal with 5% doping concentration was the 620 position. Note that the photoelectric peak address number of other single crystals with doping concentration was less than the 400 position. Because the fluorescence emission peaks of different doped single crystals were not different, the light yield of 5% doped single crystals was considerably higher than that of other doped concentrations. The 5% Cl-doped (PEA)2PbBr4 has the highest light yield and PLQY; in this work, we took 5% Cl−doped (PEA)2PbBr4 as the main test object.
 | ||
| Fig. 3 (a) PLQY test results of 5% doping concentration crystal, (b) pulse amplitude spectra of (PEA)2PbBr4 crystals with different Cl− doping concentrations (137Cs source). | ||
| Chemical formula | PLQY (%) |
|---|---|
| (PEA)2PbBr4 | 21.2 |
| (PEA)2Pb(Br0.97Cl0.03)4 | 23.4 |
| (PEA)2Pb(Br0.95Cl0.05)4 | 28.5 |
| (PEA)2Pb(Br0.9Cl0.1)4 | 24.3 |
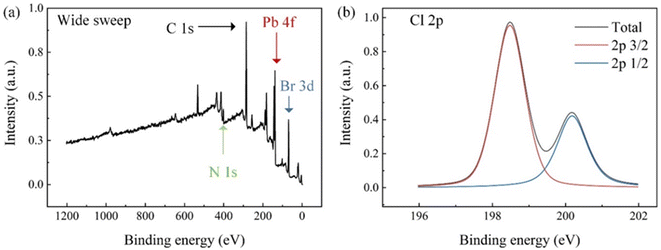
Fig. 4(a) shows the XPS wide-spectrum scanning results of the 5% Cl− doping sample, in which the peaks of C 1s, N 1s, Pb 4f and Br 3d are labeled. Owing to the low concentration of Cl− in the sample, Cl 2p peaks cannot be clearly identified in a wide spectrum scan. Fig. 4(b) shows the narrow sweep results of Cl 2p peaks, and sub-peak fitting was performed as per the 2p3/2 and 2p1/2 peak positions and the ratio column of peak areas. The fitting results agreed with the original data, proving that the test sample contains Cl elements.
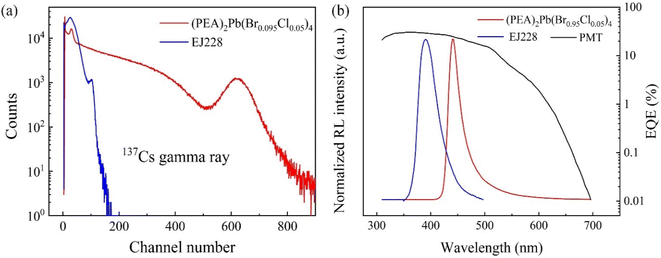
Light yield and luminous lifetime are the two core indexes of a scintillator. The pulse amplitude spectra of (PEA)2Pb(Br0.95Cl0.05)4 and plastic scintillator were tested with gamma rays of 137Cs (662 keV) as the ray source. The 137Cs source used has an activity of 1 × 10⁴ Bq (i.e. decays 104 times per second), and the plastic scintillator selected is a commercial EJ228 plastic scintillator from Eljen Technology with a PVT matrix and a light yield of 10![[thin space (1/6-em)]](https://www.rsc.org/images/entities/char_2009.gif) 200 photons MeV−1. The test results are shown in Fig. 5(a), the corresponding number of photoelectric peaks of the two were 620 and 200, respectively. Considering that the photomultiplier tube (PMT) has different external quantum efficiencies for the two (the matching coefficients calculated are 21.05 and 28.15, respectively, in Fig. 5 (b)), the yield of (PEA)2Pb(Br0.95Cl0.05)4 crystals was 32
200 photons MeV−1. The test results are shown in Fig. 5(a), the corresponding number of photoelectric peaks of the two were 620 and 200, respectively. Considering that the photomultiplier tube (PMT) has different external quantum efficiencies for the two (the matching coefficients calculated are 21.05 and 28.15, respectively, in Fig. 5 (b)), the yield of (PEA)2Pb(Br0.95Cl0.05)4 crystals was 32![[thin space (1/6-em)]](https://www.rsc.org/images/entities/char_2009.gif) 000 photons MeV−1, which was three times that of the EJ228 plastic scintillator, after optimization.
000 photons MeV−1, which was three times that of the EJ228 plastic scintillator, after optimization.
3. Results and discussion
3.1 Principle of (PEA)2PbBr4 for fast neutron detection
Fig. 6 is a schematic of fast neutron detection for (PEA)2PbBr4.27 As shown in Fig. 6(a), step (1) is fast neutrons first engaging in elastic collision with hydrogen atoms in PEA+. In step (2), generated recoiled protons excite or ionize the material, and in step (3), excited state enters the inorganic luminescent layer to deexcite light. Fig. 6(b) shows the step (3) process from the perspective of the energy band. Secondary electrons or hot electrons produced by (PEA)2PbBr4 ionized or excited by recoiling protons consume energy reach the bottom of the conduction band via a thermal relaxation process and finally emit light via band edge recombination.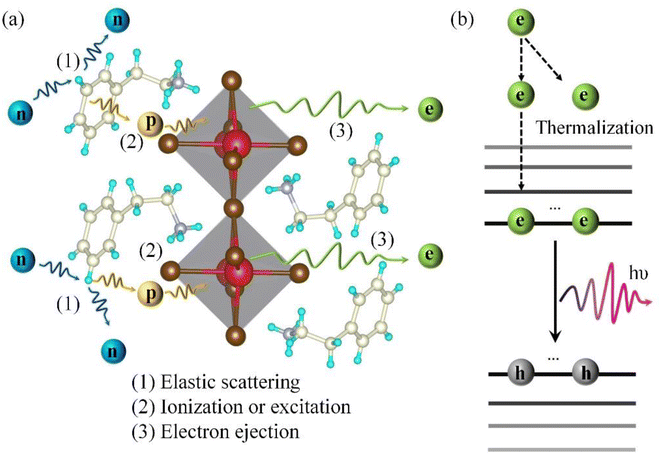 | ||
| Fig. 6 Schematic diagram of the fast neutron detection principle of (PEA)2PbBr4, (a) and (b) were described from the perspective of space and energy band respectively. | ||
To test the performance of two-dimensional halide perovskite in a mixed field containing fast neutrons and gamma rays, the dense plasma focus (DPF) device was used in this experiment as a ray source for relevant tests.28 The working principle of the device is shown in Fig. S4(a).† In this experiment, we used the time of flight (TOF) method to identify neutrons and gamma particles; its working principle is as shown in Fig. S4(b).†
3.2 Time response of (PEA)2Pb(Br0.95Cl0.05)4 single crystal for fast neutrons and γ rays
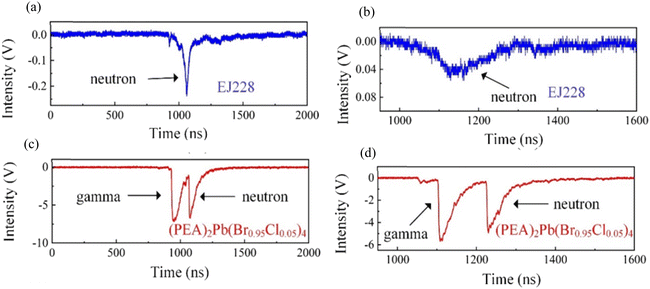
The TOF of (PEA)2Pb(Br0.95Cl0.05)4 crystal and plastic scintillator EJ228 were tested in a mixing field provided by a DPF device. Typical test results are shown in Fig. 7. For the plastic scintillator EJ228, only an isolated response peak was observed, which came from fast neutrons. Because the plastic scintillator cannot effectively absorb gamma rays, it does not contain heavy elements. Moreover, due to the low light yield of EJ228, the amplitude of the response peak was also very small, at 0.1 V. In contrast, when the test object was a (PEA)2Pb(Br0.95Cl0.05)4 single crystal, multiple response peaks could be observed, the first two of which were from gamma rays and the last two from fast neutrons. In theory, for fast neutrons with energy of 2.45 MeV and gamma rays with energy of 67 keV, the conversion parameter between the TOF time difference and the flight distance is 42.9 ns m−1, that is, the arrival time difference between the two increases by 42.9 ns for every 1 m increase in the flight distance. The distance from the fusion reaction point to the detector is now known to be 3.1 m, and the TOF time difference Δt1 is 137 ns. The actual conversion parameter can be calculated to be 44.2 ns m−1, which is only 2.9% different from the theoretical value. Furthermore, another flight time difference is Δt2 = 47.2 ns, reflecting the time interval between two fusion reactions, which is important in the analysis of fusion reaction dynamics.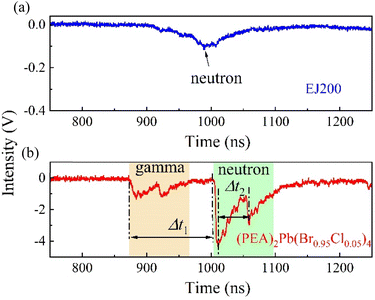 | ||
| Fig. 7 Comparison of TOF test results of (PEA)2Pb(Br0.95Cl0.05)4 crystal and plastic scintillator EJ228 in mixed field provided by DPF device. | ||
3.3 Sensitivity response of (PEA)2Pb(Br0.95Cl0.05)4 single crystal for the fast neutrons and γ rays
Fig. 8 shows the response test results of (PEA)2Pb(Br0.95Cl0.05)4 crystal and plastic scintillator EJ228 in a DPF mixed field. In Fig. 8(a) and (b), for a plastic scintillator EJ228, only a single fast neutron peak can be observed. Owing to the low light yield, while using the nuclear reaction method for fast neutron detection, fast neutrons cannot deposit all energy in EJ228 under a single collision; therefore, the response peak amplitude generally does not exceed 1 V. For (PEA)2Pb(Br0.95Cl0.05)4 single crystal, considering the distance from the detector to the DPF device and energy of the fast neutron and γ-ray energy released by the DPF (and thus the speed of both), the time difference between the fast neutron and γ-photon released by a single nuclear reaction to the detector is 133 ns, and the arrival time of the γ-photon is earlier than the fast neutron (Fig. 8(c) and (d)). According to this, certain response peaks of (PEA)2Pb(Br0.95Cl0.05)4 crystal were identified, γ-photon can deposit most energy in (PEA)2Pb(Br0.95Cl0.05)4 crystal under a single collision, and therefore the response peak amplitude is generally relatively high.4. Conclusion
In this paper, two dimensional halide perovskite (PEA)2Pb(Br0.95Cl0.05)4 doped with Cl was prepared using a seed-induced volatile solvent method. Based on the optimization of Cl− doping concentration, the light yield and luminescence lifetime of the crystal were tested. The best effect was obtained when the Cl− doping concentration was 5%. Then, a mixed field composed of fast neutrons and γ rays was provided by a DPF device, and the performance of (PEA)2Pb(Br0.95Cl0.05)4 crystal in the mixed field was verified. Using the time-of-flight method and the linear relationship between integrated charge and neutron yield, (PEA)2Pb(Br0.95Cl0.05)4 crystals can be used for n/γ screening. The time difference between the fast neutron released by a single nuclear reaction and γ photon arriving at the detector is 130 ns, and the arrival time of the γ photon is earlier than that of the fast neutron. The results of this study have a broad application prospect in the study of nuclear reaction dynamics, the monitoring of the neutron yield of fusion devices and the total energy released by nuclear reactions.Data availability
The data supporting this study's findings are available from the corresponding author upon reasonable request.Conflicts of interest
There are no conflicts to declare.Acknowledgements
The authors gratefully acknowledge financial support from the Central Government of Hubei Province Guides Local Projects (Grant No. ZYYD2020000045), and the funding of Hubei Education Department Innovation Team (Grant No. T2021024), and Hubei Provincial Department of Education Science and Technology Planning research Project (Grant No. B2021240), and Huanggang Science and Technology Project (Grant No. XQYF2021000056).References
- J. Zheng, Y. Zeng, J. Wang, C. Sun, B. Tang and Y. Wu, et al., J. Am. Chem. Soc., 2021, 143(50), 21302–21311 CrossRef CAS PubMed
.
- J. E. Eberhardt, A. J. McEwan, D. Milinkovic, V. Sharp, B. D. Sowerby and J. R. Tickner, Proc. Sci., 2006, 074, 1–5 Search PubMed
.
- N. Kardjilov, I. Manke, R. Woracek, A. Hilger and J. Banhart, Mater. Today, 2018, 21(6), 652–672 CrossRef CAS
.
- S. D. Clarke, E. Pryser, B. M. Wieger, S. A. Pozzi, R. A. Haelg and V. A. Bashkirov, et al., Med. Phys., 2016, 43(11), 5915 CrossRef CAS PubMed
.
- A. Kargar, E. V. Van Loef, L. Cirignano and K. S. Shah, Organic semiconductors for fast-neutron detection, in 2011 IEEE Nuclear Science Symposium Conference, Proceedings of the IEEE, Valencia, Spain, 2011, pp. 4545–4549, 23-29 Oct Search PubMed
.
- K. M. McCall, K. Sakhatskyi, E. Lehmann, B. Walfort, A. S. Losko and F. Montanarella, et al., ACS Nano, 2020, 14(11), 14686–14697 CrossRef CAS PubMed
.
- T. J. Hajagos, C. Liu, N. J. Cherepy and Q. Pei, Adv. Mater., 2018, 30(27), 1706956 CrossRef
.
- A. D. Jodlowski, C. Roldán-Carmona, G. Grancini, M. Salado, M. Ralaiarisoa and S. Ahmad, et al., Nat. Energy, 2017, 2(12), 972–979 CrossRef CAS
.
- S. Yan, W. Tian, H. Chen, K. Tang, T. Lin and G. Zhong, et al., Adv. Opt. Mater., 2020, 9(4), 2001709 CrossRef
.
- K. Wang, C. Wu, D. Yang, Y. Jiang and S. Priya, ACS Nano, 2018, 12(5), 4919–4929 CrossRef CAS PubMed
.
- Z. Zhang and G. Yang, J. Mater. Sci.: Mater. Electron., 2020, 32(10), 12758–12770 CrossRef
.
- M. Yao, J. Jiang, D. Xin, Y. Ma, W. Wei and X. Zheng, et al., Nano Lett., 2021, 21(9), 3947–3955 CrossRef CAS
.
- W. J. Li, M. B. Li, Y. H. He, J. M. Song, K. K. Guo, W. T. Pan and H. T. We, Adv. Mater., 2024, 2309588 CrossRef CAS
.
- P. Y. Wan, T. Jin, R. L. Gao, X. Ouyang, Z. L. Feng, G. D. Niu, J. Tang, L. Y. Liu and X. P. Ouyang, Adv. Funct. Mater., 2024, 34, 2308263 CrossRef CAS
.
- H. Hu, G. D. Niu, Z. P. Zheng, L. Xu, L. Y. Liu and J. Tang, EcoMat, 2022, 4, e12258 CrossRef CAS
.
- K. Shibuya, M. Koshimizu, H. Murakami, Y. Muroya, Y. Katsumura and K. A. Jap, J. Appl. Phys., 2004, 43(10B), L1333 CrossRef
.
- Y. T. Gao, P. Y. Wan, T. Jin, H. Hu, L. Y. Liu and G. D. Niu, Small, 2023, 19, 2301530 CrossRef CAS
.
- F. Zhang, B. Yang, Y. Li, W. Deng and R. He, J. Mater. Chem. C, 2017, 5(33), 8431–8435 RSC
.
- Z. Lian, Q. Yan, T. Gao, J. Ding, Q. Lv and C. Ning, et al., J. Am. Chem. Soc., 2016, 138(30), 9409–9412 CrossRef CAS
.
- P. Cai, Y. Huang and H. J. Seo, J. Phys. Chem. Lett., 2019, 10(14), 4095–4102 CrossRef CAS PubMed
.
- S. Yang, Z. Lin and Z. Wang, et al., ACS Appl. Mater. Interfaces, 2018, 10(18), 15980–15987 CrossRef CAS
.
- Z. Long, L. Wu and Z. Kai, et al., Adv. Sci., 2019, 6(2), 1801628 CrossRef
.
- W. P. Yan, B. J. Duan, Y. Li, Y. Song, G. Z. Song, J. M. Ma, B. K. Li and Y. C. Liu, ACS Appl. Opt. Mater., 2023, 1, 1856–1861 CrossRef CAS
.
- H. D. Wu, X. Chen, Z. H. Song, A. Zhang, X. Y. Du, X. He, H. Q. Wang, L. Xu, Z. P. Zheng, G. D. Niu and J. Tang, Adv. Mater., 2023, 35, 2301406 CrossRef CAS PubMed
.
- D. Ma, F. Fu and L. Dang, et al., Nano Res., 2017, 10(6), 2117–2129 CrossRef CAS
.
- T. Krishnamoorthy, W. K. Chong and W. Xie, et al., Chem. Mater., 2017, 29(9), 3947–3953 CrossRef
.
- Z. H. Song, X. Y. Du, X. He, H. Q. Wang, Z. Q. Liu, H. D. Wu, H. D Luo, L. B. Jin, L. Xu, Z. P. Zheng, G. D. Niu and J. Tang, Nat. Commun., 2023, 14, 6865 CrossRef CAS
.
- L. Chen, J. Ruan, M. Xu, S. He, J. Hu and Z. Zhang, et al., Nucl. Instrum. Methods Phys. Res., Sect. A, 2019, 933, 71–74 CrossRef CAS
.
Footnote |
| † Electronic supplementary information (ESI) available. See DOI: https://doi.org/10.1039/d4ra04354e |
| This journal is © The Royal Society of Chemistry 2024 |

