 Open Access Article
Wearable threads for monitoring sanitizer quality using dye displacement assay†
Pratham Joshi‡
ab,
Akhiya Shinde‡a,
Sukanya Sudhiramc,
Bibhu Ranjan Sarangicd and
Naresh Kumar Mani *ab
*ab
aMicrofluidics, Sensors and Diagnostics (μSenD) Laboratory, Centre for Microfluidics, Biomarkers, Photoceutics and Sensors (μBioPS), Department of Biotechnology, Manipal Institute of Technology, Manipal Academy of Higher Education, Manipal, Karnataka 576104, India. E-mail: naresh.mani@manipal.edu; maninaresh@gmail.com
bInnotech Manipal, Manipal Institute of Technology, Manipal Academy of Higher Education, Manipal, Karnataka 576104, India
cPhysical and Chemical Biology Laboratory, Department of Physics, Indian Institute of Technology, Palakkad, Kerala 678623, India
dBiological Sciences and Engineering, Indian Institute of Technology, Palakkad, Kerala 678623, India
First published on 20th November 2024
Abstract
This study employs zero-cost (≈0.01 $) and durable thread-based devices to evaluate the quality of simulated and commercial sanitizer samples through dye displacement assay (DDA). A diverse range of sanitizer compositions, including ethanol concentrations of 55%, 75%, and 95% (v/v), were analysed. This investigation encompasses an assessment of the marker type (Doms and Hauser brands) on the migration distance of the dye region marked on thread devices. Our results demonstrate a proportional increase in the migration distance of the dye with increasing ethanol concentrations due to a decrease in the coefficient of viscosity and solvation power of ethanol on dye molecules. Additionally, a field trial for the thorough assessment of commercial sanitizer quality using thread-based devices further underscores the efficacy of this methodology. A calibration plot for a braided thread with Doms marker dye provides a reliable means to quantitatively assess the ethanol content in different commercial sanitizer compositions. Our findings collectively highlight the significance of this innovative method as a valuable tool for quality control and assessment for public health and hygiene as well as for preparing us for another pandemic.
1 Introduction
Since the earliest reports of its occurrence in Wuhan, Hubei Province, China, in November–December of 2019,1 severe acute respiratory syndrome coronavirus 2 (SARS-CoV-2) has spread to various countries across the world, resulting in social, financial and health crises2,3 at a global scale. In March 2020, the World Health Organization (WHO) promptly classified it as a pandemic4,5 with a rapid transmission rate and virulence6 owing to its mutations.7,8 Consequently, there was a demand for timely and effective diagnosis using the reverse transcriptase quantitative polymerase chain reaction (RT-qPCR),9 lateral flow assays10 and numerous other ultra-rapid test kits.11,12 Additionally, several measures such as social distancing,13 wearing face masks and gloves,14 and frequent use of disinfectants and sanitizers15 were followed to curb the spread of the virus. Among these, hand sanitizers, especially alcohol-based hand sanitizers (ABHSs), have garnered popularity owing to their low cost and high efficacy in minimizing infectious transmission as a result of targeting and altering the structure of the protective viral envelope, thereby affecting the viral life cycle and hence its transmission.16 However, the efficiency of sanitizers directly depends on variables including the type and concentration of alcohol.17For instance, ethanol-based sanitizers have been known to exhibit greater and more robust viricidal activity than their isopropanol counterparts.18 For their effective action, the WHO has recommended a concentration of 80% (v/v) ethanol in 2015.19,20 Considering the tremendous surge in the trade of hand sanitizers, the subsequent shortage in supply, the desire for higher profits coupled with the lack of good manufacturing practices (GMPs) and verification by authorities have raised various concerns on their quality.19 This has led to instances where the formulation is either diluted with water to yield less than 60% (v/v) ethanol or ethanol is replaced with additives such as methanol, which is not a specified ingredient.20 Such activities not only reduce the efficacy of sanitizers against infection but also lead to toxicity. Furthermore, they exert a financial burden on the population, highlighting the requirement for robust analytical tools to assess ethanol levels in sanitizers.
Conventional methods such as gas chromatography,21 specific gravity testing using alcoholmeters22 and FTIR23 have been applied for determining the ethanol content in sanitizers. However, they often involve time-consuming protocols, experts and complex sample treatments.24 Moreover, the most commonly used methods, namely, near- and mid-infrared spectroscopy, although robust, rapid and reliable, continue to be designed mainly for quality control by manufacturers25 and thus are not affordable by the general public, especially for POCT. To address the aforementioned limitations, we introduce a dye displacement assay (DDA) on thread-based microfluidic devices for the precise monitoring of the sanitizer quality.
In this work, we leveraged braided thread devices with 1 cm region shaded with black marker pen. Upon the introduction of the sanitizer sample to the shaded region of the thread devices, dye displacement occurs mainly due to its solubilization by the ethanol present in the sanitizer. The migration distance exhibited by the dye directly corresponds to the concentration of ethanol in sanitizers. To the best of our knowledge, this is the first research leveraging thread devices as zero-cost wearable devices for monitoring sanitizer quality. In the literature, Aya M. El-Hassanein et al., and Warongrit Sukma et al., have developed a colorimetric approach for assessing the sanitizer quality;26,27 however, the utilization of thread-based wearable devices offers advantages like portability, robustness and less cost over their methods. Our research group has already demonstrated a frugal way of leveraging plain thread-based devices for the colorimetric detection of pathogens28–30 and other applications.31 The schematic illustration showing the thread-based wearable sensors for monitoring the sanitizer quality using the dye displacement assay is given in Fig. 1.
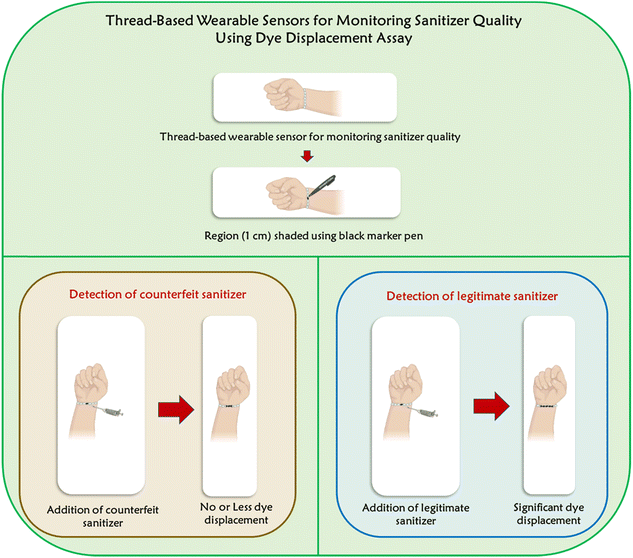 | ||
| Fig. 1 The schematic showing the thread-based devices for monitoring sanitizer quality using dye displacement assay. | ||
2 Materials and methods
2.1 Materials
Twisted Multifilament Cotton threads (Simco) were purchased from local stores. The black markers of Hauser and Doms were procured from a local stationary shop. The chemicals utilized in this research, specifically 99.9% ethanol, was obtained from Changshu Hongsheng Fine Chemical Co., Ltd, while 99–100% pure glycerine was sourced from Oom Laboratories. Additionally, a 30% solution of hydrogen peroxide (H2O2) was procured from MERCK, India.2.2 Fabrication of thread-based wearable devices
Thread-based analytical devices were fabricated by combining three segments of thread, each measuring 28 cm, which were precisely cut from the cotton threads. These threads were intricately knotted at the upper end and subsequently braided, ensuring uniformity and consistency in the devices. Notably, a 1 cm mark was introduced onto the braided threads using permanent markers. This process served as a critical calibration step, enabling accurate measurements during subsequent analyses.2.3 Preparation and evaluation of simulated sanitizer compositions for thread-based wearable sensor monitoring
The simulated sanitizer samples were prepared to replicate a spectrum of compositions with varying ethanol percentages. It was ensured that the concentrations of glycerine and hydrogen peroxide remained constant, while the ethanol–water ratios were systematically adjusted. Following this, the prepared simulated sanitizers were effectively utilized for monitoring sanitizer quality using the developed thread-based wearable devices.2.4 Assessment of simulated sanitizer samples using thread-based wearable sensors
100 μL sanitizer sample was added onto braided thread devices. High-resolution images of the devices were captured using a Canon 80D camera. Following a standardized incubation period of 60 seconds, the distance displaced by the ink was measured using a calibrated ruler. The distances travelled by the ink upon the addition of different concentrations 55% (v/v), 75% (v/v), and 95% (v/v) were plotted on a graph, enabling the comprehensive analysis of the results. As a control experiment, water was used. Further, to maintain consistency and ensure the reproducibility of results, the trials were conducted in triplicates. Two types of markers, Hauser and Doms, were employed in this experiment, providing additional insight into the potential influence of the marker type on the experimental outcomes.2.5 Comprehensive evaluation of commercial sanitizer quality using thread-based wearable devices
Five different samples of commercial sanitizers obtained from local vendors were collected and carefully preserved. Subsequently, each sample underwent testing using the fabricated thread-based wearable devices by dropping 100 μL of the sample. This comprehensive approach enabled the real-time monitoring of sanitizer quality, demonstrating the effectiveness of the developed methodology.2.6 FT-IR analysis of plain thread, coated thread and thread with ethanol
The assessment of functional groups present in plain thread, coated thread and thread with ethanol was performed using an FT-IR spectrometer (Shimadzu, India) in the ATR mode in the range of 400–4000 cm−1.2.7 Measurement of coefficient of viscosity
In order to understand the dependence of ethanol concentration on the wicking action of the thread-based wearable devices, viscosity measurements were performed on various samples. Solutions (20 mL) with different concentrations of ethanol, viz., 55%, 60%, 65%,70%, 75%, 80% and 85% (v/v), were prepared, which also comprised 1.45% glycerine and 0.5% hydrogen peroxide in water.Viscosity measurements were performed using an Anton Paar MCR 702e rheometer (Anton Paar GmbH, Austria). Approximately 2 mL of the solution was loaded onto the rheometer. The measurements were done at room temperature using 25 mm parallel plate geometry. Data acquisition was performed using RheoCompass software (Anton Paar GmbH, Austria).
The obtained data consisted of shear rates and the corresponding shear stress values. For a Newtonian fluid, the shear stress and the shear rate follow the relation
σ = η![[small epsi, Greek, dot above]](https://www.rsc.org/images/entities/i_char_e0a1.gif)
| (1) |
![[small epsi, Greek, dot above]](https://www.rsc.org/images/entities/i_char_e0a1.gif) is the shear rate. Data analysis for each concentration was done by dividing it into windows of four consecutive data points. Each window was fitted to the equation of a straight line (using MATLAB Curve Fitting Toolbox) and the slope was extracted. These slopes, which correspond to the viscosity, were then averaged to obtain the final viscosity value. The sample standard deviation was also calculated to obtain error bars.
is the shear rate. Data analysis for each concentration was done by dividing it into windows of four consecutive data points. Each window was fitted to the equation of a straight line (using MATLAB Curve Fitting Toolbox) and the slope was extracted. These slopes, which correspond to the viscosity, were then averaged to obtain the final viscosity value. The sample standard deviation was also calculated to obtain error bars.
2.8 Statistical analysis
The experimental results detailing the manual distance covered by the dye after the addition of varying concentrations of ethanol, specifically, 55% (v/v), 75% (v/v), and 95% (v/v), were presented as mean values accompanied by their respective standard deviations (SD). The statistical significance pertaining to the mean dye displacement from the sample loading zone was evaluated using the one-way ANOVA test using GraphPad Prism 8 software. For all analyses, a significance level of p < 0.05 was deemed indicative of statistical significance.3 Results and discussion
3.1 Assessment of simulated sanitizer samples using thread-based wearable devices via dye displacement assay (DDA)
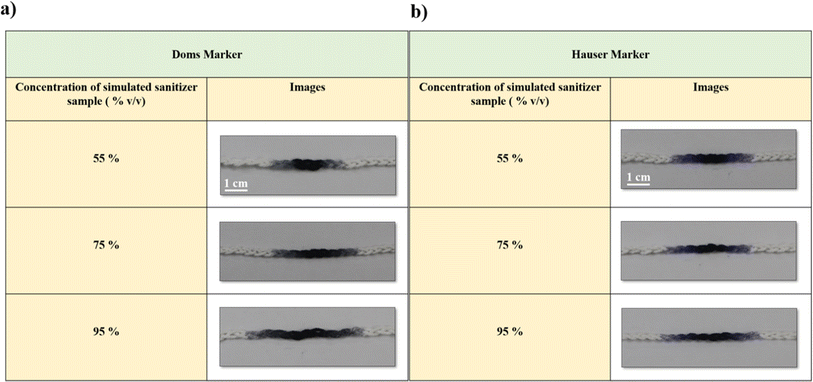
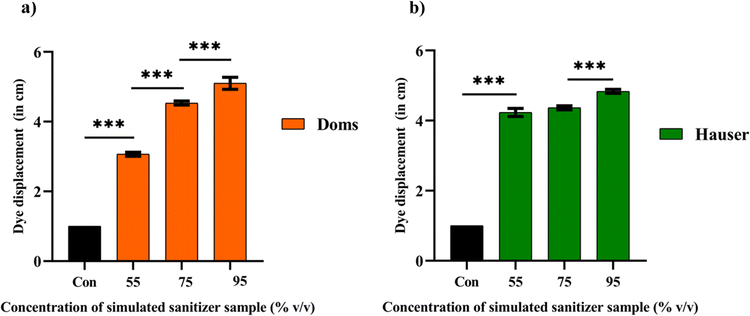
The study employed low-cost and robust thread-based wearable devices to assess the quality of simulated sanitizer samples using a dye displacement assay (DDA). In this study, a range of simulated sanitizer samples was prepared to mimic diverse sanitizer compositions, encompassing a spectrum of ethanol percentages, including 55% (v/v), 75% (v/v), and 95% (v/v). Protocols were implemented throughout the formulation process to ensure consistent concentrations of glycerine and hydrogen peroxide while systematically adjusting the ratios of ethanol to water (ESI Table 1†). In addition, our investigation involved assessing the influence of marker type on ink migration distance utilizing two specific brands (Doms and Hauser). We noticed that as the ethanol concentration of the simulated sanitizer solutions increased, there was an increase in the migration distance of the dye (Fig. 2a and b).Furthermore, the migration distances demonstrated by both Doms and Hauser markers were graphically represented (Fig. 3a and b). Fig. 3a revealed a substantial increase in the dye migration distance from 55% (v/v) to 95% (v/v) ethanol concentration, indicating a statistically significant difference (p < 0.001). Similarly, for Fig. 3b, the same trend was observed for the ethanol concentration 55% (v/v) and 95% (v/v) with (p < 0.001). However, the migration distance exhibited by the Hauser marker upon the addition of 75% (v/v) ethanol did not show a statistically significant difference compared to its 55% (v/v) counterpart. The lack of a statistically significant difference in the migration distance between 55% (v/v) and 75% (v/v) ethanol with the Hauser marker could be ascribed to the specific composition and solubility attributes of the marker ink. It is also possible that the formulation of the Hauser marker is comparatively less responsive to ethanol concentration of 75% (v/v).
The observed increase in the ink migration distance with increasing ethanol concentrations of the simulated sanitizer samples is closely tied to the reduction in the solution viscosity,32 disruptive power of ethanol, which reduces the intermolecular forces (hydrogen bonds) among water molecules33 and also lowers the resistance to flow.34 As a result, the dye experiences increased mobility along the thread-based wearable devices, consequently increasing the migration distance from the point of application.
In addition to the influence of ethanol concentration on solution viscosity, another significant factor contributing to the variation in migration distance lies in the composition of the marker dye itself. In general, permanent marker ink is made up of a hydrophobic formulation, which includes a main carrier solvent, a glyceride, a pyrrolidone, a resin, and a colorant or dye.35–37 The dynamic relationship between the composition of the marker ink and its solubility in ethanol (a universal solvent, which can dissolve both hydrophilic and hydrophobic compounds) is a major factor contributing to varying migration distance on threads. As the ethanol concentration rises, the solvent's chemical nature enhances the solubility of the marker dye. This enhanced affinity prompts the dye molecules to disperse more readily within the ethanol-rich solution. Consequently, the ink experiences reduced resistance when migrating along the thread devices, leading to a notable increase in their migration distance. Thus, the understanding gained from this study offers promising prospects for assessing sanitizer quality in resource-limited settings. Given that the principle of ink migration in response to varying sanitizer compositions has been established, this method could potentially serve as a cost-effective and accessible means for evaluating sanitizer efficacy.
3.2 Comprehensive evaluation of commercial sanitizer quality using thread-based wearable devices
A thorough assessment of commercial sanitizer's quality was conducted utilizing the developed thread-based wearable devices. Five distinct samples of commercial sanitizers, procured from local vendors, were collected and preserved for analysis. Based on the migration distance, a clear distinction in ethanol content among the sampled sanitizers can be inferred (Fig. 4). We also conducted control study with water and observed no difference in the dye migration. This shows that the dye migration is mainly due to the change in the ethanol concentration. Further, the ethanol content in each of these samples was quantitatively assessed. Fig. 5 represents the migration distance of the dye (Doms brand) with different commercial sanitizer samples. The calibration plot yielded a well-fitted curve represented by the equation y = 0.051x + 0.405, where the slope (m) and y-intercept (c) were 0.051 and 0.405, respectively. These calibration plots provided accurate means to quantitatively assess the ethanol content in the analysed sanitizer samples. By analyzing the distance displaced by the ink upon the addition of five distinct sanitizer formulations, the ethanol percentages were determined and tabulated (Table 1).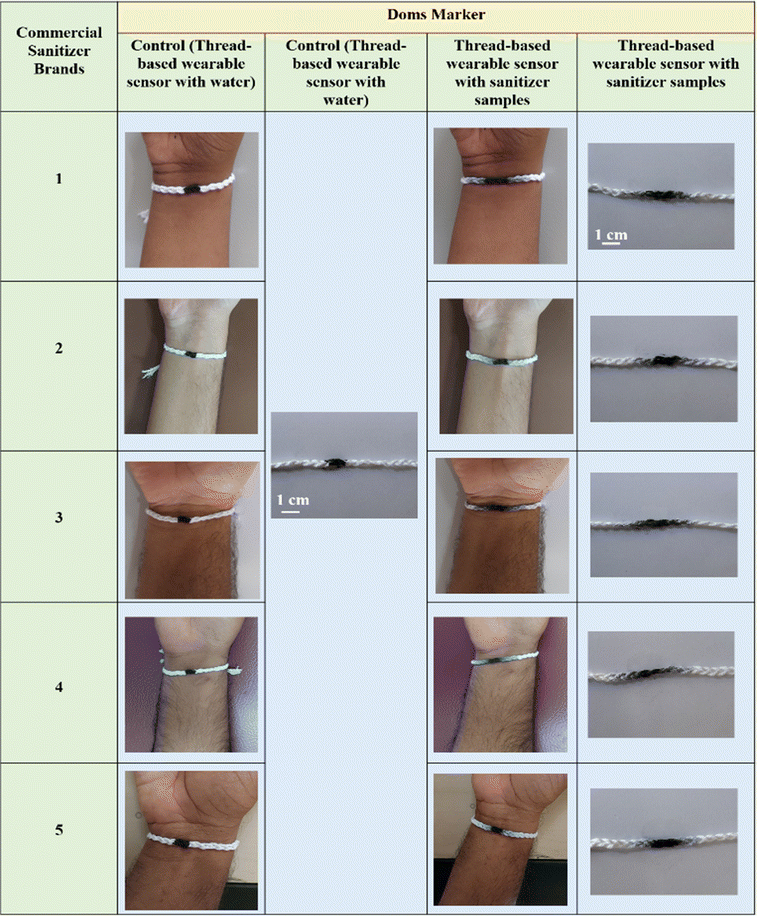 | ||
| Fig. 4 Practical application of thread-based wearable sensors for estimating pure ethanol content via Doms marker dye migration, utilizing different commercial sanitizer samples (samples 1–5). | ||
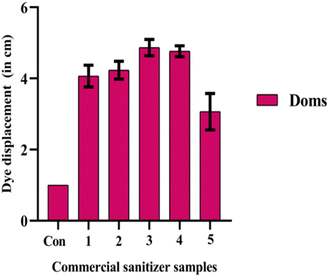 | ||
| Fig. 5 Migration distance of the Doms marker dye upon addition with different commercial sanitizer samples: sample 1, sample 2, sample 3, sample 4 and sample 5. | ||
| Commercial sanitizer sample types | Mean displacement of the Doms dye (y) (in cm) | Concentration of ethanol (x) (% (v/v)) |
|---|---|---|
| 1 | 4.06 | 71.66 |
| 2 | 4.23 | 75 |
| 3 | 4.86 | 87.35 |
| 4 | 4.76 | 85.39 |
| 5 | 3.06 | 52.09 |
Upon examination of the data presented in Table 1, samples 3 & 4 exhibited ethanol concentration >85 (%v/v), samples 1 & 2 exhibited ethanol concentration ≤75 (%v/v) and sample 5 exhibited <55 (%v/v). This observed difference in ethanol content underscores the remarkable effectiveness of the employed methodology in sensitively discerning subtle variations in sanitizer formulations. These findings unequivocally emphasize the significance of this innovative method as an invaluable tool for quality control and assessment within the realm of public health and hygiene.
3.3 Surface functionality analysis using fourier transform infrared (FT-IR) spectroscopy
To assess the quality of the sanitizer by means of ethanol concentration, FT-IR spectral analysis was carried out to investigate the chemical interactions of DOMS marker-coated cellulose thread with and without ethanol using a Shimadzu FT-IR spectrophotometer in the range of 4000 to 400 cm−1 (Fig. 6). It has been noticed that the plain cellulose thread exhibits stronger O–H and C–O–C glycosidic bands at 3335 and 1103 cm−1, respectively. However, DOMS marker-coated thread exhibited reduced intensities in the spectra due to the dominating hydrophobic behaviour of the permanent marker (90%)36 over the polar cellulose surface, unveiling the surface erosion and possible degradation of the cellulose polymer.38 Upon the addition of ethanol, a sudden increase in the intensities39 was observed, which is due to the intermolecular hydrogen bonding interaction (charge transfer) between the chemicals present in the permanent marker (toluene, xylene or urethane)40 and ethanol, leading to the removal of the aromatic moieties of marker ink and the addition of hydroxyl groups of ethanol on to the surface of the cellulose fibre. The degree of solubilization of the marker ink by different concentrations of ethanol hence supports the identification of sanitizer quality by means of the distance travelled by the ink over cellulose thread. The availability of aromatic chemicals as mentioned is affirmed in the spectra at 1580 cm−1 (C![[double bond, length as m-dash]](https://www.rsc.org/images/entities/char_e001.gif) C).
C).
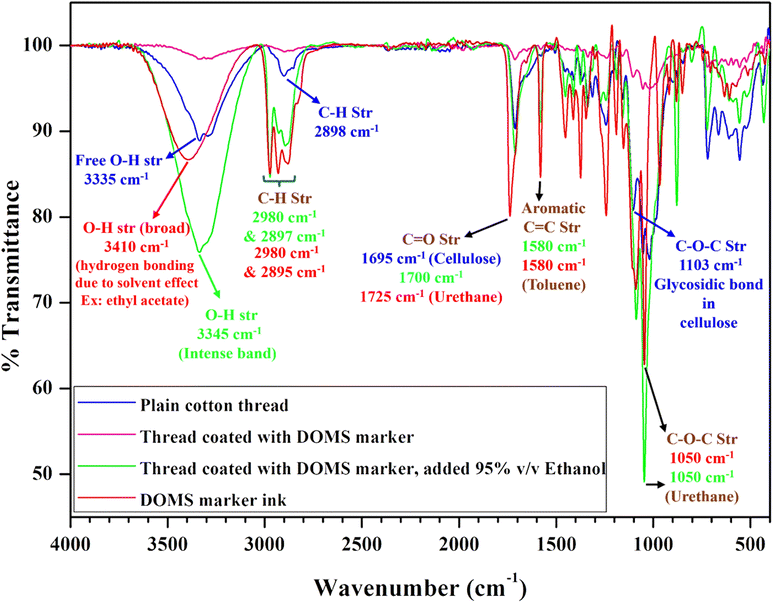 | ||
| Fig. 6 FT-IR spectra of plain cotton thread, thread coated with the DOMS marker, thread coated with the DOMS marker in addition to 95% v/v ethanol and DOMS marker ink. | ||
3.4 Capillary action-based study of the sanitizer on the fabricated thread-based wearable devices
The viscosities of solutions containing varying concentrations of ethanol 55%, 60%, 65%, 70%, 75%, 80% and 85% (v/v) were measured. It was found that the viscosity of the solution decreases with an increase in the ethanol concentration, as evident from Fig. 7. The measured viscosities range from 2.58 ± 0.01 mPa s for 55% ethanol concentration to 1.73 ± 0.01 mPa s for 85% ethanol concentration. This decrease in viscosity has a significant effect on the migration of the sanitizer solution through the thread-based devices.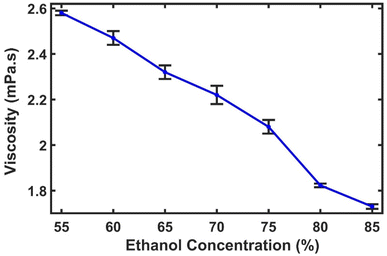 | ||
| Fig. 7 Viscosity of sanitizer solutions containing different concentrations of ethanol. The error bars correspond to the standard deviation of 3 samples. | ||
The effect of viscosity on the wetted length due to the wicking action in a thread can be understood using Washburn's equation,41 given as follows.
 | (2) |
The manual measurement of migration distance using marker dyes on the thread surface is a direct and visual method that eliminates the need for complex instrumentation. This simplicity not only expedites the evaluation process but also makes it accessible to a wider range of users, including those in resource-limited settings. This differentiation aligns with the goal of providing reliable and accessible means contributing to Sustainable Development Goal 3 (Good Health and Well-being) by ensuring the availability of quality healthcare. The low-cost fabrication of these wearable devices further emphasizes their potential for widespread implementation.
Also, the primary materials used to fabricate thread-based wearable devices for sanitizer quality include cotton thread and marker dye (both are widely accessible and cost-effective). Typically, a reel of high-quality cotton thread, sufficient for producing numerous wearable devices, is priced <1 $. The marker dye, an essential component for the displacement assay, is equally economical. A standard marker, such as Doms or Hauser, commonly used in this study, costs about 0.24 $ per unit. Given that a single marker can be utilized for multiple displacement assays, the cost per test is negligible (roughly 0.01 $). This low-cost production demonstrates the affordability and accessibility of this innovative methodology, making it particularly suitable for resource-limited settings and large-scale applications.
4 Conclusion
This study introduces a robust and ultra-frugal approach of employing zero-cost thread-based wearable devices to assess sanitizer quality through a dye displacement assay (DDA). The observed proportional increase in the ink migration distance is due to the increase in the ethanol concentration (55% v/v to 95% v/v) of the sanitizer samples. Additionally, the solution's viscosity and the interplay between marker dye composition and its solubility in ethanol elucidate variations in the migration behaviour. These findings offer a promising avenue for evaluating the sanitizer quality, especially in resource-limited settings. Moreover, real-world applications, including assessing commercial sanitizers for market compliance, hold great potential in gaining customer's confidence. Ultimately, this innovative approach can significantly impact public health and hygiene, offering an accessible means to evaluate sanitizer efficacy and ensure the availability of high-quality sanitizing agents, thus enhancing community safety during bacterial or viral disease outbreak.Data availability
The data supporting this article have been included as part of the ESI† and in the main manuscript.Author contributions
Pratham Joshi: writing – original draft, methodology, investigation, data curation Akhiya Shinde: writing – original draft, methodology, investigation, data curation Sukanya Sudhiram: writing – original draft, methodology, investigation, data curation. Bibhu Ranjan Sarangi: methodology, writing – review & editing, resources, project administration. Naresh Kumar Mani: conceptualization, methodology, supervision, writing – review & editing, resources, project administration, funding acquisition.Conflicts of interest
There are no conflicts to declare.Acknowledgements
We extend our special thanks to Department of Biotechnology, Manipal Institute of Technology. NKM acknowledges Dr Citartan M., Dr Praveen Kumar, Dr Vijendra Prabhu and Dr Anusha Prabhu for their fruitful discussions. We also acknowledge the help of Mr Rohitraj Ray for proof reading this manuscript. We also acknowledge the help of Dr Balachandar for helping with FTIR analysis.References
- A. S. Fauci, H. C. Lane and R. R. Redfield, N. Engl. J. Med., 2020, 382, 1268–1269 CrossRef CAS PubMed.
- C. Bambra, R. Riordan, J. Ford and F. Matthews, J. Epidemiol. Community Health, 2020, 74, 964–968 CrossRef PubMed.
- B. Kotlar, E. Gerson, S. Petrillo, A. Langer and H. Tiemeier, Reprod. Health, 2021, 18 DOI:10.1186/s12978-021-01070-6.
- D. Cucinotta and M. Vanelli, Acta Biomed., 2020, 91, 157–160 Search PubMed.
- M. Ciotti, M. Ciccozzi, A. Terrinoni, W. C. Jiang, C. Bin Wang and S. Bernardini, Crit. Rev. Clin. Lab Sci., 2020, 365–388 CrossRef CAS PubMed.
- S. P. Otto, T. Day, J. Arino, C. Colijn, J. Dushoff, M. Li, S. Mechai, G. Van Domselaar, J. Wu, D. J. D. Earn and N. H. Ogden, Curr. Biol., 2021, 31, R918–R929 CrossRef CAS PubMed.
- A. deMello, ACS Sens., 2021, 6, 4269–4271 CrossRef CAS PubMed.
- J. A. Plante, B. M. Mitchell, K. S. Plante, K. Debbink, S. C. Weaver and V. D. Menachery, Cell Host Microbe, 2021, 29, 508–515 CrossRef CAS PubMed.
- E. Okoturo and M. Amure, Int. J. Infect. Dis., 2022, 121, 166–171 CrossRef CAS PubMed.
- F. Mahmoudinobar, D. Britton and J. K. Montclare, Protein Eng. Des. Sel., 2021, 34, 1–10 CrossRef PubMed.
- O. Yaren, J. McCarter, N. Phadke, K. M. Bradley, B. Overton, Z. Yang, S. Ranade, K. Patil, R. Bangale and S. A. Benner, PLoS One, 2021, 16, 1–17 CrossRef.
- O. Damette and T. L. D. Huynh, Sci. Rep., 2023, 13, 9218 CrossRef CAS PubMed.
- T. J. Hwang, K. Rabheru, C. Peisah, W. Reichman and M. Ikeda, Int. Psychogeriatr., 2020, 32, 1217–1220 CrossRef PubMed.
- L. Cirrincione, F. Plescia, C. Ledda, V. Rapisarda, D. Martorana, R. E. Moldovan, K. Theodoridou and E. Cannizzaro, Sustainability, 2020, 12, 1–18 CrossRef.
- K. Dhama, S. K. Patel, R. Kumar, R. Masand, J. Rana, M. I. Yatoo, R. Tiwari, K. Sharun, R. K. Mohapatra, S. Natesan, M. Dhawan, T. Ahmad, T. Bin Emran, Y. S. Malik and H. Harapan, Environ. Sci. Pollut. Res., 2021, 28, 34211–34228 CrossRef CAS PubMed.
- A. P. Golin, D. Choi and A. Ghahary, Am. J. Infect. Control, 2020, 48, 1062–1067 CrossRef PubMed.
- T. Saha, P. Khadka and S. C. Das, Germs, 2021, 11, 408–417 CrossRef CAS PubMed.
- G. Kampf, J. Hosp. Infect., 2018, 98, 331–338 CrossRef CAS PubMed.
- P. Matatiele, B. Southon, B. Dabula, T. Marageni, P. Poongavanum and B. Kgarebe, Sci. Rep., 2022, 12, 1–7 CrossRef PubMed.
- Y. Ma, J. Yi, J. Ma, H. Yu, L. Luo, W. Wu, L. Jin, Q. Yang, T. Lou, D. Sun and M. Cao, Toxics, 2023, 11, 8 Search PubMed.
- M. L. Wang, Y. M. Choong, N. W. Su and M. H. Lee, J. Food Drug Anal., 2003, 11, 133–140 CAS.
- N. D. Nisbar, S. K. Jamal Khair, N. B. Bujang and A. Y. Mohd Yusop, Sci. Rep., 2023, 13, 9478 CrossRef CAS PubMed.
- S. Alam, M. M. R. Rahat, N. J. Upoma, C. Halder, S. P. Moulick, M. M. Islam, W. Liu and A. Habib, MethodsX, 2023, 11, 102274 CrossRef CAS PubMed.
- F. S. Fonseca, L. R. e Brito, M. F. Pimentel and L. B. Leal, J. Braz. Chem. Soc., 2020, 31, 1759–1763 CAS.
- C. Pasquini, M. C. Hespanhol, K. A. M. L. Cruz and A. F. Pereira, Microchem. J., 2020, 159, 105421 CrossRef CAS PubMed.
- A. M. El-Hassanein, F. R. Mansour, S. F. Hammad and A. A. Abdella, RSC Adv., 2024, 14, 8188–8194 RSC.
- W. Sukma, C. Boonyakong, T. Chaiphet and S. Chamni, Green Chem. Lett. Rev., 2024, 17, 2298982 CrossRef.
- A. Prabhu, H. Singhal, M. S. Giri Nandagopal, R. Kulal, P. Peralam Yegneswaran and N. K. Mani, ACS Omega, 2021, 6, 12667–12675 CrossRef CAS PubMed.
- A. Prabhu, G. M. S. Nandagopal, P. Peralam Yegneswaran, V. Prabhu, U. Verma and N. K. Mani, RSC Adv., 2020, 10, 26853–26861 RSC.
- A. Hasandka, A. R. Singh, A. Prabhu, H. R. Singhal, M. S. G. Nandagopal and N. K. Mani, Anal. Bioanal. Chem., 2022, 414, 847–865 CrossRef CAS PubMed.
- G. S. Selvam, T. Dheivasigamani, A. Prabhu and N. K. Mani, ACS Omega, 2022, 7, 24606–24613 CrossRef CAS PubMed.
- S. Yanniotis, G. Kotseridis, A. Orfanidou and A. Petraki, J. Food Eng., 2007, 81, 399–403 CrossRef CAS.
- S. Choi, S. Parameswaran and J.-H. Choi, Phys. Chem. Chem. Phys., 2020, 22, 17181–17195 RSC.
- H. L. Costa, T. Cousseau and R. M. Souza, Lubricants, 2023, 11 Search PubMed.
- A. Uheida, H. G. Mejía, M. Abdel-Rehim, W. Hamd and J. Dutta, J. Hazard. Mater., 2021, 406, 124299 CrossRef CAS PubMed.
- C. Gallibu, C. Gallibu, A. Avoundjian and F. A. Gomez, Micromachines, 2016, 7, 1 CrossRef PubMed.
- C. Xu, L. Cai, M. Zhong and S. Zheng, RSC Adv., 2015, 5, 4770–4773 RSC.
- A. Göpferich, Macromolecules, 1997, 30, 2598–2604 CrossRef.
- M. A. Mohamed, J. Jaafar, A. F. Ismail, M. H. D. Othman and M. A. Rahman, Fourier transform infrared (FTIR) spectroscopy, in Membrane characterization, ed. N. Hilal, A. F. Ismail, T. Matsuura and D. B. T.-M. C. Oatley-Radcliffe, Elsevier, Amsterdam, 2017, ch. 1, pp. 3–29, DOI:10.1016/B978-0-444-63776-5.00001-2.
- R. Castorina, M. Tysman, A. Bradman, S. Hoover, S. Iyer, M. Russell, D. Sultana and R. Maddalena, Int. J. Environ. Anal. Chem., 2016, 96, 1247–1263 CrossRef CAS.
- R. Safavieh, G. Z. Zhou and D. Juncker, Lab Chip, 2011, 11, 2618–2624 RSC.
- G. Vazquez, E. Alvarez and J. M. Navaza, J. Chem. Eng. Data, 1995, 40, 611–614 CrossRef CAS.
Footnotes |
| † Electronic supplementary information (ESI) available. See DOI: https://doi.org/10.1039/d4ra04379k |
| ‡ Equal contribution. |
| This journal is © The Royal Society of Chemistry 2024 |

