 Open Access Article
Crumpled graphene fully decorated with nickel-based nanoparticles applied in glyphosate detection†
Daniel A. Gonçalves *a,
Vitor H. N. Martins
 a,
Diogo D. Reis
 b,
Monize M. Silva
 *a and
Victor H. R. Souza
 *a
*a
aFaculty of Exact Science and Technology, Universidade Federal da Grande Dourados (UFGD), Dourados, MS, Brazil. E-mail: daniel.araujogoncalves@gmail.com; monizemsilva@gmail.com; victorsouza@ufgd.edu.br
bInstituto de Física, Universidade Federal de Mato Grosso do Sul (UFMS), Campo Grande, MS, Brazil
First published on 13th September 2024
Abstract
Glyphosate (Glyp), a widely used herbicide, has raised significant concerns regarding its toxicological effects and potential risks to human health, particularly concerning water pollution. Hence, there is a critical need to monitor glyphosate levels in water bodies. This study introduces a novel approach for electrochemically detecting glyphosate in aqueous environments using crumpled graphene decorated with nickel-based nanoparticles (Ni:CG) synthesized in a single step. Cyclic voltammetry and chronoamperometry techniques were employed for detection. The cyclic voltammetry analysis revealed an impressive linear range with detection and quantification limits of 2.0 × 10⁻⁹ M and 6.0 × 10⁻⁹ M, respectively. Additionally, the method demonstrated excellent accuracy and precision at low concentrations, as evidenced by successful glyphosate recovery from distilled-deionized water and spike-and-recovery tests, at a significant level of 99.9%. Furthermore, interference tests conducted via chronoamperometry on the presence of Cu2+, Co2+, and Fe3+ cations showcased the superior performance of the Ni:CG electrochemical sensor. The synthesis of crumpled graphene-/nickel-based composites offers a promising avenue for the future of on-site glyphosate detection, presenting a robust and efficient solution to environmental challenges.
1. Introduction
Glyphosate, scientifically designated as N-(phosphonomethyl)glycine, commonly referred to as Glyp, was initially introduced into agricultural practices by Monsanto under the product name Roundup®.1 Glyphosate, widely recognized and authorized for use in over 130 countries, has permeated diverse agricultural landscapes, encompassing more than 100 crop varieties and spawning a repertoire of over 750 formulations tailored to specific agricultural requirements. The United States, Brazil, and Australia contribute significantly to this array, boasting numerous sanctioned formulations.2,3 This proliferation of Glyp-based formulations has raised concerns about its potential transformation into an environmental contaminant, accentuated by its propensity for ecosystem accumulation and subsequent adverse effects4 and the necessity for vigilant monitoring aligned with Sustainable Development Goals.5,6However, precise quantification of Glyp presents a challenge due to its molecular structure, devoid of a chromophore, necessitating derivatization for accurate measurement. Various analytical techniques are employed for Glyp determination, including chromatographic methods requiring derivatization or integration with other approaches,6,7 fluorescence spectroscopy,7,8 capillary electrophoresis, and enzyme-linked immunosorbent assay.7,9 Each method has strengths and limitations, highlighting the complexity and multifaceted nature of Glyp analysis and limitations tied to a restricted linear dynamic range.10
Electrochemical sensors have emerged as a promising avenue of exploration, offering cost-effectiveness, straightforward operational procedures, and advantageous characteristics such as high sensitivity, specificity, and selectivity.7,9,10 A significant hurdle arises: Glyp does not exhibit inherent electrochemical activity, necessitating electrode modifications to enable its detection. Various materials have been extensively investigated in the scientific literature for electrochemical Glyp assessment, including metal–organic frameworks,11 chitosan,12 gold nanoparticles,13 zeolites,14 carbon nanotubes,15 diverse carbon-based electrodes, and sensors utilizing metal nanoparticles.10 Of particular interest are electrochemical sensors employing metal nanoparticles supported on carbon structures, like graphite oxide,16 graphene oxide,17 and crumpled graphene.18 These materials possess notable electrochemical properties due to their large surface area and enhanced electroactive activity.19 Consequently, they find practical utility in applications such as the electrochemical sensing of Glyp in environmental water samples. These sensors, being portable, rapid, and exceptionally sensitive, represent tools for environmental monitoring.20
Numerous research findings have highlighted a significant phenomenon: intensified Glyp adsorption facilitated by coordination with copper surfaces in copper nanoparticle-based sensors, particularly within a pH range of 5.5 to 6.0.18,21 This adsorption is attributed to improving Glyp's functional group's negative charge, enhancing adsorption efficacy.21 The adsorbed Glyp layer avoids the diffusion of Cu2+ ions, thereby reducing the current of the Cu0/Cu+ couple on the electrode surface.7,22 It is noteworthy that aside from copper, other metallic ions such as Co2+, Ni2+, Zn2+, and Fe3+ exhibit strong affinities with Glyp, potentially causing significant interferences in Glyp detection, even in conventional methods.23 However, using these ions under suitable conditions, there is potential for employing reverse engineering techniques to develop biosorbents for glyphosate removal from environmental waters.24,25
Recent reports indicate glyphosate's ability to bind to Ni2+ and Cu2+ ions on passivated metallic electrode surfaces, achieved through cathodic activation of metal surfaces followed by exposure to positive potentials in an alkaline environment. This process leads to a less conductive metal oxide layer due to oxidation, dissolution, and deposition over alkaline conditions, facilitating the transformation into NiOOH. Electrical impedance spectroscopy (EIS) revealed a heterogeneous electron transfer, likely attributed to glyphosate's ability to form complexes with metallic ions.23,24 However, it is crucial to note that findings regarding the interaction of Glyp with Ni2+ on passivated nickel electrodes were less conclusive, showing less favorable outcomes than copper electrodes.22 This report marks an initial exploration into nickel-based nanoparticle sensors for Glyp detection, highlighting the need for further research and enhancements in this area due to the limited data available.
Our proposal entails developing and practically applying sensors that rely on transition metal-based nanoparticles, specifically nickel-based nanoparticles deposited on crumpled graphene (Ni:CG). The synthesis of this composite will adhere to established protocols to maintain an electroactive surface conducive to electrochemical sensing. As proof of concept, we conducted electrochemical characterization and quantification of Glyp using cyclic voltammetry (CV) and chronoamperometry in water samples. Subsequently, we employed Ni:CG as electrochemical sensors, aiming to optimize analytical parameters for Glyp detection. Our research also involves exploring procedures for Glyp addition and recovery in fortified samples and assessing potential interference from other ions that may affect method accuracy. This work establishes the first comprehensive report detailing the synthesis, characterization, and practical electroanalytical application of Ni:CG nanocomposites in the specialized field of Glyp detection.
2. Experimental
2.1. Synthesis of crumpled graphene (CG)/nickel-based nanocomposites
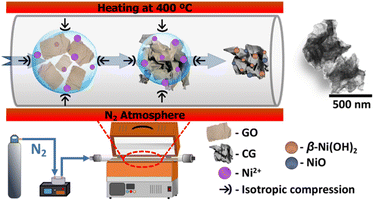
As detailed elsewhere, we synthesized the composite of crumpled graphene structures decorated with nickel-based nanoparticles.20,26 The experimental procedure used for fabricating these composite is depicted in Scheme 1. Briefly, a mixture of graphene oxide27 and nickel(II) acetate tetrahydrate (Ni(OCOCH3)2·4H2O from Sigma-Aldrich), each at a concentration of 1 mg mL−1, was atomized – using an atomizer with ultrasonic frequency of 1.7 MHz and an atomization rate of 2.6 mL min−1 – within a tubular furnace at 400 °C under nitrogen gas flow of 1 L min−1 at ambient pressure. The resulting composite (referred as Ni:CG) was collected at the end of the tubular furnace using a polytetrafluoroethylene (PTFE) membrane filter. The solid material obtained underwent a series of washing steps involving deionized water and acetone, thereby eliminating residual impurities. Ultimately, the composite was dried at 60 °C.2.2. Materials characterization
The crystalline arrangement of the nickel-based nanoparticles within the CG structure was determined using a Shimadzu XRD-6000 instrument equipped with Cu Kα radiation (λ = 1.5418 Å). The Ni:CG powder was assembled over a glass substrate for analysis. To investigate the morphology, scanning electron microscopy SEM-FEG/TESCAN (MIRA-3) was conducted at an accelerating voltage of 10 kV and a working distance of 5 mm. Energy-dispersive X-ray spectroscopy (EDS) mapping was acquired using the SEM-FEG at a working distance of 15 mm. Samples were prepared by dispersing them in isopropanol, drop-casting the materials over a silicon substrate and drying them in an oven at 40 °C for 30 minutes. High-resolution transmission electron microscopy (HRTEM) images were acquired using an HRTEM/JEOL (JEM-F200) instrument operating at 200 kV. The composite was drop-casted onto copper grids covered by holey carbon film and dried in an oven at 40 °C for 30 minutes. The EDS spectrum was also acquired from the HRTEM instrument. The X-ray photoelectron spectroscopy (XPS) analyses were conducted using an Escalab Xi+ instrument (Thermo Scientific). The incident monochromatic X-ray beam, generated from an aluminum (Al) target at 1486.6 eV, was focused on a 900 μm diameter spot surface. The electron energy analyzer was operated with a pass energy of 20 eV to acquire high-resolution spectra of the Ni peaks. A step size of 0.1 eV was employed, and each peak was scanned thirty times in three sample positions. Before transferring the samples to the analysis chamber, the introduction chamber underwent evacuation for 12 hours, reaching a final pressure of 4 × 10⁻⁸ mbar. Data collection occurred under a base pressure of 8 × 10⁻¹⁰ mbar in the analysis chamber. The binding energies of the photoelectrons were calibrated using the C (1s) photoelectron line (BE = 284.8 eV).2.3. Preparation of the modified electrode
The modified electrode was prepared upon a Glass Carbon Electrode (GCE) substrate. The surface of the GCE was cleared by polishing it using Al2O3 powder with a diameter of 0.05 μm, followed by sequential treatments with ultrapure water over 5 minutes. After the precise polishing procedure, the electrode is immersed in a solution comprising 0.5 mol L−1 of sulfuric acid, facilitating the crucial activation phase. Afterward, the cyclic voltammetry (CV) technique was carefully executed, entailing a cyclic scan over a voltage range from −0.1 V to 1.0 V at a scan rate of 50 mV s−1, and the procedure persisted until a state of current stabilization was attained. Upon completing this comprehensive cleaning and activation stage, the electrodes were subjected to the subsequent surface modification.An automated micropipette (Transferpette® electronic 0.5–10.0 μL) was employed to dispense precisely 10.00 μL of a solution containing crumpled graphene decorated with nickel-based nanoparticles (denoted as Ni:CG) at a concentration of 1.0 mg mL−1, carefully prepared in ultrapure water. This solution was precisely deposited onto the surface of the Glassy Carbon Electrode (GCE) at room temperature and dried in an oven at 40 °C for 1 hour, resulting in what is known as Ni:CG/GCE. Subsequently, this modified electrode was immobilized with 5.00% (w/v) Nafion®-isopropanol at room temperature and used for analysis after 5 minutes.
2.4. Electrochemical measurements
Standard solutions were prepared using initial 0.01 M glyphosate stock solutions in ultrapure water (R ≥ 18.2 MΩ cm – OS 20 LTXE Gehaka). These stock solutions were derived from a commercial sample of Roundup WG® and subsequently subjected to a comprehensive purification process based on the methodology established in the literature.18,28 Following this, the standard solutions served a dual purpose. Primarily, they played a vital role in generating spiked samples during the characterization phase, employing the Cyclic Voltammetry (CV) technique. Secondly, they were used in addition-recovery experiments conducted through chronoamperometry. For both electrochemical methodologies, a stepwise increment of 10 μL of Glyp solution was systematically poured into the electrolyte solution, encompassing a concentration range from 5.00 to 50.00 × 10⁻⁶ mol L−1 (μM).Solutions of sodium hydroxide (NaOH) and potassium hydroxide (KOH), both having a concentration of 0.10 M, were selected to refine the experimental parameters. This choice aligns with the recommendations in prior scholarly contributions about materials encompassing nickel oxide (NiO) nanoparticles.19,29 The calibration curves are showcased through the utilization of the inverted axis method, a choice guided by its inherent resilience, particularly in circumstances wherein the complex composition of a sample matrix mandates the adoption of the standard additions technique.30–32
Chronoamperograms were undertaken, focusing on the progressive introduction of distinct substances into the solution (i.e., Glyp concentration of 50.00 μM). Specifically, this encompassed Cu2+, Co2+, and Fe3+ at a concentration of 5.00 μM. This analysis aimed to gauge the material's resilience and consistency in the presence of various interfering agents within the solution.
2.5. Instrumentation
All experimental procedures were conducted within a glass electrochemical cell with a volumetric capacity of 10.0 mL, employing a three-electrode configuration and maintaining constant magnetic stirring. The setup encompassed a GCE featuring a well-defined geometric surface area of 0.707 cm2, functioning as the working electrode (W.E.). A platinum plate served as the auxiliary electrode (A.E.), while an Ag|AgCl electrode, immersed in a saturated potassium chloride (KCl) solution, functioned as the reference electrode (R.E.). Cyclic voltammograms and chronoamperometric measurements were performed using a portable bipotentiostat/galvanostat μ-Autolab Type III (Metrohm Autolab, Utrecht, Netherlands) with the aid of Nova 2.1 Software. A scan rate of 50 mV s−1 was adopted for CV, and, according to the chronoamperometric technique, the additions are taken at an interval time of 0.02 s.3. Results and discussion
3.1. Morphological and structural characterization
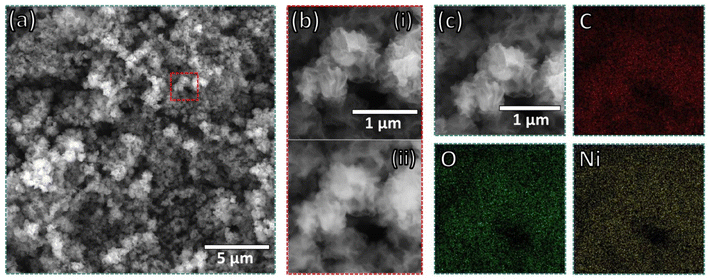
The method of spraying the dispersion of GO and metal precursor onto a heated quartz tube at 400 °C is an effective method for producing crumpled graphene decorated with transition metal-based nanoparticles.18–20 This process incorporates the metal-based species throughout the crumpled graphene structure. In Fig. 1(a), a considerable number of CG structures decorated with nickel-based nanoparticles (Ni:CG) can be seen, which arises from the two-dimensional structure of graphene being modified into the three-dimensional structure of CG. This structural modification provides graphene-based materials with well-defined ridges and vertices, as shown in Fig. 1(b–i), derived from the isotropic compression process of the droplets that confine the graphene oxide sheets during the spray passage inside the heated tube.At higher magnifications (Fig. 1(b-i)) in SEM micrographs, the morphology of the CG exhibited a homogeneity on its surface, with the presence of nickel-based nanoparticles. The bright image on the BSE micrograph (Fig. 1(b-ii)) confirms the nickel-based nanoparticles on the surface of the CG. Similarly, a homogeneous distribution of nickel all over the surface of CG was observed in the elemental mapping obtained by EDS in Fig. 1(c). The presence of oxygen species throughout the carbon nanostructure may be assigned for two reasons: (i) the presence of oxygen groups on crumpled graphene, indicating that the temperature applied to produce the Ni:CG composites is not high enough to thermally reduce the graphene oxide, and (ii) the presence of Ni(OH)2/NiO-based nanoparticles decorating the CG.
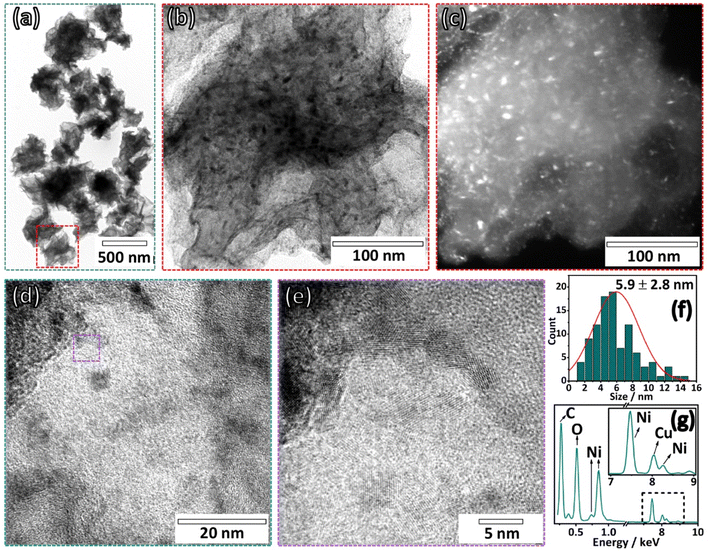
The HRTEM images of the CG:Ni composite in Fig. 2 present details of the nanocomposite. The paper ball-like morphology of the CG structure is presented in the bright field image in Fig. 2(a), with an average size of around 468 ± 126 nm. In the bright field image in high magnification shown in Fig. 2(b), there is evidence that the graphene sheets are heavily crumpled and wholly decorated with nanoparticles, more evident in the dark field image shown in Fig. 2(c). The presence of nanoparticles is observed in the high-resolution image in Fig. 2(d) and (e), with an average size of around 5.9 ± 2.8 nm, as depicted in the histogram in Fig. 2(f). The presence of nickel species in the material is seen in the EDS spectrum in Fig. 2(g), confirming the one-step synthesis of the Ni:CG composite. The peak corresponding to copper species is related to the copper grid used to drop-cast the sample for analysis.
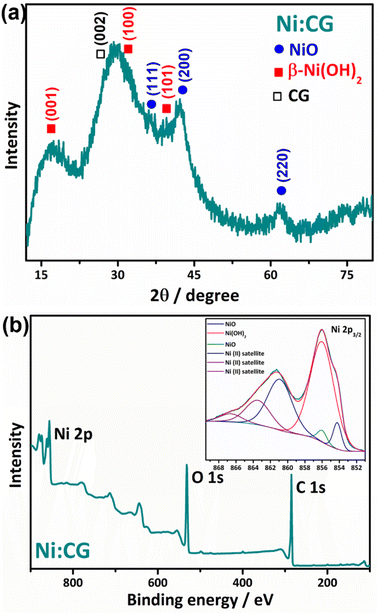
The results concerning the crystalline and chemical structure of the Ni:CG composite are depicted in Fig. 3. Throughout the diffractogram of Ni:CG composite in Fig. 3(a), the peak at 2θ value of 26.7° assigned to the (002) plane of graphene overlaps with peaks related to two different nickel-based materials: (i) β-Ni(OH)2, with peaks at 2θ value of 17.1°, 32.3°, and 39.0° assigned to (001), (100), and (101) planes (JCPDS 14-0117), respectively; and (ii) NiO, with peaks at 2θ value of 36.3°, 42.2°, and 61.7° attributed to (111), (200), and (220) planes (JCPDS 47-1049), respectively.33–36 The presence of small nickel-based nanoparticles (as confirmed by HRTEM analysis) alongside crumpled graphene's non-organized structure results in a low crystallinity of the composite. The chemical composition of the Ni:CG composite is depicted through the XPS spectrum in Fig. 3(b). The survey spectrum exhibits peaks ranging from 285.0 to 293.5 eV for the C (1s), from 531.7 to 538.5 eV for the O (1s), and from 855.9 to 887.5 eV corresponding to Ni (2p) species.
The high-resolution XPS spectrum (inset in Fig. 3 (b)) of the Ni 2p3/2 peak shows that nickel is oxidized in the Ni2+ state, forming the NiO and Ni(OH)2 species. The atomic percentage of Ni species in the Ni:CG composite corresponds to 88.2% of Ni(OH)2 species and 11.8% of NiO species.
The spray-drying process adopted herein to produce the Ni:CG composite results in a carbon nanostructure fully decorated with a mixture of Ni(OH)2/NiO nanoparticles. From this methodology, different steps co-occur to result in the final Ni:CG composite: (i) the water droplets go from liquid to gas phase throughout the tubular furnace, crumpling the graphene sheets; (ii) the functional groups are removed from graphene oxide under the temperature, resulting in reduced crumpled graphene structures; and (iii) the Ni(OH)2 species (produced from the hydrolysis of Ni2+ ions in water) are decomposed to NiO species at high temperatures.37,38 Since the flying time of each droplet throughout the tubular furnace is too short, most Ni(OH)2 nanoparticles remain in their initial form, and a small portion of NiO is produced.
3.2. Electrochemical characterization and optimization
The Ni:GC composite was applied to determine Glyp in water samples and an optimization procedure was carried out to determine the most favorable operating conditions. Fig. S1 in the ESI† illustrates the optimizations adopted in the presence of electrolytes NaOH and KOH varying concentrations from 0.01 to 0.1 M. The composites prepared on the surface of the GCE were subjected to 20 cycles of cyclic voltammetry, and the average voltammograms are presented in Fig. S1(a).† The obtained CV profiles indicate well-defined anodic and cathodic regions corresponding to the Ni(OH)2/NiOOH conversion, characteristic of Ni-based nanoparticles using 0.1 M NaOH as the electrolyte.19,39,40 This increase in the intensity of both anodic and cathodic current peaks may be related to potential modifications in the morphology and structure of Ni-based nanoparticles, leading to the conversion into NiOOH, along with an increase in the number of electroactive sites due to surface cleaning, as described in previous literature works.39–41To confirm the optimal electrolyte condition, the voltammograms obtained with NaOH as the electrolyte are compared to 0.1 M B-R buffer solutions at different pH levels (Fig. S1(b)†). The results confirm 0.1 M NaOH as the best-supporting electrolyte for the study. Unless otherwise specified, this electrolyte (0.1 M NaOH) is used in all subsequent working conditions. Subsequently, the time required to stabilize the composite throughout one hundred consecutive voltammetric cycles was carried out and is presented as illustrated in Fig. S2(a).† Five potentials were followed in the function of the number of CV cycles within the anodic regions (Fig. S2(b)†) and the cathodic region (Fig. S2(c)†). As shown in Fig. S2(b) and (c),† the potentials at 0.516 V (anodic) and 0.389 V (cathodic) have shown a small variation along the electrochemical analysis, exhibiting a plateau starting after just twenty cycles. Both potentials were used for the continuation of subsequent assessments.
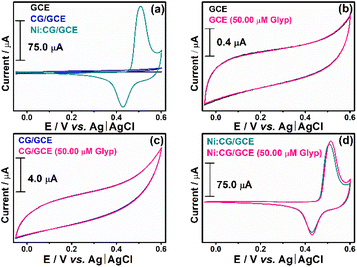
Fig. 4(a) highlights the electroactive area of GCE, CG/GCE, and Ni:CG/GCE under pre-established conditions (0.1 M NaOH solution and a scan rate of 50 mV s−1). The addition of 50.0 μM of Glyp as depicted in Fig. 4(a) is illustrated respectively in Fig. 4(b)–(d). No variation in the electrochemical profile in the presence of Glyp is noticed for GCE and CG/GCE electrodes. Nevertheless, an improvement in the faradaic current is observed for Ni:CG/GCE electrode, which confirms the sensitivity of the composite in the presence of Glyp. Building upon these predefined conditions, we evaluated sensitivity to the anodic and cathodic peak currents, the figure of merit, and sensor performance through addition and recovery tests and in the presence of interferences.
3.3. Limits of detection
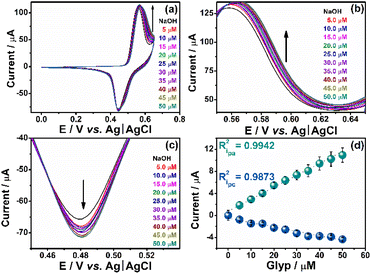
Once we establish the electrochemical conditions, we determine the linear range as well as the limits of detection (LD) and quantification (LQ) by adding ten consecutive aliquots of 5 μL of 0.01 M Glyp into a 10.0 mL electrochemical cell, as illustrated in Fig. 5(a). The anodic (Fig. 5(b)) and cathodic (Fig. 5(c)) regions demonstrate the sensor's sensitivity to Glyp additions. The linearity observed at the anodic peak (0.516 V) and the cathodic peak (0.389 V) signifies the correlation coefficient (R2) value that exhibits the highest degree of correlation for the anodic peak. Given this observation, we determine the figure of merit and various performance metrics for the proposed sensor at the potential of 0.516 V.We calculated the LD and LQ according to the guidelines established by IUPAC,42 which involve three times the standard deviation of the blank signal in 0.1 M NaOH, divided by the slope of the calibration curve derived from the conventional external calibration method (Fig. 5(d)). The determined LD and LQ for Ni:CG were found to be 2.00 × 10⁻⁹ M (nM) – corresponding to 0.34 μg L−1 – and 6.00 × 10⁻⁹ M (nM) – corresponding to 1.01 μg L−1 – respectively, within the linear range spanning from 5.00 to 25.00 μM. The LD and LQ values in accordance with the stipulations outlined by the European Union (EU), Brazilian regulatory norms, and the directives established by the United States Environmental Protection Agency (USEPA) for the monitoring of Glyp in drinking water, with concentrations of 0.59 × 10⁻⁹ M (0.1 μg L−1), 2.96 × 10⁻⁶ M (500.0 μg L−1), and 4.14 × 10⁻⁶ M (700.0 μg L−1), respectively.43,44 The acquired values are consistent with those reported in the existing literature (Table S1 in the ESI†).
3.4. Accuracy and precision
We evaluated the accuracy of the proposed method by conducting spike-and-recovery experiments using cyclic voltammetry. We used water solutions containing analyte concentrations of 5.00, 10.00, and 15.00 μM. Next, we added successive amounts of 5.00 μL of a 0.01 M Glyp stock solution into the fortified samples within a 10 mL electrochemical cell. We obtained satisfactory recoveries for all analytes. As shown in Fig. 6, following the calibration curves executions, the recovery percentages did not exhibit statistically significant differences (ANOVA) with a highly similar distribution of individual results in all cases, at a significance level of 99.9% (p > 0.001). The relative standard deviation (% RSD) ranged from 5.6–8.3%.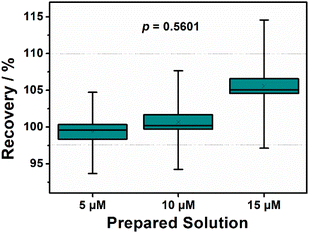 | ||
| Fig. 6 Boxplot representing the analyte percent recovery to different concentrations spiked—analytical curves obtained by CV at liner range of 5.0–25.0 μM. | ||
This data underscores the notable precision demonstrated by the Ni:CG composite, even at low concentrations (i.e., 5.00 μM). Robust chromatographic techniques combined with tandem mass spectrometry (e.g., LC/MS/MS or UHPLC-MS/MS) are often required for such sensitivity levels.45–47 In this context, for external validation, the fortified solution of 15.0 μM glyphosate underwent analysis following the method POPMET008-R06 by Agrosafety® (Determination of Substituted Glycines in Aqueous Matrices by LC-MS/MS), as described in the Standard Methods for the Examination of Water and Wastewater.48 The recoveries for fortified samples were determined to be 15.84 ± 1.31 for Ni:CG and 14.72 ± 4.49 for LC-MS/MS analysis. Accuracy was corroborated through a t-test comparing the values obtained from the sensor with those from LC-MS/MS determinations. The calculated t-value of 0.4325 indicated no statistically significant difference between the data obtained from LC-MS/MS and the Ni:CG sensor presented in this study (critical t-value 2.7764, with a 95% confidence level).
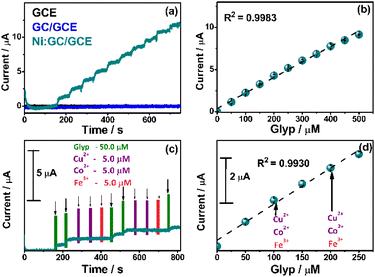
Many researchers advocate using chronoamperometry in systems involving redox species, even though cyclic voltammetry is a readily implementable technique available on all commercial potentiostats.49–51 This preference stems from the fact that chronoamperometry is considered a more direct approach for determining the concentrations of the analytes of interest than cyclic voltammetry. When dealing with electroactive species that are not entirely reversible, chronoamperometry may represent a more suitable selection, enabling a more precise analysis of these species. In this context, a novel application for Glyp detection was conducted employing the chronoamperometry technique (Fig. 7). The method's accuracy and the composite's reproducibility are assessed in the presence of interferences capable of forming complexes with the analyte in aqueous solution, leading to significant disruptions in the analytical signal.
Fig. 7(a) demonstrates the sensitivity of the GCE, bare CG, and Ni:CG composite. It is clear that the Ni:CG composite exhibits superior sensitivity for Glyp detection in comparison to the GCE electrode and the bare (CG). Fig. 7(b) illustrates the linear range of the sensor after ten consecutive additions of 50.00 μM of the analyte of interest. While performing five consecutive additions of 50.00 μM Glyp at 60 second intervals (Fig. 7(c)), we introduced ions Cu2+, Co2+, and Fe3+ at a concentration of 5.0 μM. We evaluated these ion concentrations based on the USEPA and the Brazilian CONAMA guidelines.52,53 The acceptable concentration for Fe cations in drinking water is below 0.30 mg L−1 (approximately ≈ 5.0 μM). Cu and Co cations' concentrations in drinking water already surpass acceptable levels (i.e., 0.009 mg L−1 and 0.05 mg L−1, respectively).
As detailed in the literature, ions such as Cu2+ and others serve as potent complexing agents for Glyp and are frequently utilized in the design of novel sensors for the determination of the proposed analyte.7,18,54,55 However, no significant deviations in the linearity of the analytical curve were observed in the presence of such interferences, indicating an exceptional reproducibility of the Ni:CG composite even under challenging conditions.
This assessment suggests that the naturally occurring concentrations of Cu2+, Co2+, and Fe3+ cations, which may be present in aqueous media, did not hinder the Ni-Glyp electrooxidation process on the sensor's surface (Fig. 7(d)).
Under these circumstances, the electrochemical sensor exhibited outstanding performance even in the presence of interference.
The interaction between the Ni-based nanoparticles' active sites and the crumpled graphene's expansive porous surface facilitates the detection of glyphosate. This study opens avenues for additional investigations into the electrochemical detection of various pesticides and the exploration of methodologies to produce a diverse range of crumpled graphene-based composites with potential utility in agricultural contexts.
4. Conclusions
The analysis of low Glyp concentrations was accomplished by utilizing cyclic voltammetry (CV) employing a Ni:CG nanocomposite as an electrochemical sensor. This nanocomposite was synthesized using the spray-pyrolysis method and subsequently deposited onto the surface of a GCE. The determined detection and quantification limits, 2.0 nM and 6.0 nM, respectively, underscored the sensitivity of electrochemical Glyp detection achieved through the Ni:CG nanocomposite. This sensitivity is on par with that obtained through robust chromatographic techniques. Notably, the electrochemical sensor exhibits the requisite sensitivity to comply with EU, Brazilian regulatory norms, and USEPA, which stipulate maximum permissible glyphosate concentrations in drinking water. The validity of all measurements was established via addition and recovery tests (CV), including assessments involving the introduction of interferents (chronoamperometry). These tests consistently yielded results with outstanding coefficients of variation (%RSD). The practical applications of this research have demonstrated the substantial potential of employing this cost-effective and sensitive electrode as a viable electrochemical sensor for quantifying Glyp within aqueous systems.Moreover, the affordability of nickel precursor salts and the prospect of generating crumpled graphene precursors from agro-industrial byproducts, such as biochar, render these composites commercially appealing for forthcoming electroanalysis endeavors. Notably, particular attention should be exercised during electrode preparation, as crumpled graphene's high processability and dispersibility are contingent upon the specific electrochemical system employed. In terms of prospects, we aim to advance our work in developing electroactive nanocomposites that can be integrated into disposable chips, combined with portable potentiostats, to facilitate on-site monitoring of various pesticides in environmental samples, including water, food, and soil.
Author contributions
Daniel A. Gonçalves: conceptualization, validation, investigation, formal analysis, writing – original draft, writing – review & editing. Vitor H. N. Martins: investigation, validation, formal analysis, writing – original draft. Monize M. Silva: investigation, validation, formal analysis, writing – review & editing. Diogo D. Reis: formal analysis, writing – original draft. Victor H. R. Souza: conceptualization, validation, formal analysis, writing – original draft, writing – review & editing, supervision, project administration, funding acquisition.Conflicts of interest
There are no conflicts to declare.Acknowledgements
The authors want to acknowledge Conselho Nacional de Desenvolvimento Científico e Tecnológico (CNPq-Brazil), Fundação de Apoio ao Desenvolvimento do Ensino, Ciência e Tecnologia do Estado de Mato Grosso do Sul (FUNDECT – #83/013.569/2023, #71/055.441/2022, and #71/039.199/2022). V. H. R. S. acknowledges CNPq (Grant #423918/2018-4), the National Institute of Science and Technology of Nanomaterials for Life (INCT NanoLife – Grant #406079/2022-6), and the Brazilian Institute of Science and Technology (INCT) in Carbon Nanomaterials. This study was financed in part by the Coordenação de Aperfeiçoamento de Pessoal de Nível Superior (CAPES), Brazil, finance code 001. The authors acknowledge the Materials Group of Chemistry at the Federal University of Paraná for the SEM-FEG measurements and the LCPNano at the Federal University of Minas Gerais (UFMG) for the XPS measurements.Notes and references
- T. Winfield, W. Bashe and T. Baker, Methods for the determination of organic compounds in drinking water: supplement I, US Environmental Protection Agency, EPA/600/4-90/020, 1990 Search PubMed.
- A. Valavanidis, Glyphosate, the Most Widely Used Herbicide. Health and Safety Issues. Why Scientists Differ in Their Evaluation of Its Adverse Health Effects, Sci. Rev., 2018 Search PubMed.
- J. G. de C. Marques, K. J. da S. Veríssimo, B. S. Fernandes, S. R. de M. Ferreira, S. M. G. L. Montenegro and F. Motteran, Bull. Environ. Contam. Toxicol., 2021, 107, 385–397 CrossRef CAS PubMed.
- M. Cuhra, T. Bøhn and P. Cuhra, Front. Environ. Sci., 2016, 4, 28 Search PubMed.
- C. M. Viana, D. Freire, P. Abrantes, J. Rocha and P. Pereira, Sci. Total Environ., 2022, 806, 150718 CrossRef CAS PubMed.
- K. K. K. Gains, N. G. K. Roland, K. Y. Urbain and D. Ardjouma, Chromatographia, 2022, 85, 655–664 CrossRef CAS.
- L. A. Zambrano-Intriago, C. G. Amorim, J. M. Rodríguez-Díaz, A. N. Araújo and M. C. B. S. M. Montenegro, Sci. Total Environ., 2021, 793, 148496 CrossRef CAS PubMed.
- C. Y. Jeong, S. K. Dodla and J. J. Wang, Chemosphere, 2016, 142, 4–13 CrossRef CAS PubMed.
- L. Carretta, A. Cardinali, E. Marotta, G. Zanin and R. Masin, J. Chromatogr. A, 2019, 1600, 65–72 CrossRef CAS PubMed.
- A. L. Valle, F. C. C. Mello, R. P. Alves-Balvedi, L. P. Rodrigues and L. R. Goulart, Environ. Chem. Lett., 2019, 17, 291–317 CrossRef CAS.
- A. R. B. S. Galaço, L. T. Jesus, R. O. Freire, M. de Oliveira and O. A. Serra, J. Agric. Food Chem., 2020, 68, 9664–9672 CrossRef PubMed.
- V. Sok and A. Fragoso, Microchim. Acta, 2019, 186, 1–8 CrossRef CAS PubMed.
- C. Vaghela, M. Kulkarni, S. Haram, R. Aiyer and M. Karve, Int. J. Biol. Macromol., 2018, 108, 32–40 CrossRef CAS PubMed.
- S. Zavareh, Z. Farrokhzad and F. Darvishi, Ecotoxicol. Environ. Saf., 2018, 155, 1–8 CrossRef CAS PubMed.
- L. A. Zambrano-Intriago, C. G. Amorim, A. N. Araújo, D. Gritsok, J. M. Rodríguez-Díaz and M. C. Montenegro, Sci. Total Environ., 2023, 855, 158865 CrossRef CAS PubMed.
- J. S. Santos, M. S. Pontes, E. F. Santiago, A. R. Fiorucci and G. J. Arruda, Sci. Total Environ., 2020, 749, 142385 CrossRef CAS PubMed.
- S. Setznagl and I. Cesarino, Int. J. Environ. Anal. Chem., 2022, 102, 293–305 CrossRef CAS.
- D. A. Gonçalves, L. M. Alencar, J. P. B. Anjos, E. S. Orth and V. H. R. Souza, Mater. Today Commun., 2023, 36, 106746 CrossRef.
- A. E. Silva, V. H. de Souza and E. G. Neiva, Appl. Surf. Sci., 2023, 622, 156967 CrossRef CAS.
- L. H. Nonaka, T. S. D. Almeida, C. B. Aquino, S. H. Domingues, R. V. Salvatierra and V. H. R. Souza, ACS Appl. Nano Mater., 2020, 3, 4859–4869 CrossRef CAS.
- M. del C. Aguirre, S. E. Urreta and C. G. Gomez, Sens. Actuators, B, 2019, 284, 675–683 CrossRef CAS.
- E. V. Sierra, M. A. Méndez, V. M. Sarria and M. T. Cortés, Quim. Nova, 2008, 31, 220–226 CrossRef CAS.
- T. Undabeytia, E. Morillo and C. Maqueda, J. Agric. Food Chem., 2002, 50, 1918–1921 CrossRef CAS PubMed.
- P. Gros, A. A. Ahmed, O. Kühn and P. Leinweber, Environ. Monit. Assess., 2019, 191, 1–12 CrossRef CAS PubMed.
- L. Ramrakhiani, S. Ghosh, A. K. Mandal and S. Majumdar, Chem. Eng. J., 2019, 361, 1063–1077 CrossRef CAS.
- L. M. Alencar, A. W. B. N. Silva, M. A. G. Trindade, R. V. Salvatierra, C. A. Martins and V. H. R. Souza, Sens. Actuators, B, 2022, 360, 131649 CrossRef CAS.
- F. Kim, J. Luo, R. Cruz-Silva, L. J. Cote, K. Sohn and J. Huang, Adv. Funct. Mater., 2010, 20, 2867–2873 CrossRef CAS.
- R. Hellinger, V. B. Silva and E. S. Orth, Pure Appl. Chem., 2020, 92, 601–616 CrossRef CAS.
- S. Amin, A. Tahira, A. Solangi, R. Mazzaro, Z. H. Ibupoto and A. Vomiero, Anal. Methods, 2019, 11, 3578–3583 RSC.
- D. A. Goncalves, B. T. Jones and G. L. Donati, Microchem. J., 2016, 124, 155–158 CrossRef CAS.
- J. T. Sloop, D. A. Gonçalves, L. M. O'Brien, J. A. Carter, B. T. Jones and G. L. Donati, Anal. Bioanal. Chem., 2021, 413, 1293–1302 CrossRef CAS PubMed.
- D. A. Gonçalves, G. L. D. Estadulho, K. Guima and A. Martins, Talanta, 2022, 250, 123705 CrossRef PubMed.
- Y. R. Kumar, K. Deshmukh, M. M. N. Ali, G. Abhijay, W. A. Al-Onazi, A. M. Al-Mohaimeed and S. K. Pasha, Environ. Res., 2022, 203, 111842 CrossRef CAS PubMed.
- K. Maniammal, G. Madhu and V. Biju, Phys. E, 2017, 85, 214–222 CrossRef CAS.
- L. Mao, C. Guan, X. Huang, Q. Ke, Y. Zhang and J. Wang, Electrochim. Acta, 2016, 196, 653–660 CrossRef CAS.
- Y. Liu, R. Wang and X. Yan, Sci. Rep., 2015, 5, 11095 CrossRef PubMed.
- M. Aghazadeh, A. N. Golikand and M. Ghaemi, Int. J. Hydrogen Energy, 2011, 36, 8674–8679 CrossRef CAS.
- D.-B. Kuang, B.-X. Lei, Y.-P. Pan, X.-Y. Yu and C.-Y. Su, J. Phys. Chem. C, 2009, 113, 5508–5513 CrossRef CAS.
- M. Xiao, Y. Tian, Y. Yan, K. Feng and Y. Miao, Electrochim. Acta, 2015, 164, 196–202 CrossRef CAS.
- R. Wang, C. Xu and J.-M. Lee, Nano Energy, 2016, 19, 210–221 CrossRef CAS.
- E. G. Neiva, M. M. Oliveira, L. H. Marcolino Jr and A. J. Zarbin, J. Colloid Interface Sci., 2016, 468, 34–41 CrossRef CAS PubMed.
- G. L. Long and J. D. Winefordner, Anal. Chem., 1983, 55, 712A–724A CrossRef CAS.
- P. Butmee, A. Samphao and G. Tumcharern, J. Hazard. Mater., 2022, 437, 129344 CrossRef CAS PubMed.
- C. Panis, L. Z. P. Candiotto, S. C. Gaboardi, S. Gurzenda, J. Cruz, M. Castro and B. Lemos, Environ. Int., 2022, 165, 107321 CrossRef CAS PubMed.
- J. C. Ulrich and P. L. Ferguson, Anal. Bioanal. Chem., 2021, 413, 3763–3774 CrossRef CAS PubMed.
- C. Campanale, M. Triozzi, C. Massarelli and V. F. Uricchio, J. Chromatogr. A, 2022, 1672, 463028 CrossRef CAS PubMed.
- N. L. Pires, E. P. de Araújo, E. C. Oliveira-Filho and E. D. Caldas, Sci. Total Environ., 2023, 875, 162499 CrossRef CAS PubMed.
- E. W. Rice, R. B. Baird, A. D. Eaton and L. S. Clesceri, American Water Works Association, Water Environment Federation, 2012 Search PubMed.
- D. Balciunas, D. Plausinaitis, V. Ratautaite, A. Ramanaviciene and A. Ramanavicius, Talanta, 2022, 241, 123252 CrossRef CAS PubMed.
- D. C. Poudyal, V. N. Dhamu, M. Samson, S. Muthukumar and S. Prasad, Langmuir, 2022, 38, 1781–1790 CrossRef CAS PubMed.
- Y. Zhao, Y. Yan, C. Liu, D. Zhang, D. Wang, A. Ispas, A. Bund, B. Du, Z. Zhang, P. Schaaf and X. Wang, ACS Appl. Mater. Interfaces, 2022, 14, 35704–35715 CrossRef CAS PubMed.
- A. D. Cicilinski and J. S. Virgens Filho, Int. J. River Basin Manag., 2022, 20, 323–334 CrossRef.
- P. Rasin, M. M. Mathew, V. Manakkadan, V. N. V. Palakkeezhillam and A. Sreekanth, J. Fluoresc., 2022, 32, 1229–1238 CrossRef CAS PubMed.
- M. Regiart, A. Kumar, J. M. Gonçalves, G. J. Silva Junior, J. C. Masini, L. Angnes and M. Bertotti, ChemElectroChem, 2020, 7, 1558–1566 CrossRef CAS.
- Y. Cao, L. Wang, C. Shen, C. Wang, X. Hu and G. Wang, Sens. Actuators, B, 2019, 283, 487–494 CrossRef CAS.
Footnote |
| † Electronic supplementary information (ESI) available. See DOI: https://doi.org/10.1039/d4ra04399e |
| This journal is © The Royal Society of Chemistry 2024 |

