DOI:
10.1039/D4RA04527K
(Paper)
RSC Adv., 2024,
14, 25785-25792
Fullerenes and tree-shaped/fingerprinted carbon quantum dots for chromium adsorption via microwave-assisted synthesis
Received
20th June 2024
, Accepted 3rd August 2024
First published on 16th August 2024
Abstract
Background: Employing citric acid/dimethyl formamide (CA/DMF), two distinct types of carbon quantum dots (CQDs), tree-shaped/fingerprinted (TF-CQDs) and fullerene-like (F) were synthesized from both cellulose and carboxymethyl cellulose (CMC). Methods: Fluorescence microscopy revealed different emission colors: blue for TF-CQDs and green for F, highlighting the structural influence on light properties. Transmission electron microscopy (TEM) confirmed the intricate fingerprinted and tree-like morphology of TF-CQDs and the spherical nature of F derived from CMC. The adsorption behavior and kinetics of Cr(VI) removal from water by TF-CQDs and F were evaluated. Significant findings: Both samples demonstrated rapid Cr(VI) uptake; TF-CQDs reached equilibrium within 120 minutes compared to 240 minutes for F. Subsequent leaching led to decreased adsorption after these initial periods. Kinetic analysis revealed a first-order model for TF-CQDs, implying physical adsorption dominance. Conversely, F exhibited a better fit to pseudo-first and second-order models, suggesting combined chemical and physical mechanisms.
Introduction
Mounting agricultural waste poses an environmental threat, urging us to embrace recycling solutions. Bagasse, a readily available by-product of sugarcane processing, has emerged as a promising candidate due to its abundant cellulose, a robust polymer built from glucose units linked in a specific (β-1,4) pattern.1–3 Sugarcane bagasse (SB), a readily available by-product of sugarcane processing, has garnered attention as a versatile platform for producing novel carbon-based materials and advancing eco-friendly approaches to metal ion removal from wastewater. Emerging from the realm of agricultural waste, SB offers promising potential for innovating in both carbon-based material production and eco-friendly metal ion removal strategies within wastewater treatment.4,5 SB can be used for the preparation of many valuable polymers, including cellulose, carboxymethyl cellulose (CMC), and carbon quantum dots (CQDs).2,4–6 Cellulose is the most prevalent renewable biopolymer. Numerous cellulose derivatives were produced by chemical processes such as etherification to soluble CMC.2,6
CQDs are tiny (10 nm) carbon balls with a massive surface area, like little sponges. GQDs are like CQDs mixed with flakes of graphene. Both have several chemical groups attached, like hydroxyl (O–H), carbonyl (C![[double bond, length as m-dash]](https://www.rsc.org/images/entities/char_e001.gif) O), and ether (C–O–C). Researchers found that microwave heating is a quick and cheap way to make CQDs.1,5 Carbon allotropes known as fullerenes (F) adopt intriguing geometries like hollow spheres, ellipsoids, or tubes characterized by a network of single and double bonds between carbon atoms. The most ubiquitous member, C60, nicknamed “buckminsterfullerene,” resembles a soccer ball. Their discovery in 1985 by Kroto, Curl, and Smalley earned them the 1996 Nobel Prize in Chemistry.7,8 Given the significant ecological threat posed by Cr(VI), prioritizing its extraction from industrial wastewater before discharge into aquatic ecosystems is crucial for environmental protection.9–11 Therefore, monitoring the content of Cr(VI) ions in the environment is important for public health.
O), and ether (C–O–C). Researchers found that microwave heating is a quick and cheap way to make CQDs.1,5 Carbon allotropes known as fullerenes (F) adopt intriguing geometries like hollow spheres, ellipsoids, or tubes characterized by a network of single and double bonds between carbon atoms. The most ubiquitous member, C60, nicknamed “buckminsterfullerene,” resembles a soccer ball. Their discovery in 1985 by Kroto, Curl, and Smalley earned them the 1996 Nobel Prize in Chemistry.7,8 Given the significant ecological threat posed by Cr(VI), prioritizing its extraction from industrial wastewater before discharge into aquatic ecosystems is crucial for environmental protection.9–11 Therefore, monitoring the content of Cr(VI) ions in the environment is important for public health.
This study explores the microwave-assisted synthesis of diverse carbon nanomaterials, including “fingerprinted” and “tree-like” CQDs, using cellulose and CMC as precursors and CA/DMF as a reaction system. The influence of microwave treatment parameters on domestic and lab settings was investigated, offering insights into the resulting nanomaterials' adsorption kinetics and fluorescence properties.
Materials and methods
Materials
The sugarcane bagasse was obtained from the Paper Industry Quena Company, Egypt, and used to prepare dissolving pulp, designed according to our previous work.12 The composition of the pulp was 96% and 3% cellulose and hemicellulose, respectively, with shallow lignin content. Dimethyl formamide (DMF) and citric acid (CA) were purchased from Sigma-Aldrich. MCA (Monochloroacetic acid) and alcohols were laboratory-grade chemicals. The carboxymethylation of extracted cellulose was carried out as described elsewhere.2,13
Methods
Preparation of tree-shaped/fingerprinted carbon quantum dots (TF-CQDs) and fullerenes (F). The tree-shaped/fingerprinted carbon quantum dots (TF–CQDs) and fullerenes (F) were prepared from cellulose and CMC, respectively, as follows; 0.1 g of CA was dissolved in 20 ml of DMF, and 1 g of cellulose or CMC was added to this solution. The mixture was microwaved in a lab microwave (Milestone Italy; model: StartSynth, Reactor: Pack2B Basic Single Vessel Kit) at 100 °C and 750 W for 135 min. The final solution was left to cool down at room temperature, followed by centrifugation, filtration, and drying under vacuum.14
Cr(VI) adsorption study. The effectiveness of the synthesized TF-CQDs and F in adsorbing Cr(VI) from aqueous solutions was investigated through a comparative analysis of their removal efficiency (R%) and adsorption capacity (qe) at varying contact times. Eqn (1) and (2) were employed to quantify these parameters.| |
 | (1) |
| |
 | (2) |
This equation expresses the relationship between the initial and final Cr(VI) (chromium(VI)) concentrations in solution (denoted by C0 and Ct, respectively, measured in milligrams per liter) with the volume of the solution (V, in liters) and the mass of the adsorbent used in the adsorption experiment (m, in grams).5
The dependence of reaction rate on reactant concentration can be categorized as zero order, pseudo-first order, or pseudo-second order based on the kinetic expressions presented in eqn (3)–(5), respectively.5,15
| |
Ln[qe − qt] = ln![[thin space (1/6-em)]](https://www.rsc.org/images/entities/char_2009.gif) qe − K1t qe − K1t
| (4) |
| |
 | (5) |
where
qe and
qt are the amounts of chromium adsorbed per gram of material at equilibrium and time
t, respectively.
Ce: final concentration of chromium remaining in the solution.
t: time of contact between the material and the chromium solution.
K1 and
K2: rate constants for the two adsorption models (pseudo-first-order and pseudo-second-order).
t/
qt vs. t plot: a graphical representation used to determine the appropriate model and calculate its parameters.
15,16
The Elovich kinetic model:
| |
 | (6) |
α is the initial rate of adsorption (mg g
−1 min
−1), and
b is related to the extent of surface coverage and activation energy for chemisorption (g mg
−1). A plot of
qt against ln
![[thin space (1/6-em)]](https://www.rsc.org/images/entities/char_2009.gif) t
t yields a straight line with
α and
b determined using the slope (1/
b) and intercept (ln
![[thin space (1/6-em)]](https://www.rsc.org/images/entities/char_2009.gif) αb
αb/
b), respectively.
17
Characterization and analysis
Fourier-transform infrared spectroscopy (FT-IR). Fourier-transform infrared spectra were collected employing a Mattson 5000 spectrometer (Unicam, United Kingdom) using the KBr disk method.
Transmission electron microscopy (TEM). TEM images were taken with a JEOL JEM-2100 electron microscopy at an acceleration voltage of 120 kV.
Fluorescence spectroscopy. Fluorescence spectroscopy was evaluated using the spectrofluorometer model: Jasco FP6500, Tokyo, Japan—light source: Xenon arc lamp 150 watt.
X-ray diffraction. The crystallinity was studied on X-ray powder diffraction as the diffraction patterns were measured by Bruker D-8 Advance X-ray diffractometer (Germany) applying a 40 kV voltage and a 40 mA current employing copper (Kα) radiation (1.5406 Å).| |
 | (7) |
| |
 | (8) |
where Sc = area of the crystalline domain, St = area of the total domain.14,16
Quantum yield. The quantum yield was calculated according to the formula:| |
 | (9) |
where “QY” is the quantum yield, “m” is the slope from the plot of fluorescence vs. absorbance, “i” is the refractive index of the solvent, the “x” indicates the unknown sample, and “st.” refers to methylene blue standard solution in water (0.1 M).18
Results and discussion
Mechanism of the reaction yield of CQDs
Cellulose or CMC precursors undergo a transformation during CQDs synthesis. This process begins with dehydration, which breaks down the starting material and leads to the formation of large, aggregated polymers through mild condensation. As heating continues, these polymers shrink due to ongoing dehydration within their molecules. Simultaneously, C–C bonds form and aromatic clusters begin to take shape within the polymers. Eventually, the concentration of these aromatic clusters reaches a critical point, triggering the nucleation – the nucleation of the initial step for the formation of CQD particles.19,20 During this initial step, aromatic clusters gather on the particle surface and are simultaneously passivated by functional groups like OH, C![[double bond, length as m-dash]](https://www.rsc.org/images/entities/char_e001.gif) O, N and COOH groups. Over time, these polymer nanoparticles transform into CQDs, causing the polymer-to-CQDs ratio to decrease. This conversion leads to smaller, less polycrystalline CQDs with a narrower size distribution as the polymers decompose in the final stage.20
O, N and COOH groups. Over time, these polymer nanoparticles transform into CQDs, causing the polymer-to-CQDs ratio to decrease. This conversion leads to smaller, less polycrystalline CQDs with a narrower size distribution as the polymers decompose in the final stage.20
FTIR spectroscopy
The calculated QY was 20.45 and 68.52% for TF-CQDs and F, respectively. Fig. 1 displayed the FTIR spectra of the prepared TF-CQDs and F; the TF-CQDs displayed a small O–H absorption peak at 3357 cm−1, indicative of isolated hydroxyl groups, while F showed a broader band at 3207 cm−1, suggestive of more extensive hydrogen bonding networks.1,21 The broader O–H peak in F compared to TF-CQDs suggests the presence of a greater abundance of oxygenated groups in the precursor CMC. Furthermore, the lower wavenumber observed for the O–H group in F relative to TF-CQDs indicates the involvement of stronger intermolecular H-bonds, which facilitate the formation and stacking of the spherical structures.1,14 The calculated MHBS proved this fact. The calculated MHBS was 1.18 and 0.97 for TF-CQDs and F, respectively. The peaks between 3357–3346, 2973–2925, 1633–1604, 1454–1434, 1064–1051 and 773–800 cm−1 were attributed to N–H, –CH–, C![[double bond, length as m-dash]](https://www.rsc.org/images/entities/char_e001.gif) O, C
O, C![[double bond, length as m-dash]](https://www.rsc.org/images/entities/char_e001.gif) C, C–O–C and C–N, respectively.1
C, C–O–C and C–N, respectively.1
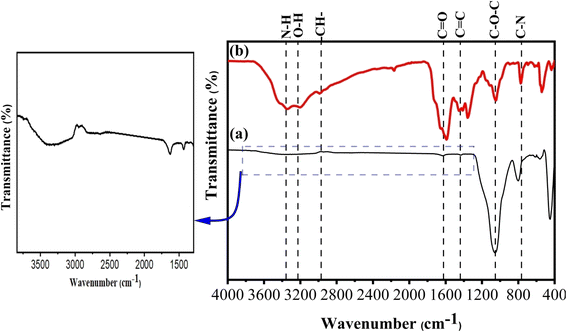 |
| | Fig. 1 FTIR spectra of (a) TF-CQDs and (b) F. | |
The relative absorbance (RA) of the characteristic –N–H are 0.99 and 1.18, and for C–N group are 0.86 and 1.03 for TF-CQDs and F, respectively, confirmed the high content of nitrogenized groups in the prepared F than TF-CQDs.
Transmission electron microscopy (TEM) analysis
Fig. 2 shows the typical TEM images and diameter distributions of TF-CQDs, and F. TEM revealed two distinct morphologies of CQDs: cellulose-derived TF-CQDs exhibited a unique fingerprint-like architecture with ∼0.16 nm horizontal lines and tree-like branches formed by aggregated CQDs of ∼3.73 nm diameter. In contrast, CMC-derived F displayed purely spherical aggregates (32.21–122.21 nm) composed of individual CQDs with a diameter of ∼3.05 nm. The surface area was 246 and 255 nm2 for TF-CQDs and F, respectively.
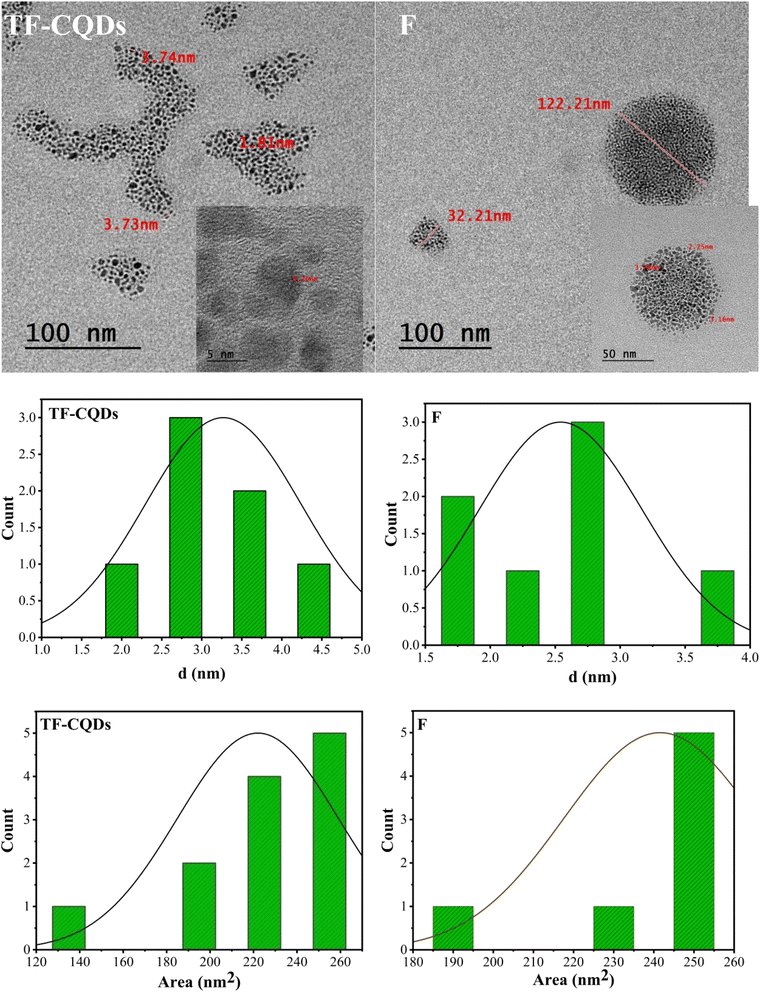 |
| | Fig. 2 TEM images of TF-CQDs and F. | |
X-ray analysis
Fig. 3 displays the X-ray diffraction patterns of TF-CQDs and F, which revealed peaks at 13.94 & 12.36 and, 29.62 & 21.90° related to the (001) and (002) planes, respectively, due to the presence of graphic sheets with the d ≈ 0.30 and 0.33 nm.14,18 The d value of F (0.33 nm) is higher than TF-CQDs (0.30 nm). This may be due to the presence of more O groups on CMC compared to cellulose. The peaks at 31.47, 38.10, 41.74 and 51.10° for TF-CQDs and at 28.50, 30.01, 31.73 and 44.57° for F related to the (002), (100), (102),and (103) crystal planes in which (002), (100), and (102) represent graphite (sp2) and (103) related to diamond (sp3)-like carbon.18 The calculated Cr.I.% of TF-CQDs and F were 62.62 and 11.99%.
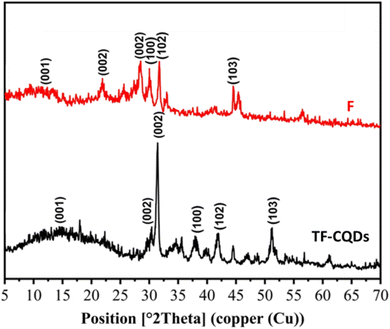 |
| | Fig. 3 XRD of (a) TF-CQDs and (b) F. | |
Fluorescence spectra
Fig. 4 shows the fluorescence emission spectra of the TF-CQDs and F. They were stimulated at 350 nm and emitted at 421.50 and 422.50 nm wavelengths, respectively. In theory, this emission might demonstrate the potential of these materials as sensors. The C![[double bond, length as m-dash]](https://www.rsc.org/images/entities/char_e001.gif) O/C
O/C![[double bond, length as m-dash]](https://www.rsc.org/images/entities/char_e001.gif) N moieties on the surfaces of QDs produce fluorescence emission.18 For TF-CQDs and F, the emission peaks at 815.50 and 809.00 nm are produced from oxygen vacancies, respectively. These findings confirmed the efficacy of TF-CQDs and F synthesized from SB as a suitable material for future chemical sensing applications.
N moieties on the surfaces of QDs produce fluorescence emission.18 For TF-CQDs and F, the emission peaks at 815.50 and 809.00 nm are produced from oxygen vacancies, respectively. These findings confirmed the efficacy of TF-CQDs and F synthesized from SB as a suitable material for future chemical sensing applications.
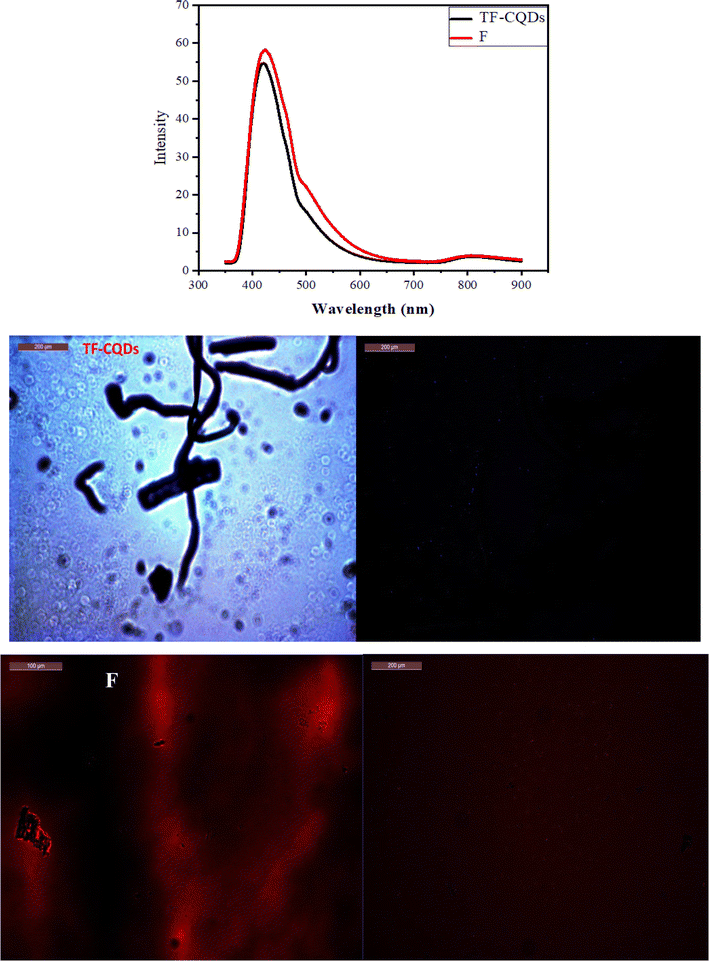 |
| | Fig. 4 Fluorescent spectra and microscope images of TF-CQDs and F. | |
A fluorescent microscope was used to observe the fluorescence of prepared TF-CQDs and F. Blue fluorescence was detected for TF-CQDs and red fluorescence for F. Fig. 4 shows the fluorescence images and the enrichment of TF-CQDs around nucleoli, where the nucleoli became brighter and more precise in the case of TF-CQDs. This may be due to the variation of CQDs types (i.e., fingerprinted and tree-shaped) compared to the stacked F. The red color of F is due to the more nitrogen content while the blue color is due to the low nitrogen content.
Cr(VI)adsorption study
TF-CQDs and F with fluorescent properties were evaluated to remove Cr(VI). The effect of contact time on the adsorption efficiency of TF-CQDs and F was studied at different times, namely 15, 30, 45, 60, 90, 120, 240, 480, and 960 min. As shown in Fig. 5a, the affinity of TF-CQDs and F towards Cr(VI) was not the same. The removal of Cr(VI) by TF-CQDs and F was found to be quick at first due to the existence of more free functional groups, then slow, and no significant increase in the adsorption rate was detected after 120 and 240 min, respectively. Cr(VI) adsorption to TF-CQDs and F was 99.16 and 99.48%, respectively, and steady until 120 and 240 min before decreasing due to the leaching process.14
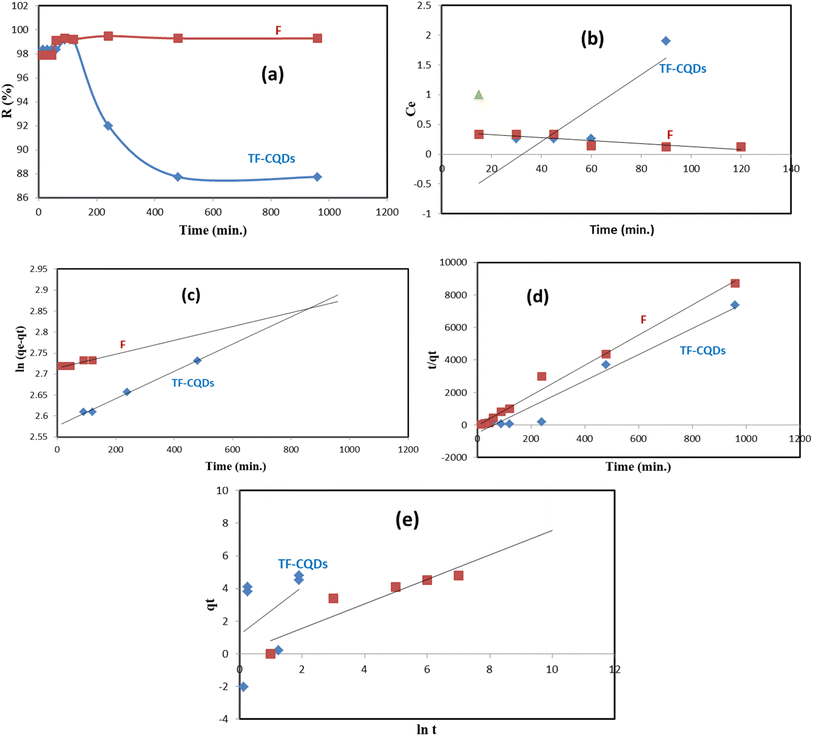 |
| | Fig. 5 (a) Effect of contact time, (b) zero order reaction, (c) pseudo-first-order, (d) the pseudo-second-order rate and (e) Elovich model. | |
Fig. 5b–e shows that the zero-order reaction wasn't suitable for describing the kinetics of Cr(VI) sorption on TF-CQDs and F, which assumes that increasing the concentration of reactants does not affect the magnitude of the reaction rate.15 The pseudo-first-order and pseudo-second-order equations are utilized to model the kinetics of Cr(VI) on TF-CQDs and F. Concerning the values of R2 presented in Table 1, it is seen that the pseudo-first-order model gave a better fit to the adsorption data of TF-CQDs (i.e., physical bonds in the adsorption).4,15,18 On the contrary, F gave a better fit to both pseudo-first (due to the fitting of qexp. with qcalc.) and pseudo-second (due to the fitting of R2) orders, which means the surface processes involving chemisorption and physisorption in the adsorption of Cr(VI) by F.14,18
Table 1 Evaluation of kinetic models for adsorption process: a comparative analysis of rate constants and correlation coefficients for pseudo-first-order, pseudo-second-order, intra-particle diffusion, Boyd, and Elovich models
| Kinetic model |
Parameter |
TF-CQDs |
F |
| Zero order reaction |
K0 |
19 × 10−2 |
25 × 10−3 |
| |
R2 |
0.827 |
0.747 |
| Pseudo-first order |
qexp. (mg g−1) |
15.22 |
15.48 |
| |
qcalc. (mg g−1) |
13.16 |
15.14 |
| |
K1 |
2 × 10⁻⁴ |
72 × 10−6 |
| |
R2 |
0.994 |
0.868 |
| Pseudo second order |
qcalc. (mg g−1) |
0.12 |
0.10 |
| |
K2 |
16 × 10−2 |
26 × 10−1 |
| |
R2 |
0.955 |
0.988 |
| Elovich model |
a (mg g−1 min−1) |
65 × 10−14 |
20 × 10−14 |
| |
b (g mg−1) |
13 × 10−2 |
15 × 10−2 |
| |
R2 |
0.853 |
0.838 |
Conclusions
We synthesized TF-CQDs and F derived from citric acid and DMF using a simple microwave method. The prepared samples have the advantage of high fluorescence, in addition to their excellent absorbance ability towards Cr(VI). The prepared CQDs from cellulose showed fingerprinted/tree-like CQDs, while the prepared QDs from CMC showed a shaped structure. The fluorescence microscope proved the preparation of CQDs with emitted light blue for TF-CQDs and red fluorescence for F.
Data availability
The data supporting this article have been included as part of the submitted manuscript.
Conflicts of interest
There are no conflicts to declare.
Acknowledgements
The authors appreciate the National Research Center and the Academy of Scientific Research and Technology (ASRT), Egypt, grant no. 9118, and the Czech Academy of Sciences, project no. ASRT-22-01, through the Joint Bilateral Agreement project “Stimuli-responsive smart materials from agricultural wastes”, for financial support of the bilateral research activities. In addition, PRIMA International Project, between the Academy of Scientific Research and Technology (ASRT) and PRIMA, through the Joint Agreement project “Sustainable Antimicrobial Packaging based on a Healthy Intelligent Renewable Approach” with acronym “SAPHIRA”.
References
- H.-A. S. Tohamy, Cellulosic nitrogen doped carbon quantum dots hydrogels with fluorescence/visco-elastic properties for pH-and temperature-sensitivity, Diamond Relat. Mater., 2023, 136, 110027 CrossRef CAS.
- H.-A. S. Tohamy, M. El-Sakhawy and M. M. Elnasharty, Carboxymethyl cellulose membranes blended with carbon nanotubes/ag nanoparticles for eco-friendly safer lithium-ion batteries, Diamond Relat. Mater., 2023, 138, 110205 CrossRef CAS.
- N. Ungureanu, V. Vlăduţ and S.-Ş. Biriş, Sustainable valorization of waste and by-products from sugarcane processing, Sustainability, 2022, 14, 11089 CrossRef CAS.
- H.-A. S. Tohamy, G. Taha and M. Sultan, Dialdehyde cellulose/gelatin hydrogel as a packaging material for manganese oxides adsorbents for wastewater remediation: Characterization and performance evaluation, Int. J. Biol. Macromol., 2023, 248, 125931 CrossRef CAS PubMed.
- H.-A. S. Tohamy, Fluorescence ‘Turn-on’Probe for Chromium Reduction, Adsorption and Detection Based on Cellulosic Nitrogen-Doped Carbon Quantum Dots Hydrogels, Gels, 2024, 10, 296 CrossRef CAS PubMed.
- S. Mowafi and H.-A. S. Tohamy, Application of electro-spun nano-fibers based on agriculture cellulosic biomaterial wastes for removal of dye and heavy metal from polluted water, J. Text. Inst., 2023, 136, 1–10 Search PubMed.
- O. A. Ekpete and K. J. Orie, Fullerenes: Synthesis and Application, Faculty of Natural and Applied Sciences Journal of Scientific Innovations, 2023, 4, 221–236 Search PubMed.
- S. K. Tiwari, V. Kumar, A. Huczko, R. Oraon, A. D. Adhikari and G. Nayak, Magical allotropes of carbon: prospects and applications, Crit. Rev. Solid State Mater. Sci., 2016, 41, 257–317 CrossRef CAS.
- F. J. Alguacil and F. A. Lopez, Removal of Cr (VI) from waters by multi-walled carbon nanotubes: Optimization and kinetic investigations, in Water and Wastewater Treatment, IntechOpen, London, UK, 2019, pp. 55–65 Search PubMed.
- A. Saravanan, P. S. Kumar and M. Yashwanthraj, Sequestration of toxic Cr (VI) ions from industrial wastewater using waste biomass: a review, Desalin. Water Treat., 2017, 68, 245–266 CrossRef CAS.
- M. A. Irshad, S. Sattar, R. Nawaz, S. A. Al-Hussain, M. Rizwan, A. Bukhari, M. Waseem, A. Irfan, A. Inam and M. E. Zaki, Enhancing chromium removal and recovery from industrial wastewater using sustainable and efficient nanomaterial: a review, Ecotoxicol. Environ. Saf., 2023, 263, 115231 CrossRef CAS PubMed.
- R. E. Abou-Zeid, S. Dacrory, K. A. Ali and S. Kamel, Novel method of preparation of tricarboxylic cellulose nanofiber for efficient removal of heavy metal ions from aqueous solution, Int. J. Biol. Macromol., 2018, 119, 207–214 CrossRef CAS PubMed.
- M. El-Sakhawy, H.-A. S. Tohamy, M. M. AbdelMohsen and M. El-Missiry, Biodegradable carboxymethyl cellulose based material for sustainable/active food packaging application, J. Thermoplast. Compos. Mater., 2024, 37, 2035–2050 CrossRef CAS.
- H.-A. S. Tohamy, M. El-Sakhawy and S. Kamel, Microwave-assisted synthesis of amphoteric fluorescence carbon quantum dots and their chromium adsorption from aqueous solution, Sci. Rep., 2023, 13, 11306 CrossRef CAS PubMed.
- I. R. Eri, N. K. Pramudinta and D. Nurmayanti, Adsorption Kinetics of Edamame Soybean Peel Activated Carbon in Reducing the Level of Phosphate, J. Ecol. Eng., 2022, 23, 97–107 CrossRef PubMed.
- H.-A. S. Tohamy, M. El-Sakhawy and S. Kamel, Carbon Nanotubes from Agricultural Wastes: Effective Environmental Adsorbent, Egypt. J. Chem., 2022, 65, 437–446 Search PubMed.
- U. A. Edet and A. O. Ifelebuegu, Kinetics, isotherms, and thermodynamic modeling of the adsorption of phosphates from model wastewater using recycled brick waste, Processes, 2020, 8, 665 CrossRef CAS.
- H.-A. S. Tohamy, M. El-Sakhawy, E. B. Hassan and S. Kamel, Microwave-Prepared Quantum Dots and Their Potential Applications as Adsorbents and Chemosensors, Materials, 2023, 16, 6722 CrossRef CAS PubMed.
- M. Sevilla and A. B. Fuertes, Chemical and structural properties of carbonaceous products obtained by hydrothermal carbonization of saccharides, Chem.–Eur. J., 2009, 15, 4195–4203 CrossRef CAS PubMed.
- N. Papaioannou, M.-M. Titirici and A. Sapelkin, Investigating the effect of reaction time on carbon dot formation, structure, and optical properties, ACS Omega, 2019, 4, 21658–21665 CrossRef CAS PubMed.
- A. S. Abdel-Fatah, H.-A. S. Tohamy, S. I. Ahmed, M. A. Youssef, M. R. Mabrouk, S. Kamel, F. A. Samhan and A. El-Gendi, Anatase-cellulose acetate for reinforced desalination membrane with antibacterial properties, BMC Chem., 2023, 17, 112 CrossRef CAS PubMed.
|
| This journal is © The Royal Society of Chemistry 2024 |
Click here to see how this site uses Cookies. View our privacy policy here.  Open Access Article
 ,
Mohamed El-Sakhawy
 and
Samir Kamel*
![[double bond, length as m-dash]](https://www.rsc.org/images/entities/char_e001.gif) O), and ether (C–O–C). Researchers found that microwave heating is a quick and cheap way to make CQDs.1,5 Carbon allotropes known as fullerenes (F) adopt intriguing geometries like hollow spheres, ellipsoids, or tubes characterized by a network of single and double bonds between carbon atoms. The most ubiquitous member, C60, nicknamed “buckminsterfullerene,” resembles a soccer ball. Their discovery in 1985 by Kroto, Curl, and Smalley earned them the 1996 Nobel Prize in Chemistry.7,8 Given the significant ecological threat posed by Cr(VI), prioritizing its extraction from industrial wastewater before discharge into aquatic ecosystems is crucial for environmental protection.9–11 Therefore, monitoring the content of Cr(VI) ions in the environment is important for public health.
O), and ether (C–O–C). Researchers found that microwave heating is a quick and cheap way to make CQDs.1,5 Carbon allotropes known as fullerenes (F) adopt intriguing geometries like hollow spheres, ellipsoids, or tubes characterized by a network of single and double bonds between carbon atoms. The most ubiquitous member, C60, nicknamed “buckminsterfullerene,” resembles a soccer ball. Their discovery in 1985 by Kroto, Curl, and Smalley earned them the 1996 Nobel Prize in Chemistry.7,8 Given the significant ecological threat posed by Cr(VI), prioritizing its extraction from industrial wastewater before discharge into aquatic ecosystems is crucial for environmental protection.9–11 Therefore, monitoring the content of Cr(VI) ions in the environment is important for public health.

![[thin space (1/6-em)]](https://www.rsc.org/images/entities/char_2009.gif) qe − K1t
qe − K1t


![[thin space (1/6-em)]](https://www.rsc.org/images/entities/char_2009.gif) t yields a straight line with α and b determined using the slope (1/b) and intercept (ln
t yields a straight line with α and b determined using the slope (1/b) and intercept (ln![[thin space (1/6-em)]](https://www.rsc.org/images/entities/char_2009.gif) αb/b), respectively.17
αb/b), respectively.17


![[double bond, length as m-dash]](https://www.rsc.org/images/entities/char_e001.gif) O, N and COOH groups. Over time, these polymer nanoparticles transform into CQDs, causing the polymer-to-CQDs ratio to decrease. This conversion leads to smaller, less polycrystalline CQDs with a narrower size distribution as the polymers decompose in the final stage.20
O, N and COOH groups. Over time, these polymer nanoparticles transform into CQDs, causing the polymer-to-CQDs ratio to decrease. This conversion leads to smaller, less polycrystalline CQDs with a narrower size distribution as the polymers decompose in the final stage.20
![[double bond, length as m-dash]](https://www.rsc.org/images/entities/char_e001.gif) O, C
O, C![[double bond, length as m-dash]](https://www.rsc.org/images/entities/char_e001.gif) C, C–O–C and C–N, respectively.1
C, C–O–C and C–N, respectively.1
![[double bond, length as m-dash]](https://www.rsc.org/images/entities/char_e001.gif) O/C
O/C![[double bond, length as m-dash]](https://www.rsc.org/images/entities/char_e001.gif) N moieties on the surfaces of QDs produce fluorescence emission.18 For TF-CQDs and F, the emission peaks at 815.50 and 809.00 nm are produced from oxygen vacancies, respectively. These findings confirmed the efficacy of TF-CQDs and F synthesized from SB as a suitable material for future chemical sensing applications.
N moieties on the surfaces of QDs produce fluorescence emission.18 For TF-CQDs and F, the emission peaks at 815.50 and 809.00 nm are produced from oxygen vacancies, respectively. These findings confirmed the efficacy of TF-CQDs and F synthesized from SB as a suitable material for future chemical sensing applications.


