 Open Access Article
Impact of lanthanum ion exchange and steaming dealumination on middle distillate production using nanosized Y zeolite catalysts in hydrocracking reactions†
Carlos Mendoza *,
Cecilia Manrique
 * and
Adriana Echavarría*
Grupo Catalizadores y Adsorbentes, Instituto de Química, Universidad de Antioquia, Calle 70 No. 52-21, Medellín, Colombia. E-mail: cjavier.mendoza@udea.edu.co; alba.manrique@udea.edu.co; adriana.echavarria@udea.edu.co
First published on 23rd August 2024
Abstract
In the field of hydrocracking reactions, achieving optimal middle distillate yields remains a persistent challenge with commercially available zeolite Y catalysts. This limitation is attributed to challenges related to diffusion constraints within the catalyst. In response, we present a promising solution not only to these problems but also to the challenges encountered in nanosized Y zeolites when attempting to generate acidic sites within their structure and when analyzing their performance in vacuum gas oil hydrocracking. NiMo catalysts based on nanosized Y zeolites with different crystal sizes exchanged with lanthanum, effectively address diffusion issues and significantly enhance catalyst performance compared to dealuminated nanosized and commercial Y zeolite under the same reaction conditions. The catalysts were characterized by TGA, ICP-OES, XPS, N2 physisorption, FT-IR for pyridine acidity, TEM-mapping, and the 3-methyl thiophene reaction to test the hydrogenating capacity. Surface analysis and microscopy showed greater porosity in the catalysts with smaller zeolites and different arrangements of their components. The catalysts based on steamed protonated nanosized Y zeolites with a larger size and lanthanide nanosized Y zeolite with a smaller size yielded more middle distillates. Research provides a comprehensive analysis, providing a correlation between the catalytic performance and the size of the nanosized Y zeolite.
1 Introduction
Hydrocracking is a chemical reaction where one or more carbon–carbon bonds, usually hydrocarbons, are broken creating free valences which are then saturated with hydrogen.1 Depending on the metallic and acidic nature of the catalyst, hydrocracking can be divided into four categories: hydropyrolysis, hydrogenolysis, Haag–Dessau hydrocracking, and bifunctional hydrocracking.2 In the bifunctional hydrocracking catalyst, metallic component performs alkane dehydrogenation and alkene hydrogenation reactions, while the acid component transforms heavy alkenes into lighter ones through cracking.2 The synergy between these two functions determines whether the metal-acid relation is balanced or not.3 A very strong acidic function with a weak hydrogenating/dehydrogenating function leads the reaction to high conversions but results in light products. On the other hand, a weak acidic function with a strong hydrogenating/dehydrogenating function leads to low conversions but more profitable products.4 Therefore, a balance between the acid and hydrogenating functions is necessary to obtain high yields in hydrocracking reaction, while avoiding excessive cracking. Nowadays, bifunctional hydrocracking plays an important role in the oil industry. It is mainly used in the conversion of vacuum gas oil to diesel, jet fuel and gasoline. Its importance is based on its flexibility towards the formation of different products and versatility for coupling to other processes. For instance, hydrocracking products can be used as high-quality feed for fluidized catalytic cracking (FCC), in the Fischer–Tropsch production of high-quality diesel, and in the heavy naphtha reforming, among others.5–7 In this sense, hydrocracking units based on bifunctional catalysts allow refineries to respond efficiently to market fluctuations and their needs. For countries with substantial oil reserves, the hydrocracking process plays a crucial role in their economy, particularly when dealing with heavy crude oil that has high sulfur content. Refining heavy crude oil requires more processing and upgrading to produce useable products, making hydrocracking one of the most efficient methods to achieve this goal.8 The most common components of a hydrocracking catalyst are Mo, Co, Ni and W metal sulfides supported in a mixture of alumina or silica alumina with ultra-stabilized Y zeolite (USY). In such catalysts, the hydrogenating–dehydrogenating function is provided by the metal sulfides, the acidic function is provided by the USY zeolite (steaming dealuminated Y zeolite), while the alumina acts as a binder. Y zeolite dealuminated by steaming is the most common acidic component in these catalysts. This process generates mesopores within the Y zeolite and increases its acid strength.8–10 This methodology has the disadvantage of moving the hydrocarbon molecules within the mesopores away from the metal function, thereby reducing the yield towards to middle distillates. To solve this problem, researchers decided to make these mesopores more accessible by eliminating the extra reticular aluminum, or by interconnecting the mesopores through of desilication with bases, however, they found that this process tends to block the pores.11–13 Francis et al.14 introduced small amounts of nickel into the mesopores, slightly improving the yield to middle distillate. However, this individual metal is not as a good hydrogenator as the NiMo mixture, so it would only be a partial solution. Cui et al.15 developed catalysts based on submicrometric and nanometric size Y zeolites. The smaller size in the zeolites allowed have more contact of the acidic sites with the (de)hydrogenating sites, which produced a higher yield towards middle distillates. However, the nanometric range combined with a post-synthesis treatment such as a dealumination process, which is not reported in their work, would result in an increase in acid strength and in the generation of intra- and interparticle mesoporosity. The dealumination process partially destroys the Y zeolite structure, but the effect that this process could have on zeolite when it is in the nanometric scale is not known yet. Bearing this in mind, an alternative that could help to increase the acid strength of Y zeolite without destroying the crystalline structure is based on the use of rare earths elements (REEs) through ionic exchange. REEs have a high affinity for oxygen and sulfur-containing molecules, which are common impurities in crude oil feedstocks. They can effectively remove these impurities through ionic exchange reactions, leading to cleaner, more efficient hydrocracking processes. In addition, REEs also play an important role in other aspects of hydrocracking. They promote acidity on the catalyst surface, hydrogenation and dehydrogenation reactions, and enhance the stability of the catalyst under high temperature and pressure conditions.16–19 Therefore, this work investigates catalysts based on Y zeolites of nanometric character undergo dealumination and exchange processes with lanthanum. These catalysts were tested in the hydrocracking reaction of a Colombian vacuum gas oil (VGO) previously hydrotreated to determine their selectivity and yield towards middle distillates.2 Experimental section
2.1 Synthesis of zeolites
We synthesized sodium Y zeolites nanocrystals in a previous work.20 The reactants used for the synthesis were sodium hydroxide pellets (Sigma-Aldrich, ≥99%), Ludox AM (Sigma-Aldrich, 30 wt%), fumed silica (Sigma-Aldrich, 99.8%), sodium aluminate (Riedel de Haën, 54% Al2O3![[thin space (1/6-em)]](https://www.rsc.org/images/entities/char_2009.gif) :
:![[thin space (1/6-em)]](https://www.rsc.org/images/entities/char_2009.gif) 41% Na2O) and deionized water. Initially, a sodium aluminate solution was slowly poured into the Ludox silica suspension in a cool alkali medium and aged for 24 h. Fumed silica was then added until the molar gel composition was achieved. The resulting gel was again aged for 1 day and then crystallized for another day at different temperatures. The autoclave was then quenched, and the solids were recovered by centrifugation and washed with deionized water until the pH of the supernatant was neutral. Table 1 shows the composition of the synthesis gels and the crystallization conditions.
41% Na2O) and deionized water. Initially, a sodium aluminate solution was slowly poured into the Ludox silica suspension in a cool alkali medium and aged for 24 h. Fumed silica was then added until the molar gel composition was achieved. The resulting gel was again aged for 1 day and then crystallized for another day at different temperatures. The autoclave was then quenched, and the solids were recovered by centrifugation and washed with deionized water until the pH of the supernatant was neutral. Table 1 shows the composition of the synthesis gels and the crystallization conditions.
| Zeolite | Crystal size (nm) | SiO2 | Al2O3 | Na2O | H2O | TCa/°C | Si/Albulkb | Si/Alframeworkc |
|---|---|---|---|---|---|---|---|---|
| a Crystallization temperature.b Determined by compositional analysis of Si and Al using inductively coupled plasma (ICP).c Determined by Breck and Flanigen equation using the shift of XRD patterns. | ||||||||
| NaY1 | 77 | 20.0 | 0.7 | 8.0 | 160 | 100 | 2.77 | 2.53 |
| NaY2 | 45 | 22.5 | 0.7 | 9.0 | 160 | 80 | 2.51 | 2.54 |
| NaY3 | 41 | 20.0 | 1.3 | 8.8 | 160 | 90 | 2.21 | 2.20 |
| NaY4 | 33 | 22.5 | 1.3 | 9.8 | 160 | 70 | 2.32 | 2.25 |
The zeolites synthesized, NaY1, NaY2, NaY3 and NaY4, were modified as in previous works to create two groups of acid zeolites: (i) protonated Y zeolite dealuminated by steaming (HY DA), and (ii) a lanthanide Y zeolite (LaY).21 The characteristic FAU phases obtained for each Y zeolite are shown in the ESI (Fig. S1†). Additionally, the nanometric particle size of pristine NaY zeolites are shown in SEM and TEM images in Fig. S2 and S3,† respectively.
2.2 Preparation of the catalysts
Catalysts were prepared by a mechanical mixture of zeolites (HY DA or LaY) (40 wt%) with alumina binder like support (Versal 250 pseudoboehmite alumina, surface area 320 m2 g−1). This mixture was peptized using a 1 wt% HNO3 solution as peptizing agent. The dough obtained was then extruded in cylindrical shapes (longitude = 6 mm, diameter = 1.2 mm).22 The resulting material was dried at 95 °C during 2 h and calcined at 500 °C for 5 h at 5 °C min−1. Subsequently, using the incipient wetness impregnation method, these pellets were impregnated sequentially with aqueous solutions of ammonium heptamolybdate tetrahydrate (99 wt%, Merck) and nickel nitrate hexahydrate (99 wt%, Merck). The amount used is associated with the molar ratio Ni/Mo of 0.3 (15% as MoO3 and 3% as NiO in the support).23 The concentrations of nickel nitrate hexahydrate and ammonium heptamolybdate tetrahydrate were 0.3 M and 0.1 M, respectively, with a solid/liquid ratio of 1 g extrudate per 0.6 mL of solution. After impregnation with each of the precursor salts, the impregnated support was dried at 95 °C, 5 °C min−1, 2 h and calcined at 500 °C, 5 °C min−1, 4 h. The resulting materials were named as Cat. HY DA, and Cat. LaY. The materials analyzed in this work are described below in the Table 2.| Zeolite | HY DA zeolite | Cat. HY DA | LaY zeolite | Cat. LaY |
|---|---|---|---|---|
| NaY1 | HY1 DA | Cat. HY1 DA | LaY1 | Cat. LaY1 |
| NaY2 | HY2 DA | Cat. HY2 DA | LaY2 | Cat. LaY2 |
| NaY3 | HY3 DA | Cat. HY3 DA | LaY3 | Cat. LaY3 |
| NaY4 | HY4 DA | Cat. HY4 DA | LaY4 | Cat. LaY4 |
2.3 Characterization methods
The compositional analysis was carried out using an inductively coupled plasma (ICP) equipment of Varian Vista-MPX. To analyze the samples, about 40 mg of sample was weighed and digested with a mixture composed of 2 mL of HNO3 and 1 mL of HF for 24 h at 40 °C. To the resulting mixture, 40 mL of HBO3 2% was added at 40 °C and kept for 5 h.Surface analysis was carried out using X-ray photoelectron spectroscopy (XPS) with a commercial instrument SPECS® spectrometer. The instrument was equipped with a PHOIBOS® 150 WAL hemispherical energy analyzer with angular resolution (<0.5°), an XR 50 Al-X-ray source, and μ-FOCUS 500 X-ray monochromator. Energy positions calibration of the peaks maxima was done using the binding energy (BE) of C 1![[thin space (1/6-em)]](https://www.rsc.org/images/entities/char_2009.gif) s peak centered at 284.6 eV. Gaussian–Lorentzian curve fitting was used for the deconvolution of the XPS spectra in the high-resolution emission-line regions.
s peak centered at 284.6 eV. Gaussian–Lorentzian curve fitting was used for the deconvolution of the XPS spectra in the high-resolution emission-line regions.
The morphology was examined by transmission electron microscopy high resolution (HRTEM) using a JEOL-2010F equipment. The samples were suspended in heptane and deposited on a 440 mesh Cu grid coated with Lacey carbon. The metallic dispersion was evaluated using energy-dispersive X-ray spectroscopy (EDX) analysis.
Thermographs were obtained using a TA Instruments Q 600 SDT analyzer, by weighing 25 mg of the sample and heating it at a ramp of 10 °C min−1 from room temperature to 800 °C with 40 mL min synthetic air flow. All samples were first dried to 80 °C for 2 h at air flow.
The nitrogen sorption measurements were performed with a Micromeritics ASAP 2020 gas sorption system at −196 °C. Prior to the measurements, all samples were degassed under high-vacuum conditions for 8 h at 350 °C. The micropore volume was calculated based on the t-plot method, while the Brunauer–Emmett–Teller (BET) method was applied to determine the specific surface area. The mesopore volume and mesopore size distribution were calculated considering the adsorption branch of the isotherm by the Barrett–Joyner–Halenda (BJH) method.24
The temperature programmed reduction (TPR) profiles were carried out in a Chemisorb 2720 equipment (Micromeritics). 300 mg of each sample were placed in a quartz reactor located inside an electric furnace. The samples were pretreated by heating in a nitrogen atmosphere at 350 °C for one hour, in order to remove contaminants. After cooling down to room temperature, the reduction process was carried out with a gaseous mixture of 10% H2/Ar using a flow rate of 30 mL min−1 and a temperature ramp of 10 °C min−1 in the interval 25–600 °C. Hydrogen consumption was monitored using a thermal conductivity detector. Using diffuse reflectance infrared (DRIFT) and using pyridine as a probe molecule (Py-IR), the Lewis and Brønsted acid sites of the materials was determined. The equipment used was an Agilent Cary 660 FTIR adapted with a manifold to create a vacuum, and supplying the pyridine. Initially, the sample was degassed under vacuum, slowly raising the temperature to 300 °C for 40 min. The sample was cooled to 100 °C to saturate with pyridine (10 mbar) and the excess was removed by vacuum. The spectrum was taken at 400 °C when the signal stabilized.
2.4 Catalytic tests
Several cuts were separated using the boiling points (B.P.) of the product molecules, i.e. naphtha (B.P. between IPB and 180 °C), middle distillates (MD) (B.P. between 180–370 °C) and heavy cuts (B.P. > 370 °C+). Conversion of VGO (XVGO), selectivity to naphtha (Snaphtha), selectivity to MD (SMD), were determined using the following equations:
3 Results and discussions
3.1 Elemental composition and structure
To comprehend the performance of catalysts when reacting with heavy hydrocarbon molecules, such as those found in vacuum gas oil, it is necessary to know the bulk and surface composition of these materials. For this reason, all catalysts were subjected to a quantitative surface analysis by XPS, and the results were compared with their elemental composition found by ICP. Table 3 shows the elemental composition data obtained of the catalysts based on LaY and HY DA zeolites, and Table 4 shows the data obtained from the compositional analysis on the surface of these catalysts.| Catalyst | ICP | ||||||
|---|---|---|---|---|---|---|---|
| Si/% | Al/% | O/% | La/% | Na/% | Mo/% | Ni/% | |
| Cat. LaY1 | 7.1 | 22.3 | 66.0 | 0.6 | 0.7 | 2.5 | 0.8 |
| Cat. LaY2 | 7.1 | 21.6 | 66.7 | 0.5 | 0.7 | 2.5 | 0.8 |
| Cat. LaY3 | 7.2 | 23.9 | 64.0 | 0.7 | 0.7 | 2.6 | 0.9 |
| Cat. LaY4 | 6.7 | 21.8 | 66.7 | 0.6 | 0.7 | 2.6 | 0.9 |
| Theoretical | 7.7 | 24.7 | 62.5 | 0.7 | 1.0 | 2.6 | 0.8 |
| Cat. HY1 DA | 8.2 | 22.6 | 65.7 | 0 | 0.7 | 2.1 | 0.7 |
| Cat. HY2 DA | 8.1 | 22.7 | 65.1 | 0 | 1.0 | 2.3 | 0.8 |
| Cat. HY3 DA | 8.6 | 23.2 | 64.2 | 0 | 0.7 | 2.6 | 0.8 |
| Cat. HY4 DA | 8.6 | 23.4 | 64.6 | 0 | 0.6 | 2.1 | 0.7 |
| Theoretical | 8.3 | 23.5 | 61.4 | 0 | 1.0 | 2.4 | 0.8 |
| Catalyst | XPS | ||||||
|---|---|---|---|---|---|---|---|
| Si 2p/% | Al 2p/% | O 1s/% | La 3d/% | Na 1s/% | Mo 3d/% | Ni 2p/% | |
| a XPS spectra are found in ESI. | |||||||
| Cat. LaY1 | 11.0 | 32.3 | 53.0 | 0.1 | 0.0 | 2.9 | 0.7 |
| Cat. LaY2 | 14.9 | 31.2 | 50.6 | 0.1 | 0.3 | 2.3 | 0.6 |
| Cat. LaY3 | 13.9 | 25.1 | 57.1 | 0.2 | 0.5 | 2.4 | 0.9 |
| Cat. LaY4 | 17.1 | 26.5 | 53.0 | 0.2 | 0.8 | 1.7 | 0.7 |
| Cat. HY1 DA | 10.8 | 33.4 | 52.4 | 0.0 | 0.2 | 2.5 | 0.7 |
| Cat. HY2 DA | 13.2 | 28.5 | 55.4 | 0.0 | 0.2 | 2.1 | 0.6 |
| Cat. HY3 DA | 15.8 | 29.4 | 51.9 | 0.0 | 0.4 | 2.1 | 0.5 |
| Cat. HY4 DA | 18.6 | 24.6 | 53.8 | 0.0 | 0.5 | 2.1 | 0.4 |
The atomic percentages of elements present in all LaY and HY DA catalysts analyzed through ICP is consistent with the fixed proportions, as shown in Table 3. However, due to the significant amount of alumina used to make the catalyst, ICP analysis couldn't differentiate between the zeolites having a ratio of Si/Al equal to 2.2 from those of having a ratio of 2.5, Even so, the average theoretical Si/Albulk ratio is close to 0.30 and 0.35 for all LaY and HY DA catalysts, respectively, and their Ni/Mo ratio is 0.30. Based on the data presented in Table 3, a plot of the Si/Albulk and Ni/Mo ratios of these catalysts was obtained (Fig. S4†), which demonstrated a good fit with the expected theoretical results.
XPS technique shown variations in the elemental composition of catalysts, as illustrated in Fig. S5 and S6.† Table 4 shows that the atomic percentage of Si on the surface of the catalysts increases when the zeolite particle becomes smaller. Since the only component of the catalyst containing Si in its structure is the Y zeolite, it has been then assumed that the zeolite is more readily available on the surface of the catalyst when it decreases in size.26 Thus, as shown in Fig. S7,† the surface Si/Al ratio of catalyst increases proportionally with a decrease in particle size of zeolite. Furthermore, the catalysts with smaller LaY zeolites exhibit an increased surface Ni/Mo ratio, whereas those with smaller HY DA zeolites show a lower ratio. This discrepancy highlights the variation in metal deposition based on the zeolite's inherent characteristics.
The amount of Mo on the surface of LaY catalysts decreases substantially with increasing size of the zeolite. This phenomenon can be explained from an electrostatic perspective: during impregnation, molybdenum is found as MoO42− while nickel is found as Ni2+. Consequently, molybdenum migrates preferably towards the alumina, which has a positive charge potential at pH below 9, while some of the Ni2+ may migrate close to the zeolite surface due to the negatively charges sites.27–29 In this sense, a greater amount of nickel in Mo–Ni species would be found on the surface when the smaller zeolites are analyzed. Regarding the catalysts with acid Y zeolite dealuminated, it was observed the contrary effect. This behaviour can be attributed to the formation of positively charged aluminum extra-framework species on the surface of the zeolite caused by the process of dealumination. Since the zeolite is smaller, it presents a greater deposition of these species which would repel Ni2+.30 Moreover, the destruction of the micropores and the generation of larger pores allow Mo to migrate into the zeolite. These results suggest a lower Mo presence on the LaY zeolites, while the opposite occurs in the HY DA zeolites. These findings suggest that the size reduction of LaY zeolites could potentially impact the proximity of hydrogenating and acidic sites, bringing them closer to the surface of the catalysts.
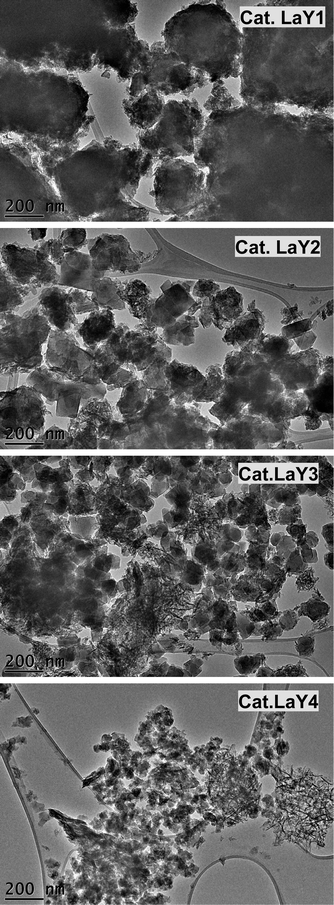
TEM micrographs of lanthanide zeolite-based materials were obtained, as shown Fig. 1. These micrographs show that the γ-alumina surrounds the polyhedral zeolite particles in form of fine filaments. Additionally, the morphology of the catalysts changes as the size of the LaY zeolite decreases. From these results, is possible to conclude that the larger the zeolite, the denser the zeolite–alumina clusters are also increased, resulting in a thicker alumina layer. In contrast, smaller zeolite sizes result in more porous clusters with thinner layers of γ-alumina. Interestingly, isolated aggregates of γ-alumina are also observed when the size of the zeolite is reduced. This suggests that the introduction of the pseudo-boehmite filaments between the nanosized Y zeolite particles requires more mechanical work.
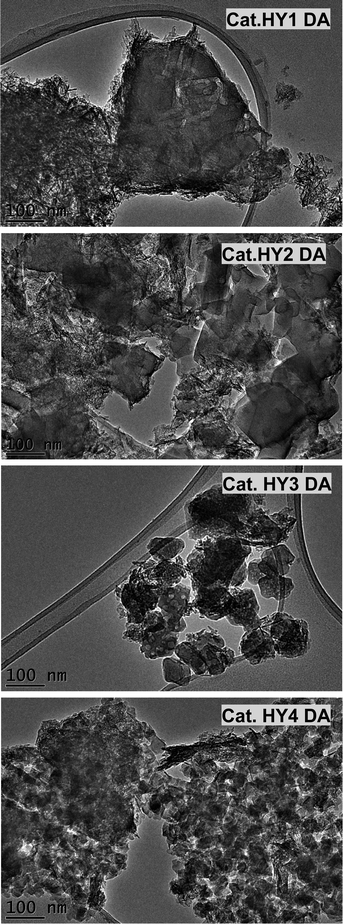
The TEM micrographs of HY DA zeolite-based catalysts (Fig. 2), also show the formation of zeolite–alumina agglomerates with higher porosity as the zeolite size decreases. Additionally, the HY1 DA catalyst shows the presence of interconnected cylindrical mesoporous channels inside zeolite (see Fig. S8†). Contrarily, the HY2 DA catalyst, with a Si/Al ratio similar to that of HY1 DA, exhibits an irregular polyhedral structure. This suggests that the steaming process has caused significant damage to the zeolite framework, but there is no evidence of the formation of intraparticle mesopores. On the other hand, the HY3 DA catalyst presents internal mesopores, but these are spherical and not interconnected. Finally, the HY4 DA catalyst does not show any visible mesopores, but there is evidence of internal wear in the crystalline structure. This suggests that there is a limit to the zeolite particle size for achieving the formation of interconnected intraparticle mesopores, which are necessary for the correct diffusion of heavy hydrocarbon molecules in the catalyst.
Conventional TEM micrographs were unable to distinguish the impregnated metals in the catalysts due to their small size. To overcome this limitation, elemental mapping was performed on the synthesized catalysts (Fig. S9–S16†). Regarding the Si mapping, the zeolite particles could be differentiated as this was the only material with this element. As for the Al mapping, both zeolite and alumina were observed, however it was seen that the catalysts with larger zeolite size experienced a more effective alumina covering as mentioned above. On the other hand, for the catalysts with lanthanide zeolites, the La is fixed in the same region of the zeolite since these ions were located within the zeolite framework by means of ion exchange. Moreover, it was found that all the catalysts had well-dispersed metals, Ni and Mo, throughout the material. There was no formation of large clusters of metals, and there was a slight tendency for Ni to be located in regions rich in Si, while Mo was inclined towards areas rich in Al. These findings were consistent with the XPS analysis.
3.2 Textural characterization of catalysts
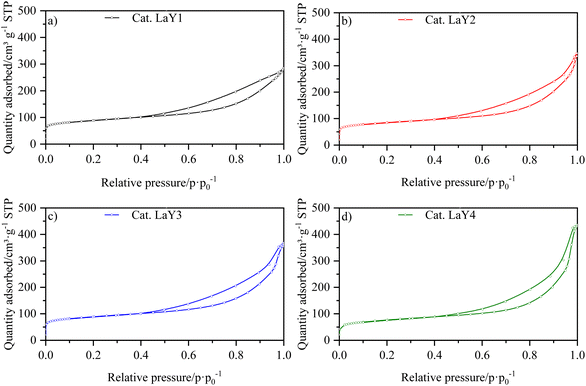
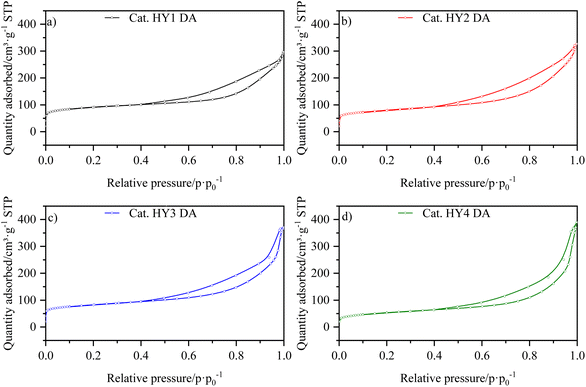
The isotherms for the catalysts LaY and HY DA, are shown in Fig. 3 and 4, respectively. It can be observed that at low pressures, the isotherms are of type I behavior owing to the microporous component of zeolite. At high pressures, the isotherms exhibit type IV behavior, which can be attributed to the presence of the mesoporous component of γ-Al2O3, as evidenced by the hysteresis observed in its N2 isotherm (Fig. S17†). The interparticle porosity of the nanozeolites also contributes to the elongated hysteresis, which exhibits a significant increase near p·p0−1 = 1 as the zeolite particle size decreases.The information extracted from the isotherms is collected in Table 5, which shows a decrease in micropore volume when smaller zeolite particles were used. The catalysts with lanthanide zeolites were the ones that better sustained the micropore volume varying size compared to the dealuminate one. In addition, an increase in the total volume of pores was observed for all the catalysts when a more nanosized Y zeolite was used, attributed to the presence of intraparticle mesoporosity. In accordance the lanthanide zeolite catalysts showed an increase in external area as particle size decreased. On the other hand, the steaming protonated zeolite catalysts showed an initial increase in external area, followed by a decrease, indicating that they tend to agglomerate as they become smaller due to the dealumination process.
| Catalyst | Vmicro (cm3 g−1) | Vtotal (cm3 g−1) | SBET (m2 g−1) | Sext. (m2 g−1) |
|---|---|---|---|---|
| Cat. LaY1 | 0.07 | 0.44 | 322 | 158 |
| Cat. LaY2 | 0.06 | 0.53 | 309 | 153 |
| Cat. LaY3 | 0.07 | 0.57 | 323 | 161 |
| Cat. LaY4 | 0.04 | 0.67 | 277 | 173 |
| Cat. HY1 DA | 0.08 | 0.45 | 334 | 147 |
| Cat. HY2 DA | 0.06 | 0.50 | 323 | 168 |
| Cat. HY3 DA | 0.06 | 0.57 | 300 | 151 |
| Cat. HY4 DA | 0.02 | 0.60 | 192 | 150 |
3.3 Thermogravimetric analysis of catalysts
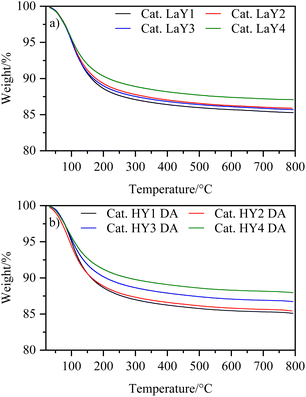
To investigate the thermal behavior of the catalysts, a thermogravimetric analysis was performed. Fig. 5 shows that the catalysts exhibit a single event associated with the loss of physically adsorbed water. This result suggests that the dehydroxylation process, which can damage the crystalline structure of zeolites, was prevented by the steaming calcination applied to HY DA zeolites and the lanthanum exchange used for LaY.All the catalysts showed a similar amount of water loss (∼15%) except for the catalysts having the HY3 DA and HY4 DA zeolites, which lost slightly less water (∼12%). This difference of the catalysts was probably due to the greater destruction of micropores experienced by the zeolites with a low silicon-aluminum ratio (2.2) during dealumination. However, since the catalysts contain 40% zeolite and 60% alumina, the difference in water loss was minimized, resulting in comparable amounts of catalysts used in the reactor. It is found in the literature that boehmite, which is an aluminum oxyhydroxide, is transformed into alumina by dehydration at 500 °C.31 Then, the resulting γ-alumina exhibits a weight loss of up to 10% by dehydration remaining constant up to 100 °C.32 Thus, knowing that the weight loss of all zeolites was ∼20% (except for HY3 DA and HY4 DA which is ∼14%), we achieved a good correlation with the data obtained at the time of computing the individual losses and the content of each component in the mixture.
3.4 Acid and hydrogenation sites
The presence and nature of acid sites in the catalysts were analyzed by Py-IR as a function of temperature, as shown in spectra Fig. S18 and S19.† Signals at ∼1540 cm−1 and ∼1450 cm−1 indicate Brønsted and Lewis acid sites, respectively. Additionally, the Lewis/Brønsted acid sites ratio at 400 °C for all catalysts is shown in Fig. 6. As a material rich in Lewis acid sites, γ-alumina modifies the acid nature of the catalysts, increasing the number of Lewis sites by a factor of three.21 However, the presence of Brønsted acid sites at high temperatures indicates the strong nature of these sites, originating from the zeolitic component of the catalyst. For those catalysts with the LaY zeolites having a Si/Al ratio around 2.5 a L/B ratio of 3.1 was found, while for those having a Si/Al ratio around 2.2 the L/B ratio was 3.7. This trend was also observed for the catalysts with HY DA zeolites where zeolites with lower Si/Al ratios also had higher L/B ratios in the catalyst. This phenomenon may be because zeolites with smaller particle size and lower Si/Al ratio have more structural defects and tend to be more easily destroyed during the calcination process that occurs between impregnations, and as a result, this can lead to a slight decrease the number of Brønsted sites. It was also observed that all HY DA zeolite-based catalysts exhibited lower L/B ratio compared to their lanthanum counterparts. This result is in contradiction with the result obtained for individual zeolites, since LaY zeolites had a higher number of Brønsted sites compared to the HY DA zeolites. However, since LaY zeolites are much heavier per mole than HY DA zeolites, to achieve the 60% alumina–40% zeolite ratio in the catalyst, less mole would have to be used from lanthanide zeolites than from protonate zeolites. This difference in mole quantity would result in a slight variation in the number of Brønsted sites between the two types of catalysts.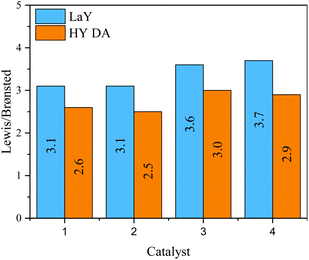 | ||
| Fig. 6 Relationship between Lewis/Brønsted acid sites in the catalysts with zeolites in their LaY and HY DA forms. | ||
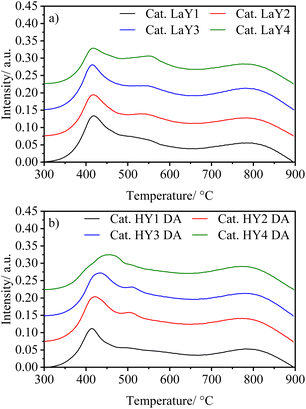
To visualize the effect that the particle size of Y zeolite has on the reducibility of the Mo and Ni species in HY DA and LaY catalysts, TPR experiments were performed in its oxide form. Fig. 7 shown TPR patterns of the catalysts, while Table 6 presents reduction temperature and H2 consumption data of the catalysts. Three main peaks are observed, one around 400 °C attributed to Mo octahedral species deposited on the alumina (Mo6+ to Mo4+), another in the 450–600 °C interval related to Mo octahedral supported on the zeolite, and a wide reduction peak at 800 °C assigned to the monomeric Mo species tetrahedrally coordinated (Mo4+ to Mo0).33–35 The low reduction temperature can be attributed to the incorporation of Ni into the structures of octahedral Mo species, which effectively reduces the interaction between these oxides and the support.36,37
| Sample | Temperature/°C | H2 consume/mmol g−1 | |||||
|---|---|---|---|---|---|---|---|
| Mo oct. 1 | Mo oct. 2 | Mo tet. | Mo oct. 1 | Mo oct. 2 | Mo tet. | Total | |
| a Oct: octahedral. Tet: tetrahedral. | |||||||
| Cat. LaY1 | 418 | 522 | 785 | 0.7 | 1.8 | 1.3 | 3.8 |
| Cat. LaY2 | 416 | 535 | 786 | 0.7 | 1.8 | 1.2 | 3.7 |
| Cat. LaY3 | 415 | 543 | 786 | 0.7 | 2.0 | 1.2 | 3.9 |
| Cat. LaY4 | 417 | 554 | 784 | 0.5 | 2.1 | 1.2 | 3.8 |
| Cat. HY1 DA | 423 | 528 | 778 | 0.8 | 2.2 | 0.8 | 3.8 |
| Cat. HY2 DA | 420 | 512 | 782 | 1.0 | 2.0 | 0.7 | 3.8 |
| Cat. HY3 DA | 418 | 512 | 781 | 0.9 | 2.1 | 0.8 | 3.9 |
| Cat. HY4 DA | 420 | 478 | 790 | 0.9 | 2.3 | 0.8 | 3.9 |
From Fig. 7 is possible observed that in both types of catalysts (LaY and HY DA) the first reduction peak occurs at practically the same temperature regardless of the change in zeolite particle size. This would support the fact that these Mo species, which form laminar structures, would be supported on the alumina. The second peak does present a change in metal reduction temperature as the zeolite type and particle size change what indicates that these Ni–Mo species would be interacting with the zeolite, which is consistent with TEM-mapping results.38 For catalysts with LaY zeolites it is observed that as the particle size decreases the reduction temperature of the Ni–Mo species increase, this suggest that these metal oxides have a greater interaction with the smaller zeolites, probably due to the greater number of hydroxyl bonds formed by the La3+ ions on the surface of this zeolite.39 In contrast, for HY DA zeolite-based catalysts, a decrease in the reduction temperature of this second peak is observed when the size of the zeolite decreases. The shift of this peak towards the temperature of the first one can be attributed to the greater dealumination in smaller Y zeolites, resulting in a higher number of aluminum oxides zeolite surfaces, which interact with the Ni–Mo species. The interaction of the metallic oxide is mainly with the γ-alumina and hydrogen consumption presented by all the catalysts is practically the same (3.7–3.9 mmol g−1), indicating their similar hydrogenating capacity.
3.5 Hydrodesulfurization of 3-methyl thiophene
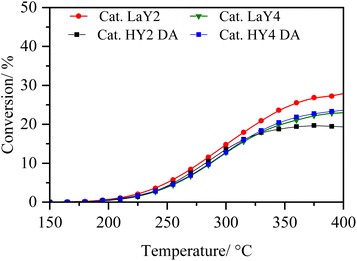
In order to analyse under sulphuration conditions the hydrogenating capacity of the metals impregnated in the catalysts, these were evaluated in the hydrodesulphurization reaction of 3-methyl thiophene (Fig. 8 and 9).40 In this case, the catalysts LaY2, LaY4, HY2 DA and HY4 DA were chosen. Fig. 8 shown how the conversion of 3-methyl thiophene is increased by increasing the temperature, reaching a maximum conversion of about 20 ± 5% at 350 °C in all materials. This maximum conversion at same value could be attributed to the maximum hydrogenation capacity that the materials would reach due to the amount of impregnated Ni and Mo metals is practically the same as seen in the elemental analysis. However, although slight differences in the maximum conversion were found (potentially related to the presence of the zeolite and its acidic sites), no clear trend related to size or acidic nature was observed.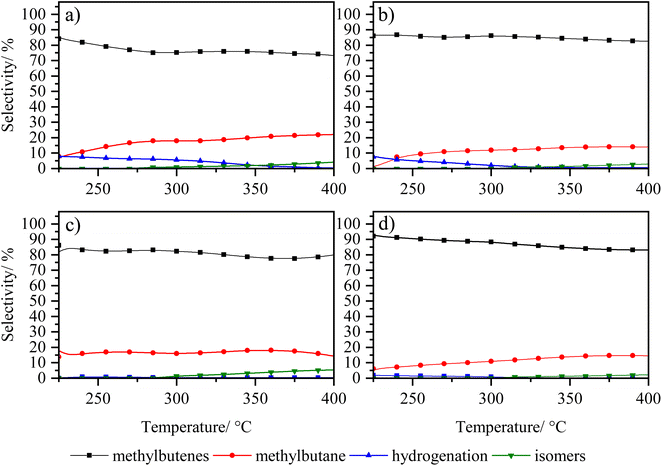 | ||
| Fig. 9 Selectivity of 3-methyl thiophene vs. temperature of zeolite catalysts (a) LaY1, (b) LaY4, (c) HY1 DA and (d) HY4 DA. | ||
The selectivity of the reaction, as shown in Fig. 9, shows that the main products obtained are the C5 olefins or methyl butenes, followed by the maximum hydrogenation product, 2-methyl butane. At lower temperatures, the presence of 3-methyl tetrahydrothiophene, the initial product of hydrogenation of 3-methyl thiophene, is observed.41 At elevated temperatures, the acid sites within zeolite facilitate ring opening, resulting in the formation of the olefin products. At high temperatures, the formation of the 2-pentene, derived from the isomerization of the C5 olefins within the acid sites of the zeolites, is evidenced.42 In addition, it is observed that a greater amount of these isomers is present in both LaY1 and HY1 DA zeolites, indicating that the larger size of the zeolite gives enhances its shape selectivity towards the 2-pentene.
The experimental results reveal that all catalysts exhibit comparable hydrogenation capacity, regardless of the inherent acidity or particle dimensions of the zeolite, prior to secondary reactions occurring at elevated temperatures. Therefore, the evidence suggests that differences in subsequent hydrocracking activity are linked to the quantity and nature of acid sites in zeolite. Additionally, the proximity between metal and acid sites would improve with smaller zeolite sizes, rather than being influenced by the hydrogenation function capability itself, as shown above.
3.6 Vacuum gas oil hydrocracking
The catalysts derived from the synthesized nanometrics Y zeolites were evaluated in the hydrocracking vacuum gas oil reaction. A series of similar catalysts were also evaluated using commercially available Y zeolites from Zeolyts®. The aim of this procedure was to compare the activity of the commercially available zeolites with those synthesized in this study. Three different zeolites were utilized: CBV 300, identified as Y zeolite (Si/Al ratio of 2.5), CBV 400 (Si/Al ratio of 4.0), which is the acid dealuminated Y zeolite from the mildly steamed CBV 300, and the CBV 600 (Si/Al ratio of 9.5), a dealuminated Y zeolite from moderately steamed CBV 400.43 The catalysts obtained with these commercial zeolites were evaluated over temperature range of 350 °C to 370 °C every 5 °C. The conversion and selectivity vs. temperature curves of the CBV 300, CBV 400 and CBV 600 zeolite-based catalysts are shown in the Fig. S20(a) and (b),† respectively. Within the same temperature range, there is an increase in conversion when the dealumination process is performed. The conversion for these materials is 5–15% for CBV 300, 40–70% for CBV 400 and 70–90% for CBV 600, this tendency is explained in the literature44,45 by the enhanced strength of the zeolite's acidic sites resulting from the dealumination process. Additionally, the formation of intraparticle mesoporous facilitates the transportation of the large hydrocarbon chains through the zeolite, allowing access to previously inaccessible Brønsted acid sites.46 However, in the Fig. S20(b)† it is observed that dealumination decreases the selectivity towards middle distillates (CBV 400 and CBV 600 catalyst). This indicates that the generation of intraparticle mesopores causes excessive cracking of hydrocarbon molecules probably due to the loss of proximity between the metallic sites and the acid sites.47 Therefore, a second hydrotreatment (CBV 400 to CBV 600) improves the conversion of the catalyst but does not enhance the selectivity towards middle distillates.The relationship between the conversion and the yield to middle distillates of each catalyst was analyzed and showed in Fig. S20(c).† This comparison, aimed at evaluating materials under the same conversion within the same temperature range, allowed the generation of curves that display the optimal relationship between conversion and yield. Catalyst based on protonated zeolite (HY from zeolite CBV 300) exhibits low catalytic activity in vacuum gas oil hydrocracking. This can be attributed to the limited accessibility of acidic sites of the zeolite for the heavy molecules of the VGO. As a result, contact with the interior of the zeolite, where most of the acidic sites are located, is low. However, in the analyzed temperature interval, an increase in the yield is observed, indicating that higher reaction temperatures are required to achieve optimal performance. On the other hand, catalysts based on protonated zeolites with dealumination by steaming (HY DA of the zeolites CBV 400 and CBV 600) presented better catalytic activity. The catalyst CBV 600 showed the highest yield towards middle distillates (15% yield at 65% conversion). These findings, especially the isoconversion (Fig. S20(c)†), highlight the significant challenge encountered in improving the performance of catalysts which do not exceed 15% yield toward middle distillate under reaction conditions used in this study.
For this reason, catalysts based on nanosized Y zeolite have emerged as highly alternative for used in hydrocracking VGO reactions, since they can expose more Brønsted acid sites on the surface and enhanced the proximity between these sites and the hydrogenating sites.
Preliminary results were obtained in the HCK reaction with catalysts based on acidic zeolites, without undergoing dealumination or lanthanum exchange processes, named HY1 and HY4 (with HY1 being larger in size than HY4). These materials were evaluated to better understand the effect of dealumination and lanthanum exchange on selectivity towards middle distillates. The methodology reported by us in ref. 21 was followed for the synthesis of zeolites HY1 and HY4, and the catalyst preparation was carried out in the same manner as all the catalysts reported in this study.
Fig. S21† shows that the HY1 catalyst demonstrated slightly higher conversion than HY4 throughout the temperature range. However, HY4 showed a moderately higher selectivity towards middle distillate, suggesting that a smaller-sized zeolite improves the diffusion of heavy hydrocarbons and/or the proximity between active sites of the catalyst without losing too much activity.48 Nevertheless, even though performance is improved to almost 20%, the conversion range associated to these two materials remains low. Therefore, to address the issue of low conversion and selectivity observed with protonated zeolites, the focus shifted towards developing catalysts based on dealuminated zeolites with steaming. The steaming process of the nanosized Y zeolites was carried out to imitate the zeolite CBV 400, but always considering that, being nanometric sized, they would experience a greater affectation in their crystalline structure.21
Fig. 10 shows the increment in conversion of the catalysts in the following order: HY1 DA > HY2 DA > HY3 DA > HY4 DA. Among them, HY3 DA and HY4 DA catalysts exhibit the lowest catalytic activity in the temperature range analyzed. This behavior can be attributed to their smaller size, which makes them suffer the steaming process more intensely, and to their lower Si/Al ratios, which result in less strong acidic sites.21,49 The catalysts that showed a higher conversion in the analyzed temperature range are those based on HY1 DA and HY2 DA zeolites, which are the ones with higher Si/Al ratio. However, it is observed that the catalyst based on zeolite HY2 DA quickly deactivated, similarly to the catalyst with zeolite CBV 400.
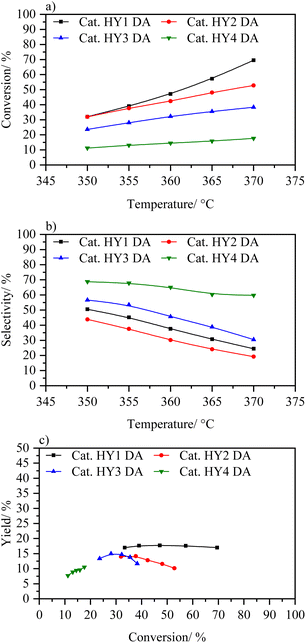 | ||
| Fig. 10 (a) Conversion wt% vs. temperature, (b) selectivity to middle distillates wt% vs. temperature and (c) yield to distillates wt% vs. conversion to catalysts HY1 DA, HY2 DA, HY3 DA, and HY4 DA. | ||
The catalyst based on zeolite HY1 DA did show a better performance, reaching conversions of up to 70%, with yields of 17% towards middle distillates. This performance is higher to the catalyst with zeolite CBV 400, with which it was being compared due to the same elemental composition and dealumination treatment. In fact, this catalyst demonstrated a slightly better yield than catalyst with CBV 600 at the same conversion without use a second dealumination process as applied in this commercial zeolite. With these trends in HY DA zeolites, it can be concluded that the steaming process is too aggressive with nanometric zeolites (especially with those with a low Si/Al ratio) what deactivates their acidic sites. Only the HY1 DA zeolite with an adequate size and a suitable Si/Al ratio was able to withstand the steaming process and thus achieve the formation of intra- and inter-particle mesopores.20 This synergy is reflected in the almost constant yield throughout the variation in the conversion.
Because the dealumination by steaming process showed a strong deactivation of the nanozeolites, it was decided to make a softer steaming process than the original one (14.4% water vapor), which we call HY DA*. The catalytic activity (Fig. S22†) of these materials indicates that the conversion follows the order HY1 DA* > HY2 DA* > HY3 DA* > HY4 DA*, and the selectivity towards middle distillates the opposite order. From these plots, it was demonstrated that the softer dealumination had a positive effect on catalysts based in smaller sizes zeolites, as its conversions in the temperature range analysed were better compared to the catalysts HY2 DA, HY3 DA and HY4 DA above mentioned. The catalyst based on HY2 DA* zeolite was the one that showed the best behaviour, by reaching a higher yield in its conversion range (17% to 50% conversion). However, none of these softer dealuminated catalysts showed better catalytic activity than the HY1 DA catalyst; in fact, its counterpart, the HY1 DA* catalyst, showed a lower yield to middle distillate, probably due to the lack of intraparticle mesopore development.
According to the above results, a proper dealumination process is required to enhance the activity of the catalysts based in nanometric zeolites. However, this process is counterproductive when the zeolite is too small. Therefore, to analyse the real advantage of the nano sized Y zeolites in the hydrocracking reaction, a process must be used in which the structure is not compromised, nor is its acidity. Thus, an exchange ion lanthanum is proposed, as it does not substantially destroy the crystalline framework of the zeolite and in its coordination sphere the necessary acidic Brønsted sites are generated.50 Fig. 11 shows activity catalytic of catalysts based on zeolites LaY. These materials present the following order in terms of conversion LaY1 > LaY2 > LaY3 > LaY4. However, the difference in conversion between them is small (around 10% between the catalysts LaY1 and LaY4) due LaY zeolites showed the least difference in the number of acidic sites when they were decreasing in size.21 On the other hand, there is a greater difference in selectivity that is related to the size of the zeolite, with the selectivity improving for zeolites of smaller sizes, LaY4 > LaY3 > LaY2 > LaY1. However, when analyzing the isoconversion (Fig. 11c), the performance of the catalysts follows the order LaY4 > LaY2 > LaY3 > LaY1, this indicates that the performance towards middle distillates would depend on the size of zeolite and the Si/Al ratio of the framework. Mesoporous intracrystalline structures, resulting from smaller crystallite sizes, improve selectivity towards middle distillates by mitigating excessive hydrocracking. In addition, stronger Brønsted acid sites, derived from higher Si/Al ratio zeolites, contribute to increasing the conversion. Consequently, a synergistic effect between these two parameters enhances middle distillate production or yield.15,51,52 Thus, although LaY3 is a smaller zeolite than LaY2, the latter has a higher Si/Al ratio which makes it have a stronger Brønsted acid sites and therefore much higher conversion.53,54 Similarly, catalysts based on zeolites LaY1 and LaY2 at 370 °C show a higher conversion than their counterparts LaY3 and LaY4 at the same temperature range. Finally, the results obtained in this work strongly suggest that catalysts based on nanometric zeolites LaY lead to an increase in performance (up to 27% for the catalyst with zeolite LaY4, and up to 22% for the catalyst with zeolite LaY2 at ∼50% conversion). In addition, the response of these two curves is upward, so it is expected that by increasing the reaction temperature higher yields can be achieved.
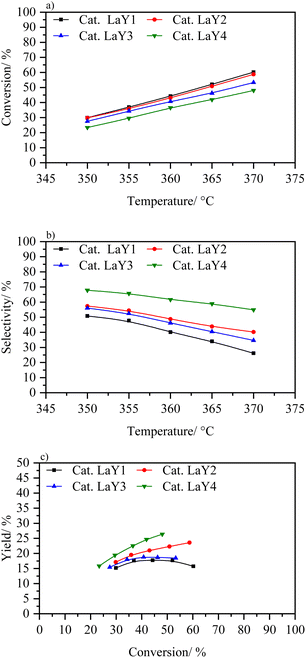 | ||
| Fig. 11 (a) Conversion vs. temperature, (b) selectivity to middle distillates vs. temperature and (c) yield to distillates vs. conversion to catalysts LaY1, LaY2, LaY3, and LaY4. | ||
When comparing the catalysts based on HY1 and HY4 zeolites with those exchanged with lanthanum, it is evident that lanthanum significantly improves the catalytic performance. The conversion approximately doubles at each temperature. While HY4 shows higher selectivity towards middle distillates compared to HY1, the LaY catalysts show an even greater improvement in selectivity with zeolite size reduction. Thus, the combination of lanthanum exchange with zeolite size optimization improves both conversion and selectivity towards middle distillates, surpassing the performance of the original HY zeolites.
Table S2† presents the conversion and selectivity to middle distillates and naphtha for each catalyst at the temperature that achieved the highest MD yield. While MD selectivity increases, a decrease in naphtha selectivity is observed. Furthermore, LaY catalysts generally show higher hydrocracking conversion and higher MD yield than HY DA catalysts. These results indicate that lanthanum-exchanged zeolites significantly enhance the catalytic efficiency in hydrocracking.
4 Conclusions
The elemental composition analysis shows similarities among catalysts, facilitating the comparison of catalytic behavior alongside other physicochemical properties. XPS analysis demonstrated that metal distribution varies with zeolite size and acidity, affecting catalytic performance. Lanthanide zeolite-based catalysts exhibit higher Ni content in smaller sizes, contrasting with dealuminated protonated zeolites. This suggests a proximity of acidic sites to hydrogenating sites in LaY catalysts. Intraparticle mesopores were found in catalysts HY DA, important for molecule transport. Elemental mapping showed homogeneous zeolite–alumina distribution in catalyst with nanosize Y zeolites, with lanthanum exclusively in LaY zeolites. Lewis sites increase with alumina incorporation, impacting the Lewis/Brønsted ratio inversely related to zeolite size. Hydrogenating sites are similar across catalysts, with slightly more reducible ones in LaY. Ni–Mo species exhibit stronger interaction with catalyst based on smaller zeolites in LaY, opposite for HY STM catalyst. The hydrodesulfurization reaction shows that the catalysts obtained have similar hydrogenating capacities, maintaining consistent conversion across varying reaction temperatures. Moreover, as the reaction temperature increases, there is a notable increase in the formation of 2-pentene, attributed to the acidic sites present in the zeolites. Meanwhile, in the hydrocracking reaction, the essential role of dealumination by steaming in zeolites was demonstrated to enhance catalytic activity due to activating strong acidic sites within them. However, nanosized Y zeolites suffer significant destruction under steaming dealumination, resulting in low yield to middle distillate from the catalysts. Consequently, achieving favorable outcomes necessitates optimal particle size and steaming conditions, particularly for enhancing conversion and selectivity toward medium distillates. On the other hand, catalysts based on lanthanide zeolites exhibit increased activity with decreased zeolite size. Specifically, zeolites with higher Si/Al ratio (≈2.5) demonstrate higher conversion under similar reaction temperatures, yielding above 20%, surpassing those achievable with commercial zeolite catalysts.Data availability
The data underlying this study are available in the published article and its ESI.†Author contributions
The manuscript was written through contributions of all authors. Carlos Mendoza and Cecilia Manrique contributed equally to the writing of the article. All authors have given approval to the final version of the manuscript.Conflicts of interest
The authors declare no conflicts of interest.Acknowledgements
The authors acknowledge the financial support from the University of Antioquia and the Committee for the Development of Research – CODI for the project 2022-55551. Carlos Mendoza acknowledges to the Escuela Normal Superior Genoveva Diaz Educational Institution for providing the necessary time to complete the article's writing.References
- A. Gruia, Distillate Hydrocracking, in Handbook of Petroleum Processing, Springer Netherlands, Dordrecht, 2008, pp. 287–320, DOI:10.1007/1-4020-2820-2_7.
- J. Weitkamp, Catalytic Hydrocracking—Mechanisms and Versatility of the Process, ChemCatChem, 2012, 4(3), 292–306, DOI:10.1002/cctc.201100315.
- J. Zecevic, G. Vanbutsele, K. P. de Jong and J. A. Martens, Nanoscale Intimacy in Bifunctional Catalysts for Selective Conversion of Hydrocarbons, Nature, 2015, 528(7581), 245–248, DOI:10.1038/nature16173.
- J. I. Mirena, J. W. Thybaut, G. B. Marin, J. A. Martens and V. V. Galvita, Impact of the Spatial Distribution of Active Material on Bifunctional Hydrocracking, Ind. Eng. Chem. Res., 2021, 60(18), 6357–6378, DOI:10.1021/acs.iecr.0c05528.
- J. Scherzer and A. J. Gruia, Hydrocracking Science and Technology, CRC Press, 1996, DOI:10.1201/9781482233889.
- C. Bouchy, G. Hastoy, E. Guillon and J. A. Martens, Fischer-Tropsch Waxes Upgrading via Hydrocracking and Selective Hydroisomerization, Oil Gas Sci. Technol., 2009, 64(1), 91–112, DOI:10.2516/ogst/2008047.
- C. Marcilly, Catalytic Dewaxing, in Encyclopedia of Lubricants and Lubrication, Springer Berlin Heidelberg, Berlin, Heidelberg, 2014, p. 210, DOI:10.1007/978-3-642-22647-2_200057.
- M. Bricker, V. Thakkar and J. Petri, Hydrocracking in Petroleum Processing, in Handbook of Petroleum Processing, Springer International Publishing, Cham, 2015, pp. 317–359, DOI:10.1007/978-3-319-14529-7_3.
- K. Guo, H. Li and Z. Yu, In-Situ Heavy and Extra-Heavy Oil Recovery: A Review, Fuel, 2016, 185, 886–902, DOI:10.1016/j.fuel.2016.08.047.
- C. Manrique, R. Solano, C. Mendoza, S. Amaya and A. Echavarría, Hierarchical Submicrosized Y Zeolites Prepared by Sequential Desilication–Dealumination Post-Synthesis Modification and Their Catalytic Performance in Vacuum Gas Oil Hydrocracking, New J. Chem., 2024, 48(14), 6188–6200, 10.1039/D3NJ05551E.
- J. L. Agudelo, E. J. M. Hensen, S. A. Giraldo and L. J. Hoyos, Influence of Steam-Calcination and Acid Leaching Treatment on the VGO Hydrocracking Performance of Faujasite Zeolite, Fuel Process. Technol., 2015, 133, 89–96, DOI:10.1016/j.fuproc.2015.01.011.
- J. Scherzer and A. J. Gruia, Hydrocracking Science and Technology, CRC Press, IFP Energies Nouvelles, Rond-point de l’Échangeur de Solaize, BP 3, 69360 Solaize, France, 1996, vol. 191, DOI:10.1201/9781482233889.
- D. Verboekend, G. Vilé and J. Pérez-Ramírez, Hierarchical Y and USY Zeolites Designed by Post-Synthetic Strategies, Adv. Funct. Mater., 2012, 22(5), 916–928, DOI:10.1002/adfm.201102411.
- J. Francis, E. Guillon, N. Bats, C. Pichon, A. Corma and L. J. Simon, Design of Improved Hydrocracking Catalysts by Increasing the Proximity between Acid and Metallic Sites, Appl. Catal., A, 2011, 409–410, 140–147, DOI:10.1016/j.apcata.2011.09.040.
- Q. Cui, Y. Zhou, Q. Wei, X. Tao, G. Yu, Y. Wang and J. Yang, Role of the Zeolite Crystallite Size on Hydrocracking of Vacuum Gas Oil over NiW/Y-ASA Catalysts, Energy Fuels, 2012, 26(8), 4664–4670, DOI:10.1021/ef300544c.
- A. Guzman, I. Zuazo, A. Feller, R. Olindo, C. Sievers and J. A. Lercher, On the Formation of the Acid Sites in Lanthanum Exchanged X Zeolites Used for Isobutane/Cis-2-Butene Alkylation, Microporous Mesoporous Mater., 2005, 83(1–3), 309–318, DOI:10.1016/j.micromeso.2005.04.024.
- C. Deng, J. Zhang, L. Dong, M. Huang, L. Bin, G. Jin, J. Gao, F. Zhang, M. Fan, L. Zhang and Y. Gong, The Effect of Positioning Cations on Acidity and Stability of the Framework Structure of Y Zeolite, Sci. Rep., 2016, 6(1), 23382, DOI:10.1038/srep23382.
- A. Akah, Application of Rare Earths in Fluid Catalytic Cracking: A Review, J. Rare Earths, 2017, 35(10), 941–956, DOI:10.1016/S1002-0721(17)60998-0.
- X. Gao, Z. Qin, B. Wang, X. Zhao, J. Li, H. Zhao, H. Liu and B. Shen, High Silica REHY Zeolite with Low Rare Earth Loading as High-Performance Catalyst for Heavy Oil Conversion, Appl. Catal., A, 2012, 413–414, 254–260, DOI:10.1016/j.apcata.2011.11.015.
- C. Mendoza and A. Echavarría, A Systematic Study on the Synthesis of Nanosized Y Zeolite without Using Organic Structure-Directing Agents: Control of Si/Al Ratio, J. Porous Mater., 2022, 29(3), 907–919, DOI:10.1007/s10934-022-01218-0.
- C. J. Mendoza Merlano, T. A. Zepeda, G. Alonso-Nuñez, J. N. Diaz de Leon, C. Manrique and A. Echavarría Isaza, Effect of Crystal Size on the Acidity of Nanometric Y Zeolite: Number of Sites, Strength, Acid Nature, and Dehydration of 2-Propanol, New J. Chem., 2022, 46(30), 14543–14556, 10.1039/D2NJ01530G.
- C. Manrique, A. Guzmán, J. Pérez-Pariente, C. Márquez-Álvarez and A. Echavarría, Vacuum Gas-Oil Hydrocracking Performance of Beta Zeolite Obtained by Hydrothermal Synthesis Using Carbon Nanotubes as Mesoporous Template, Fuel, 2016, 182, 236–247, DOI:10.1016/j.fuel.2016.05.097.
- J. L. Agudelo, E. J. M. Hensen, S. A. Giraldo and L. J. Hoyos, Effect of USY Zeolite Chemical Treatment with Ammonium Nitrate on Its VGO Hydrocracking Performance, Energy Fuels, 2016, 30(1), 616–625, DOI:10.1021/acs.energyfuels.5b02021.
- M. Thommes, K. Kaneko, A. V. Neimark, J. P. Olivier, F. Rodriguez-Reinoso, J. Rouquerol and K. S. W. Sing, Physisorption of Gases, with Special Reference to the Evaluation of Surface Area and Pore Size Distribution (IUPAC Technical Report), Pure Appl. Chem., 2015, 87(9–10), 1051–1069, DOI:10.1515/pac-2014-1117.
- ASTM D7213-15, Standard Test Method for Boiling Range Distribution of Petroleum Distillates in the Boiling Range from 100 °C to 615 °C by Gas Chromatography, ASTM International, West Conshohocken, PA, 2015, DOI:10.1520/D7213-15R19.
- D. R. Baer, Guide to Making XPS Measurements on Nanoparticles, J. Vac. Sci. Technol., A, 2020, 38(3), 1–7, DOI:10.1116/1.5141419.
- X. Zhu, H. Cho, M. Pasupong and J. R. Regalbuto, Charge-Enhanced Dry Impregnation: A Simple Way to Improve the Preparation of Supported Metal Catalysts, ACS Catal., 2013, 3(4), 625–630, DOI:10.1021/cs3008347.
- P. S. F. Mendes, A.-L. Taleb, A.-S. Gay, A. Daudin, C. Bouchy, J. M. Silva and M. F. Ribeiro, Nanoscale Insights into Pt-Impregnated Mixtures of Zeolites, J. Mater. Chem. A, 2017, 5(32), 16822–16833, 10.1039/C7TA02534C.
- M. Kosmulski, The PH Dependent Surface Charging and Points of Zero Charge. VII. Update, Adv. Colloid Interface Sci., 2018, 251(2), 115–138, DOI:10.1016/j.cis.2017.10.005.
- M. Niwa, S. Sota and N. Katada, Strong Brønsted Acid Site in HZSM-5 Created by Mild Steaming, Catal. Today, 2012, 185(1), 17–24, DOI:10.1016/j.cattod.2011.09.028.
- A. H. Munhoz, L. G. de Andrade e Silva, L. F. de Miranda and R. C. Andrades, Characterization of Gamma-Alumina Obtained from Aged Pseudoboehmites, in Characterization of Minerals, Metals, and Materials 2016, Springer International Publishing, Cham, 2016, vol. 3, pp. 779–785, DOI:10.1007/978-3-319-48210-1_98.
- S. P. Dubey, A. D. Dwivedi, M. Sillanpää, H. Lee, Y.-N. Kwon and C. Lee, Adsorption of As(V) by Boehmite and Alumina of Different Morphologies Prepared under Hydrothermal Conditions, Chemosphere, 2017, 169, 99–106, DOI:10.1016/j.chemosphere.2016.11.052.
- C. Zhang, M. Brorson, P. Li, X. Liu, T. Liu, Z. Jiang and C. Li, CoMo/Al2O3 Catalysts Prepared by Tailoring the Surface Properties of Alumina for Highly Selective Hydrodesulfurization of FCC Gasoline, Appl. Catal., A, 2019, 570, 84–95, DOI:10.1016/j.apcata.2018.10.039.
- H. Yin, T. Zhou, Y. Liu, Y. Chai and C. Liu, NiMo/Al2O3 Catalyst Containing Nano-Sized Zeolite Y for Deep Hydrodesulfurization and Hydrodenitrogenation of Diesel, J. Nat. Gas Chem., 2011, 20(4), 441–448, DOI:10.1016/S1003-9953(10)60204-6.
- L. Qu, MAS NMR, TPR, and TEM Studies of the Interaction of NiMo with Alumina and Silica–Alumina Supports, J. Catal., 2003, 215(1), 7–13, DOI:10.1016/S0021-9517(02)00181-1.
- R. Zhao, L. Zeng, J. Liang and C. Liu, Interaction between Ni Promoter and Al2O3 Support and Its Effect on the Performance of NiMo/γ-Al2O3 Catalyst in Hydrodesulphurization, J. Fuel Chem. Technol., 2016, 44(5), 564–569, DOI:10.1016/S1872-5813(16)30026-3.
- W. Han, S. Wang, X. Li, B. Ma, M. Du, L. Zhou, Y. Yang, Y. Zhang and H. Ge, Effect of Fe, Co and Ni Promoters on MoS2 Based Catalysts for Chemoselective Hydrogenation of Nitroarenes, RSC Adv., 2020, 10(14), 8055–8065, 10.1039/D0RA00320D.
- T. Klimova, D. Solís, J. Ramírez and A. López-Agudo, NiMo/HNaY(x)-Al2O3 Catalysts for Hydrodesulfurization of Hindered Dibenzothiophenes: Effect of the Preparation Method, in Studies in Surface Science and Catalysis, 2000, vol. 143, pp. 267–275, DOI:10.1016/S0167-2991(00)80665-5.
- Y. Xu, W. Liu, S.-T. Wong, L. Wang and X. Guo, Dehydrogenation and Aromatization of Methane in the Absence of Oxygen on Mo/HZSM-5 Catalysts before and after NH4OH Extraction, Catal. Lett., 1996, 40(3–4), 207–214, DOI:10.1007/BF00815284.
- O. G. Salnikov, D. B. Burueva, D. A. Barskiy, G. A. Bukhtiyarova, K. V. Kovtunov and I. V. Koptyug, A Mechanistic Study of Thiophene Hydrodesulfurization by the Parahydrogen-Induced Polarization Technique, ChemCatChem, 2015, 7(21), 3508–3512, DOI:10.1002/cctc.201500691.
- N. Dos Santos, H. Dulot, N. Marchal and M. Vrinat, New Insight on Competitive Reactions during Deep HDS of FCC Gasoline, Appl. Catal., A, 2009, 352(1–2), 114–123 CrossRef CAS.
- J. Aliaga, T. Zepeda, J. Araya, F. Paraguay-Delgado, E. Benavente, G. Alonso-Núñez, S. Fuentes and G. González, Low-Dimensional ReS2/C Composite as Effective Hydrodesulfurization Catalyst, Catalysts, 2017, 7(12), 377, DOI:10.3390/catal7120377.
- D. Verboekend, N. Nuttens, R. Locus, J. Van Aelst, P. Verolme, J. C. Groen, J. Pérez-Ramírez and B. F. Sels, Synthesis, Characterisation, and Catalytic Evaluation of Hierarchical Faujasite Zeolites: Milestones, Challenges, and Future Directions, Chem. Soc. Rev., 2016, 45(12), 3331–3352, 10.1039/C5CS00520E.
- A. Palčić and V. Valtchev, Analysis and Control of Acid Sites in Zeolites, Appl. Catal., A, 2020, 606, 117795, DOI:10.1016/j.apcata.2020.117795.
- T. T. Le, A. Chawla and J. D. Rimer, Impact of Acid Site Speciation and Spatial Gradients on Zeolite Catalysis, J. Catal., 2020, 391, 56–68, DOI:10.1016/j.jcat.2020.08.008.
- R. Saab, K. Polychronopoulou, L. Zheng, S. Kumar and A. Schiffer, Synthesis and Performance Evaluation of Hydrocracking Catalysts: A Review, J. Ind. Eng. Chem., 2020, 89, 83–103, DOI:10.1016/j.jiec.2020.06.022.
- J. Qi, H. Jia, F. Wang, H. Gao, B. Qin, X. Zhang, J. Ma, Y. Du and R. Li, Dominant Role of Zeolite in Coordination between Metal and Acid Sites on an Industrial Catalyst for Tetralin Hydrocracking, React. Chem. Eng., 2024, 9(4), 940–949, 10.1039/D3RE00605K.
- O. E. Brandt Corstius, M. Kikkert, S. T. Roberts, E. J. Doskocil, J. E. S. van der Hoeven and P. E. de Jongh, Mass Transport Effects in Gas-Phase Selective Hydrogenation of 1,3-Butadiene over Supported Pd, React. Chem. Eng., 2024, 9, 1726–1738, 10.1039/D4RE00039K.
- C. Liu, G. Li, E. J. M. Hensen and E. A. Pidko, Relationship between Acidity and Catalytic Reactivity of Faujasite Zeolite: A Periodic DFT Study, J. Catal., 2016, 344, 570–577, DOI:10.1016/j.jcat.2016.10.027.
- R. C. Shiery, S. J. McElhany and D. C. Cantu, Effect of Lanthanum Ions on the Brønsted Acidity of Faujasite and Implications for Hydrothermal Stability, J. Phys. Chem. C, 2021, 125(24), 13649–13657, DOI:10.1021/acs.jpcc.1c02932.
- P. P. Dik, I. G. Danilova, I. S. Golubev, M. O. Kazakov, K. A. Nadeina, S. V. Budukva, V. Y. Pereyma, O. V. Klimov, I. P. Prosvirin, E. Y. Gerasimov, T. O. Bok, I. V. Dobryakova, E. E. Knyazeva, I. I. Ivanova and A. S. Noskov, Hydrocracking of Vacuum Gas Oil over NiMo/Zeolite-Al2O3: Influence of Zeolite Properties, Fuel, 2019, 237, 178–190, DOI:10.1016/j.fuel.2018.10.012.
- L. Ding, H. Sitepu, S. A. Al-Bogami, D. Yami, M. Tamimi, K. Shaik and E. Sayed, Effect of Zeolite-Y Modification on Crude-Oil Direct Hydrocracking, ACS Omega, 2021, 6(43), 28654–28662, DOI:10.1021/acsomega.1c03029.
- M. He, J. Zhang, R. Liu, X. Sun and B. Chen, The Distribution and Strength of Brönsted Acid Sites on the Multi-Aluminum Model of FER Zeolite: A Theoretical Study, Catalysts, 2017, 7(12), 11, DOI:10.3390/catal7010011.
- Z. Mo, Q. Li, Y. Qin, L. Duan, X. Zhang and L. Song, A DFT Study of the Effect of NNN Al Atom on Strength of Brönsted Acid Sites of HY Zeolite, Mol. Simul., 2016, 42(12), 986–992, DOI:10.1080/08927022.2015.1135332.
Footnote |
| † Electronic supplementary information (ESI) available: XRD patter of synthesized zeolites, SEM and TEM images of synthesized zeolites, Si/Al ratio in bulk and the NiMo ratio on the surface, XPS graphics, elemental mapping of catalysts, dark-field TEM micrograph, and N2 isotherms of γ-Al2O3, IR-Py spectra. Properties of Colombian vacuum gas oil Furthermore, comprehensive data on the hydrocracking reaction for each sample. See DOI: https://doi.org/10.1039/d4ra04664a |
| This journal is © The Royal Society of Chemistry 2024 |


