 Open Access Article
Cholesterol inhibits oxygen permeation through biological membranes: mechanism against double-bond peroxidation†‡
Phansiri Boonnoyab,
Minchakarn Janladab,
Behnaz Bagheri cd,
Cristiano Diase,
Mikko Karttunen
 fg and
Jirasak Wong-ekkabut
 *ab
*ab
aDepartment of Physics, Faculty of Science, Kasetsart University, 50 Ngamwongwan Rd, Chatuchak, Bangkok, 10900, Thailand. E-mail: jirasak.w@ku.th
bComputational Biomodelling Laboratory for Agricultural Science and Technology (CBLAST), Faculty of Science, Kasetsart University, 50 Ngamwongwan Rd, Chatuchak, Bangkok, 10900, Thailand
cDepartment of Applied Physics and Science Education, Technical University of Eindhoven, PO Box 513, 5600 MB, Eindhoven, The Netherlands. E-mail: b.bagheri@tue.nl
dInstitute for Complex Molecular Systems, PO Box 513, 5600 MB, Eindhoven, The Netherlands
eDepartment of Physics, New Jersey Institute of Technology, Newark, New Jersey 07102-1982, USA. E-mail: cld@njit.edu
fDepartment of Chemistry, Western University, 1151 Richmond Street, London, Ontario N6A 5B7, Canada. E-mail: mkarttu@uwo.ca
gDepartment of Physics and Astronomy, Western University, 1151 Richmond Street, London, Ontario N6A 3K7, Canada
First published on 13th September 2024
Abstract
The presence of oxygen molecules (O2) in biological membranes promotes lipid peroxidation of phospholipids with unsaturated acyl chains. On the other hand, cholesterol is considered to be an antioxidant molecule as it has a significant barrier effect on the permeation of O2 across membranes. However, a comprehensive explanation of how cholesterol affects the distribution and diffusion of O2 within lipid bilayers is yet to be established. In this study, we investigated the interaction of oxygen molecules with polyunsaturated lipid bilayers using molecular dynamics (MD) simulations. The degree of lipid unsaturation and the concentration of cholesterol were varied to study the permeation of O2. The free energy profile of O2 diffusing from the water phase to the lipid bilayer was calculated using biased umbrella MD simulations. The results show that O2 passively translocates into the membrane without changing the physical properties of the bilayer. Interestingly, in the unsaturated lipid bilayers the presence of cholesterol led to a significantly decreased permeation of O2 and an increase in the lipid chain order. Our results indicate that the hydroxyl groups of cholesterol strongly interact with the O2 molecules effectively inhibiting interactions between the oxygens and the double bonds in unsaturated lipid tails. In addition, a linear relationship between permeation and the ratio of membrane thickness and area per lipid was found. These insights can help our understanding of how the degree of unsaturation in a lipid tail and cholesterol affect lipid peroxidation at the molecular level.
1 Introduction
Biological membranes separate internal and external environments of cells and organelles regulating the uptake/excretion of nutrients/waste.1,2 They are made primarily of a lipid bilayer with proteins anchored on it. Polar lipid head groups in these bilayers are exposed to internal/external environments with their acyl tails forming a non-polar core in between these environments. This creates a barrier that impedes the flow of polar molecules but allows the permeation of small non-polar molecules that are critical for life.3Mechanisms by which molecules transport across cellular membranes can be classified into two main categories, active and passive.3 Active transport involves regulatory machinery which requires energy to transport target molecules in the opposite direction of their concentration gradient. Passive transport is an entropy-driven process of transporting molecules across cellular membranes. Cross-membrane transport of hydrophilic species is typically an activated process which requires assistance of specialized protein-based transporters or ion channels.4–6 Most small neutral molecules and drugs are transported across biological membranes passively.2,3,7,8 This includes oxygen (O2) that diffuses across cell membranes with a permeability coefficient of about 23 cm s−1. The passive diffusion of oxygen through the cell membrane is, however, strongly affected by lipid composition, which may help to rationalize the broad spectrum of oxygen levels observed across different cells/tissues.9 Here, we focus on providing insights into the atomic mechanisms accounting for oxygen permeation and the role played by cholesterol and unsaturated fatty acids in this process.
Cellular oxygenation is crucial for brain function,9 wound healing,10 anesthesia,11 adipose tissue dysfunction,12 reperfusion injury,13 and tumor radiation therapy.14 This process is so important that oxygen concentrations below normal levels have been related to pathologies such as cancer and heart diseases. In the newly emerging cold (room temperature) plasma therapy, a partially ionized gas composed of reactive oxygen and nitrogen species (RONS) is directly delivered to living tissues, and it is being explored for treatment of skin related disorders,15,16 cancer therapy,17–19 and wound healing.20,21 Among the RONS that cold plasma produces, is oxygen in its singlet delta state, O2(1Δg),22 which has been suggested to have a major role in cell apoptosis.23–25 Production of singlet delta oxygen (among other reactive oxygen species) is also the basis of photodynamic therapy in which a light source and a photosensitizer are used in combination with oxygen to kill malignant cells.26,27
Cellular membranes are composed of a diverse set of phospholipids. They are versatile molecules with different headgroups, charge, chain length, and saturation.1 Phosphatidylcholine (PC) is the main phospholipid in all mammalian cells (40–50%) and lipoprotein particles.28–30 The double bonds in the unsaturated acyl chains are prone to oxidative stress caused by reactive oxygen species.31–33 These reactions typically modify their chemical structure which consecutively disturbs the physiological properties of cellular membrane.34–36
In this work, we employ classical molecular dynamics (MD) simulations to study the mechanisms of permeability of O2 in six different phospholipid-based cell membrane models (details in Section 2). Although, singlet delta state of O2 is not described explicitly in our simulations, our study provides insights in the general mechanisms of its diffusion across cell membrane. We investigate how the O2 molecules interact with the double bonds of the lipid chains by exploring its location and distribution in the different lipid bilayers. As cholesterol has been suggested to protect lipid bilayers from oxidative stress,37,38 we investigate the effect(s) of cholesterol on the distribution and diffusional pathways of O2 in the lipid bilayers. In addition, biased umbrella sampling MD simulations were used to calculate the free energy profiles of O2 from the water phase to the lipid bilayers.
2 Methods
2.1 Unbiased MD simulations
To study the permeability of O2 in model cell membranes, we considered phospholipid bilayers at three different saturation levels, namely 1-palmitoyl-2-oleoyl-glycero-3-phosphocholine (POPC), 1-palmitoyl-2-linoleoyl-sn-glycero-3-phosphocholine (PLPC), and 1-palmitoyl-2-arachidonoyl-sn-glycero-3-phosphocholine (PAPC). The numbers of double bonds in POPC, PLPC, and PAPC lipids are 1, 2 and 4, respectively. In addition, binary mixtures of the above lipids and cholesterol (CHOL) at 50% CHOL concentration were studied to examine the effect(s) of cholesterol on the permeability of O2. The chemical structures of lipids and cholesterol are shown in Fig. 1 and the details with the numbers of molecules for each simulated system are listed in Table 1. All MD simulations were performed with the GROMACS software package version 5.1.2 (ref. 39) using the CHARMM36 all-atom force field.40 The TIP3P water model41,42 was used in all simulations.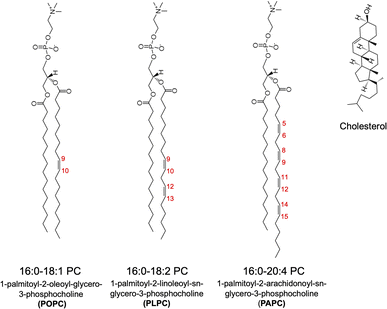 | ||
| Fig. 1 Chemical structures of the PC lipids (POPC, PLPC, and PAPC) and cholesterol. There are 1, 2 and 4 double bonds in the sn-2 chains of POPC, PLPC, and PAPC, respectively. | ||
| System | Lipid | Cholesterol | Water | O2 |
|---|---|---|---|---|
| POPC | 128 | 0 | 6400 | 16 |
| PLPC | 128 | 0 | 6400 | 16 |
| PAPC | 128 | 0 | 6400 | 16 |
| POPC:CHOL | 128 | 128 | 12![[thin space (1/6-em)]](https://www.rsc.org/images/entities/char_2009.gif) 800 800 |
16 |
| PLPC:CHOL | 128 | 128 | 12![[thin space (1/6-em)]](https://www.rsc.org/images/entities/char_2009.gif) 800 800 |
16 |
| PAPC:CHOL | 128 | 128 | 12![[thin space (1/6-em)]](https://www.rsc.org/images/entities/char_2009.gif) 800 800 |
16 |
First, solvated lipid bilayers were constructed using the CHARMM-GUI Membrane Builder.43 The pure bilayers had 128 phospholipid molecules and 6400 water molecules, and the cholesterol-containing ones had 128 lipids, 128 CHOL molecules and 12![[thin space (1/6-em)]](https://www.rsc.org/images/entities/char_2009.gif) 800 water molecules. For all the systems, an equilibration simulation was run for 100 ns to optimize the bilayer structure.
800 water molecules. For all the systems, an equilibration simulation was run for 100 ns to optimize the bilayer structure.
After construction of the bilayers, O2 molecules were randomly inserted into the equilibrated systems. Energy minimization using the steepest descents algorithm was performed, followed by MD simulations under a constant particle number, pressure, and temperature conditions (the NPT ensemble). The pressure was set to 1 bar with semi-isotropic pressure coupling, time constant of 5.0 ps and compressibility of 4.5 × 10⁻⁵ bar−1 by using the Parrinello–Rahman method.44 The temperature was set to 310 K with a time constant of 1.0 ps using Nosé–Hoover thermostat technique.45–47 Periodic boundary conditions were applied in all directions. A cutoff distance of 1.2 nm was used for the van der Waals and the real space part of the electrostatic interactions. The Particle-Mesh Ewald (PME) method48,49 was applied to calculate the long-range part of the electrostatic interactions. The Lennard-Jones forces were smoothly switched to zero between 1.0 and 1.2 nm. All bond lengths were constrained by the parallel linear constraint solver (P-LINCS) algorithm.50 The integration time step was set to 2 fs, and the simulations were run up to 1 μs. The Visual Molecular Dynamics (VMD) software51 was used for molecular visualizations.
2.2 Biased umbrella MD simulations
We computed the free energy profiles for O2 transport in all the six bilayers. The potential of mean force (PMF) for moving an O2 molecule from the water phase to the bilayer center was computed using the biased umbrella sampling MD simulations52 with the Weighted Histogram Analysis Method.53,54Initially, an O2 molecule was placed in the water phase at 3.4 nm away from the lipid bilayer center. During the umbrella sampling MD simulations, the distance between the center of mass of the O2 and the lipid bilayer was constrained in the z-direction (reaction coordinate) using a harmonic potential function with a force constant of 1000 kJ (mol nm2)−1. In the simulations, 35 windows with varying positions of O2 were performed to compute the PMF profile for each bilayer. The calculation was divided into 0.1 nm per window in the z-direction to pull O2 from the water phase (z = 3.4 nm) to the bilayer center (z = 0 nm). All simulations were performed in the NPT ensemble at a constant of temperature at 310 K and a constant of pressure at 1 bar. Each window was run for at least 100 ns, and the last 50 ns were used to compute the PMF profile. The statistical uncertainty of the PMF profile was estimated using bootstrap analysis.54
3 Results
The location and distribution of O2 in the different bilayers are considered to describe the potential of the O2 molecules to interact with the double bonds of the lipid chains. Under oxidative stress in the cell membrane, radiation, or photosensitized oxidation, an O2 molecules in its ground state gains energy and may jump to an excited singlet state (its lowest excited state).55 This may lead to lipid peroxidation in the cell membrane which has harmful effects on the biophysical properties and functions of the cell membrane. Previous studies37 have demonstrated that cholesterol help to protect lipid bilayers from oxidative attack by free radicals. Here, we examine the effect of cholesterol on the distribution and diffusional pathway of O2 in lipid bilayers. In addition, free energy calculations were performed using biased umbrella MD simulation techniques to determine the free energy of transfer of O2 from the water phase to the lipid bilayer. All the simulations showed that the O2 molecules passively translocate into the bilayers without causing pore formation or membrane rupture. Interestingly, the presence of cholesterol in the unsaturated lipid bilayers strongly decreases the permeability of O2.3.1 Location and distribution of O2 in the lipid bilayer
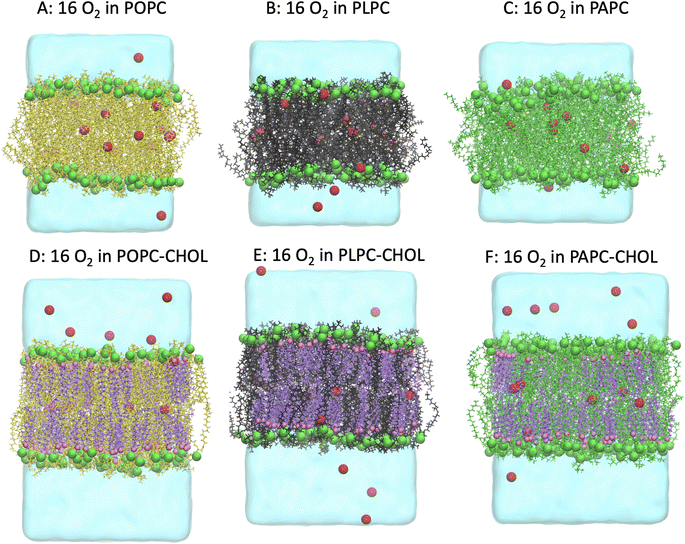
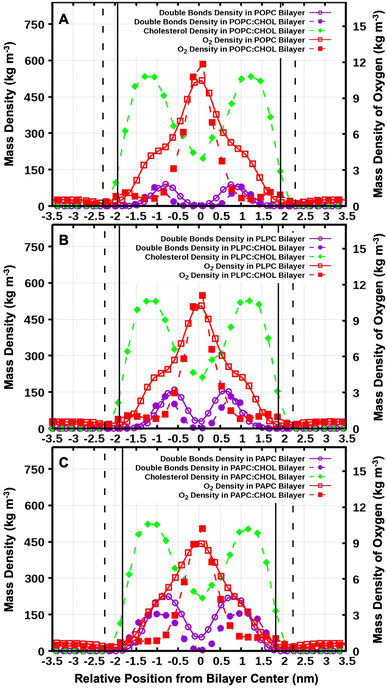
Fig. 2 shows snapshots of the systems after 1.0 μs. O2 is a small and non-polar molecule, and it is capable to passively and easily diffuse through the lipid bilayer. This is consistent with numerous previous experimental and computational studies.56–58 We calculated the mass density profiles of the O2 and cholesterol molecules, and all the carbon double bonds in the unsaturated lipid chains as a function of the distance from the bilayer center (the z-direction). The results are shown in Fig. 3. The average distance of the phosphorus atoms (of the lipid head groups) from the bilayer center was used as the operational definition for the lipid–water interface in order to determine the bilayer thickness. Bilayer thicknesses decreased as the number of double bonds in the lipid chain increased. This is due to the increase in fluidity and disorder in the presence of double bonds. The data is shown in Table 2.![[double bond, length as m-dash]](https://www.rsc.org/images/entities/char_e001.gif) C) and OH in cholesterol (OH-CHOL), and the lifetimes of O2 contacts with (C
C) and OH in cholesterol (OH-CHOL), and the lifetimes of O2 contacts with (C![[double bond, length as m-dash]](https://www.rsc.org/images/entities/char_e001.gif) C) (ps) were calculated using eqn (2)
C) (ps) were calculated using eqn (2)
| Systems | Thickness (nm) | Average area per lipid (nm2) | Average number of O2 in contact with C![[double bond, length as m-dash]](https://www.rsc.org/images/entities/char_e001.gif) C C |
Average number of O2 in contact with OH-CHOL | Lifetime of O2 in contact with C![[double bond, length as m-dash]](https://www.rsc.org/images/entities/char_e001.gif) C (ps) C (ps) |
|---|---|---|---|---|---|
| POPC | 3.89 ± 0.06 | 0.646 ± 0.014 | 1.87 ± 1.74 | — | 9.74 |
| POPC:CHOL | 4.59 ± 0.03 | 0.425 ± 0.004 | 0.60 ± 1.01 | 0.28 ± 0.64 | 7.85 |
| PLPC | 3.79 ± 0.06 | 0.663 ± 0.013 | 4.13 ± 2.65 | — | 7.97 |
| PLPC:CHOL | 4.49 ± 0.03 | 0.433 ± 0.004 | 1.90 ± 1.86 | 0.30 ± 0.65 | 7.92 |
| PAPC | 3.65 ± 0.06 | 0.711 ± 0.015 | 7.35 ± 3.56 | — | 7.03 |
| PAPC:CHOL | 4.49 ± 0.04 | 0.445 ± 0.005 | 3.31 ± 2.52 | 0.27 ± 0.63 | 6.99 |
Previous experimental and computational studies have reported that cholesterol increases the membrane thickness while reducing the area per lipid.59 Our results are well in agreement with those studies for all lipid bilayer types studied here, see Table 2. Although the number of double bonds in the PLPC lipid chain (2 double bonds) is less than in the PAPC chain (4 double bonds), we noted no significant differences in the bilayer thicknesses between these two lipid types at 50% of cholesterol (Table 2).
In addition, we calculated the time evolution of all O2 molecules moving in the system with respect to the distance from the bilayer center in the z-direction (see Fig. S1–S6†). The results demonstrate that the O2 molecules passively enter and exit the lipid bilayer, the most favourable location of O2 is being at the bilayer center as shown by the mass density in Fig. 3. In the presence of cholesterol, a small peak in density was observed at the position of the cholesterol hydrocarbon rings, and the density of O2 decreased in the hydrocarbon lipid tail region especially in the double bond region. This result suggests that cholesterol decrease the possibility of O2 to be in contact with the double-bond regions of lipids.
3.2 Number of contacts and contact lifetimes
We calculated the number of contacts between the O2 molecules and the carbon atoms in the double bonds of the lipids. A contact was defined to exist when the distance was ≤0.35 nm; overlap distance criterion was taken from a carbon–oxygen hydrogen bonding.60 Additionally, the average contact lifetime (τcontact) was calculated from the autocorrelation functions C(t) of the lifetime distribution (P(τ)) of all O2 and C![[double bond, length as m-dash]](https://www.rsc.org/images/entities/char_e001.gif) C contacts as
C contacts as
 | (1) |
 | (2) |
As the results in Table 2 show, the number of contacts increases as the number of double bonds increases. For all the lipid bilayer types, the presence of cholesterol resulted in a decrease in the number of contacts; the number of contacts was roughly halved with 50% cholesterol present.
Table 2 also shows that the lifetimes for the O2 molecules in contact with the double bonds is <10 ps for all bilayers. The lifetimes were calculated using eqn (2). These results indicate that the presence of cholesterol helps to protect the lipid bilayer and to decrease the possibility of lipid oxidation by reducing molecular contacts between the O2 molecules and the double-bond regions of lipids.
3.3 Permeability of O2 in the lipid bilayer
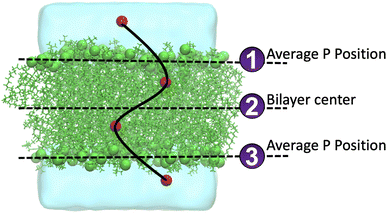
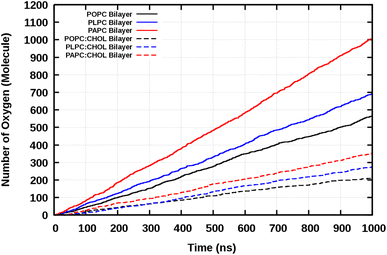
O2 is a small and relatively hydrophobic molecule, see Table 1 in Endeward et al.,61 and it can diffuse through the lipid bilayers. We calculated the frequency of O2 diffusion through a lipid bilayer. The path of oxygen translocation in a lipid bilayer was defined with three lines that represent the boundaries and the center of the lipid bilayer, see Fig. 4. For the upper and lower leaflets, the average positions of the phosphorous atoms are assigned to the first and the third line in Fig. 4, respectively. The center of a bilayer is shown by the second line. Translocation of O2 across these three lines was counted as a successful permeation event. The durations of successful permeation events was also recorded. We monitored the systems with 16 O2 molecules. The number of events of diffusion of O2 molecules across the lipid bilayers during 1 μs is shown in Fig. 5.The total number of O2 molecules permeations through the lipid bilayers per ns was determined by the slope of the total number of diffused O2 molecules through the lipid bilayers and are shown in Table 3.
| Systems | Total number of O2 passing the bilayer within 1 μs | The number of O2 permeations per ns (# per ns) | Average time for O2 passing through the lipid bilayer (ns) |
|---|---|---|---|
| POPC | 586 | 0.57 ± 0.17 | 12.70 ± 0.50 |
| POPC:CHOL | 217 | 0.21 ± 0.10 | 24.90 ± 1.52 |
| PLPC | 695 | 0.72 ± 0.19 | 9.54 ± 0.32 |
| PLPC:CHOL | 284 | 0.30 ± 0.10 | 19.27 ± 1.03 |
| PAPC | 1072 | 1.07 ± 0.11 | 6.73 ± 0.19 |
| PAPC:CHOL | 365 | 0.35 ± 0.12 | 16.29 ± 0.82 |
The results show that the more double bonds present in the lipid tails, the easier it is for the O2 molecules to permeate across the lipid bilayer. This was observed both in the absence and presence of CHOL, see Table 3.
The number of O2 permeation events through the bilayers is shown in Table 3. The results show that the presence of cholesterol significantly decreases the number of O2 permeation across the lipid bilayer. This is consistent with the decrease in the number of contacts between O2 and the double bond(s) due to the presence of cholesterol (Table 2).
We also calculated the average times that the O2 molecules reside inside the lipid bilayer, Table 3. The results show that an increase in the number of double bonds results in faster O2 passage through the lipid bilayer. Interestingly, the presence of cholesterol leads to roughly doubling the residence time in all systems. This increase in residence times caused by cholesterol, which traps oxygen in the middle of the lipid bilayer, prevents the O2 molecules from reaching the lipid double-bond region to exit the lipid bilayer, see Fig. 3. The reasons for this are elaborated in the next section where the free energy profiles are computed.
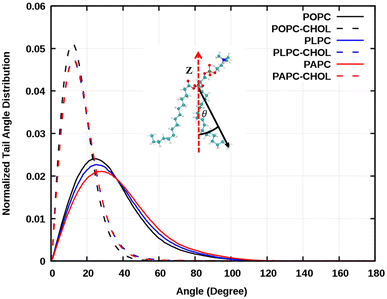
Interestingly, the concentration of about 50% is rather high, but there are tissues that have over 70% of cholesterol concentration. Of the lipids used in this study, POPC has the highest main phase transition temperature at around −2 °C (about 271 K). Mixtures of POPC and cholesterol have been studied quite extensively. For example, Dotson et al.62 performed MD simulations of POPC with different concentrations of cholesterol up to 100% cholesterol at 310 K (about 36.85 °C), the same temperature as in our simulations. They did not report any signs of a phase transition. Here, the systems were visualized, and we calculated the lipid tail's angle distributions as shown in Fig. 6. The emergence of an ordered phase was observed at 50% of cholesterol, this is also evident in the snapshots in Fig. 2. The effect of ordered phase on oxygen and water permeation to bilayer was studied by Ghysels et al.63 They showed that the bilayer with an ordered phase is less permeable for oxygen and water compared to the one in disordered phase. This implies that the presence of an order phase may play the role on O2 permeation.
3.4 Permeation scales with membrane thickness and area per lipid
The structure of a lipid membrane is strongly affected by the degree of unsaturation of its comprising lipids and the presence of cholesterol. In particular, these quantities affect the membrane thickness and the area per lipid (Table 2) that can be related to the distance travel by small molecules during a permeation event and the space available to them within the bilayer core, respectively. Accordingly, membranes with higher area per lipid can more easily accommodate molecules as they permeate the membrane. Conversely, the probability of a molecule to abort a permeation event increases with the membrane thickness. This suggests that the number of permeation events (PE) per unit of time, increases with the area per lipid and decrease with the membrane thickness: . The inset of Fig. 7 depicts this scaling separately for membranes without (black) and with (red) cholesterol.
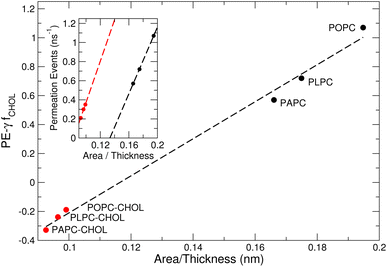 | ||
| Fig. 7 The number of permeation events (PE) scales with the area per lipid and membrane thickness. The fraction fCHOL of cholesterol molecules per lipids in the membrane is zero and one in simulations performed without (black) and with (red) cholesterol, respectively. The area per lipid and the membrane thickness of the six membranes studied here is given in Table 2. The number of permeation events per ns is given in Table 3. Best-fit lines to data points are shown using a dashed line. | ||
To account for a scaling law that unifies membranes with and without cholesterol, one has to recognize that cholesterol occupies some of the space that is otherwise available to accommodate O2 in a membrane with equal thickness/area per lipid but depleted of this sterol. Accordingly, a factor needs to be added to the proposed empirical scaling law to account for a reduction in permeation due to cholesterol:  . The constant γ enables superposition of best-fit-lines in the inset. For our two sets of membranes, γ is 0.53858.
The existence of a scaling law (Fig. 7) shows that despite the complex effects (e.g., Fig. 3 and 6) induced by unsaturated lipids and cholesterol on the membrane structure, the number of permeation events is dominated by the area per lipid and the membrane thickness.64
3.5 Free energy profiles
Fig. 8 shows the PMF profiles for O2 translocation into the bilayers. In all cases, the free energy barrier is at the lipid–water interface. After the maximum at the interfacial barrier, the free energy decreases toward the bilayer interior. The minimum value was found to be always at the bilayer center (at zero nm in Fig. 8). This represents the equilibrium position, or the most favorable location, of O2 within a lipid bilayer. This minimum position directly matches the mass density profiles of O2 measured from the unbiased MD simulations, Fig. 3, with the bilayer center having the highest density of O2.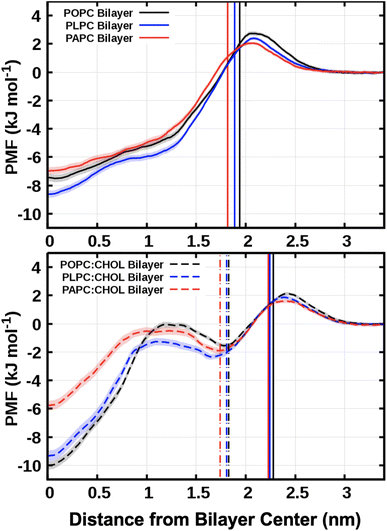 | ||
| Fig. 8 The free energy profiles for moving an O2 molecule from the water phase to the bilayer center. The vertical solid lines refer to the average positions of the phosphorus atoms in the systems with and without cholesterol. The vertical dot-dashed lines represent the hydroxyl groups of the cholesterols. The free energy was set to zero in the water phase (z = 3.4 nm). The bootstrap method54 was used to compute the error bars, shown as transparent shading. | ||
The values for the free energy of O2 translocation across the lipid bilayer are reported in Table 4. The minimum free energy at the bilayer center (Gcenter) was −7.50 ± 0.26, −8.61 ± 0.25, and −6.97 ± 0.26 kJ mol−1 for POPC, PLPC, and PAPC lipid bilayer, respectively. In the presence of cholesterol, a deeper Gcenter was observed both in the POPC:CHOL bilayer (Gcenter = −10.00 ± 0.30) and the PLPC:CHOL bilayer (Gcenter = −9.34 ± 0.38) which may be related to the decrease in density at the bilayer center (see Fig. S7†). Except for the PAPC:CHOL bilayer, Gcenter was found to be increased to −5.76 ± 0.32 kJ mol−1. The decrease of free energy at the bilayer is related to the decrease of density at the bilayer center. It is worth noting that the local minima in the free energy profiles, located at approximately 1.75 nm, align with the positions of the cholesterol hydroxyl groups. The presence of cholesterol within the bilayer creates a dual energy barrier that significantly retards the diffusion of oxygen molecules through the central region of the bilayers. Note that the thermal energy in our simulations is 2.58 kJ mol−1, and thus thermal fluctuations play a role in aiding O2 to overcome the energy barriers in Fig. 8.
| Systems | Free energy at bilayer center | Free energy barrier at lipid–water interface | Free energy at cholesterol | Total energy |
|---|---|---|---|---|
| POPC | −7.50 ± 0.26 | 2.74 ± 0.15 | — | 2.74 ± 0.15 |
| POPC:CHOL | −10.00 ± 0.30 | 2.13 ± 0.11 | 1.50 ± 0.20 | 3.63 ± 0.23 |
| PLPC | −8.61 ± 0.25 | 2.4 ± 0.12 | — | 2.4 ± 0.12 |
| PLPC:CHOL | −9.34 ± 0.38 | 1.87 ± 0.16 | 1.07 ± 0.31 | 2.94 ± 0.35 |
| PAPC | −6.97 ± 0.26 | 2.05 ± 0.11 | — | 2.05 ± 0.11 |
| PAPC:CHOL | −5.76 ± 0.32 | 1.59 ± 0.12 | 1.43 ± 0.32 | 3.02 ± 0.35 |
In a prior computational study, Dotson et al.62 studied mixtures of POPC and cholesterol (0–100% of cholesterol). Their free energy results for the case that can be compared, that is, POPC membrane with 50% of cholesterol are in excellent agreement. In another study, van der Paal et al.65 investigated systems with cholesterol and 1,2-dioleoyl-sn-glycero-3-phosphocholine (DOPC). Similarly to our findings, they found the appearance of new free energy barriers in the presence of cholesterol.
In another study, Zuniga-Hertz and Patel66 concluded that as the number of unsaturations in the lipids increases, there is an increasing number of free volume pockets in the system. Such pockets were proposed to be able to accommodate O2 molecules. The current results indicate that the center of the bilayer is able to accommodate O2 molecules as it is the location with the most favourable free energy. However, additional free energy minima (Fig. 8) within the bilayer may also play an important role in trapping O2 molecules. The latter are more pronounced in membranes made from PLPC and PAPC lipids and in the presence of cholesterol.
4 Conclusions
In this work, we investigated the permeation of O2 through the polyunsaturated lipid bilayers, with and without cholesterol, using molecular dynamics (MD) simulations. The results show that O2 passively diffuses from the aqueous phase through the bilayer. O2 tends to favor the central region of bilayer, in agreement with the calculated free energy transfer from the aqueous phase to the lipid bilayer. The presence of cholesterol in the unsaturated lipid bilayers notably reduces the permeation of O2 through the membrane. This effect is accompanied by an increase in bilayer thickness and the emergence of a local energy minimum at the location of cholesterol hydroxyl group. Our results suggest that the presence of cholesterol serves as a protective shield for lipid bilayers by reducing the frequency (number of contacts) and the duration (lifetime) of interactions between the O2 molecules and the double-bond regions of the lipids. This new insight supports the antioxidant function of cholesterol in cellular membranes.Although beyond the current study, we would like to point out that there the matter of permeation is even more complex and there are several factors that influence it, in particular the amount of cholesterol, the phase state of the membrane, and the area per lipid and thickness, both of which depend on the phase of the membrane.
Finally, we would also like to mention that no spontaneous flip-flops were observed in simulations. We have, however, studied flip-flops in oxidized PLPC systems in a prior study.38 Spontaneous flip-flops have been reported in ketosterone-containing systems,67 albeit in the absence of oxidized lipids. Molecular mechanisms of flip-flop have been discussed in detail, for example, by Gurtovenko and Vattulainen.68,69
Data availability
All data generated or analyzed during this study are included in this published article and ESI.†Author contributions
All authors conceived the work, wrote the manuscript and provided critical feedback on the interpretation of data, analysis and discussion. PB carried out the simulations and data analysis.Conflicts of interest
There are no conflicts to declare.Acknowledgements
This work was financially supported by the National Research Council of Thailand (NRCT) through the Research Grants for Talented Mid-Career Researchers with grant no. N41A640080, the National Science Research and Innovation fund (NSRF) via the Program Management Unit for Human Resources and Institutional Development, Research and Innovation [grant number B42G670041] and Kasetsart University Research and Development Institute (KURDI) through Fundamental Fund (grant number FF(KU)33.67. MJ thanks the Development and Promotion of Science and Technology Talent Project (DPST). BB thanks the strategic alliance between TU/e, Utrecht University, and University Medical Center Utrecht for financial support. MK thanks the Natural Sciences and Engineering Research Council of Canada (NSERC) and the Canada Research Chairs Program for financial support, and the Digital Research Alliance of Canada for computational resources. CD is supported by the National Institute of General Medical Health under grant no. 1R15GM148982-01.References
- G. Van Meer, D. R. Voelker and G. W. Feigenson, Nat. Rev. Molec. Cell. Biol., 2008, 9, 112–124 CrossRef CAS PubMed.
- W. K. Subczynski, J. Widomska and L. Mainali, Adv. Exp. Med. Biol., 2017, 977, 27–34 CrossRef CAS PubMed.
- W. Shinoda, Biochim. Biophys. Acta, 2016, 1858, 2254–2265 CrossRef CAS PubMed.
- D. W. Deamer and J. Bramhall, Chem. Phys. Lipids, 1986, 40, 167–188 CrossRef CAS PubMed.
- A. A. Gurtovenko and I. Vattulainen, Biophys. J., 2007, 92, 1878–1890 CrossRef CAS PubMed.
- J. Wong-ekkabut and M. Karttunen, J. Biol. Phys., 2016, 42, 133–146 CrossRef CAS PubMed.
- P. Nalakarn, P. Boonnoy, N. Nisoh, M. Karttunen and J. Wong-ekkabut, Sci. Rep., 2019, 9, 1037 CrossRef PubMed.
- N. Nisoh, V. Jarerattanachat, M. Karttunen and J. Wong-ekkabut, Biomolecules, 2022, 12, 639 CrossRef CAS PubMed.
- A. Carreau, B. E. Hafny-Rahbi, A. Matejuk, C. Grillon and C. Kieda, J. Cell. Mol. Med., 2011, 15, 1239–1253 CrossRef CAS PubMed.
- D. M. Castilla, Z.-J. Liu and O. C. Velazquez, Adv. Wound Care, 2012, 1, 225–230 CrossRef PubMed.
- J.-O. Dunn, M. Mythen and M. Grocott, BJA Educ., 2016, 16, 341–348 CrossRef.
- N. Netzer, H. Gatterer, M. Faulhaber, M. Burtscher, S. Pramsohler and D. Pesta, Biomolecules, 2015, 5, 1143–1150 CrossRef CAS PubMed.
- D. N. Granger and P. R. Kvietys, Redox Biol., 2015, 6, 524–551 CrossRef CAS PubMed.
- G. Multhoff, J. Radons and P. Vaupel, Cancers, 2014, 6, 813–828 CrossRef CAS PubMed.
- M. Wirtz, I. Stoffels, J. Dissemond, D. Schadendorf and A. Roesch, J. Eur. Acad. Dermatol. Venereol., 2018, 32, e37–e39 CrossRef CAS PubMed.
- J. Heinlin, G. Isbary, W. Stolz, F. Zeman, M. Landthaler, G. Morfill, T. Shimizu, J. Zimmermann and S. Karrer, J. Eur. Acad. Dermatol. Venereol., 2013, 27, 324–331 CrossRef CAS PubMed.
- E. A. Ratovitski, X. Cheng, D. Yan, J. H. Sherman, J. Canady, B. Trink and M. Keidar, Plasma Processes Polym., 2014, 11, 1128–1137 CrossRef CAS.
- R. Rutkowski, M. Schuster, J. Unger, C. Seebauer, H. Metelmann, T. v. Woedtke, K. Weltmann and G. Daeschlein, Clin. Plasma Med., 2017, 7, 52–57 CrossRef.
- H.-R. Metelmann, C. Seebauer, V. Miller, A. Fridman, G. Bauer, D. B. Graves, J.-M. Pouvesle, R. Rutkowski, M. Schuster and S. Bekeschus, et al., Clin. Plasma Med., 2018, 9, 6–13 CrossRef.
- C. Ulrich, F. Kluschke, A. Patzelt, S. Vandersee, V. Czaika, H. Richter, A. Bob, J. v. Hutten, C. Painsi and R. Hüge, et al., J. Wound Care, 2015, 24, 196–203 CrossRef CAS PubMed.
- S. Bekeschus, A. Schmidt, M. Napp, A. Kramer, W. Kerner, T. von Woedtke, K. Wende, S. Hasse and K. Masur, Exp. Dermatol., 2017, 26, 145–147 CrossRef CAS PubMed.
- J. S. Sousa, K. Niemi, L. Cox, Q. T. Algwari, T. Gans and D. O’connell, J. Appl. Phys., 2011, 109, 123302 CrossRef.
- M. Riethmüller, N. Burger and G. Bauer, Redox Biol., 2015, 6, 157–168 CrossRef PubMed.
- G. Bauer, D. Sersenová, D. B. Graves and Z. Machala, Sci. Rep., 2019, 9, 13931 CrossRef PubMed.
- Z. Nasri, S. Memari, S. Wenske, R. Clemen, U. Martens, M. Delcea, S. Bekeschus, K.-D. Weltmann, T. von Woedtke and K. Wende, Chem.–Eur. J., 2021, 27, 14702–14710 CrossRef CAS PubMed.
- B. Li, L. Lin, H. Lin and B. C. Wilson, J. Biophotonics, 2016, 9, 1314–1325 CrossRef CAS PubMed.
- P. Agostinis, K. Berg, K. A. Cengel, T. H. Foster, A. W. Girotti, S. O. Gollnick, S. M. Hahn, M. R. Hamblin, A. Juzeniene and D. Kessel, et al., Ca-Cancer J. Clin., 2011, 61, 250–281 CrossRef PubMed.
- G. O. Fruhwirth, A. Loidl and A. Hermetter, Biochim. Biophys. Acta, Mol. Basis Dis., 2007, 1772, 718–736 CrossRef CAS PubMed.
- A. Makky and M. Tanaka, J. Phys. Chem. B, 2015, 119, 5857–5863 CrossRef CAS PubMed.
- J. N. van der Veen, J. P. Kennelly, S. Wan, J. E. Vance, D. E. Vance and R. L. Jacobs, Biochim. Biophys. Acta, Biomembr., 2017, 1859, 1558–1572 CrossRef CAS PubMed.
- E. Frankel, Prog. Lipid Res., 1984, 23, 197–221 CrossRef CAS PubMed.
- M. H. Brodnitz, W. W. Nawar and I. S. Fagerson, Lipids, 1968, 3, 59–64 CrossRef CAS PubMed.
- M. H. Brodnitz, W. W. Nawar and I. S. Fagerson, Lipids, 1968, 3, 65–71 CrossRef CAS PubMed.
- P. Spiteller, W. Kern, J. Reiner and G. Spiteller, Biochim. Biophys. Acta, Mol. Cell Biol. Lipids, 2001, 1531, 188–208 CrossRef CAS PubMed.
- D. A. Pratt, J. H. Mills and N. A. Porter, J. Am. Chem. Soc., 2003, 125, 5801–5810 CrossRef CAS PubMed.
- P. Boonnoy, V. Jarerattanachat, M. Karttunen and J. Wong-Ekkabut, J. Phys. Chem. Lett., 2015, 6, 4884–4888 CrossRef CAS PubMed.
- T. Parasassi, A. M. Giusti, M. Raimondi, G. Ravagnan, O. Sapora and E. Gratton, Free Radical Biol. Med., 1995, 19, 511–516 CrossRef CAS PubMed.
- P. Boonnoy, V. Jarerattanachat, M. Karttunen and J. Wong-Ekkabut, Biophys. J., 2021, 120, 4525–4535 CrossRef CAS PubMed.
- M. J. Abraham, T. Murtola, R. Schulz, S. Páll, J. C. Smith, B. Hess and E. Lindahl, SoftwareX, 2015, 1, 19–25 CrossRef.
- S. Lee, A. Tran, M. Allsopp, J. B. Lim, J. Hénin and J. B. Klauda, J. Phys. Chem. B, 2014, 118, 547–556 CrossRef CAS PubMed.
- W. L. Jorgensen, J. Chandrasekhar, J. D. Madura, R. W. Impey and M. L. Klein, J. Chem. Phys., 1983, 79, 926–935 CrossRef CAS.
- A. D. J. MacKerell, D. Bashford, M. Bellott, R. L. J. Dunbrack, J. D. Evanseck, M. J. Field, S. Fischer, J. Gao, H. Guo, S. Ha, D. Joseph-McCarthy, L. Kuchnir, K. Kuczera, F. T. K. Lau, C. Mattos, S. Michnick, T. Ngo, D. T. Nguyen, B. Prodhom, W. E. Reiher, B. Roux, M. Schlenkrich, J. C. Smith, R. Stote, J. Straub, M. Watanabe, J. Wiórkiewicz-Kuczera, D. Yin and M. Karplus, J. Phys. Chem. B, 1998, 102, 3586–3616 CrossRef CAS PubMed.
- S. Jo, X. Cheng, J. Lee, S. Kim, S.-J. Park, D. S. Patel, A. H. Beaven, K. I. Lee, H. Rui, S. Park, H. S. Lee, B. Roux, A. D. MacKerell, J. B. Klauda, Y. Qi and W. Im, J. Comput. Chem., 2016, 38, 1114–1124 CrossRef PubMed.
- M. Parrinello and A. Rahman, J. Appl. Phys., 1981, 52, 7182–7190 CrossRef CAS.
- S. Nosé, J. Chem. Phys., 1984, 81, 511–519 CrossRef.
- S. Nosé, Mol. Phys., 1984, 52, 255–268 CrossRef.
- W. G. Hoover, Phys. Rev. A: At., Mol., Opt. Phys., 1985, 31, 1695–1697 CrossRef PubMed.
- T. Darden, D. York and L. Pedersen, J. Chem. Phys., 1993, 98, 10089–10092 CrossRef CAS.
- U. Essmann, L. Perera, M. L. Berkowitz, T. Darden, H. Lee and L. G. Pedersen, J. Chem. Phys., 1995, 103, 8577–8593 CrossRef CAS.
- B. Hess, J. Chem. Theory Comput., 2008, 4, 116–122 CrossRef CAS PubMed.
- W. Humphrey, A. Dalke and K. Schulten, J. Mol. Graphics, 1996, 14, 33–38 CrossRef CAS PubMed.
- G. M. Torrie and J. P. Valleau, J. Comput. Phys., 1977, 23, 187–199 CrossRef.
- S. Kumar, J. M. Rosenberg, D. Bouzida, R. H. Swendsen and P. A. Kollman, J. Comput. Chem., 1992, 13, 1011–1021 CrossRef CAS.
- J. S. Hub, B. L. de Groot and D. van der Spoel, J. Chem. Theory Comput., 2010, 6, 3713–3720 CrossRef CAS.
- P. S. Maharjan and H. K. Bhattarai, J. Oncol., 2022, 2022, 7211485 Search PubMed.
- W. K. Subczynski, J. S. Hyde and A. Kusumi, Proc. Natl. Acad. Sci. U.S.A., 1989, 86, 4474–4478 CrossRef CAS PubMed.
- S. Al-Samir, F. Itel, J. Hegermann, G. Gros, G. Tsiavaliaris and V. Endeward, Cell. Mol. Life Sci., 2021, 78, 7649–7662 CrossRef CAS PubMed.
- W. K. Subczynski, J. Widomska, M. Raguz and M. Pasenkiewicz-Gierula, Oxygen, 2022, 2, 295–316 CrossRef CAS PubMed.
- T. Róg, M. Pasenkiewicz-Gierula, I. Vattulainen and M. Karttunen, Biochim. Biophys. Acta, Biomembr., 2009, 1788, 97–121 CrossRef PubMed.
- S. Horowitz and R. C. Trievel, J. Biol. Chem., 2012, 287, 41576–41582 CrossRef CAS PubMed.
- V. Endeward, S. Al-Samir, F. Itel and G. Gros, Front. Physiol., 2014, 4, 382 Search PubMed.
- R. J. Dotson, C. R. Smith, K. Bueche, G. Angles and S. C. Pias, Biophys. J., 2017, 112, 2336–2347 CrossRef CAS PubMed.
- A. Ghysels, A. Krämer, R. M. Venable, W. E. Teague, E. Lyman, K. Gawrisch and R. W. Pastor, Nat. Commun., 2019, 10, 5616 CrossRef CAS PubMed.
- B. Andziak and R. Buffenstein, Aging Cell, 2006, 5, 525–532 CrossRef CAS PubMed.
- J. Van der Paal, C. Verheyen, E. C. Neyts and A. Bogaerts, Sci. Rep., 2017, 7, 39526 CrossRef CAS PubMed.
- J. P. Zuniga-Hertz and H. H. Patel, Front. Physiol., 2019, 10, 1340 CrossRef PubMed.
- T. Róg, L. M. Stimson, M. Pasenkiewicz-Gierula, I. Vattulainen and M. Karttunen, J. Phys. Chem. B, 2008, 112, 1946–1952 CrossRef PubMed.
- A. A. Gurtovenko and I. Vattulainen, J. Phys. Chem. B, 2007, 111, 13554–13559 CrossRef CAS PubMed.
- A. A. Gurtovenko and I. Vattulainen, Biomembrane Frontiers: Nanostructures, Models, and the Design of Life, Humana Press, Totowa, NJ, 2009, pp. 121–139 Search PubMed.
Footnotes |
| † Videos of POPC bilayers with O2 molecules both with and without cholesterol are available at DOI: https://doi.org/10.5281/zenodo.12570598. |
| ‡ Electronic supplementary information (ESI) available: The trajectories of 16 oxygen (O2) in lipid bilayers (Fig. S1–S6) and the density profiles of lipid and cholesterol in bilayers (Fig. S7) are provided. See DOI: https://doi.org/10.1039/d4ra04846f |
| This journal is © The Royal Society of Chemistry 2024 |

