DOI:
10.1039/D4RA04889J
(Paper)
RSC Adv., 2024,
14, 31332-31347
Enhanced adsorption of carbon sphere by doping with titania nanotubes for crystal violet removal: isotherm, kinetics, and thermodynamic studies†
Received
6th July 2024
, Accepted 16th September 2024
First published on 2nd October 2024
Abstract
In this study, the carbon sphere (Cs) has been prepared and modified by titania nanotubes (TNTs) to be utilized as an adsorbent toward crystal violet (CV) dye as a model for cationic dyes from aqueous solution. The prepared TNTs@Cs composites has been characterized by various techniques such as XRD, SEM, and TEM analysis. The adsorption analysis displayed that the adsorption capacity of CV dye onto the modified Cs with TNTs is 92.5 mg g−1, which is much higher than that achieved by pristine Cs (12.5 mg g−1). Various factors that influence the overall adsorption processes, such as pH, contact time, initial CV dye concentration, adsorbent weight, and temperature, were studied. The TNTs@Cs76.7 composite showed the highest removal percentage of 99.00% at optimum conditions. The adsorption isotherm analysis showed that the experimental data of adsorption CV dye fitted better with the Langmuir isotherm model with R2 of 0.999, and the estimated maximum adsorption capacity was 84.7 mg g−1. On the other hand, the adsorption kinetic study showed that the adsorption of CV follows the pseudo-second order kinetic model with an equilibrium adsorption capacity (qe) of 10.66, 18.622, 47.61, and 48.31 mg g−1 for Cs, TNTs@Cs93, TNTs@Cs86.8, and TNTs@Cs76.7 composites, respectively. The thermodynamic analysis showed negative free energy (ΔG) values, this indicates that the adsorption of CV is a spontaneous and feasible process. Furthermore, the ΔH and ΔS are positive values that indicate an endothermic adsorption process. Furthermore, the prepared TNTs@Cs76.7 composite displayed remarkable adsorption stability and the removal efficiency of CV remains at 96.3% after five cycles.
1. Introduction
A growing freshwater problem is being experienced globally as a result of the fast increase in the world's population, the effects of climate change, and industrial development on water quality.1 Considering this, various consumers and polluters of freshwater significantly contribute to freshwater depletion. The most significant sources of industrial pollutants come from a variety of industries, including the textile, cosmetic, leather, food, pharmaceutical, paint and varnish, and pulp and paper industries. Among them are the increasingly used dyes, such as methylene blue (MB), rhodamine B (RhB), methyl orange (MO), Congo red (CR), Disperse Violet 26, methyl red, and crystal violet (CV).2 It is estimated that, about 700![[thin space (1/6-em)]](https://www.rsc.org/images/entities/char_2009.gif) 000–1
000–1![[thin space (1/6-em)]](https://www.rsc.org/images/entities/char_2009.gif) 000
000![[thin space (1/6-em)]](https://www.rsc.org/images/entities/char_2009.gif) 000 dyes annually produced through a variety of industrial processes, including food processing, pharmaceutical, textile, paper, rubber, plastic, and cosmetics industries.3 From this it has been reported that every year between 40
000 dyes annually produced through a variety of industrial processes, including food processing, pharmaceutical, textile, paper, rubber, plastic, and cosmetics industries.3 From this it has been reported that every year between 40![[thin space (1/6-em)]](https://www.rsc.org/images/entities/char_2009.gif) 000 and 50
000 and 50![[thin space (1/6-em)]](https://www.rsc.org/images/entities/char_2009.gif) 000 tons of dyes are dumped into the water systems.4 These dyes harm the aquatic ecosystem by lowering the aesthetic value of water features and obstructing light penetration.5 Some dyes have toxic, mutagenic properties, and can even cause cancer when combined with their metabolites. These dyes also cause problems for human renal, liver, and nervous system dysfunction. They are difficult to decolorize due to their complicated structure.6,7 Thus, there is a great interest from the environmentalists and researchers to remove these harmful compounds from wastewater.2,8,9
000 tons of dyes are dumped into the water systems.4 These dyes harm the aquatic ecosystem by lowering the aesthetic value of water features and obstructing light penetration.5 Some dyes have toxic, mutagenic properties, and can even cause cancer when combined with their metabolites. These dyes also cause problems for human renal, liver, and nervous system dysfunction. They are difficult to decolorize due to their complicated structure.6,7 Thus, there is a great interest from the environmentalists and researchers to remove these harmful compounds from wastewater.2,8,9
CV is a member of the triphenylmethane group that is widely used in veterinary and animal medicine as a biological stain, to identify bloody fingerprints, and in various industrial textile processes.10 Furthermore, in certain concentrations, CV dye can result in several ailments and diseases, including cyanosis, cancer, mutagenesis, respiratory failure, eye irritation, elevated heart rate, and skin irritation. Since CV dye is stable and resistant to microbial degradation, it needs to be removed from wastewaters prior to their discharge in order to maintain environmental safety.11 Till now, there are various techniques such as disorientation, electrochemical, coagulation, ozonation, nano filtration, reverse osmosis, advance oxidation processes, photocatalytic degradation, and adsorption are used to eliminate such these pollutants from wastewater.8,9,12–15 Among all these techniques, the adsorption processes are most commonly where it is cost-effective, highly efficient, and economic feasibility.16,17 The main issue facing adsorption process is the adsorbent materials and their morphologies which plays a crucial role in overall adsorption performance.18,19 In the last decades, a lot of materials have been used as effective adsorbent materials toward the organic dyes such as carbons,16,20,21 metal oxides,22 bio-polymer-based composites.23 Because of their exceptional stability, distinctive structure, and abundance of raw material sources, carbon materials have found widespread application in a variety of industries.24 Among the many benefits of carbon spheres (Cs) in particular are its uniform shape, adjustable particle size distribution, and customized porosity. Consequently, research has been conducted on them for various applications such as adsorption,25 catalysis,26 energy conversion and storage,27 biomedical,28 and environmental.29
There are various methods for production of carbon spheres such as emulsion polymerization,30 hydrothermal carbonization (HTC),31 soft and hard templating,32 and self-assembly.33 A significant advance was made in 2011 by Liu et al.,34 who extended the Stober method to manufacture carbon spheres with adjustable particle sizes. This approach has gained a lot of interest due to its high yield, easy to follow operating procedures, and inexpensive and accessible precursor. Recently, Farbod, and Sharif,35 prepared Cs by hydrothermal method toward methylene blue (MB) dye, and Congo red (CR) dye adsorption. However, the adsorption of CV toward dyes is limited, thus its import needs to modify the Cs to be effective adsorbent. Due to their enormous surface area and distinctive tubular architectures, a cheap, readily accessible, non-toxic, and thermally stable substance, TiO2 nanotubes (TNTs) could be an excellent additive to improve the adsorptive property of Cs to remove organic contaminants from water streams.36 In this work, we prepared TNTs using a hydrothermal process at low calcination temperature, and then added to Cs framework in different portions, and the obtained TNTs@Cs composites were employed to remove CV dye from aqueous solution. The influence of different parameters such as solution pH, contact time, temperature, initial CV dye concentration and adsorbent dosage on adsorption efficiency were studied. The outcomes show that TNTs@Cs composites displayed outstanding reusability and adsorption performance. The synthesis and application of a novel adsorbent material for the removal of cationic contaminants from water are highlighted in this work. As a result, the material offers a wide range of possible applications in the future for wastewater purification.
2. Experimental
2.1. Materials
Titanium(IV) oxide (titanium dioxide (GPR)) (98%, ADWIC), sodium hydroxide (NaOH, 96%, ADWIC), hydrochloric acid (HCl, 33%, PIOCHEM), glucose (D (+) glucose monohydrate, 99.5%, Biotech), CTAB (cetyltrimethylammonium bromide, 100%, ALDRICH), crystal violet dye (Alpha Chemika). The used solutions were prepared by using distilled water (GFL, Germany).
2.2. Preparation of adsorbent materials
2.2.1. Preparation of carbon sphere. Exactly, 4.52 g of glucose and 0.018 g of CTAB were dissolved in 45 mL of distilled water. The solution reacted at 200 °C for 6 h, then the product was subjected to centrifugation (3500 rpm, 5 min). The obtained solid product was washed many times with distilled water, and finally dried at 100 °C for 12 h.37
2.2.2. Preparation of TNTs. Exactly 0.762 g of titanium dioxide (TiO2) was disperssed in 63 mL NaOH solution (10 M), then transferred in 100 mL Teflon – lined loaded in the stainless-steel autoclave and placed in a furnace at 130 °C for 24 h. After that, the product was separated by centrifuge (3500 rpm, 5 min) and washed many times with distilled water until the pH reached ≈8. Then, the product was treated with 500 mL of 0.1 M HCl overnight and washed again many times with distilled water until the pH reached ≈6.5, and finally dried overnight at 80 °C.38
2.2.3. Preparation of TNTs@Cs composites. A series of TNTs@Cs composites using different mass ratios of glucose was prepared. Typically, a certain amount of glucose and 0.018 g of CTAB were dissolved in 45 mL of distilled water (see Table 1) and kept under ultrasonication for 0.5 h. On the above solution, 0.343 g of TNTs was added and then mixture was kept at magnetic stirrer for 0.5 h, followed by ultrasonication for another 0.5 h. Then, the solution heated at 200 °C under hydrothermal conditions for 6 h to complete the reaction. The obtained product was separated by centrifuge (3500 rpm, 5 min), washed many times with distilled water until the pH reached ≈5.5 and dried at 100 °C for 12 h.
Table 1 The various amount of glucose in grams used for preparing TNTs@Cs composites
| Amount of glucose (g) |
Amount of CTAB (g) |
Volume of water (mL) |
Composite |
| 4.52 |
0.018 |
45 mL |
TNTs@Cs93 |
| 2.26 |
TNTs@Cs86.8 |
| 1.13 |
TNTs@Cs76.7 |
2.3. Batch adsorption studies
The removal of CV dye from an aqueous solution was investigated in a batch system. All the adsorption experiments were done in a 100 mL beaker with a magnetic stirrer at a constant speed of 200 rpm. The effect of different process parameters such as solution pH (2–7), time (5–90 min), initial dye concentration (10–100 mg L−1), adsorbent dosage (5–70 mg/25 mL), and temperature (20–50 °C) on CV dye removal was investigated. The remaining concentration of CV dye was measured by a UV-visible spectrophotometer at a wavelength of 580 nm. The percentage removal of CV dye and equilibrium adsorption amount of CV dye qe (mg g−1) were calculated by using the following equations. The percentage removal of CV dye was calculated by eqn (1).| |
 | (1) |
Adsorption amount of CV dye per gram of adsorbent (mg g−1) was determined by eqn (2).
| |
 | (2) |
where
C0 is the initial concentration of CV (mg L
−1),
Ce is the equilibrium concentration of CV dye (mg L
−1),
V is the volume of solution (L), and
W is the mass of the adsorbent (g).
3. Results and discussion
3.1. XRD results
The crystalline structure of the samples was determined by X-Ray Diffraction (XRD). As shown in Fig. 1a two broad peaks at ∼21° and ∼42.5° are detected for Cs, which corresponding to the (002) and (101) diffractions of graphitic carbon, respectively.39 The characteristic diffraction peaks of TNTs located at 25.281°, 37.801°, 48.050°, 53.891°, 55.062°, 62.690°, 68.762°, 70.311° and 75.032° corresponding to the diffraction patterns of (101), (004), (200), (105), (211), (204), (116), (220), and (215) anatase planes, respectively (JCPDS 21-1272). The characteristic diffraction peaks of TNTs@Cs93 composite are almost the same as TNTs peaks (Fig. 1b). It was noted that the characteristic reflections of TNTs became weaker and broader with decreasing amount of glucose precursor, illustrating the reduction of crystallinity degree and crystal size as shown in the case of TNTs@Cs86.8 and TNTs@Cs76.7 composites, especially at TNTs@Cs76.7 composite that shows a broad carbon peak at 16.6°. The crystallite size of the TNTs@Cs composites are determined by the Scherrer equation (eqn (3)).| |
 | (3) |
where, D is the crystallite size in nm, λ is the wavelength of the radiation (0.154056 nm), K is a constant equal to 0.9, β is the peak width at half-maximum intensity and θ is the peak position.
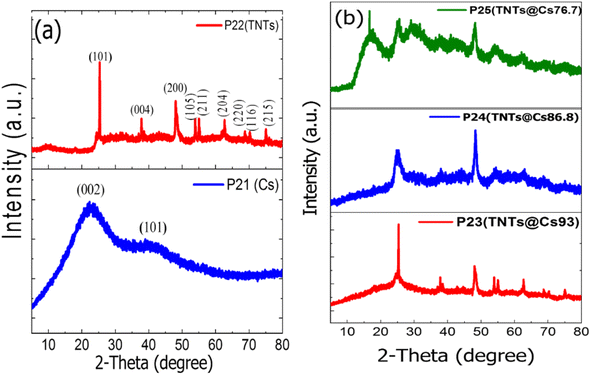 |
| | Fig. 1 XRD patterns of (a) Cs, and TNTs. (b) TNTs@Cs93, TNTs@Cs86.8 and TNTs@Cs76.7 composites. | |
Scherrer equation shows that crystallite size of TNTs@Cs76.7 composite is the smallest as shown in Table 2. This feature is also in agreement with the observations in the TEM images.
Table 2 Crystalline size of TNTs, and TNTs@Cs composite by Scherrer equation
| Adsorbent |
TNTs |
TNTs@Cs93 |
TNTs@Cs86.8 |
TNTs@Cs76.7 |
| Crystallites size (nm) |
32.5 |
32.5 |
9.5 |
7.6 |
3.2. BET analysis
The effects of pore size, pore volume, and specific surface area of TNTs@Cs76.7 composite is essential in the adsorption process. The adsorption isotherms profiles for the TNTs@Cs76.7 composite is a type IV isotherms, which are corresponding to mesoporous material as shown in Fig. 2. Table 3 shows the BET measurements of TNTs@Cs76.7 composite. The specific surface area (m2 g−1) and pore size distribution of the adsorbent were estimated by the Brunauer–Emmett–Teller (BET) equation in the partial pressure range from 0.05 to 0.30 and the Barrett–Joyner–Halenda (BJH) model from the desorption branch of the isotherms, respectively. The specific surface area of TNTs@Cs76.7 composite (≈79.042 m2 g−1). TNTs@Cs76.7 composite has a pore size of 3.966 nm and a pore volume of 0.082 cm3 g−1. The increased surface area of TNTs@Cs76.7 composite can improve the surface activity and surface reaction of composite material.40
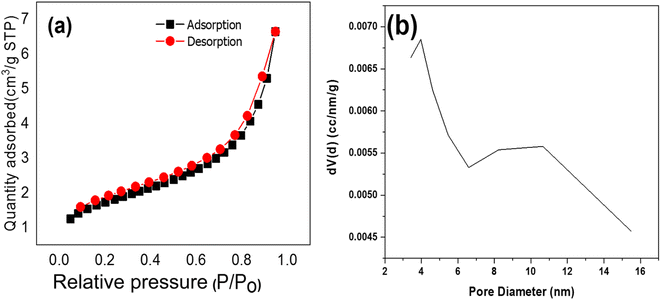 |
| | Fig. 2 (a) N2 adsorption–desorption isotherms, and (b) the pore size distribution of TNTs@Cs76.7 composite. | |
Table 3 The BET parameters of TNTs@Cs76.7 composite
| Material |
Surface area |
Pore volume (cm3 g−1) |
Pore size (nm) |
| TNTs@Cs76.7 |
79.042 |
0.082 |
3.966 |
3.3. SEM analysis
The scanning electron microscope (SEM) was employed to evaluate the surface morphology of TNTs@Cs76.7 composite as shown in Fig. 3 (a–c). The composite shows a clear predominate appearance of spherical carbon with the presence of some irregular and other sheet like vertically oriented parts. It could be seen that the average size of Cs is about 645 nm, as shown in Fig. 3d. The size of spheres in SEM analysis was higher than that of TEM analysis due to inconsistent calibration of magnification, secondary electron emission increase, and sample preparation.41
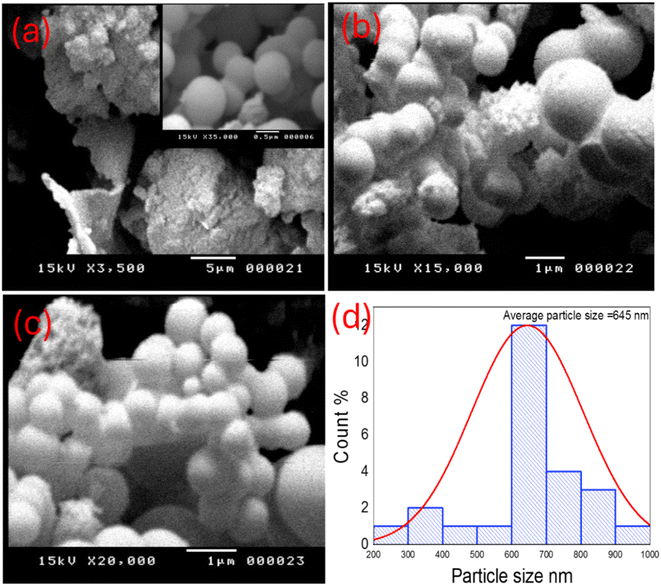 |
| | Fig. 3 (a–c) SEM images, and (d) histogram of particle size of TNTs@Cs76.7 composite. | |
3.4. TEM analysis
The morphology features and microstructure were further investigated by transmission electron microscopy (TEM). Fig. 4 depicts the TEM results of the TNTs@Cs76.7 composite. It was shown that the intercalation of tubular structures and spheres can be observed clearly. The average diameter of the sphere was about 6.3 nm (Fig. 4c). The TNTs with a uniform inner diameter of about 4.8 nm and an outer diameter of about 7.6 nm, where as the thickness of the tube wall was about 2.5 nm as observed in Fig. 4d. The length of the nanotubes ranges from about 120–200 nm and the average length is estimated to be 153.9 nm.
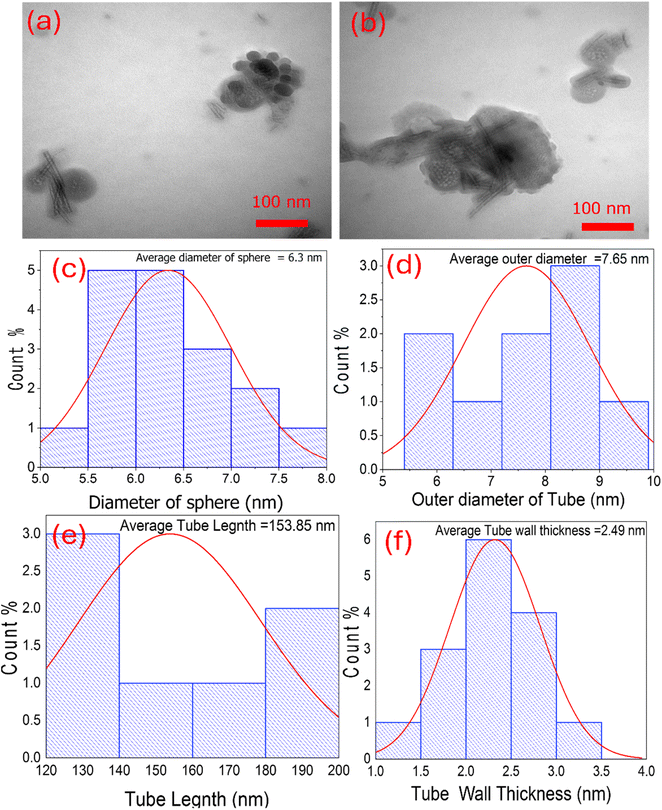 |
| | Fig. 4 (a and b) TEM images of TNTs@Cs76.7 composite. Histograms represent (c) the diameter of sphere, (d) the outer diameter of tube, (e) tube length, and (f) tube wall thickness of TNTs@Cs76.7 composite. | |
3.5. XPS analysis
To determine the chemical composition and valence states of all the elements on the surface, TNTs@Cs76.7 composite was investigated by X-ray photoelectron spectroscopy. All XPS profiles were deconvoluted into some sub-peaks and shown in Fig. 5.
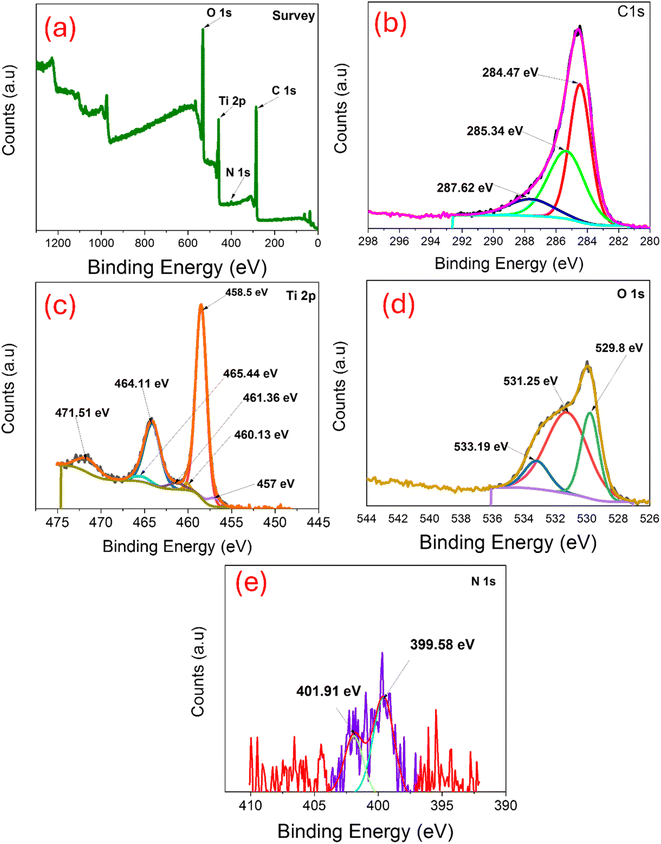 |
| | Fig. 5 XPS of TNTs@Cs76.7 composite: (a) survey, (b) C 1s, (c) Ti 2p, (d) O 1s, and (e) N 1s. | |
As represented in Fig. 5a, the full XPS survey spectrum of TNTs@Cs76.7 composed of C, O, Ti, and a small percentage of N. The binding energies for C 1s, O 1s, Ti 2p and N 1s were 285.81, 531.64, 459.23 and 400.9 eV respectively. Fig. 5b revealed the C 1s XPS curve fitted in three peaks at 284.47, 285.34, and 287.62 eV were attributed to C–C, (C–H/C–O), and (C–O–C/C–O) bonds, respectively.42 The electron binding energies correspond to the spin orbits of Ti 2p3/2 at 458.5 eV, and Ti 2p1/2 at 464.11 eV (Fig. 5c). These binding energy values are consistent with the Ti4+ chemical state, which can prove that the Ti element exists in the TiO2 lattice as well as in the Ti4+ chemical state. In O 1s XPS spectrum (Fig. 5d), three peaks at 529.8, 531. 25 and 533.19 eV were related to Ti–O–Ti, C![[double bond, length as m-dash]](https://www.rsc.org/images/entities/char_e001.gif) O, and C–O–C/C–OH bonds, respectively.43 In N 1s XPS spectrum (Fig. 5e), two peaks at 399.58, and 401.91 eV were related to benzenoidamine(–NH–) and graphitic N (N–C3), respectively.44
O, and C–O–C/C–OH bonds, respectively.43 In N 1s XPS spectrum (Fig. 5e), two peaks at 399.58, and 401.91 eV were related to benzenoidamine(–NH–) and graphitic N (N–C3), respectively.44
3.6. Zeta potential measurement
The point of zero charge (pHPZC) of TNTs@Cs76.7 composite before CV adsorption was measured by zeta potential test at room temperature to forecast the charge on the surface of the adsorbent.45 Fig. 6 showed the zeta potential of TNTs@Cs76.7 composite versus the pH of the solution.
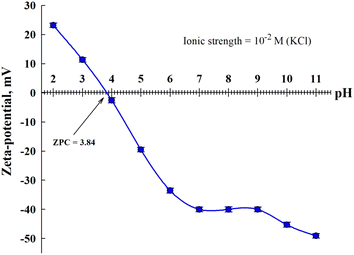 |
| | Fig. 6 Zeta potential TNTs@Cs76.7 composite before CV adsorption. | |
The PZC for TNTs@Cs76.7 composite is estimated to be 3.84. At pH values less than pHPZC the surface of the TNTs@Cs76.7 composite possess a positive charge, whereas, at higher pH value, the surface charge of TNTs@Cs76.7 composite was negative which cations may be adsorbed. Due to its cationic nature, the CV dye exhibits stronger electrostatic interactions with the negatively charged TNTs@Cs76.7 composite at a pH higher than 4.
3.7. Batch adsorption of CV dye
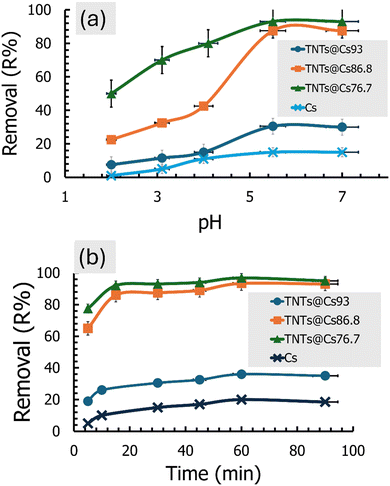
3.7.2. Effect of contact time. The effect of time interval on CV adsorption using Cs, TNTs@Cs93, TNTs@Cs86.8, and TNTs@Cs76.7 composites was investigated at 5, 15, 30, 45, 60, and 90 min (C0: 20 ppm; adsorbent dose: 0.01 g; pH: 5.5; temperature: 293 K; agitation speed: 200 rpm). The results in Fig. 7b revealed that CV adsorption at the initial period is very fast due to the many free active sites for TNTs@Cs86.8 and TNTs@Cs76.7 composites. Over time, the adsorption process slows down so that the adsorption percentage becomes parallel to the x-axis, which is considered almost constant at 15 min. Fig. 7b represents the removal efficiency of Cs, TNTs@Cs93, TNTs@Cs86.8 and TNTs@Cs76.7 composites at an optimized time. Maximum adsorption is obtained by Cs (20%), TNTs@Cs93 (36%), TNTs@Cs86.8 (93.4%) and TNTs@Cs76.7 (96.8%) at 60 min, which confirms that it is optimized contact time.
3.7.3. Effect of initial CV dye concentrations. The effect of dye concentration on CV adsorption using Cs, TNTs@Cs93, TNTs@Cs86.8 and TNTs@Cs76.7 composites was investigated at 10, 20, 40, 50, 70, and 100 mg L−1. The adsorbent process was performed at room temperature (298 K), and the pH of the CV solution was adjusted to 5.5. Then 0.01 g of adsorbent was added and the mixture was kept under a magnetic stirrer at 200 rpm for 1 h. As shown in Fig. 8a, the percentage removal of the CV was decreased exponentially with the increase in initial concentration. By increasing the initial concentration from 10 to 100 mg L−1, the percentage removal decreased from 38% to 4.8%, 60% to 7.8%, 96% to 25% and 97.5% to 33.25% for Cs, TNTs@Cs93, TNTs@Cs86.8 and TNTs@Cs76.7 composites, respectively. This may be due to lack of available active sites required for the high initial concentration of CV.
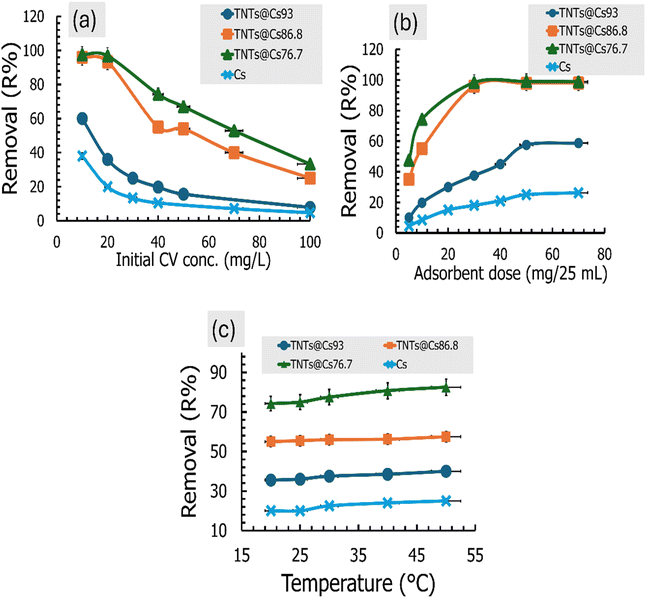 |
| | Fig. 8 (a) Effect of the initial dye concentration, (b) effect of the adsorbent dosage, and (c) effect of the temperature on the CV adsorption performance. | |
3.7.4. Effect of adsorbent dose. The effect of dosage on adsorption of CV was investigated by various weights (5, 10, 30, 50, and 70 mg) of Cs, TNTs@Cs93, TNTs@Cs86.8 and TNTs@Cs76.7 composites. The initial concentration of CV dye was fixed at 40 mg L−1, the pH was adjusted at 5.5, and the mixture was stirred with agitation speed of 200 rpm at room temperature for 1 h. Fig. 8b represents the removal efficiency of Cs, TNTs@Cs93, TNTs@Cs86.8 and TNTs@Cs76.7 composites at optimized adsorbent dosage. It was detected that with an increase in the adsorbent weight, removal of CV dye was enhanced at the initial stage as more active charge bearing sites were available for the adsorption. Hence, after the saturation point, no further increase in adsorption was recorded, although the quantity of adsorbent increases. At higher dosages, 50 and 70 mg/25 ml, the adsorption efficiency was almost the same. Maximum adsorption is obtained by Cs (26.25%), TNTs@Cs93 (58.75%), TNTs@Cs86.8 (98%) and TNTs@Cs76.7 (99%) at 70 mg, which confirms the best adsorbent dose for CV dye.
3.7.5. Effect of temperature. Temperature has a vital role in deciding the adsorption process whether it is either endothermic or exothermic in nature. Therefore, it is needed to find the optimum temperature to get the best adsorption efficiency. In the present study, the effect of temperature on the removal efficiency of CV dye was investigated at temperature range (20–50 °C). The obtained results are shown in Fig. 8c. It was observed that the percentage removal of CV was slightly increased with an increase in the temperature from 20 to 50 °C, indicating the process is endothermic in nature.
3.8. Adsorption kinetics
The kinetic behaviors of CV dye adsorption by Cs, TNTs@Cs93, TNTs@Cs86.8 and TNTs@Cs76.7 composites were investigated. Three well-known adsorption kinetic models in linear and non-linear forms were applied. We stated bellow the linear form of these models; the pseudo-first order (PFO) eqn (5),47 and pseudo second order (PSO) eqn (6).48| |
ln(qe − qt) = ln![[thin space (1/6-em)]](https://www.rsc.org/images/entities/char_2009.gif) qe − K1t qe − K1t
| (5) |
| |
 | (6) |
The rate-limiting step is difficult to determine by the PFO, and the PSO models. To solve this issue, an intraparticle diffusion (IPD) model has been used, the linear form are expressed by eqn (7).49
where
qe and
qt are the amounts of adsorbed dye in mg g
−1 at equilibrium and time
t, respectively.
k1 (min
−1),
k2 (mg g
−1 min
−1), and
kp (mg g
−1 min
−1) are the PFO, PSO, and IPD rate constants respectively.
C (mg g
−1) is the thickness of the porous medium.
The linear kinetic models for the adsorption experimental work of CV onto Cs, TNTs@Cs93, TNTs@Cs86.8 and TNTs@Cs76.7 composites are presented in Fig. 9, and their estimated kinetic parameters listed in Table 4. While the non-linear kinetic fitting models, and their related parameters are in ESI data file (Fig. S1 and Table S1).† It has been observed that the experimental work of adsorption CV is best fitted with linear models, which is typically obtained by the best correlation coefficient (R2) value. From the linear models, the experimental data of adsorption CV onto the Cs, TNTs@Cs93, TNTs@Cs86.8 and TNTs@Cs76.7 composites are best fitted with the PSO kinetic models, as indicated by higher R2 values. The qe values were estimated to be 10 and 18, 46.7, and 48.4 mg g−1 for the adsorption of CV dye by Cs, TNTs@Cs93, TNTs@Cs86.8 and TNTs@Cs76.7 composites, respectively. This indicates the adsorption of CV dye is a chemical adsorption process.50
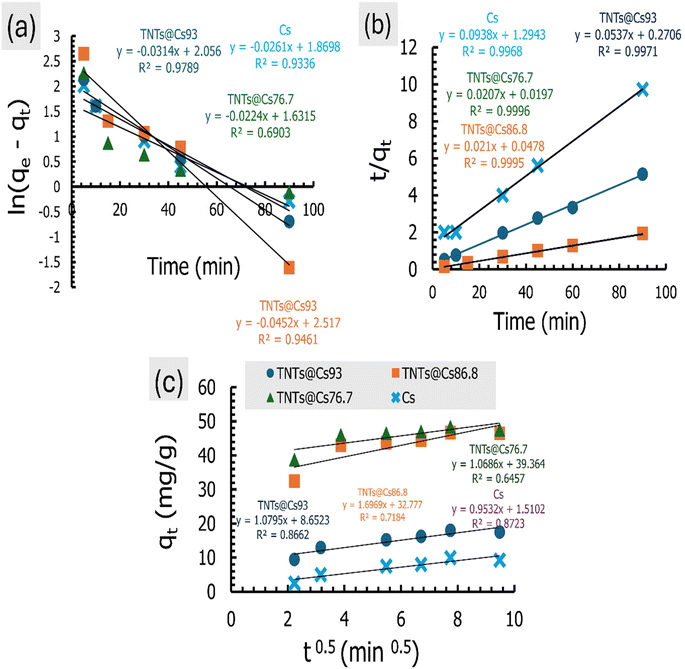 |
| | Fig. 9 The linear adsorption kinetics for the (a) PFO, (b) PSO, and (c) IPD models. | |
Table 4 The parameters of the linear kinetic models for the adsorption of CV removal
| Adsorbent |
qe,exp (mg g−1) |
Pseudo first order |
Pseudo second order |
Intraparticle diffusion |
| qe,cal (mg g−1) |
K1 (1/min) |
R2 |
qe,cal (mg g−1) |
k2 (mg g−1 min−1) |
R2 |
C (mg g−1) |
kp (mg g−1 min−1) |
R2 |
| Cs |
10 |
6.5 |
0.0261 |
0.934 |
10.66 |
0.0068 |
0.997 |
1.510 |
0.953 |
0.872 |
| TNTs@Cs93 |
18 |
7.8 |
0.0314 |
0.979 |
18.622 |
0.0106 |
0.997 |
8.652 |
1.080 |
0.866 |
| TNTs@Cs86.8 |
46.7 |
12.4 |
0.0452 |
0.946 |
47.61 |
0.0092 |
0.999 |
32.777 |
1.697 |
0.718 |
| TNTs@Cs76.7 |
48.4 |
5.1 |
0.0224 |
0.690 |
48.31 |
0.0217 |
0.999 |
39.364 |
1.069 |
0.646 |
The kinetic behaviour of CV dye was also investigated in relation to the IPD model, and the plotted data are showed in Fig. 9c, and its parameters are depicted in Table 4. This plot should be a straight line passing through the origin for adsorption systems where IPD is the governing mechanism. This indicates that the adsorption rate at any given time should be linearly proportionate to the square root of the time. As in Fig. 9c, the fact that the straight line does not pass through the origin suggests that there are other controls for adsorption rate besides the IPD process.51 A certain amount of boundary layer management is required for the adsorption process, and extragranular diffusion processes including liquid film diffusion and surface adsorption also have an impact on the adsorption rate.52
3.9. Adsorption isotherms
The adsorption isotherm is necessary for explaining adsorbent–adsorbate interactions to express the adsorption capacity.48 Here, the Langmuir, Freundlich, and Temkin isotherm models in both linear and non-linear forms were employed to investigate the adsorption of CV dye. The estimated linear isotherm curves are presented in Fig. 10, and their related parameters are in Table 5. The non-linear curves and estimated data are in the ESI data (Fig. S2 and Table S2).† It can be observed from Tables 5 and S2 (ESI data),† the adsorption isotherms of CV dye onto the Cs, TNTs@Cs93, TNTs@Cs86.8 and TNTs@Cs76.7 composites are fitted well with linear isotherm models as indicated by higher correlation coefficient (R2). Thus, in the next lines we will discuss only the data estimated from the linear adsorption isotherm modes.
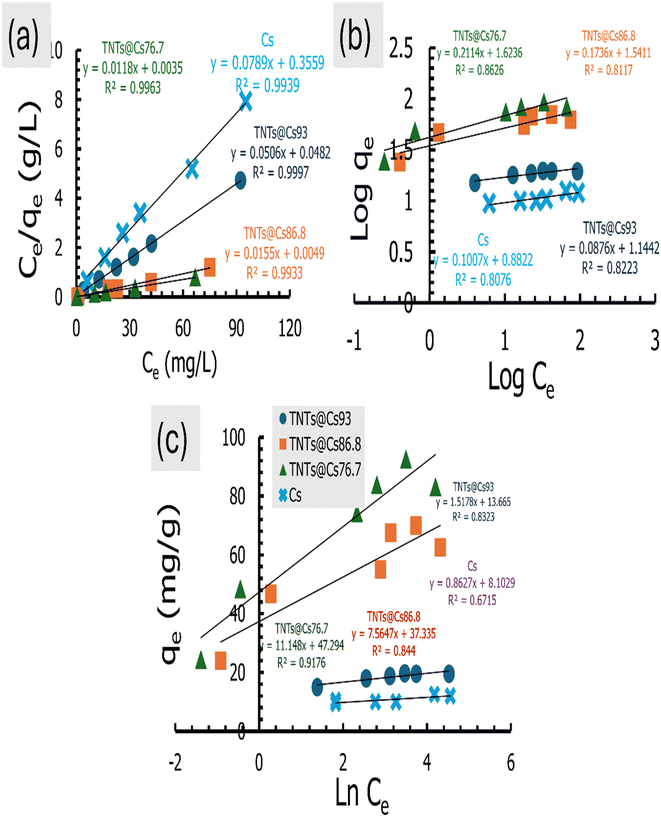 |
| | Fig. 10 (a) Langmuir, (b) Freundlich, and (c) Temkin isotherm for CV dye adsorption. | |
Table 5 The parameters estimated from the linear adsorption isotherm models for the adsorption of CV dye
| Adsorbent |
Freundlich model |
Langmuir model |
Temkin model |
| Kf (mg g−1) |
1/n |
R2 |
KL (L mg−1) |
qm (mg g−1) |
R2 |
RL |
bt |
At (L g−1) |
R2 |
| Cs |
7.625 |
0.1007 |
0.808 |
0.2217 |
12.6742 |
0.994 |
0.043 |
2823.7 |
11![[thin space (1/6-em)]](https://www.rsc.org/images/entities/char_2009.gif) 997.921 997.921 |
0.672 |
| TNTs@Cs93 |
13.938 |
0.0876 |
0.882 |
1.0498 |
19.7628 |
0.999 |
0.009 |
1604.9 |
8128.750 |
0.832 |
| TNTs@Cs86.8 |
34.76 |
0.1736 |
0.811 |
3.1633 |
64.5161 |
0.993 |
0.003 |
322.02 |
139.132 |
0.844 |
| TNTs@Cs76.7 |
42.035 |
0.2114 |
0.863 |
3.3714 |
84.7458 |
0.996 |
0.003 |
218.51 |
69.573 |
0.918 |
The Langmuir isotherm model is used for describing monolayer adsorption on adsorbent surfaces with a limited number of active sites.48,53 According to this model, all the sites on the adsorbent surface are energetically equal. Furthermore, this model presupposes that adsorbed molecules do not interact laterally. The linear form of Langmuir isotherm is expressed by eqn (8).54
| |
 | (8) |
where
Ce (mg L
−1) is the dye equilibrium concentration,
qe (mg g
−1) is the quantity of dye adsorbed at equilibrium,
qm (mg g
−1) is the maximum adsorbent capacity, and
KL (L mg
−1) is Langmuir constant, which is connected to the adsorption energy.
The linear Langmuir plots of the experimental data are presented in Fig. 10a, and the related parameters are in Table 5. As presented in Table 5, the Langmuir model afforded a relatively higher correlation coefficient (R2) among other investigated isotherm models for Cs, TNTs@Cs93, TNTs@Cs86.8 and TNTs@Cs76.7 composites with an estimated maximum adsorption capacity of 12.67, 19.76, 64.52, and 84.74 mg g−1, respectively.
The important factor of the Langmuir isotherm is the separation factor (RL), which is dimensionless quantity, and can be calculated by eqn (9).
| |
 | (9) |
The RL value indicates whether it is linear (RL = 1), irreversible (RL = 0), favorable (0< RL <1) or unfavorable (RL >1).
The estimated RL values are 0.043, 0.009, 0.003, and 0.003 for Cs, TNTs@Cs93, TNTs@Cs86.8 and TNTs@Cs76.7 composites, respectively. All in belowl, which depicts that the adsorption of CV dye on our materials are favorable.
From the above discussion, the Langmuir model is suitable for predicting the adsorbent–adsorbent interactions, as well as the adsorption capacities of the prepared materials for CV dye at relatively high.
The Freundlich adsorption isotherm is considered an empirical equation for a heterogeneous system in which multilayer adsorption may occur on the adsorbent surface.55 The Freundlich plots are shown in Fig. 10b, and the related parameters are in Table 5. The Freundlich isotherm is stated as in eqn (10).
| |
 | (10) |
where 1/
n, and
Kf are constants that are used to characterise the adsorption capacity and intensity, respectively. The value of
n, for favorable adsorption should be in between 0.1–1.
As presented in Table 5, the lower R2 value for the Freundlich model as compared to Langmuir isotherm indicates the absence of multilayer physisorption. Moreover, the value of 1/n below one and closer to 0 indicates a favorable and heterogeneous. This study shows that the Freundlich model is unsuitable for predicting the absorbent–adsorbent interactions and the relative adsorption capacities of the prepared materials for CV dye.
Temkin isotherm model is usually used to investigate the effects of adsorbate–adsorbate interactions on the adsorption process.56 Only an intermediate range of ion concentrations is covered by the Temkin isotherm.57 The equation for Temkin isotherm is expressed as eqn (11).
| |
qe = BT![[thin space (1/6-em)]](https://www.rsc.org/images/entities/char_2009.gif) ln(Ce) + BT ln(Ce) + BT![[thin space (1/6-em)]](https://www.rsc.org/images/entities/char_2009.gif) ln ln![[thin space (1/6-em)]](https://www.rsc.org/images/entities/char_2009.gif) AT AT
| (11) |
Where,
| |
 | (12) |
where
AT (L g
−1) is the equilibrium binding constant,
BT (J mol
−1) is constant related to heat of sorption associated with the parameter
bt as Temkin isotherm constant,
R is the universal constant of gases (8.314 J mol
−1 K), and
T is the absolute temperature (K).
The values of the constants are calculated from the slope and intercept of the plot in Fig. 10c, which is qe vs. ln![[thin space (1/6-em)]](https://www.rsc.org/images/entities/char_2009.gif) Ce. The values of both BT and AT are presented in Table 5. It has been reported that the typical adsorption energies, (BT
Ce. The values of both BT and AT are presented in Table 5. It has been reported that the typical adsorption energies, (BT![[thin space (1/6-em)]](https://www.rsc.org/images/entities/char_2009.gif) ln(AT)), for a chemisorption in the range of 8–16 kJ mol−1, and bt values are higher than 80 kJ mol−1.58 From the slopes, and intercepts in Fig. 10c, the estimated values of BT
ln(AT)), for a chemisorption in the range of 8–16 kJ mol−1, and bt values are higher than 80 kJ mol−1.58 From the slopes, and intercepts in Fig. 10c, the estimated values of BT![[thin space (1/6-em)]](https://www.rsc.org/images/entities/char_2009.gif) ln(AT) for Cs, TNTs@Cs93, TNTs@Cs86.8 and TNTs@Cs76.7 composites are 8.102, 13.665, 37.335, and 47.294 kJ mol−1, respectively. The corresponding bt values are 2.872, 1.632, 0.328, and 0.222 kJ mol−1, respectively. This results illustrate that the interactions between CV dye and the surfaces of Cs, TNTs@Cs93, TNTs@Cs86.8 and TNTs@Cs76.7 composites are weak, indicating that the adsorption processes are physical adsorption.59
ln(AT) for Cs, TNTs@Cs93, TNTs@Cs86.8 and TNTs@Cs76.7 composites are 8.102, 13.665, 37.335, and 47.294 kJ mol−1, respectively. The corresponding bt values are 2.872, 1.632, 0.328, and 0.222 kJ mol−1, respectively. This results illustrate that the interactions between CV dye and the surfaces of Cs, TNTs@Cs93, TNTs@Cs86.8 and TNTs@Cs76.7 composites are weak, indicating that the adsorption processes are physical adsorption.59
3.10. Thermodynamic investigation
The effect of temperature on the adsorptions of CV on Cs, TNTs@Cs93, TNTs@Cs86.8 and TNTs@Cs76.7 composites was examined, and the thermodynamics of this process was examined to understand the comprehension of the adsorption behaviors. The thermodynamic parameters, including the enthalpy (ΔH°), entropy (ΔS°) and Gibbs free energy (ΔG°) were evaluated (eqn (13)–(16)).| |
ΔG° = −RT![[thin space (1/6-em)]](https://www.rsc.org/images/entities/char_2009.gif) ln ln![[thin space (1/6-em)]](https://www.rsc.org/images/entities/char_2009.gif) K K
| (13) |
| |
 | (14) |
| |
 | (15) |
The ΔG°, ΔH°, and ΔS° (kJ mol−1) were calculated from the plot of ln![[thin space (1/6-em)]](https://www.rsc.org/images/entities/char_2009.gif) K vs. 1/T as shown in Fig. 11, and the thermodynamic parameters were monitored in Table 6. The positive value of ΔH° and ΔS° exhibited that the adsorption process of CV dye onto Cs, TNTs@Cs93, TNTs@Cs86.8, and TNTs@Cs76.7 composites were endothermic in nature.60 This means that the adsorption efficiency may be enhanced by increasing the solution's temperature. This also confirms that the adsorption is chemically processed. The negative values of ΔG° for (TNTs@Cs93, TNTs@Cs86.8, and TNTs@Cs76.7) adsorbents at all temperatures indicated that the process of adsorption in the present work is spontaneous and feasible, except the Cs adsorbent which ΔG° has positive value that indicated that the process of adsorption is not spontaneous.61
K vs. 1/T as shown in Fig. 11, and the thermodynamic parameters were monitored in Table 6. The positive value of ΔH° and ΔS° exhibited that the adsorption process of CV dye onto Cs, TNTs@Cs93, TNTs@Cs86.8, and TNTs@Cs76.7 composites were endothermic in nature.60 This means that the adsorption efficiency may be enhanced by increasing the solution's temperature. This also confirms that the adsorption is chemically processed. The negative values of ΔG° for (TNTs@Cs93, TNTs@Cs86.8, and TNTs@Cs76.7) adsorbents at all temperatures indicated that the process of adsorption in the present work is spontaneous and feasible, except the Cs adsorbent which ΔG° has positive value that indicated that the process of adsorption is not spontaneous.61
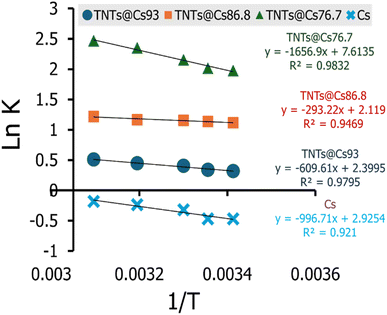 |
| | Fig. 11 The linear relation of van't Hoff equation at various temperature from 293 to 323 K for adsorption of CV. | |
Table 6 Thermodynamic parameters of CV dye
| Adsorbent |
T(K) |
ΔG° (kJ mol−1) |
ΔH° (kJ mol−1) |
ΔS° (kJ mol−1 K) |
| Cs |
298 |
0.476 |
3.801 |
0.011 |
| 303 |
0.421 |
| 313 |
0.309 |
| 323 |
0.198 |
| 393 |
−0.583 |
| TNTs@Cs93 |
298 |
−0.402 |
2.325 |
0.009 |
| 303 |
−0.448 |
| 313 |
−0.539 |
| 323 |
−0.631 |
| 393 |
−1.272 |
| TNTs@Cs86.8 |
298 |
−1.291 |
1.118 |
0.008 |
| 303 |
−1.330 |
| 313 |
−1.411 |
| 323 |
−1.492 |
| 393 |
−2.058 |
| TNTs@Cs76.7 |
298 |
−2.334 |
6.319 |
0.029 |
| 303 |
−2.479 |
| 313 |
−2.769 |
| 323 |
−3.059 |
| 393 |
−5.092 |
3.11. Reusability
To reduce the overall cost of the water treatment process and apply adsorbent on a large scale/industrial scale, a reusability test on the adsorbent materials must be carried out.16,62 Here the reusability of the TNT@Cs76.7 composite that displayed the best overall removal performance among our prepared adsorbents was investigated by monitoring their adsorption toward CV dye under ideal conditions for five cycles. First, the adsorption process of CV onto the TNT@Cs76.7 composite was performed by mixing 0.06 g TNT@Cs76.7 composite with 25 mL of CV dye with an initial concentration of 40 ppm, and stirred for 30 min at room temperature. For the regeneration, the CV adsorbed onto TNT@Cs76.7 composite was sonicated repeatably two times with 20 ml ethanol for 30 min, and then washing two times with distilled water, and finally subjected to drying in an oven to be used for the next cycle. After desorption, the regenerated TNT@Cs76.7 composite was reused for CV dye adsorption, and five cycles of regeneration and adsorption were carried out in succession. As shown in Fig. 12, the removal percentage of CV dye was observed at 97.75% in the first cycle, reaching 96.3%. This indicates that it can remove organic dyes over several cycles.
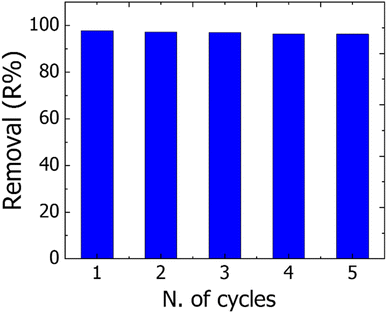 |
| | Fig. 12 Regeneration of the TNT@Cs76.7 composite up to five successive desorption–adsorption cycles. | |
3.12. Adsorption mechanism of CV dye by TNT@Cs76.7 composite
As discussed above, the mechanism of adsorption of CV dyes onto TNT@Cs76.7 composite can be described as follow. According to zeta potential, the pHZPC of TNT@Cs76.7 composite surfaces were performed at pH 3.84. Thus, at pH higher than pHPZC the surface of the TNTs@Cs76.7 composite possess a negative charge, and thus the cationic dye is absorbed on the adsorbent surface due to the electrostatic force between negative charge of adsorbent surface and positive charge of CV dye in basic conditions.63 H-bonding can occur between the H-donor (nitrogen in CV dye) and the H-acceptor groups (OH groups in the TNTs@Cs76.7 composite). Another factor that can affect the adsorption mechanism is the n–π interaction between the oxygen (electron-donating) on the TiO2 adsorbent surface and the π-system in the aromatic rings of the dye molecules (electron acceptor).64 In addition, π+–π interaction is another factor for CV adsorption on the TNTs@Cs76.7 composite. The CV as organocation has amine groups that can act as π electron acceptors and involve with the formation of π+–π interaction with the π electron-rich polyaromatic surface of Cs. Hence, the electron-rich Cs surface of the TNTs@Cs76.7 composite can bind with the protonated amino group of the CV dye forming π+–π electron donor–acceptor interactions. Thus, as described in Fig. 13, the adsorption mechanism of CV dye with TNTs@Cs76.7 composite has been controlled by electrostatic attraction, H-bonding, n–π electron donor–acceptor, and π+–π electron donor–acceptor interactions.
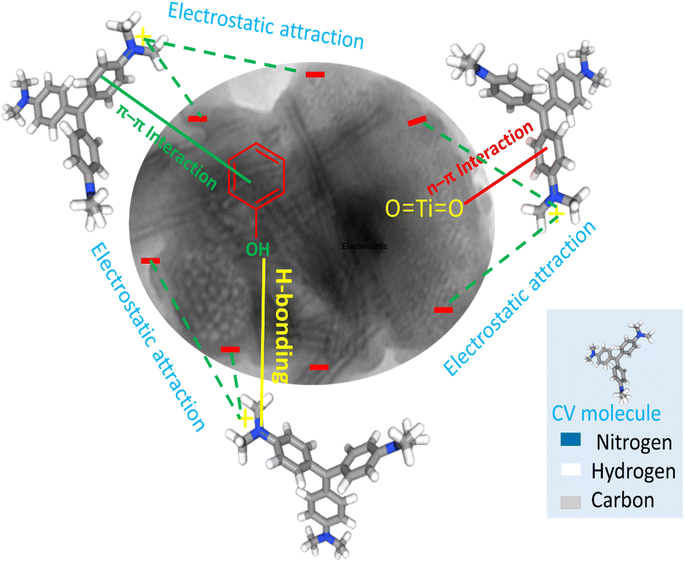 |
| | Fig. 13 Adsorption mechanism of CV dye by TNT@Cs76.7 composite. | |
3.13. Interference of co-existing dyes on the removal of CV dye
To evaluate the effect of co-existing dyes on the removal efficiency of TNT@Cs76.7 composite toward CV, we add 25 mL of CV and MB dye mixture in a 4![[thin space (1/6-em)]](https://www.rsc.org/images/entities/char_2009.gif) :
:![[thin space (1/6-em)]](https://www.rsc.org/images/entities/char_2009.gif) 1 (v/v) ratio to 0.01 g of TNT@Cs76.7 composite. The initial concentrations of CV and MB dyes are 20 ppm, and the TNT@Cs76.7 composite weight was fixed at 0.01 g. The adsorption was carried out under magnetic stirring at room temperature for 30 min. As presented in Fig. 14, by adding 25% of MB onto CV dye, the TNT@Cs76.7 composite displayed little decreasing in adsorption affinity toward CV.
1 (v/v) ratio to 0.01 g of TNT@Cs76.7 composite. The initial concentrations of CV and MB dyes are 20 ppm, and the TNT@Cs76.7 composite weight was fixed at 0.01 g. The adsorption was carried out under magnetic stirring at room temperature for 30 min. As presented in Fig. 14, by adding 25% of MB onto CV dye, the TNT@Cs76.7 composite displayed little decreasing in adsorption affinity toward CV.
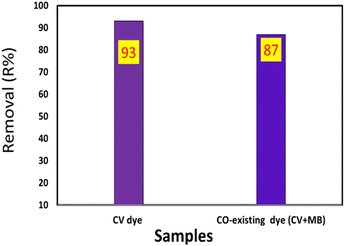 |
| | Fig. 14 Effect of co-existing MB dye with CV on the adsorption efficiency by TNT@Cs76.7 composite. | |
3.14. The practical applicability of the prepared adsorbent
To study the applicability of our prepared materials for removal of CV dye from the real water sample, we use TNT@Cs76.7 composite toward removal of CV dye solution prepared by Nile water as a real sample with a condition presented in Table 7. To compare the removal efficiency of TNT@Cs76.7 composite, we also prepare CV dye solution with distillated water under the same conditions. The adsorption experiment was performed by mixing 25 ml CV dye in a concentration of 20 ppm with 0.01 g of TNT@Cs76.7 composite and stirred for 30 min at room temperature. The removal percentage of CV from the real sample was found to be 91.7%, which is very close to that prepared for wastewater as shown in Fig. 15.
Table 7 The analysis of utilized Nile River water sample
| Element |
Concentration |
Element |
Concentration |
| TSD (ppm) |
170 |
Chlorides (ppm) |
20 |
| Turbidity (NTU) |
4 |
Calcium hardness (ppm) |
66 |
| Total alkalinity (ppm) |
160 |
Magnesium hardness (ppm) |
44 |
| Total hardness (ppm) |
110 |
Ammonia (ppm) |
0.1 |
| Iron (ppm) |
0.1 |
| Manganese (ppm) |
0.05 |
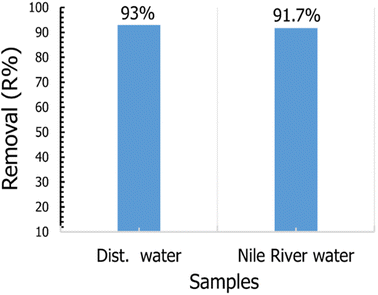 |
| | Fig. 15 Effect of TNT@Cs76.7 composite toward CV prepared by dist. Water, and Nile River water samples. | |
3.15. Comparison of adsorbent with other reported adsorbents
According to the literature, several carbon sphere-based materials have been utilized for the removal of CV dye from aqueous solutions. The competitiveness of our absorbent was examined against the other reported adsorbents, as illustrated in Table 8. Our adsorbents showed competitive adsorption ability and affinity towards CV dye concerning the other adsorbents. Hence, TNT@Cs76.7 composite is highly recommended as efficient adsorbents for cationic dyes.
Table 8 Comparison of removal of dyes by our adsorbents and similar reported adsorbents
| Adsorbent |
Dye |
Conditions |
qmax (mg g−1) |
Ref. |
| Hollow carbon spheres/graphene hybrid aerogels |
MO |
— |
344.1 |
65 |
| Rhodamine B (RhB) |
441.5 |
| Activated carbon spheres from discarded maize cobs |
Rose bengal dye (RB) |
pH = 3, time = 60 min |
303.6 |
66 |
| Carbon spheres |
MB |
— |
15.4 |
67 |
| Hierarchically porous graphitic carbon spheres |
MB |
— |
182.8 |
| Modified carbon spheres |
Paraquat (PQ) |
pH = 6, time = 180 min |
134.63 |
24 |
| Chrysoidine G (CG) |
pH = 7, time = 600 min |
299.44 |
| Malachite green (MG) |
pH = 6, time = 720 min |
326.93 |
| Chemically activated carbon spheres |
MB |
pH = 7, time = 180 min |
602.4 |
68 |
| TNTs@Cs76.7 |
CV |
pH 5.5; 60 min |
84.7 |
Our work |
4. Conclusion
In this study, an efficient adsorbent TNTs@Cs composites were prepared from glucose and Titania for remediation wastewater from organic hazardous materials such as CV dye. TNTs@Cs composites was characterized using, XRD, SEM, TEM, XPS and N2 adsorption desorption isotherm analysis. TEM analysis showed that TNTs@Cs composites consist of spheres and tubular structures. Results revealed that adsorption of CV dye onto TNTs@Cs composites strongly controlled by pH, contact time, dye concentration, adsorbent weight and temperature. The quantity of dye uptake (mg g−1) was found to rise with increase in dye concentration but reduced with rise in adsorbent dose. The pH 5.5 was found to be the optimum pH for dye removal. The results obtained under the optimum conditions showed that, TNTs@Cs76.7 composite has considerable removal percentage of 99.00%. The adsorption equilibrium behavior of CV was best fitted with Langmuir isotherm model with maximum adsorption capacities of 84.7 mg g−1. The adsorption of CV follows the pseudo-second order kinetic model. In addition, thermodynamic study exhibited the adsorption of CV dye onto TNTs@Cs76.7 composite was spontaneous and endothermic in nature. Also, TNTs@Cs76.7 composite displayed high stable adsorption performance with a removal percentage of 96.3% after five cycles.
Data availability
All data have been included in the main manuscript, and in the ESI data file.†
Author contributions
Ahmed M. E. Mohamed: experimental work, and writing – original draft. Abdelaal S. A. Ahmed design the methodology, supervision the adsorption process, editing, and full revision the manuscript, Ahmed Kotb, material suggestion, and supervision of the synthesis materials. Moustafa M. S. Sanad performing the physical characterizations in his working institute. Mohamed Abdel-Hakim is the leader supervision of the study.
Conflicts of interest
The authors declare that they have no known competing financial interests or personal relationships that could have appeared to influence the work reported in this paper.
References
- L. Yang, L. Bao, Y. Zhong, C. Hao, J. Chen, J. Wu and X. Wang, J. Cleaner Prod., 2024, 434, 139831 CrossRef CAS.
- S. Dutta, B. Gupta, S. K. Srivastava and A. K. Gupta, Adv. Mater., 2021, 2, 4497–4531 RSC.
- C. J. Ogugbue and T. Sawidis, Biotechnol. Res. Int., 2011, 2011, 967925 Search PubMed.
- S. Gul, H. Gul, M. Gul, R. Khattak, G. Rukh, M. S. Khan and H. A. Aouissi, Water, 2022, 14, 2987 CrossRef CAS.
- P. Dutta, M. R. Rabbi, M. Abu Sufian and S. Mahjebin, Eng. Appl. Sci. Lett., 2022, 5, 1 Search PubMed.
- T. Angelika, M. Kamila and P. Andrzej, Sci. Total Environ., 2020, 717, 137222 CrossRef PubMed.
- H.-Y. Sun, Y.-J. Gao, J.-L. Li, Y.-M. Zou, M.-L. Feng and X.-Y. Huang, ChemistrySelect, 2022, 7, e202203826 CrossRef CAS.
- D. Tolan, A. El-Sawaf, A. S. A. Ahmed, A. Nassar, N. M. Mohamed, I. G. Alhindawy, E. A. Elshehy and V. Utgikar, Mater. Chem. Phys., 2024, 322, 129570 CrossRef CAS.
- L. Li, Y. Zhong, Y. Hu, J. Bai, F. Qiao, A. S. A. Ahmed, G. Ali, X. Zhao and Y. Xie, CrystEngComm, 2023, 25, 4355–4363 RSC.
- P. L. Homagai, R. Poudel, S. Poudel and A. Bhattarai, Heliyon, 2022, 8, e09261 CrossRef CAS PubMed.
- S. Sultana, K. Islam, M. A. Hasan, H. J. Khan, M. A. R. Khan, A. Deb, M. Al Raihan and M. W. Rahman, Environ. Nanotechnol. Monit. Manag., 2022, 17, 100651 CAS.
- K. D. Kaoutar, T. Maris, B. Buscotin Horax and A. Abdellah, Sep. Purif. Technol., 2019, 210, 764–774 CrossRef.
- A. S. A. Ahmed, M. M. S. Sanad, A. Kotb, A. N. R. M. Negm and M. H. Abdallah, Adv. Mater., 2023, 4, 2981–2990 RSC.
- H. Fan, J. Gu, H. Meng, A. Knebel and J. Caro, Angew. Chem., Int. Ed., 2018, 57, 4083–4087 CrossRef CAS PubMed.
- A. Yanyan, Z. Huaili, Y. Zhishuang, S. Yongjun, W. Yili, Z. Chun and D. Wei, J. Hazard. Mater., 2020, 381, 120971 CrossRef PubMed.
- N. S. M. Sayed, A. S. A. Ahmed, M. H. Abdallah and G. A. Gouda, Sci. Rep., 2024, 14, 5384 CrossRef CAS PubMed.
- Y. Chu, S. Zhu, F. Wang, W. Lei, M. Xia and C. Liao, J. Chem. Eng. Data, 2019, 64, 3535–3546 CrossRef CAS.
- B. Thomas, E. P. Shilpa and L. K. Alexander, Emerg. Mater., 2021, 4, 1479–1487 CrossRef CAS.
- Y. Chu, M. A. Khan, M. Xia, W. Lei, F. Wang and S. Zhu, J. Chem. Eng. Data, 2019, 64, 5900–5909 CrossRef CAS.
- K. B. Tan, M. Vakili, B. A. Horri, P. E. Poh, A. Z. Abdullah and B. Salamatinia, Sep. Purif. Technol., 2015, 150, 229–242 CrossRef CAS.
- Z. Li, L. Sellaoui, D. Franco, M. S. Netto, J. Georgin, G. L. Dotto, A. Bajahzar, H. Belmabrouk, A. Bonilla-Petriciolet and Q. Li, Chem. Eng. J., 2020, 389, 124467 CrossRef CAS.
- Y.-Y. Li, Y.-L. Wu, N. Chen, Y.-L. Ma, W.-X. Ji and Y.-G. Sun, Chin. J. Anal. Chem., 2023, 51, 100278 Search PubMed.
- R. S. Dassanayake, S. Acharya and N. Abidi, Molecules, 2021, 26(15), 4697 CrossRef CAS PubMed.
- H. Li, Q. Miao, Y. Chen, M. Yin, H. Qi, M. Yang, Q. Deng and S. Wang, Microporous Mesoporous Mater., 2020, 297, 110040 CrossRef CAS.
- J. Choma, W. Fahrenholz, D. Jamioła, J. Ludwinowicz and M. Jaroniec, Microporous Mesoporous Mater., 2014, 185, 197–203 CrossRef CAS.
- T. Yang, J. Liu, R. Zhou, Z. Chen, H. Xu, S. Z. Qiao and M. J. Monteiro, J. Mater. Chem. A, 2014, 2, 18139–18146 RSC.
- F. Pei, T. An, J. Zang, X. Zhao, X. Fang, M. Zheng, Q. Dong and N. Zheng, Adv. Energy Mater., 2016, 6, 1502539 CrossRef.
- A. Pramanik, A. Vangara, B. P. Viraka Nellore, S. S. Sinha, S. R. Chavva, S. Jones and P. C. Ray, ACS Appl. Mater. Interfaces, 2016, 8, 15076–15085 CrossRef CAS PubMed.
- W. Zhang, S. Zhu, R. Luque, S. Han, L. Hu and G. Xu, Chem. Soc. Rev., 2016, 45, 715–752 RSC.
- J. Hou, T. Cao, F. Idrees and C. Cao, Nanoscale, 2016, 8, 451–457 RSC.
- X. Sun and Y. Li, Angew Chem. Int. Ed. Engl., 2004, 43, 597–601 CrossRef PubMed.
- Q. Kong, L. Zhang, M. Wang, M. Li, H. Yao and J. Shi, Sci. Bull., 2016, 61, 1195–1201 CrossRef CAS.
- H. Tian, Z. Lin, F. Xu, J. Zheng, X. Zhuang, Y. Mai and X. Feng, Small, 2016, 12, 3155–3163 CrossRef CAS PubMed.
- J. Liu, S. Z. Qiao, H. Liu, J. Chen, A. Orpe, D. Zhao and G. Q. Lu, Angew Chem. Int. Ed. Engl., 2011, 50, 5947–5951 CrossRef CAS PubMed.
- M. Farbod and L. Sharif, Eur. Phys. J. Plus, 2022, 137, 676 CrossRef CAS.
- S. Ali, H. Granbohm, J. Lahtinen and S. P. Hannula, Nanoscale Res. Lett., 2018, 13, 179 CrossRef PubMed.
- J. Shi, H. Cui, J. Xu and N. Yan, Sep. Purif. Technol., 2022, 294, 121193 CrossRef CAS.
- Y. Li, Y. Hou, Y. Zhang, Y. Yang and Z. Huang, J. Colloid Interface Sci., 2022, 608, 2224–2234 CrossRef CAS PubMed.
- X. Wang, W. Hui, A. Hu, X. Li, Y. Li and H. Wang, Mater. Today Chem., 2021, 20, 100468 CrossRef CAS.
- M. Hussain, R. Ceccarelli, D. L. Marchisio, D. Fino, N. Russo and F. Geobaldo, Chem. Eng. J., 2010, 157, 45–51 CrossRef CAS.
- J. Tuoriniemi, A. J. Johnsson, J. P. Holmberg, S. Gustafsson, J. A. Gallego-Urrea, E. Olsson, J. B. Pettersson and M. Hassellöv, Sci. Technol. Adv. Mater., 2014, 15, 035009 CrossRef PubMed.
- A. Sarkar, C. V. Manohar and S. Mitra, Nano Energy, 2020, 70, 104520 CrossRef CAS.
- C. Lim, H.-R. An, H. Lee, R. Lee, Y. Choi, J.-I. Park, J. Yoon, H. U. Lee and Y.-S. Lee, Composites, Part B, 2022, 241, 109997 CrossRef CAS.
- Z. Nazarlou, S. F. Hosseini, M. S. Seyed Dorraji, M. H. Rasoulifard and U. Aydemir, ACS Appl. Nano Mater., 2023, 6, 8804–8818 CrossRef CAS.
- F. Azeez, E. Al-Hetlani, M. Arafa, Y. Abdelmonem, A. A. Nazeer, M. O. Amin and M. Madkour, Sci. Rep., 2018, 8, 7104 CrossRef PubMed.
- S. Mani and R. N. Bharagava, in Reviews of Environmental Contamination and Toxicology Volume 237, ed. W. P. de Voogt, Springer International Publishing, Cham, 2016, pp. 71–104, DOI:10.1007/978-3-319-23573-8_4.
- H. Y. Zhu, R. Jiang, L. Xiao and G. M. Zeng, Bioresour. Technol., 2010, 101, 5063–5069 CrossRef CAS PubMed.
- S. Mallakpour and M. Naghdi, New J. Chem., 2020, 44, 6510–6523 RSC.
- C. G. Ramos, S. A. Sousa, A. M. Grilo, J. R. Feliciano and J. H. Leitão, J. Bacteriol., 2014, 196, 3980 CrossRef CAS PubMed.
- A. Denizli, R. Say and Y. Arica, Sep. Purif. Technol., 2000, 21, 181–190 CrossRef CAS.
- J. Zhang, C. Wu, A. Jia and B. Hu, Appl. Surf. Sci., 2014, 298, 95–101 CrossRef CAS.
- Q. Fu, Y. Deng, H. Li, J. Liu, H. Hu, S. Chen and T. Sa, Appl. Surf. Sci., 2009, 255, 4551–4557 CrossRef CAS.
- I. Langmuir, J. Am. Chem. Soc., 1916, 38, 2221–2295 CrossRef CAS.
- S. I. Al-Saeedi, A. Areej, M. T. Qamar, A. Alhujaily, S. Iqbal, M. T. Alotaibi, M. Aslam, M. A. Qayyum, A. Bahadur, N. S. Awwad, Y. Jazaa and E. B. Elkaeed, Front. Environ. Sci., 2023, 11, 1–16 Search PubMed.
- H. Freundlich, Z. Phys. Chem., 1907, 57, 385–470 CrossRef CAS.
- M. I. Temkin, Acta Physicochim. URSS, 1940, 12, 327–356 CAS.
- H. Shahbeig, N. Bagheri, S. A. Ghorbanian, A. Hallajisani and S. Poorkarimi, World J. Model. Simulat., 2013, 9, 243–254 Search PubMed.
- D. Rahangdale and A. Kumar, Carbohydrate Polym., 2018, 202, 334–344 CrossRef CAS PubMed.
- V. O. Shikuku and T. Mishra, Water Sci. Appl., 2021, 11, 103 CrossRef CAS.
- M. R. Elamin, B. Y. Abdulkhair, F. K. Algethami and L. Khezami, Sci. Rep., 2021, 11, 13606 CrossRef CAS PubMed.
- S. Vasudevan and J. Lakshmi, Water Sci. Technol.: Water Supply, 2011, 11, 142–150 CAS.
- J. Pal and M. K. Deb, J. Dispersion Sci. Technol., 2013, 34, 1193–1201 CrossRef CAS.
- A. R. Putra Hidayat, L. L. Zulfa, A. R. Widyanto, R. Abdullah, Y. Kusumawati and R. Ediati, RSC Adv., 2023, 13, 12320–12343 RSC.
- H. N. Tran, S.-J. You and H.-P. Chao, J. Environ. Manage., 2017, 188, 322–336 CrossRef CAS PubMed.
- P. Hou, G. Xing, L. Tian, G. Zhang, H. Wang, C. Yu, Y. Li and Z. Wu, Sep. Purif. Technol., 2019, 213, 524–532 CrossRef CAS.
- R. Sivaranjanee, P. S. Kumar and G. Rangasamy, Desalination Water Treat., 2024, 317, 100123 CrossRef.
- S. Li, F. Li, J. Wang, L. Tian, H. Zhang and S. Zhang, Appl. Catal., B, 2018, 8, 307–313 Search PubMed.
- Z. Jia, Z. Li, S. Li, Y. Li and R. Zhu, J. Mol. Liq., 2016, 220, 56–62 CrossRef CAS.
|
| This journal is © The Royal Society of Chemistry 2024 |
Click here to see how this site uses Cookies. View our privacy policy here.  Open Access Article
 *a,
Moustafa M. S. Sanad
 b,
Mohamed Abdel-Hakima and
Abdelaal S. A. Ahmed
 *a
*a
![[thin space (1/6-em)]](https://www.rsc.org/images/entities/char_2009.gif) 000–1
000–1![[thin space (1/6-em)]](https://www.rsc.org/images/entities/char_2009.gif) 000
000![[thin space (1/6-em)]](https://www.rsc.org/images/entities/char_2009.gif) 000 dyes annually produced through a variety of industrial processes, including food processing, pharmaceutical, textile, paper, rubber, plastic, and cosmetics industries.3 From this it has been reported that every year between 40
000 dyes annually produced through a variety of industrial processes, including food processing, pharmaceutical, textile, paper, rubber, plastic, and cosmetics industries.3 From this it has been reported that every year between 40![[thin space (1/6-em)]](https://www.rsc.org/images/entities/char_2009.gif) 000 and 50
000 and 50![[thin space (1/6-em)]](https://www.rsc.org/images/entities/char_2009.gif) 000 tons of dyes are dumped into the water systems.4 These dyes harm the aquatic ecosystem by lowering the aesthetic value of water features and obstructing light penetration.5 Some dyes have toxic, mutagenic properties, and can even cause cancer when combined with their metabolites. These dyes also cause problems for human renal, liver, and nervous system dysfunction. They are difficult to decolorize due to their complicated structure.6,7 Thus, there is a great interest from the environmentalists and researchers to remove these harmful compounds from wastewater.2,8,9
000 tons of dyes are dumped into the water systems.4 These dyes harm the aquatic ecosystem by lowering the aesthetic value of water features and obstructing light penetration.5 Some dyes have toxic, mutagenic properties, and can even cause cancer when combined with their metabolites. These dyes also cause problems for human renal, liver, and nervous system dysfunction. They are difficult to decolorize due to their complicated structure.6,7 Thus, there is a great interest from the environmentalists and researchers to remove these harmful compounds from wastewater.2,8,9


![[double bond, length as m-dash]](https://www.rsc.org/images/entities/char_e001.gif) O, and C–O–C/C–OH bonds, respectively.43 In N 1s XPS spectrum (Fig. 5e), two peaks at 399.58, and 401.91 eV were related to benzenoidamine(–NH–) and graphitic N (N–C3), respectively.44
O, and C–O–C/C–OH bonds, respectively.43 In N 1s XPS spectrum (Fig. 5e), two peaks at 399.58, and 401.91 eV were related to benzenoidamine(–NH–) and graphitic N (N–C3), respectively.44
![[thin space (1/6-em)]](https://www.rsc.org/images/entities/char_2009.gif) :
:![[thin space (1/6-em)]](https://www.rsc.org/images/entities/char_2009.gif) 7) as shown in Fig. 7a.
7) as shown in Fig. 7a.![[thin space (1/6-em)]](https://www.rsc.org/images/entities/char_2009.gif) qe − K1t
qe − K1t

![[thin space (1/6-em)]](https://www.rsc.org/images/entities/char_2009.gif) 997.921
997.921


![[thin space (1/6-em)]](https://www.rsc.org/images/entities/char_2009.gif) ln(Ce) + BT
ln(Ce) + BT![[thin space (1/6-em)]](https://www.rsc.org/images/entities/char_2009.gif) ln
ln![[thin space (1/6-em)]](https://www.rsc.org/images/entities/char_2009.gif) AT
AT

![[thin space (1/6-em)]](https://www.rsc.org/images/entities/char_2009.gif) Ce. The values of both BT and AT are presented in Table 5. It has been reported that the typical adsorption energies, (BT
Ce. The values of both BT and AT are presented in Table 5. It has been reported that the typical adsorption energies, (BT![[thin space (1/6-em)]](https://www.rsc.org/images/entities/char_2009.gif) ln(AT)), for a chemisorption in the range of 8–16 kJ mol−1, and bt values are higher than 80 kJ mol−1.58 From the slopes, and intercepts in Fig. 10c, the estimated values of BT
ln(AT)), for a chemisorption in the range of 8–16 kJ mol−1, and bt values are higher than 80 kJ mol−1.58 From the slopes, and intercepts in Fig. 10c, the estimated values of BT![[thin space (1/6-em)]](https://www.rsc.org/images/entities/char_2009.gif) ln(AT) for Cs, TNTs@Cs93, TNTs@Cs86.8 and TNTs@Cs76.7 composites are 8.102, 13.665, 37.335, and 47.294 kJ mol−1, respectively. The corresponding bt values are 2.872, 1.632, 0.328, and 0.222 kJ mol−1, respectively. This results illustrate that the interactions between CV dye and the surfaces of Cs, TNTs@Cs93, TNTs@Cs86.8 and TNTs@Cs76.7 composites are weak, indicating that the adsorption processes are physical adsorption.59
ln(AT) for Cs, TNTs@Cs93, TNTs@Cs86.8 and TNTs@Cs76.7 composites are 8.102, 13.665, 37.335, and 47.294 kJ mol−1, respectively. The corresponding bt values are 2.872, 1.632, 0.328, and 0.222 kJ mol−1, respectively. This results illustrate that the interactions between CV dye and the surfaces of Cs, TNTs@Cs93, TNTs@Cs86.8 and TNTs@Cs76.7 composites are weak, indicating that the adsorption processes are physical adsorption.59![[thin space (1/6-em)]](https://www.rsc.org/images/entities/char_2009.gif) ln
ln![[thin space (1/6-em)]](https://www.rsc.org/images/entities/char_2009.gif) K
K


![[thin space (1/6-em)]](https://www.rsc.org/images/entities/char_2009.gif) K vs. 1/T as shown in Fig. 11, and the thermodynamic parameters were monitored in Table 6. The positive value of ΔH° and ΔS° exhibited that the adsorption process of CV dye onto Cs, TNTs@Cs93, TNTs@Cs86.8, and TNTs@Cs76.7 composites were endothermic in nature.60 This means that the adsorption efficiency may be enhanced by increasing the solution's temperature. This also confirms that the adsorption is chemically processed. The negative values of ΔG° for (TNTs@Cs93, TNTs@Cs86.8, and TNTs@Cs76.7) adsorbents at all temperatures indicated that the process of adsorption in the present work is spontaneous and feasible, except the Cs adsorbent which ΔG° has positive value that indicated that the process of adsorption is not spontaneous.61
K vs. 1/T as shown in Fig. 11, and the thermodynamic parameters were monitored in Table 6. The positive value of ΔH° and ΔS° exhibited that the adsorption process of CV dye onto Cs, TNTs@Cs93, TNTs@Cs86.8, and TNTs@Cs76.7 composites were endothermic in nature.60 This means that the adsorption efficiency may be enhanced by increasing the solution's temperature. This also confirms that the adsorption is chemically processed. The negative values of ΔG° for (TNTs@Cs93, TNTs@Cs86.8, and TNTs@Cs76.7) adsorbents at all temperatures indicated that the process of adsorption in the present work is spontaneous and feasible, except the Cs adsorbent which ΔG° has positive value that indicated that the process of adsorption is not spontaneous.61

![[thin space (1/6-em)]](https://www.rsc.org/images/entities/char_2009.gif) :
:![[thin space (1/6-em)]](https://www.rsc.org/images/entities/char_2009.gif) 1 (v/v) ratio to 0.01 g of TNT@Cs76.7 composite. The initial concentrations of CV and MB dyes are 20 ppm, and the TNT@Cs76.7 composite weight was fixed at 0.01 g. The adsorption was carried out under magnetic stirring at room temperature for 30 min. As presented in Fig. 14, by adding 25% of MB onto CV dye, the TNT@Cs76.7 composite displayed little decreasing in adsorption affinity toward CV.
1 (v/v) ratio to 0.01 g of TNT@Cs76.7 composite. The initial concentrations of CV and MB dyes are 20 ppm, and the TNT@Cs76.7 composite weight was fixed at 0.01 g. The adsorption was carried out under magnetic stirring at room temperature for 30 min. As presented in Fig. 14, by adding 25% of MB onto CV dye, the TNT@Cs76.7 composite displayed little decreasing in adsorption affinity toward CV.


