 Open Access Article
Metal–organic framework-derived nanoflower and nanoflake metal oxides as electrocatalysts for methanol oxidation†
W. Kamala,
Abeer Enaiet Allaha,
Rehab Mahmouda,
Ahmed A. Farghalib,
Amna A. Kotpb and
Abdalla Abdelwahab *ac
*ac
aDepartment of Chemistry, Faculty of Science, Beni-Suef University, 62514 Beni-Suef, Egypt. E-mail: aabdelwahab@psas.bsu.edu.eg
bMaterials Science and Nanotechnology Department, Faculty of Postgraduate Studies for Advanced Science (PSAS), Beni-Suef University, 62511, Beni-Suef, Egypt
cDepartment of Chemistry, College of Sciences, University of Ha'il, Ha'il, 81451, Saudi Arabia. E-mail: a.abdelsalam@uoh.edu.sa
First published on 17th October 2024
Abstract
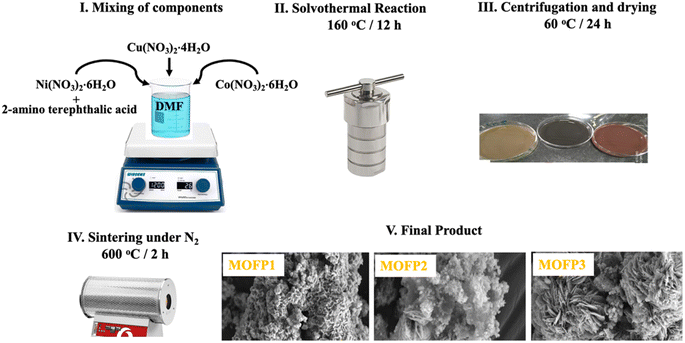
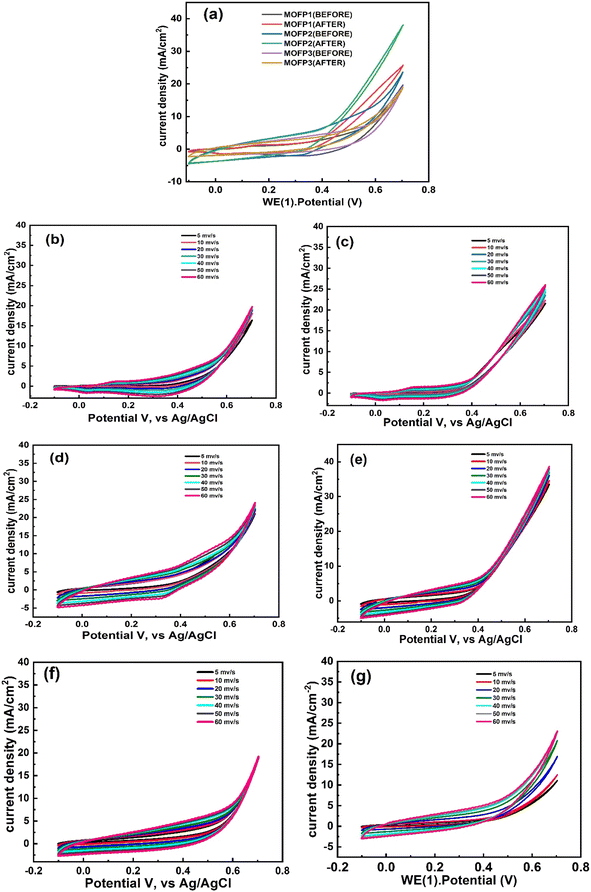
The energy crisis is the most urgent issue facing contemporary society and needs to be given top priority. As energy consumption rises, environmental pollution is becoming a serious issue. Direct methanol fuel cells (DMFCs) have emerged as the most promising energy source for a variety of applications such as electric vehicles and portable devices. Unfortunately, the kinetics of methanol oxidation is slow and needs an electrocatalyst to improve the reaction kinetics and the overall fuel cell efficiency. Herein, a straightforward hydrothermal procedure was utilized to prepare copper, nickel, and cobalt-based MOF composites by altering the elemental molar ratios. Cu-MOF (MOFP1), Cu/Ni-MOF (MOFP2), and Cu/Ni/Co-MOF (MOFP3) were prepared after carbonization and characterized using several key techniques such as FTIR, XRD, SEM, and EDX. The SEM analysis reveals that the morphology of MOFP1 is spherical aggregated particles, while that of MOFP2 or MOFP3 is in the form of nanoflakes and nanoflowers. Moreover, upon application of these composites as electrocatalysts for methanol electro-oxidation in an alkaline medium of 1 M NaOH using cyclic voltammetry (CV) and chronoamperometry (CA) tests, the electrochemical performance of MOFP2 in 1 M methanol exhibits the best performance for methanol oxidation with a current density reaching 38.77 mA cm−2 at a scan rate of 60 mV s−1. This can be attributed to the unique porous open flower structure and the synergistic effect between copper, nickel, and 2-aminoterephthalic acid which develop its catalytic activity.
1. Introduction
Energy is a critical component of the link between nature and mankind, and it has an economic impact.1 One of the most pressing issues confronting the globe today is how to generate energy in a sustainable and low-cost manner. Another goal is to reduce the environmental threat posed by global warming and to provide a solution to the scarcity of fossil resources.2 Because of the growth of this technology, renewable energy systems are now considered as highly effective and ecologically beneficial power generation alternatives. Renewable energy systems are characterized by low environmental impact, simple design, high power conversion efficiency (up to 50–55%) regardless of scale, generation of useful heat for power generation, integration with gas turbines and fuel flexibility.3Innovations in the field of fuel cells provide a safe way to generate electrical energy from chemical energy with high direct conversion efficiency and low environmental impact.4 Direct methanol fuel cells (DMFCs) have emerged as the most promising energy source for a variety of applications such as electric vehicles and portable devices. The anodic reaction of DMFCs is the electrocatalytic oxidation of methanol.5 Using methanol as a fuel has many advantages, including low working temperatures, easy storage and transportation, high energy efficiency, and rapid commissioning.6 Methanol is an excellent fuel due to its high heating value (HHV), ease of production, and availability.7,8 Unfortunately, the kinetics of methanol oxidation is very slow that needs an electrocatalyst to improve the reaction kinetics and the overall fuel cell efficiency.
Platinum acts as an extremely effective electrocatalyst for the oxygen reduction reaction (ORR) and fuel oxidation process (which includes hydrogen, methanol, ethanol, and formic acid).9,10 Its superior performance is related to its distinctive electrical arrangement, which makes it easier to move electrons to and from methanol.11 Despite these advantages, its high cost of utilization is the main obstacle to the commercialization of fuel cells.1,12 In addition, its efficiency as an electrocatalyst is quickly diminished by the adsorbed carbon monoxide (CO) and carbon dioxide (CO2) species on the Pt surface, which causes poisoning and clogging surface during MOR.1,13–16
| CH3OH + H2O → CO2 + 6H+ + 6e− | (1) |
| 2Pt + H2 → 2Pt–Hads | (2) |
| CO2 + 2Pt–Hads → 2Pt–CO2 + H2O + Pt | (3) |
In order to create alternative, highly efficient, and affordable catalysts for the methanol oxidation reaction, substantial research has been done on enhancing non-platinum-based catalysts for methanol oxidation reaction (MOR).17 Transition metal catalysts including metal oxides, metal hydrogen sulfide, layered double hydroxide (LDH)18,19 and Metal–Organic Framework (MOF)20,21 have recently been investigated as electro-catalysts for DMFCs due to, their availability, low cost, and their exceptional performance in the hydrogen evolution process (HER) and the methanol oxidation reaction (MOR).22,23 So, the current research worldwide focuses on creating highly effective and affordable low-cost catalyst materials for the oxidation of methanol (MOR) including metal oxide incorporated into carbon material or metal–organic framework (MOF) as a support.24 To synthesize a Co-MOF and its composites with reduced graphene oxide (rGO) for the electrochemical oxidation of methanol with a current density of 29.1 mA cm−2, Mehek et al. used a solvothermal technique.25 Co-MOF/50% CNTs demonstrated enhanced electrocatalytic activity at a scan rate of 50 mV s−1 and a current density of 35 mA cm−2 at a voltage of 0.335 V.26 Furthermore, using the traditional pyrolysis approach, Anchu et al. synthesized Co@CNT and evaluated it in the electrochemical oxidation of methanol, revealing a current density of 0.9 mA cm−2.27 These composites may, however, only exhibit a restricted stability and current density. Until now, transition metal-based electrocatalysts have yet to be thoroughly investigated and reported as a replacement for noble metal-based electrocatalysts in MOR sufficiently with satisfactory results.28
Metal–organic frameworks (MOFs) are a new family of crystalline porous materials which is created by coupling metals with secondary building units (SBUs) to organic ligands.29,30 MOFs have attracted scientific attention due to their high specific surface area, diverse 3D permeability, unsaturated metal centers, symmetrically distributed active sites, good stability, and large pore volume.31,32 To overcome their relatively low electronic conductivity and chemical instability, MOFs are also often incorporated into conductive materials such as metal compounds, carbonaceous materials, or composites thereof to create functional materials.33,34 However, due to their controlled and unique properties, they offer (a) potential for synthesizing transition metal oxides (TMOs), as MOFs can be annealed to produce self-templated metal oxides; widely used as a precursor and template. In particular, the hollow/porous and nanosized structure provides more active sites, which develops ionic adsorption. (b) Multi-metallic oxides are easily made from heterometallic MOFs as precursors through calcinations. They have better electrochemical performance than single metal oxide because of the synergistic interaction of the different metal species and oxidative CO removal from the surface.35 It is thought that MOFs are a rich source of carbon and nitrogen, and the in situ-produced carbon and nitrogen atoms can be kept at the right temperature and environment, which can improve the electrochemical performance and mechanical stability of the produced materials in the anode application.36,37
Additionally, compared to Pt, Cu-based electrocatalysts are less susceptible to CO adsorption in an alkaline environment, making them suitable materials for MOR in a fuel cell.38 However, because copper has a low MOR activity when used alone, so alloying could be used to boost the properties of copper to achieve a specific need that copper cannot meet on its own. Based on the above aspects, nickel is one of the most important non-noble catalysts, and its MOF composites can vary from Ni2+ to Ni3+, and vice versa, with low cost and anti-poisoning properties.39–41 Moreover, the cobalt-based MOFs, commonly known as Co-MOF-71, are one of the most active MOFs at MOR.42 Cobalt is a transition metal that provides redox active sites, has stronger electrochemical activity, and can participate in faradaic redox processes on surfaces.43 Catalytic applications of Co-MOF-71 in ORR, HER, and OER were successfully evaluated at appropriate current densities.42,44,45 Bimetallic Metal–Organic Frameworks (MOFs) Cu/Ni-MOFs have two different metal ions at the inorganic nodes.46 Bimetallic MOF-derived nanomaterials feature exposed active sites, high stability, and electrical conductivity, making them beneficial for use in electrochemical energy storage and conversion, as well as in the catalysis of more difficult processes in harsh environments.47
The key to improving the electrocatalytic activity is the coupling effect between mixed metals.48 Adding a third metal such as Co to bimetallic Cu/Ni MOFs creates a trimetallic MOFs matrix (Cu/Ni/Co MOFs) that changes the coordination environment and electrical properties of the active sites, further increasing their activity.49 This study aims to develop promising electrode materials with improved electrochemical activity and stability for methanol oxidation reactions. Therefore, various MOFs-based composites and their metal/metal oxide derivatives were prepared by solvothermal approach and deposited on a carbon paste electrode to verify their activity towards methanol oxidation reaction in an alkaline medium (NaOH). The synthesized nanocomposites were denoted as Cu-MOF, Cu/Ni-MOF, and Cu/Ni/Co-MOF. The use of cobalt–nickel (Co–Ni)-based metal–organic frameworks (MOFs) containing inorganic/organic species has been demonstrated to yield high current densities due to their high redox response. The synergistic interactions between different metals and ligands endow these materials with high activity. It exhibits high electrochemical conductivity and an exceptional electrolyte access zone, allowing for a significant number of active sites and fast charge transfer rates.
2. Experiment
2.1. Materials
Co(NO3)2·6H2O, Cu(NO3)2·4H2O, Ni(NO3)2·6H2O, and N,N-dimethylformamide (DMF), were purchased from Alpha Chemika. The organic ligand, 2-aminoterephthalic acid, was purchased from Sigma Aldrich. Piochem provided the sodium hydroxide (NaOH). Alpha Chemistry supplied the methanol (India). For carbon paste, ACROS Organics provided the graphite powder, and Fluka supplied the paraffin oil. All preparations were made using distilled water.2.2. Preparation of MOF composites
2.3. Characterization
XRD analysis was performed using an X-ray diffractometer (Cu-Kα radiation) operating at a voltage of 40 kV and a current of 35 mA. The Fourier Transform Infra-red spectroscopy (FTIR) characterization was carried out using a Bruker Vertex 70. The structural morphology was checked by Scanning Electron Microscopy (SEM, ZEISS, Sigma 500 VP). The energy-dispersive X-ray spectroscopy (EDX) was used to identify the elemental composition (EDX; EDAX AMETEK analyzer). The surface area and porosity were investigated from the N2 adsorption data using a Tri-Star II 3020 (Micromeritics, USA) analyzer by the Brunauer–Emmett–Teller (BET) method. The hydrodynamic particle sizes and zeta potential were measured using Malvern zeta sizer equipment (Malvern Instruments Ltd).2.4. Working electrode fabrication
The electrode was fabricated by mixing 150 μL of paraffin oil and 1 g of graphite powder in a mortar and pestle for 30 minutes, then the mixture was dried for 30 minutes. A Teflon tube served as a holder for the finished paste, and a copper wire served as the electrical contact. Before use, the electrode surface was polished on a smooth piece of paper and then cleaned with double-distilled water.50 The prepared electrocatalyst was then dissolved in 200 μL of isopropanol and 20 μL of 5% Nafion solution. The mixture was then sonicated at room temperature for one hour. Finally, 20 μL of the sonicated suspension was poured over the active area of the carbon paste electrode and dried at 60 °C for 15 min.2.5. Electrocatalytic activity measurements
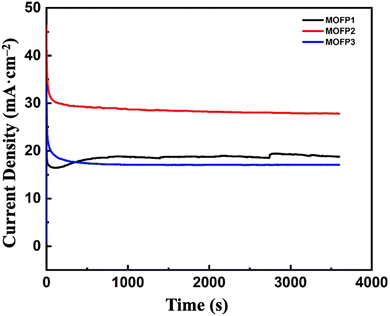
The electrochemical tests were performed using three-electrodes glass electrochemical cell with the carbon paste as the working electrode, graphite as the counter electrode, and Ag/AgCl as the reference electrode. The measurements were conducted using NOVA 1.11 Potentiostat/Galvanostat (AUTOLAB PGSTAT 302N, Metrohm, Herisau, Switzerland) software. An alkaline electrolyte of 1.0 M NaOH was used to investigate the electrocatalytic activity of the manufactured electrodes in the presence and absence of various methanol concentrations. The used electrochemical tests were cyclic voltammetry at different scan rates between 5–60 mV s−1 within a potential range of −0.1–0.7 V. Moreover, the chronoamperometry (CA) tests were recorded at 0.7 V for 1 h.2.6. The evaluation of main electrochemical parameters (b, jo, Cdl, ESCA) for samples MOFP1, MOFP2 and MOFP3
Tafel plots obtained by fitting the polarisation curves as overpotential versus log current density: η = a + b![[thin space (1/6-em)]](https://www.rsc.org/images/entities/char_2009.gif) log[j], where η is the overpotential, j is the current density, and b is the Tafel slope. Tafel plots are obtained by fitting in the linear region of Tafel curve. The Tafel curve's intersection in the linear extension zone is the exchange current density (jo). The double layer capacitance (Cdl) and electrochemically active surface area (ECSA) of samples evaluated through the CV measurements at different scan rates at the potential window (0–0.1 V) where no faradaic processes took place was used. (Cdl) was determined from a CV using the equation: Cdl = Δj(ja − jc)/2, where ja and jc are anodic and cathodic current densities. Plotting the average current densities versus scan rate yielded a straight line with a slope equal to (Cdl). The electrochemically active surface area (ECSA) was estimated according to the equation: ECSA = Cdl/Cs, where Cs is the specific capacitance of the electrode and was taken as 0.04 mF cm−2 in 1 M KOH electrolyte.
log[j], where η is the overpotential, j is the current density, and b is the Tafel slope. Tafel plots are obtained by fitting in the linear region of Tafel curve. The Tafel curve's intersection in the linear extension zone is the exchange current density (jo). The double layer capacitance (Cdl) and electrochemically active surface area (ECSA) of samples evaluated through the CV measurements at different scan rates at the potential window (0–0.1 V) where no faradaic processes took place was used. (Cdl) was determined from a CV using the equation: Cdl = Δj(ja − jc)/2, where ja and jc are anodic and cathodic current densities. Plotting the average current densities versus scan rate yielded a straight line with a slope equal to (Cdl). The electrochemically active surface area (ECSA) was estimated according to the equation: ECSA = Cdl/Cs, where Cs is the specific capacitance of the electrode and was taken as 0.04 mF cm−2 in 1 M KOH electrolyte.
3. Results and discussion
3.1. Physicochemical characteristics
The crystalline structure of the prepared MOF composites and their derived oxides were characterized by the X-ray diffraction (XRD), Fig. 1. Fig. 1a, shows the X-ray diffraction pattern of Cu-MOF material. The main peaks centered at 2θ of 10.2°, 17°, 21°, 24.8°, 43°, 50.5°, 74.8° are assigned to the (200), (220), (222), (400), (422), (511), and (751) planes of Cu-MOF composite.51 The XRD pattern of the derived CuO NPs (MOFP1) is shown in Fig. 1b. The most significant peaks are seen at 2θ of 35.7°, 36.4°, 38.6°, and 42.7°, respectively, which correspond to the crystal planes of (110), (002), (111), and (020) (JCPDS card no. 00-041-0254).52,53 Fig. 1c, displays the XRD pattern of the as synthesized Cu/Ni-MOF. The Ni-MOF characteristic peaks appears at 2θ of 16.68°(101), 19.65°(200), 34°(022), 44.3°(512), and 50.50°(226), which corresponds to the typical JCPDS no. 00-045-1691 card.54 In Fig. 1d, the diffraction peaks of NiO at 2θ of 37.20°, 43.20°, 62.87°, and 75.20° are assigned to the (111), (200), (220) and (311) crystal planes, respectively.55 Fig. 1e, shows the XRD pattern for Cu/Ni/Co-MOF in which the characteristic diffraction planes of Co-MOF are appeared at 2θ of 11.56°, 16.9°, 17.91°, 19.6°, 20.63°, 21.86°, 28.62°, 29.03°, and 43.35°, demonstrating the successful integration of Co into Cu/Ni-MOF.56 Fig. 1f, shows the characteristic peaks of CoO 2θ of 36.9°, 42.85°, and 64.8° which are assigned to the diffraction planes (311), (400) and (441).57 These (hkl) planes are properly configured with normal JCPDS data card number (80-1538).42,58 After calcination of MOF, there are absence of peaks related to the derived carbon from MOFs which confirm the formation of amorphous carbon. Previous studies showed that amorphous carbon electrode compared to their crystalline equivalent, allow for additional ion diffusion paths, which would improve electrochemical performance.59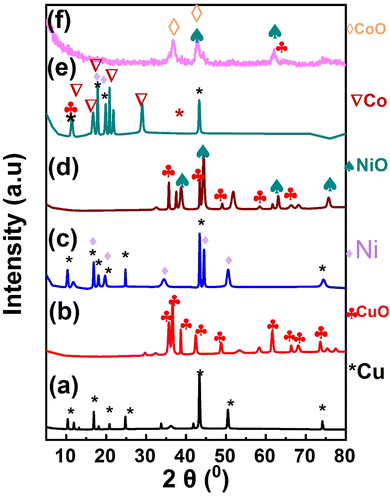 | ||
| Fig. 1 X-ray diffraction pattern of (a) Cu-MOF, (b) MOFP1, (c) Cu/Ni-MOF, (d) (MOFP2), (e) Cu/Ni/Co-MOF, (f) (MOFP3). | ||
The FTIR spectrum in Fig. 2a shows the disappearance of the stretching peak of –OH in Cu MOF revealing the coordination bond between Cu2+ and –COOH of 2-aminoterephthalic acid.60 The amino group of 2-aminoterephthalic acid shows two stretching peaks at 3508 cm−1 and 3394 cm−1, while the peak of Cu-MOF was at 3352 cm−1 and 3466 cm−1 due to the formation of intra-framework hydroxyl group between the amine group and the electron-donating oxygen of the carboxyl group.61 The Cu-MOF was annealed at 600 °C (MOFP1), as shown in the FTIR spectrum in Fig. 2b. The adsorbed water molecules were responsible for the broad absorption peak at about 3422 cm−1.62 The OH stretching range is 2700 to 3750 cm−1. The symmetrical Cu–O stretching can be represented by the peak at 1638 cm−1.63 The vibrational modes of CuO NPs in the range of 500–700 cm−1 are revealed by two infrared absorption peaks. The peaks at 512 cm−1 and 618 cm−1, reveal the formation of CuO NPs.
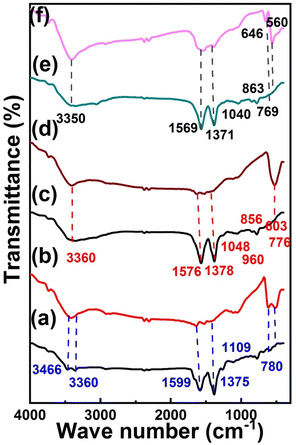 | ||
| Fig. 2 FT-IR spectrum of (a) Cu-MOF, (d) (MOFP1), (b) Cu/Ni-MOF, (e) MOFP2, (c) Cu/Ni/Co-MOF, (f) (MOFP3). | ||
The functional groups and metal bonds of Cu/Ni-MOF and Cu/NiO (MOFP2) were investigated by FTIR (Fig. 2c and d). All the prepared catalysts exhibit symmetric and asymmetric C![[double bond, length as m-dash]](https://www.rsc.org/images/entities/char_e001.gif) O stretching as indicated by sharp peaks at 1576 cm−1 and 1378 cm−1, respectively.64 Due to the removal of protons from the –COOH group of benzenedicarboxylic acid, there is no significant absorption peak at approximately 1715–1680 cm−1.64 The presence of C–O band at 1576–1048 cm−1 indicates that the dicarboxylic acid is coordinated with Ni and Cu.65 Furthermore, the band at 603 cm−1 indicates the formation of metallic bonds with carboxyl groups. At about 3400–3500 cm−1, there is a broad band caused by O–H stretching, confirming that this is a regulated water source connected within the Ni/Cu MOF.66 According to the FTIR spectrum in Fig. 2d, (Ni/Cu MOF annealed at 600 °C), the bands of the Ni main MOF include O–H stretching: broadband: 3422 cm−1 and C–H stretching: 2938 cm−1 (stretching: narrowband). In the region of 600–700 cm−1, there is a large absorption band associated with the Ni–O stretching mode. The size of the absorption bands indicates that the NiO particles are nanocrystalline.55 The jagged absorption bands in the range 1000–1500 cm−1 are caused by symmetric and asymmetric O–C
O stretching as indicated by sharp peaks at 1576 cm−1 and 1378 cm−1, respectively.64 Due to the removal of protons from the –COOH group of benzenedicarboxylic acid, there is no significant absorption peak at approximately 1715–1680 cm−1.64 The presence of C–O band at 1576–1048 cm−1 indicates that the dicarboxylic acid is coordinated with Ni and Cu.65 Furthermore, the band at 603 cm−1 indicates the formation of metallic bonds with carboxyl groups. At about 3400–3500 cm−1, there is a broad band caused by O–H stretching, confirming that this is a regulated water source connected within the Ni/Cu MOF.66 According to the FTIR spectrum in Fig. 2d, (Ni/Cu MOF annealed at 600 °C), the bands of the Ni main MOF include O–H stretching: broadband: 3422 cm−1 and C–H stretching: 2938 cm−1 (stretching: narrowband). In the region of 600–700 cm−1, there is a large absorption band associated with the Ni–O stretching mode. The size of the absorption bands indicates that the NiO particles are nanocrystalline.55 The jagged absorption bands in the range 1000–1500 cm−1 are caused by symmetric and asymmetric O–C![[double bond, length as m-dash]](https://www.rsc.org/images/entities/char_e001.gif) O stretching vibrations and C–O stretching vibrations. The FTIR spectra of Cu/Ni/Co MOF and MOFP3 are shown in Fig. 2e and f. In Fig. 2e, it was observed that asymmetry and symmetry exist in the vibrational band of the H–N group in the range of 3300–3000 cm−1. Additionally, the C–H bending vibrations were assigned to bands at 1058 and 787 cm−1,67 both in-plane and out-of-plane. The v-skeletal resonance (C
O stretching vibrations and C–O stretching vibrations. The FTIR spectra of Cu/Ni/Co MOF and MOFP3 are shown in Fig. 2e and f. In Fig. 2e, it was observed that asymmetry and symmetry exist in the vibrational band of the H–N group in the range of 3300–3000 cm−1. Additionally, the C–H bending vibrations were assigned to bands at 1058 and 787 cm−1,67 both in-plane and out-of-plane. The v-skeletal resonance (C![[double bond, length as m-dash]](https://www.rsc.org/images/entities/char_e001.gif) C) of the benzene ring was identified as the source of the absorption band at 1566 cm−1.68–70 The prominent peaks at 1566 and 1382 cm−1 were due to symmetric and asymmetric carbonyl bending vibrations.71 The stretching mode of water (OH) is associated with a broad band of 3405 cm−1. The presence of the O–H stretching mode indicates that the unchanged MOF is hydrated.72 The vibrational mode of the Cu–O bond is characterized by the band at 566 cm−1.73 Fig. 2f shows the CoO features with two distinct bands at 646 and 560 cm−1.74 The interactions between the Cu, Ni, Co, and NH groups throughout the composite process are the basis for all modifications, which support the idea of preparation of Cu/Ni/Co-MOF.
C) of the benzene ring was identified as the source of the absorption band at 1566 cm−1.68–70 The prominent peaks at 1566 and 1382 cm−1 were due to symmetric and asymmetric carbonyl bending vibrations.71 The stretching mode of water (OH) is associated with a broad band of 3405 cm−1. The presence of the O–H stretching mode indicates that the unchanged MOF is hydrated.72 The vibrational mode of the Cu–O bond is characterized by the band at 566 cm−1.73 Fig. 2f shows the CoO features with two distinct bands at 646 and 560 cm−1.74 The interactions between the Cu, Ni, Co, and NH groups throughout the composite process are the basis for all modifications, which support the idea of preparation of Cu/Ni/Co-MOF.
Fig. 3a and b of Cu-MOF after carbonization (MOFP1) shows well homogenized, spherical, nanoparticle aggregates forming a rough porous structure.75 Fig. 3c–e, shows the morphology of Cu/Ni-MOF after carbonization (MOFP2). The combination of homogenous spherical particles of CuO and hollow shell structure of NiO are visible in the SEM micrographs and appear as open flower structures that might enhance its electrochemical characteristics Fig. 3d. The FESEM images of Co/Cu/Ni MOF after carbonization (MOFP3) are shown in Fig. 3f–h. It is characterized by a sharp, thin coating aggregated flakes, up to 300 nm in size. Fig. 3h, appears as an overall spherical cluster, consistent with the morphology described in previous work.69 This indicates that the porous CoO microspheres maintain the shape of the precursor. The accumulation of small particles forms rich pores, which proves that pores are formed during calcination. Several overlapping nanospheres were present and began to form groups similar to pagodas or cauliflowers. The results show properties of both nano- and micro-sized components, such as shortened transport paths and enhanced tap density, which are beneficial for improving methanol oxidation.76 Furthermore, the cavity between the formed nanoparticles allows for the effective penetration of electrolyte.77 As shown in Fig. S1a and b† TEM and HRTEM image for MOFP2 is providing evidence of their spherical particles combined with hollow shell structures.
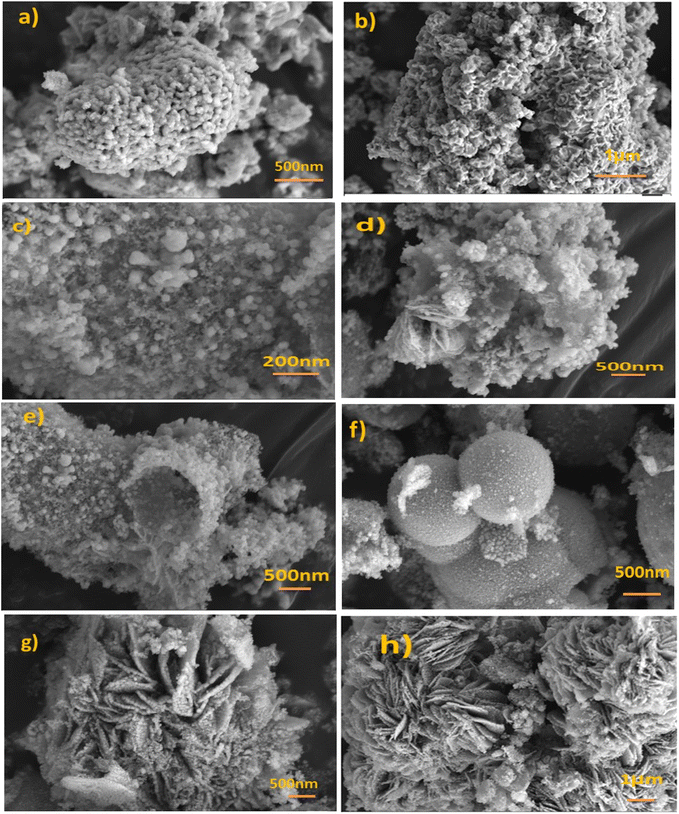 | ||
| Fig. 3 FE-SEM images (a and b) for MOFP1, (c–e) for MOFP2, and (f–h) for MOFP3 at different magnification scales. | ||
In Fig. 5a, the energy dispersive X-ray spectroscopy (EDX) confirms the presence of copper, oxygen, and carbon atoms for (MOFP1). Furthermore, the EDX of MOFP2, Fig. 5b, shows the presence of copper, nickel, carbon, and oxygen which confirms the successful integration of Ni with Cu-MOF. Additionally, Fig. 5c, represent the EDX analysis for MOFP3 where cobalt, copper, nickel, oxygen, and carbon atoms are found in Table S1.†
The porous structure of the prepared MOFs was investigated using N2 adsorption–desorption measurements in Fig. 4d. According to the IUPAC classification scheme, the adsorption isotherms for all those materials are combinations of types I and IV, which suggests the development of the mesopore structures. Table 1, shows the average pore radius (nm) (BJH method) and the BET surface area of the MOFP composites. The MOFP2 possesses the highest BET surface area of (21 m2 g−1) compared to other fabricated MOFP composites, together with its average pore size of 4.5 nm can improve methanol transport and its oxidation through the porous material.
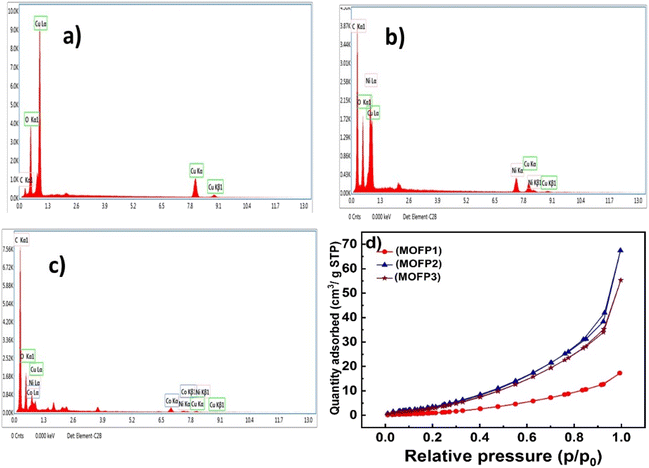 | ||
| Fig. 4 EDX of (a) MOFP1, (b) MOFP2, (c) MOFP3, (d) nitrogen adsorption/desorption isotherms of MOFs. | ||
| Sample | SBET (m2 g−1) | Lo(BJH) (nm) |
|---|---|---|
| MOFP1 | 7 | 14.9 |
| MOFP2 | 21 | 4.5 |
| MOFP3 | 19 | 4.4 |
3.2. Oxidation of methanol
| ECSA = Cdl/Cs | (4) |
| Scan rate (mV s−1) | Current density of MOFP1 (mA cm−2) | Current density of MOFP2 (mA cm−2) | Current density of MOFP3 (mA cm−2) |
|---|---|---|---|
| 5 | 18.97 | 21.17 | 16.38 |
| 10 | 19.19 | 21.77 | 18.07 |
| 20 | 19.20 | 22.32 | 18.73 |
| 30 | 19.22 | 22.90 | 19.14 |
| 40 | 19.25 | 22.99 | 19.61 |
| 50 | 19.26 | 23.45 | 19.65 |
| 60 | 19.27 | 24.10 | 19.74 |
| Electrocatalyst | Electrolyte | Applied voltage | Current density (mA cm−2) | Ref. |
|---|---|---|---|---|
| Ni-MOF/IL | 0.5 M NaOH | 0.5 V (vs. SCE) | 18 | 89 |
| MOF-74 | 0.1 M NaOH | 0.7 V (vs. Ag/AgCl) | 13.46 | 90 |
| 20% Ni/MIL-110 | 0.1 M NaOH | 0.7 V (vs. Ag/AgCl) | 14.40 | 91 |
| C–Pt-ZIF-8e | 0.5 M KOH | — | 16.16 | 92 |
| MOFP1 | 1.0 M NaOH | 0.7 V (vs. Ag/AgCl) | 23.23 | This work |
| MOFP2 | 1.0 M NaOH | 0.7 V (vs. Ag/AgCl) | 38.98 | This work |
| MOFP3 | 1.0 M NaOH | 0.7 V (vs. Ag/AgCl) | 26.04 | This work |
4. Conclusions
A cost-effective and environmentally friendly solvothermal process was used to fabricate the MOFs composites and anneal at 600 °C in a N2 flow to obtain their corresponding derived metal oxides. By using this preparation method, nanoflowers or nanoflakes of MOFs derived metal oxides can be produced. Our study shows that the synthesized catalyst has a very high potential to be used in direct methanol fuel cells. The ability of the materials to catalyze the methanol oxidation reaction was investigated. The MOFP2 composite showed the best performance with a maximum current density of 38.98 mA cm−2 at a scan rate of 60 mV s−1. The surprising combination of acceptable high current density and affordable price makes it a potential replacement for expensive electrocatalysts in various fuel cell applications.Data availability
The authors confirm that the data supporting the findings of this study are available within the article and its ESI.†Author contributions
W. Kamal: writing, results, discussion, and experiments. Rehab Mahmoud: review, editing, supervision and project administration. Abeer Enaiet Allah: review and supervision. Abdalla Abdelwahab: data analysis, editing, supervision. Ahmed A. Farghali: review, supervision and project administration.Conflicts of interest
The authors certify that they are aware of no financial conflicts of interest or close personal relationships that could interfere with the research described in this publication.References
- H. F. M. Mohamed, E. E. Abdel-Hady, M. F. M. Hmamm, M. Ibrahim, H. Ahmed, M. Mondy and H. Yehia, IOP Conf. Ser.: Mater. Sci. Eng., 2018, 464(1), 012002 CrossRef
.
- M. Lo Faro, V. Antonucci, P. L. Antonucci and A. S. Aricó, Fuel, 2012, 102, 554–559 CrossRef CAS
.
- G. Cacciola, V. Antonucci and S. Freni, J. Power Sources, 2001, 100(1), 67–79 CrossRef CAS
.
- T. Eisa, H. O. Mohamed, Y. J. Choi, S. G. Park, R. Ali, M. A. Abdelkareem, S. E. Oh and K. J. Chae, Int. J. Hydrogen Energy, 2020, 45, 5948–5959 CrossRef CAS
.
- Y. S. Li, T. S. Zhao and Z. X. Liang, J. Power Sources, 2009, 190, 223–229 CrossRef CAS
.
- J. Taraszewska and G. Rosłonek, J. Electroanal. Chem., 1994, 364, 209–213 CrossRef CAS
.
- W. Tu, Y. Sun, D. Wu, H. Wang, H. Huang, M. Shao, Y. Liu and Z. Kang, Mater. Chem. Phys., 2019, 225, 64–71 CrossRef CAS
.
- B. Y. Xia, J. N. Wang and X. X. Wang, J. Phys. Chem. C, 2009, 113, 18115–18120 CrossRef CAS
.
- H. A. Gasteiger, S. S. Kocha, B. Sompalli and F. T. Wagner, Appl. Catal., B, 2005, 56, 9–35 CrossRef CAS
.
- A. Nouralishahi, Y. Mortazavi, A. A. Khodadadi, M. Choolaei, L. T. Thompson and B. A. Horri, Appl. Surf. Sci., 2019, 467–468, 335–344 CrossRef CAS
.
- H. Liu, C. Song, L. Zhang, J. Zhang, H. Wang and D. P. Wilkinson, J. Power Sources, 2006, 155, 95–110 CrossRef CAS
.
- S. Guo, S. Zhang and S. Sun, Angew. Chem., Int. Ed., 2013, 52, 8526–8544 CrossRef CAS
.
- E. E. Abdel-Hady, M. Shaban, M. O. Abdel-Hamed, A. Gamal, H. Yehia and A. M. Ahmed, Nanomaterials, 2022, 3 DOI:10.3390/nano12030492
.
- C. Y. Du, T. S. Zhao and W. W. Yang, Electrochim. Acta, 2007, 52, 5266–5271 CrossRef CAS
.
- T. Seiler, E. R. Savinova, K. A. Friedrich and U. Stimming, Electrochim. Acta, 2004, 49, 3927–3936 CrossRef CAS
.
- M. Mansor, S. N. Timmiati, W. Y. Wong, A. M. Zainoodin, K. L. Lim and S. K. Kamarudin, Catalysts, 2020, 10, 1–20 CrossRef
.
- Y. Liu, B. Hu, S. Wu, M. Wang, Z. Zhang, B. Cui, L. He and M. Du, Appl. Catal., B, 2019, 258, 117970 CrossRef CAS
.
- E. E. Abdel-Hady, R. Mahmoud, S. H. M. Hafez and H. F. M. Mohamed, J. Mater. Res. Technol., 2022, 17, 1922–1941 Search PubMed
.
- K. Patil, P. Babar, D. M. Lee, V. Karade, E. Jo, S. Korade and J. H. Kim, Sustainable Energy Fuels, 2020, 4, 5254–5263 RSC
.
- R. Mehek, N. Iqbal, T. Noor, H. Nasir, Y. Mehmood and S. Ahmed, Electrochim. Acta, 2017, 255, 195–204 CrossRef CAS
.
- R. K. Tripathy, A. K. Samantara and J. N. Behera, Dalton Trans., 2019, 48, 10557–10564 RSC
.
- J. Wang, X. Cao, L. Fang, X. You, K. Wong, S. Cao, C. Xiao, S. Cai, Y. Huang, X. Zhang and Z. Chen, Int. J. Hydrogen Energy, 2019, 44, 16411–16423 CrossRef CAS
.
- L. Qian, S. Luo, L. Wu, X. Hu, W. Chen and X. Wang, Appl. Surf. Sci., 2020, 503, 144306 CrossRef CAS
.
- Z. Jia, Y. Wang and T. Qi, RSC Adv., 2015, 5, 62142–62148 RSC
.
- R. Mehek, N. Iqbal, T. Noor, H. Nasir, Y. Mehmood and S. Ahmed, Electrochim. Acta, 2017, 255, 195–204 Search PubMed
.
- A. A. Kotp, A. Abdelwahab, A. A. Farghali, W. M. A. E. Rouby and A. Enaiet Allah, RSC Adv., 2023, 13, 27934–27945 Search PubMed
.
- A. Ashok, A. Kumar, A. Yuda and A. Al Ashraf, Int. J. Hydrogen Energy, 2022, 47(5), 3346–3357 CrossRef CAS
.
- M. M. Rajpure, H. S. Jadhav and H. Kim, Colloids Surf., A, 2022, 654, 130062 CrossRef CAS
.
- H. A. Younes, M. Taha, R. Khaled, H. M. Mahmoud and R. M. Abdelhameed, J. Alloys Compd., 2023, 930, 167322 CrossRef CAS
.
- H. Furukawa, K. E. Cordova, M. O'Keeffe and O. M. Yaghi, Science, 2013, 341 Search PubMed
.
- J. Lee, O. K. Farha, J. Roberts, K. A. Scheidt, S. T. Nguyen and J. T. Hupp, Chem. Soc. Rev., 2009, 38, 1450–1459 RSC
.
- Y. Ri Lee, M. Tian, S.-N. Kim, W.-S. Ahn and K. Ho Row, Adsorpt. Sci. Technol., 2014, 32(9), 725–735 CrossRef
.
- X. Li, S. Zheng, L. Jin, Y. Li, P. Geng, H. Xue, H. Pang and Q. Xu, Adv. Energy Mater., 2018, 8, 1800716 CrossRef
.
- L. Yaqoob, T. Noor, N. Iqbal, H. Nasir and A. Mumtaz, Sci. Rep., 2021, 11(1), 13402 CrossRef CAS
.
- X. Tan, Y. Wu, X. Lin, A. Zeb, X. Xu, Y. Luo and J. Liu, Inorg. Chem. Front., 2020, 7, 4939–4955 RSC
.
- G. S. Day, J. Li, E. A. Joseph, P. C. Metz, Z. Perry, M. R. Ryder, K. Page and H. C. Zhou, Nanoscale Adv., 2020, 2, 2758–2767 RSC
.
- X. Cui, W. Guo, M. Zhou, Y. Yang, Y. Li, P. Xiao, Y. Zhang and X. Zhang, ACS Appl. Mater. Interfaces, 2015, 7, 493–503 CrossRef CAS
.
- I. Danaee, M. Jafarian, F. Forouzandeh, F. Gobal and M. G. Mahjani, Int. J. Hydrogen Energy, 2008, 33, 4367–4376 CrossRef CAS
.
- M. Mansor, S. N. Timmiati, K. L. Lim, W. Y. Wong, S. K. Kamarudin and N. H. Nazirah Kamarudin, Int. J. Hydrogen Energy, 2019, 44, 14744–14769 CrossRef CAS
.
- X. Wang, S. Xi, W. S. V. Lee, P. Huang, P. Cui, L. Zhao, W. Hao, X. Zhao, Z. Wang, H. Wu, H. Wang, C. Diao, A. Borgna, Y. Du, Z. G. Yu, S. Pennycook and J. Xue, Nat. Commun., 2020, 11, 1–9 CrossRef CAS
.
- M. Jahan, Z. Liu and K. P. Loh, Adv. Funct. Mater., 2013, 23, 5363–5372 CrossRef CAS
.
- C. H. Jadhav, K. B. Pisal, A. R. Chavan, S. M. Patil, P. B. Patil and P. K. Pagare, Mater. Today: Proc., 2020, 43, 2742–2746 Search PubMed
.
- L. Yaqoob, T. Noor and N. Iqbal, Int. J. Energy Res., 2021, 45, 6550–6583 CrossRef CAS
.
- E. Loni, A. Shokuhfar and M. H. Siadati, Catal. Surv. Asia, 2021, 25, 114–147 CrossRef CAS
.
- R. Ojani, J. Bakhsh, A. Ahmady and S. Reza, Caspian J. Chem., 2013, 2, 45–57 Search PubMed
.
- L. Chen, H. F. Wang, C. Li and Q. Xu, Chem. Sci., 2020, 11, 5369–5403 RSC
.
- H. Wang, Q. L. Zhu, R. Zou and Q. Xu, Chem, 2017, 2, 52–80 CAS
.
- K. Zhang, W. Guo, Z. Liang and R. Zou, Sci. China: Chem., 2019, 62, 417–429 CrossRef CAS
.
- D. Senthil Raja, C. L. Huang, Y. A. Chen, Y. M. Choi and S. Y. Lu, Appl. Catal., B, 2020, 279, 119375 CrossRef CAS
.
- R. H. Mahmoud, F. A. Samhan, M. K. Ibrahim, G. H. Ali and R. Y. A. Hassan, Bioprocess Biosyst. Eng., 2021, 44, 759–768 CrossRef CAS
.
- S. M. Hwang, S. Y. Choi, M. H. Youn, W. Lee, K. T. Park, K. Gothandapani, A. N. Grace and S. K. Jeong, ACS Omega, 2020, 5, 23919–23930 CrossRef CAS
.
- M. Bin Mobarak, M. S. Hossain, F. Chowdhury and S. Ahmed, Arabian J. Chem., 2022, 15, 104117 CrossRef CAS
.
- D. Mubarak Ali, J. Arunkumar, P. Pooja, G. Subramanian, N. Thajuddin and N. S. Alharbi, Saudi Pharm. J., 2015, 23, 421–428 CrossRef
.
- M. Zeraati, V. Alizadeh, P. Kazemzadeh, M. Safinejad, H. Kazemian and G. Sargazi, J. Porous Mater., 2022, 29, 257–267 CrossRef CAS
.
- Z. Wei, H. Qiao, H. Yang, L. Zhu and X. Yan, J. Nanomater., 2009, 2009(1), 795928 CrossRef
.
- F. T. Alshorifi, S. M. El Dafrawy and A. I. Ahmed, ACS Omega, 2022, 7, 23421–23444 CrossRef CAS
.
- I. Gul, S. M. Khan, T. Mehmood, Z. Ahmad, H. Badshah and H. Shah, Microsc. Res. Tech., 2020, 83, 1124–1131 CrossRef CAS
.
- B. Orhan, R. Adetoro and H. Kaygusuz, ChemRxiv, 2022, 1–11 Search PubMed
.
- S. Li, K. Yang, P. Ye, K. Ma, Z. Zhang and Q. Huang, Appl. Surf. Sci., 2020, 503, 144090 CrossRef CAS
.
- M. S. Rahmanifar, H. Hesari, A. Noori, M. Y. Masoomi, A. Morsali and M. F. Mousavi, Electrochim. Acta, 2018, 275, 76–86 CrossRef CAS
.
- S. Wang, W. Deng, L. Yang, Y. Tan, Q. Xie and S. Yao, ACS Appl. Mater. Interfaces, 2017, 9, 24440–24445 CrossRef CAS
.
- I. Z. Luna, L. N. Hilary, A. M. S. Chowdhury, M. A. Gafur, N. Khan and R. A. Khan, OALib, 2015, 02, 1–8 CrossRef
.
- I. Markova-Deneva, J. Univ. Chem. Technol. Metall., 2010, 45, 351–378 CAS
.
- M. Abbasi, T. Noor, N. Iqbal and N. Zaman, Int. J. Energy Res., 2022, 46, 13915–13930 CrossRef CAS
.
- S. Gopi, A. M. Al-Mohaimeed, W. A. Al-onazi, M. Soliman Elshikh and K. Yun, J. King Saud Univ., Sci., 2021, 33, 101379 CrossRef
.
- G. Guo, J. Mater. Sci.: Mater. Electron., 2021, 32, 16287–16301 CrossRef CAS
.
- R. Liang, L. Shen, F. Jing, W. Wu, N. Qin, R. Lin and L. Wu, Appl. Catal., B, 2015, 162, 245–251 CrossRef CAS
.
- Z. Z. Ma, Y. S. Wang, B. Liu, H. Jiao and L. Xu, Chemosensors, 2022, 10, 416 CrossRef CAS
.
- Z. Li, D. Ren, Z. Wang, S. Jiang, S. Zhang, X. Zhang and W. Chen, Water Sci. Technol., 2022, 86, 80–94 CrossRef CAS
.
- J. Yang, C. Zheng, P. Xiong, Y. Li and M. Wei, J. Mater. Chem. A, 2014, 2, 19005–19010 RSC
.
- M. A. Moreira, M. P. S. Santos, C. G. Silva, J. M. Loureiro, J. S. Chang, C. Serre, A. F. P. Ferreira and A. E. Rodrigues, Adsorption, 2018, 24, 715–724 CrossRef CAS
.
- M. Amiri, Z. Tofighi, A. Khodayari, A. Bezaatpour, S. Sohrabnezhad, V. Mishyn, R. Boukherroub and S. Szunerits, Appl. Organomet. Chem., 2020, 34, 1–10 CrossRef
.
- F. Ming, J. Hou, D. Huo, J. Zhou, M. Yang, C. Shen, S. Zhang and C. Hou, Anal. Methods, 2019, 11, 4382–4389 RSC
.
- M. T. Al-helaly and N. A. Al-Tememee, J. Kufa phys., 2021, 13(1), 33–42 CrossRef
.
- A. Eslami, N. M. Juibari, S. G. Hosseini and M. Abbasi, Cent. Eur. J. Energ. Mater., 2017, 14, 152–168 CrossRef CAS
.
- H. Fan, F. Bahmani, Y. V. Kaneti, Y. Guo, A. A. Alothman, X. Wu, Y. Yamauchi, W. Li and J. Zhang, Chem.–Eur. J., 2020, 26, 13652–13658 CrossRef CAS
.
- C. Zhang, H. Wang, Y. Nie, W. Yu and J. Yan, Funct. Mater. Lett., 2020, 13(6), 2050029 CrossRef CAS
.
- D. Acharyya, K. Y. Huang, P. P. Chattopadhyay, M. S. Ho, H. J. Fecht and P. Bhattacharyya, Analyst, 2016, 141, 2977–2989 RSC
.
- A. C. Vilbert, Y. Liu, H. Dai and Y. Lu, Curr. Opin. Electrochem., 2021, 30, 100780 CrossRef CAS
.
- Y. Wu, Q. Hou, F. Li, Y. Sang, M. Hao, X. Tang, F. Qiu and H. Zhang, Catalysts, 2023, 13(7), 1118 CrossRef CAS
.
- K. Bergamaski, A. L. N. Pinheiro, E. Teixeira-Neto and F. C. Nart, J. Phys. Chem. B, 2006, 110, 19271–19279 CrossRef CAS
.
- A. Zaher, W. M. A. El Rouby and N. A. M. Barakat, Fuel, 2020, 280, 118654 CrossRef CAS
.
- S. Shahrokhian and S. Rezaee, Electrochim. Acta, 2018, 259, 36–47 CrossRef CAS
.
- K. J. Vetter and S. Barnatt, J. Electrochem. Soc., 1968, 115, 262 CrossRef
.
- W. Wang, Y. Li and H. Wang, Micro Nano Lett., 2013, 8, 23–26 CrossRef CAS
.
- D. Escalera-López, Y. Niu, J. Yin, K. Cooke, N. V. Rees and R. E. Palmer, ACS Catal., 2016, 6, 6008–6017 CrossRef
.
- C. C. L. McCrory, S. Jung, I. M. Ferrer, S. M. Chatman, J. C. Peters and T. F. Jaramillo, J. Am. Chem. Soc., 2015, 137, 4347–4357 CrossRef CAS
.
- J. Li, Y. Zuo, J. Liu, X. Wang, X. Yu, R. Du, T. Zhang, M. F. Infante-Carrió, P. Tang, J. Arbiol, J. Llorca, Z. Luo and A. Cabot, J. Mater. Chem. A, 2019, 7, 22036–22043 RSC
.
- N. Wang, S. Liang, L. Zhang, P. Cao, L. Xu and M. Lin, Colloids Surf., A, 2020, 603, 125199 CrossRef CAS
.
- J. Ma, X. Wang, Z. Chu, J. Zhang, P. Du, Q. Zhang, F. Cao and J. Liu, ChemCatChem, 2021, 13, 4824–4832 CrossRef CAS
.
- Y. Wang, C. Liu, J. Xiang, L. Xing, X. Ou, S. Chen, X. Xue, F. Yu and R. Li, Int. J. Electrochem. Sci., 2016, 14, 5247–5258 CrossRef
.
- C. Eßbach, I. Senkovska, T. Unmüssig, A. Fischer and S. Kaskel, ACS Appl. Mater. Interfaces, 2019, 11, 20915–20922 CrossRef
.
- W. Tu and Y. H. Chin, J. Catal., 2014, 313, 55–69 CrossRef CAS
.
- A. Brunetti, M. Migliori, D. Cozza, E. Catizzone, G. Giordano and G. Barbieri, ACS Sustainable Chem. Eng., 2020, 8, 10471–10479 CrossRef CAS
.
- T. Noor, M. Mohtashim, N. Iqbal, S. Raza, N. Zaman, L. Rasheed and M. Yousuf, J. Electroanal. Chem., 2021, 890, 115249 CrossRef CAS
.
Footnote |
| † Electronic supplementary information (ESI) available. See DOI: https://doi.org/10.1039/d4ra04902k |
| This journal is © The Royal Society of Chemistry 2024 |

