 Open Access Article
First-principles calculations to investigate the impact of fluorine doping on electrochemical properties of Li-rich Li2MnO3 layered cathode materials
Xiang-Ming Zengabc,
Jing Liud,
Jiang-Bin Suab,
Fa-Hui Wangab,
Yan-Bing Liab,
Chang-Jun Zhanab,
Ming Liuab,
Run-Sheng Wuabc,
Jun-Ping Hu e and
Feng Zheng
 *f
*f
aSchool of New Energy Science and Engineering, Xinyu University, Xinyu 338004, China
bJiangxi Provincial Key Laboratory of Power Batteries & Energy Storage Materials, Xinyu University, Xinyu 338004, China
cJiangxi Lithium Battery New Material Industry Technology Institute, Jiangxi Yingxing Lithium Battery New Materials Industrial Technology Institute Co., Ltd, Xinyu 338004, China
dLibrary, Xinyu University, Xinyu 338004, China
eNanchang Key Laboratory of Photoelectric Conversion and Energy Storage Materials, Nanchang Institute of Technology, Nanchang 330099, China
fSchool of Science, Jimei University, Xiamen 361021, China. E-mail: fzheng@jmu.edu.cn
First published on 22nd August 2024
Abstract
Li-rich layered oxides are promising candidates for high-capacity Li-ion battery cathode materials. In this study, we employ first-principles calculations to investigate the effect of F doping on Li-rich Li2MnO3 layered cathode materials. Our findings reveal that both Li2MnO3 and Li2MnO2.75F0.25 exhibit significant volume changes (greater than 10%) during deep delithiation, which could hinder the cycling of more Li ions from these two materials. For Li2MnO3, it is observed that oxygen ions lose electrons to compensate for charge during the delithiation process, leading to a relatively high voltage plateau. After F doping, oxidation occurs in both the cationic (Mn) and anionic (O) components, resulting in a lower voltage plateau at the beginning of the charge, which can be attributed to the oxidation of Mn3+ to Mn4+. Additionally, F doping can somewhat suppress the release of oxygen in Li2MnO3, improving the stability of anionic oxidation. However, the increase of the activation barriers for Li diffusion can be observed after F doping, due to stronger electrostatic interactions between F− and Li+, which adversely affects the cycling kinetics of Li2MnO2.75F0.25. This study enhances our understanding of the impact of F doping in Li2MnO3 based on theoretical calculations.
1. Introduction
Li-ion batteries (LIBs) are extensively used in portable devices for their long cycle life, safety and high energy density.1 However, entering new areas, like electric vehicles market, demands LIBs with higher energy density.2–4 Cathode materials, a key component of LIBs, are seen as a significant bottleneck in developing high-energy-density LIBs.5 Current transitional cathodes, such as LiCoO2 and LiFePO4, are approaching their theoretical limits. Consequently, the need for new cathode materials with higher energy density has become more urgent than ever. Recently, Li-rich oxides have emerged as a promising solution to achieve this goal.6,7 Thanks to cumulative cationic and anionic redox reactions, these materials can achieve capacities exceeding 250 mA h g−1.8–10 Nevertheless, these materials have drawbacks such as significant voltage decay,10,11 voltage hysteresis,12,13 poor rate capability,14 and capacity loss15 during cycling, due to the structural transformation of host materials during the oxygen redox.10,12,13 Therefore, numerous measures have been implemented to improve their structural stability.15–17Elemental doping is regarded as a viable strategy to enhance the electrochemical properties of Li-rich oxides. For instance, Wang et al. showed that F-doping Li[Li0.133Mn0.467Ni0.2Co0.2]O2 suppresses voltage decay and enhances capacity retention compared to its undoped counterpart.18 Additionally, Vanaphuti et al. demonstrated that co-doping Na and F into Li-rich Mn-base oxides improves structural stability and mitigates oxygen loss.19 Mao et al. also proposed an effective, straightforward, and scalable co-doping strategy with trace amounts of Fe and F to enhance the rate capability and cycling performance of high-Ni Li-rich layered oxides.20 These results show that F is a significant anion in the elemental doping of Li-rich materials. However, most studies focus on experimental analysis to highlight the key role of F doping in performance enhancement. There is a lack of exploration into the underlying mechanisms of F doping's effect on the electrochemical properties of Li-rich materials through theoretical calculations. In this study, using first-principles calculations, we investigate the impact of F doping on the electrochemical performance of Li-rich Li2MnO3, including voltage profile, redox reaction, structural stability, and ionic conductivity. Our results deepen the understanding of F doping's role in Li-rich materials.
2. Computational methods
The present calculations are carried out by using the projector-augmented wave (PAW)21 representations within density functional theory (DFT) as implemented in the Vienna Ab initio Simulation Package (VASP).22,23 The exchange and correlation energy is treated within the spin-polarized generalized gradient approximation (GGA) and parameterized by Perdew–Burke–Ernzerhof formula (PBE).24 The effects due to the localization of the d electrons of the transition metal ions were taken into account with the GGA + U approach of Dudarev et al.25 An effective single parameter U–J of 5.0 eV is used for Mn, which has been proved to be a good approximation in Mn-based compounds.26,27 Wave functions are expanded in plane waves up to a kinetic energy cut-off of 550 eV. Brillouin-zone integrations are approximated by using special k-point sampling of Monkhorst–Pack scheme28 with a k-point mesh resolution of 2π × 0.03 Å−1. Lattice vectors together with the atomic coordinates were fully relaxed until the force on each atom is less than 0.01 eV Å−1.The relative stability of LixHost polymorphs at each Li composition x was evaluated by
 | (1) |
The average voltage (V) versus Li/Li+ was calculated as
 | (2) |
The reaction energy associated with the formation of oxygen vacancy in Li2MnO3 and Li2MnO2.75F0.25 was calculated by
 | (3) |
 | (4) |
The total energy of a single oxygen molecule (E(O2)) was calculated in a 20 × 20 × 20 Å periodic box, and the correction proposed by Ceder et al.29 was then added to E(O2).
The activation barriers for the Li migration in Li2MnO3 and Li2MnO2.75F0.25 were calculated using the climbing nudged elastic band (NEB) method30 in a 2 × 1 × 2 supercell containing 16 formula units. For the NEB calculations, the standard GGA functional was employed, and the lattice constants of a given structure were fixed as their equilibrium values, with all the internal degrees of freedom fully relaxed.
3. Results and discussion
3.1 Effect of F-doping on the voltage profile and volume change of Li2MnO3
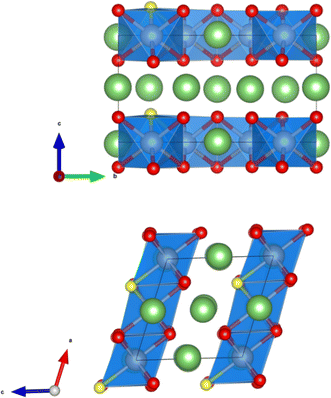
The crystal structure of Li2MnO3 considered in this study has a monoclinic symmetry with C2/m space group and includes 12 O atoms at 4i and 8j sites in the unit cell. We replace one of the O atoms with F (substituting O at 8j site is more stable) to construct F-doped Li2MnO2.75F0.25 structure as shown in Fig. 1. The increase in volume following F doping is shown in Table 1, which indicates a 2.38% volume expansion. We also examined the impact of F-doping on the voltage profile of Li2MnO3. To calculate the theoretical voltage, the formation energies of delithiated structures were first investigated based on the eqn (1). For LixMnO3, all possible Li distributions are considered, as shown in Fig. 2(a). The lowest energy LixMnO3 compounds were then used to replace O with F to construct F-doped LixMnO2.75F0.25, and their formation energies were calculated, as shown in Fig. 2(b). The delithiated structures that lie on the convex hull indicated stable intermediate phases. For Li2MnO3, two stable intermediate phases, Li0.5MnO3 and Li0.125MnO3, are found, which is consistent with previous work.31 For the F-doped Li2MnO2.75F0.25, the phases of Li1.75MnO2.75F0.25, Li0.5MnO2.75F0.25 and Li0.125MnO2.75F0.25 lie on the convex hull. Our calculated results show that these three stable delithiated LixMnO2.75F0.25 compounds all have F substituting the O 8j sites. Using these stable phases, we calculated the theoretical average voltages for Li2MnO3 and Li2MnO2.75F0.25 using eqn (2), as shown in Fig. 2(c). For Li2MnO3, a long voltage plateau at around 4.41 V is observed, which aligns well with experimental results.32 When more Li ions were extracted (0.5 > x > 0), two higher voltage plateaus at 5.52 and 5.69 V appear. After F-doping, a short plateau (2.0 > x > 1.75) is observed, corresponding to a lower voltage of 3.50 V. As more Li ions were extracted, a long plateau can be seen at 4.39 V, followed by two higher plateaus between x = 0.5 and x = 0. We will discuss the changes in oxidation potential between Li2MnO3 and Li2MnO2.75F0.25 during delithiation later in this paper.| a, b, c (Å) | β (°) | V (Å3 per f.u.) | |
|---|---|---|---|
| Li2MnO3 | 5.01, 8.66, 5.08 | 109.48 | 51.99 |
| Li2MnO2.75F0.25 | 5.04, 8.80, 5.09 | 109.12 | 53.23 |
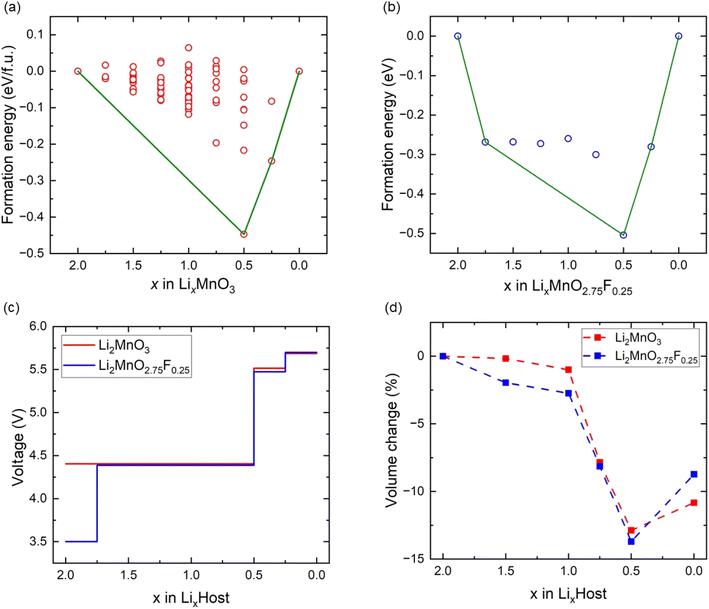 | ||
| Fig. 2 The formation energies (a) Li2MnO3 and (b) Li2MnO2.75F0.25. (c) The voltage profiles of Li2MnO3 and Li2MnO2.75F0.25. (d) The volume change of Li2MnO3 and Li2MnO2.75F0.25. | ||
We also investigated the volume changes of Li2MnO3 and Li2MO2.75F0.25 during delithiation, as shown in Fig. 2(d). For the first Li extraction, the volume changes of Li2MnO3 and Li2MnO2.75F0.25 are −1.1% and −2.7%, respectively. With further Li extraction (Li0.5MnO3 and Li0.5MnO2.75F0.25), the calculated volume changes are −12.8% and −13.7%. Such substantial volume change could hinder the cycling of more Li ions from Li2MnO3 and Li2MnO2.75F0.25, which suggests their structural instability upon deep delithiation.
3.2 Effect of F-doping on oxidation of Li2MnO3
Fig. 3(a) shows the calculated projected density of states (PDOS) for LixMnO3, indicating that Li2MnO3 is a semiconductor with a band gas of ∼1.32 eV. The valence band maximum is dominated by O 2p non-bonding states, attributed to a Li–O–Li configuration in the Li2MnO3 structure.8 As Li ions are extracted, the Fermi level shifts towards lower energy, leading to the gradual extraction of electrons from non-bonding O 2p states. Therefore, the observed voltage plateaus of 4.41, 5.52 and 5.69 V for Li2MnO3 (Fig. 2(c)) all correspond to oxygen oxidation. These results are consistent with the calculated magnetic moments for Li2MnO3 (Fig. 4(a) and (b)). In Li2MnO3 (4 Mn atoms and 12 O atoms per unit cell), all four Mn atoms display a magnetic moment of approximately 3.0, indicative of a valence state of +4 (3d3, high-spin state e0gt32g) as depicted in Fig. 4(c). Upon Li ion extraction, the magnetic moment of Mn remains almost unchanged, suggesting that Mn does not participate in oxidation. As illustrated in Fig. 4(b), all 12 O atoms in Li2MnO3 exhibit a magnetic moment of approximately 0, indicating a pristine valence state of −2 for O. During the delithiation process, the magnetic moment of O increases, indicating oxygen oxidation.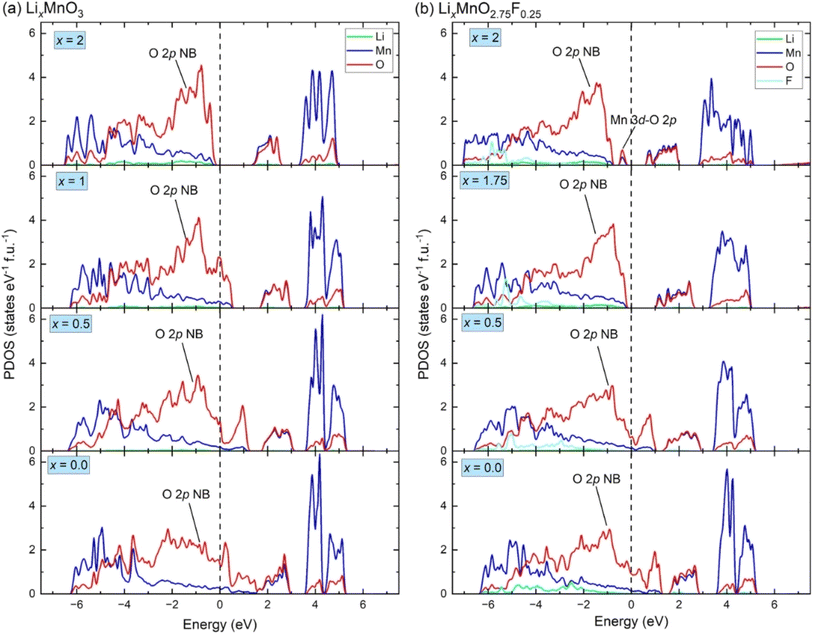 | ||
| Fig. 3 The density of states for (a) LixMnO3 and (b) LixMnO2.75F0.25. The non-bonding O 2p states is denoted as “O 2p NB”, the hybridized Mn 3d–O 2p states is denoted as “Mn 3d–O 2p”. | ||
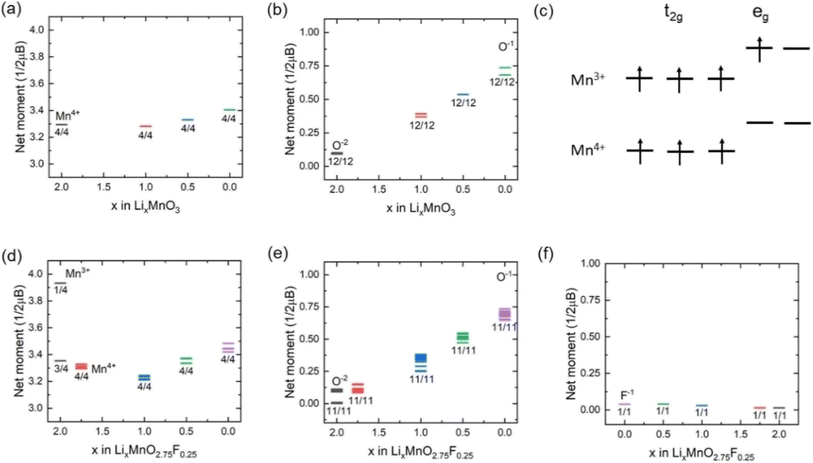 | ||
| Fig. 4 Magnetic moment variation of (a) Mn and (b) O in Li2MnO3. (c) Schematic diagrams of Mn3+ and Mn4+. Corresponding magnetic moment variation of (d) Mn, (e) O and (f) F in Li2MnO2.75F0.25. | ||
In F-doped Li2MnO2.75F0.25, the valence band maximum is dominated by hybridized Mn 3d–O 2p states, as shown in Fig. 3(b). During delithiation from Li2MnO2.75F0.25 to Li1.75MnO2.75F0.25, the hybridized Mn 3d–O 2p states shift to higher energy (above Fermi level), indicating that Mn atoms lose electrons to maintain charge balance. This observation aligns with the magnetic moment calculations depicted in Fig. 4(d). In Li2MnO2.75F0.25, one of the four Mn atoms exhibits a magnetic moment of about 4.0, indicative of a valence state of +3 (3d4, high-spin state e1gt32g) as shown in Fig. 4(c). At x = 1.75, oxidation from Mn3+ to Mn4+ occurs. Consequently, a lower voltage plateau of 3.50 V is observed between Li2MnO2.75F0.25 and Li1.75MnO2.75F0.25, as illustrated in Fig. 2(c). With further delithiation (x < 1.75), non-bonding O 2p states begin to be extracted, as seen in Fig. 3(b) and 4(e), indicating electron loss from oxygen ions. The oxygen oxidation process occurring in Li2MnO2.75F0.25 exhibits parallels to that observed in Li2MnO3, resulting in similar voltage plateaus at x < 1.75 (Fig. 2(c)). The magnetic moment of F remains close to 0 in Li2MnO2.75F0.25 upon delithiation, showing that F does not participate in oxidation, as depicted in Fig. 4(f).
We also investigated the effect of F doping on the stability of oxygen redox in LixMnO3, particularly concerning the formation of O vacancy (ΔE). As shown in Fig. 5, the ΔE values decrease monotonically with the reduction in Li concentration, suggesting a downward trend in stability of LixMnO3 as x decrease. The ΔE values become negative at x = 1.5, indicating that the oxygen release reaction occurs spontaneously in delithiated Li1.5MnO3, which is agreed well with previous calculations.33 Compared to Li2MnO3, smaller values of ΔE can be observed in Li2MnO2.75F0.25 at x < 1.0, suggesting that F doping can somewhat suppress oxygen release. This phenomenon can be attributed to the F doping inducting a minor fraction of Mn to undergo oxidation, which in turn attenuate the oxidation of oxygen and enhances its stability.
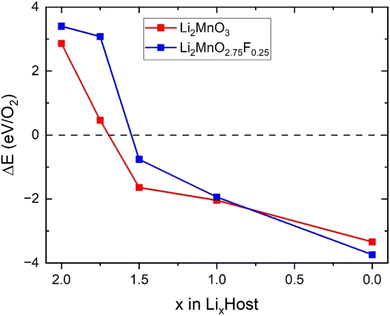 | ||
| Fig. 5 Calculated formation energy for the reaction of O2 in Li2MnO3 and Li2MnO2.75F0.25 during delithiation. | ||
Since cation migration is recognized as a leading cause of voltage decay and hysteresis,10–13 we investigated the effect of F-doping on Mn migration during deep charge. First, we constructed a 2 × 1 × 2 supercell with 16 formula units and moved one Mn ion to the Li layer in the deeply delithiated state Li0.5MnO3. After structural optimization, we found that O–O dimers form in this Li0.5MnO3 with Mn migration, resulting in lower energy compared to pristine Li0.5MnO3 (ΔE = 67 meV per atom). This suggests that the deep oxygen oxidation leads to O–O dimer formation and Mn migration, consistent with previous calculations.34 When considering F doping, Mn migration and O–O dimer formation also occur, with the energy of the migrated Mn structure being lower (∼70 meV per atom) than that of pristine Li0.5MnO2.75F0.25. These calculated results indicate that F-doping cannot suppress Mn migration at deep charge.
3.3 Effect of F-doping on ionic diffusion
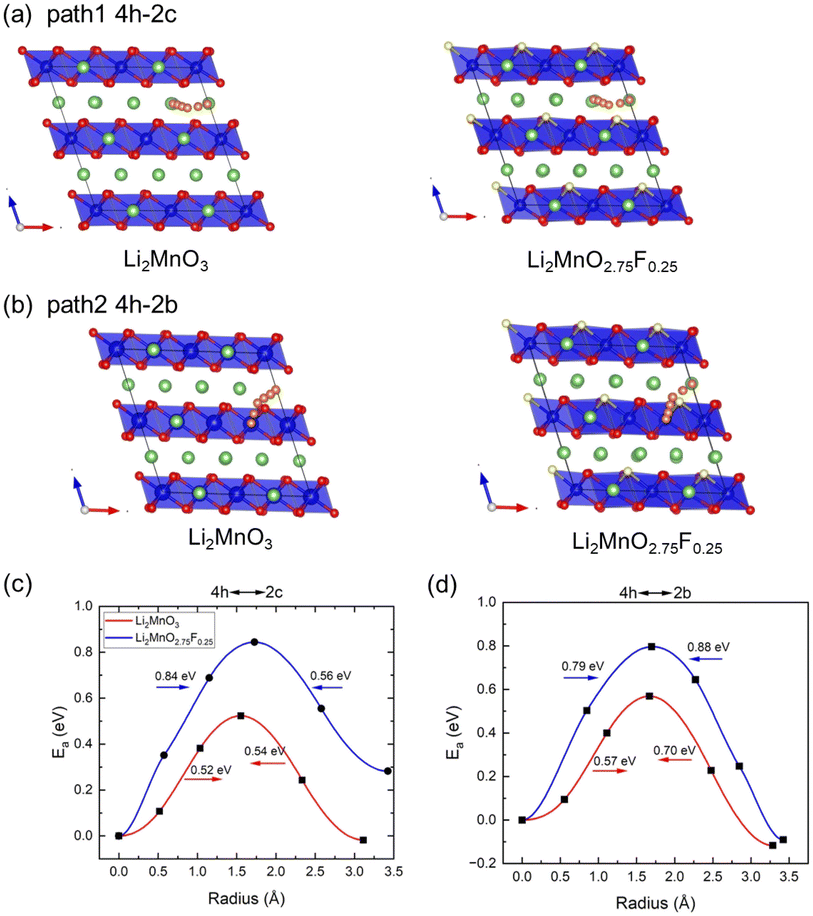
Climbing NEB calculations were used to investigate Li diffusion in Li2MnO3 and Li2MnO2.75F0.25, assessing the impact of F-doping on diffusion kinetics. Previous calculations identified two types of Li+ migration between the neighboring Li and LiMn2 layers, and three pathways within Li layers.33 We selected two of these pathways to study the effect of F-doping on ionic diffusion: path 1 involves Li+ migration from the 4h site to the 2c site in the Li planes (Fig. 6(a)), and path 2 involves Li+ migration from the 4h site to the 2b site from Li to LiMn2 layers (Fig. 6(b)). The calculated activation barriers (Ea) along these paths are shown in Fig. 6(c) and (d). For Li2MnO3, we observed that the energy barriers for Li diffusion between the 4h site and 2c site are 0.52 and 0.54 eV, aligning well with previous calculations (0.54 and 0.61 eV).33 For Li hoping between the 4h site and 2b site, the barriers are 0.57 and 0.70 eV, also consistent with Xiao et al.'s calculations.33 However, after F-doping, the barriers of both paths change significantly. Here, F-doping is modeled by substituting the O site near the Li hoping trajectory (Fig. 6(a) and (b)). Although the model is not exhaustive, it provides insights into the effect of F-doping on Li diffusion. As shown in Fig. 6(c) and (d), the path lengths of two pathways are increased after F doping, and Ea increases in both paths after F-doping due to the stronger interaction between F− and Li+. The diffusion coefficients of these pathways can be estimated according to D = d2υ![[thin space (1/6-em)]](https://www.rsc.org/images/entities/char_2009.gif) exp(−Ea/kbT) (υ = 1013 THz, T = 300 K, and d is the hopping distance)35 as shown in Table 2. Consequently, F-doping leads to a deterioration in the kinetics of Li2MnO3.
exp(−Ea/kbT) (υ = 1013 THz, T = 300 K, and d is the hopping distance)35 as shown in Table 2. Consequently, F-doping leads to a deterioration in the kinetics of Li2MnO3.
| Structure | Ea (eV) | D300 K (cm2 s−1) |
|---|---|---|
| Li2MnO3 | 0.52/0.54/0.57/0.70 | 10−11/10−11/10−12/10−14 |
| Li2MnO2.75F0.25 | 0.84/0.56/0.79/0.88 | 10−16/10−12/10−15/10−17 |
4. Conclusions
Using the first-principles calculations, we conduct a comprehensive study on the impact of F-doping on the electrochemical performance of Li2MnO3. Our results indicate that both Li2MnO3 and its F-doped variant, Li2MnO2.75F0.25, undergo significant volume changes (over 10%) during deep delithiation, which could impede more Li ions cycling of them. Analysis of the electronic structure and magnetic moments in the delithiated states reveals that charge compensation in Li2MnO3 primarily involves the oxidation of O2− anions. After F doping, both cationic (Mn) and anionic (O) oxidation are observed in Li2MnO2.75F0.25, contributing to a lower voltage plateau at the beginning of charge due to the oxidation of Mn3+ to Mn4+, which can somewhat mitigate oxygen release. Additionally, F doping appears to impair Li diffusion kinetics in comparison to pristine Li2MnO3, owing to enhanced interactions between F− and Li+. Our findings offer a deeper insight into the effect of F-doping on the electrochemical properties of Li2MnO3 and provide strategic guidance for future optimization of this high-capacity cathode material.Data availability
We confirm that the data supporting the finding of this study are available within the main article.Author contributions
Xiang-Ming Zeng: conceptualization, investigation, formal analysis, writing – original draft, writing – review & editing; Jing Liu: methodology, formal analysis; Jiang-Bin Su: formal analysis, investigation; Fa-Hui Wang, conceptualization, investigation, formal analysis; Yan-Bing Li: methodology; Chang-Jun Zhang: conceptualization; Ming Liu: methodology; Run-Sheng Wu: formal analysis, investigation; Jun-Ping Hu: methodology; Feng Zheng: methodology; investigation, writing – review & editing; supervision.Conflicts of interest
There are no conflicts to declare.Acknowledgements
The work at Xinyu University was supported by the Foundation of Jiangxi Province Educational Committee, China (Grant No. GJJ202317) and the Ministry of Education Collaborative Education Project for Industry-University Cooperation (Grant No. 231103117091418). The work at Jimei University was supported by the Natural Science Foundation of Xiamen, China (Grant No. 3502Z202372015), the Fujian Provincial Education Department, China (Grant No. JZ230025) and the Research Foundation of Jimei University (Grant No. ZQ2023013).References
- J. B. Goodenough and K.-S. Park, J. Am. Chem. Soc., 2013, 135, 1167–1176 Search PubMed.
- M. Sathiya, G. Rousse, K. Ramesha, C. Laisa, H. Vezin, M. T. Sougrati, M.-L. Doublet, D. Foix, D. Gonbeau and W. Walker, Nat. Mater., 2013, 12, 827–835 CrossRef CAS PubMed.
- J. Lee, A. Urban, X. Li, D. Su, G. Hautier and G. Ceder, Science, 2014, 343, 519–522 CrossRef CAS PubMed.
- K. G. Gallagher, S. Goebel, T. Greszler, M. Mathias, W. Oelerich, D. Eroglu and V. Srinivasan, Energy Environ. Sci., 2014, 7, 1555–1563 RSC.
- M. S. Whittingham, Chem. Rev., 2004, 104, 4271–4302 Search PubMed.
- M. M. Thackeray, C. S. Johnson, J. T. Vaughey, N. Li and S. A. Hackney, J. Mater. Chem., 2005, 15, 2257–2267 RSC.
- T. Ohzuku, M. Nagayama, K. Tsuji and K. Ariyoshi, J. Mater. Chem., 2011, 21, 10179–10188 RSC.
- D. H. Seo, J. Lee, A. Urban, R. Malik, S. Kang and G. Ceder, Nat. Chem., 2016, 8, 692–697 CrossRef CAS PubMed.
- W. He, W. Guo, H. Wu, L. Lin, Q. Liu, X. Han, Q. Xie, P. Liu, H. Zheng and L. Wang, Adv. Mater., 2021, 33, 2005937 CrossRef CAS PubMed.
- F. Zheng, S. Y. Zheng, P. Zhang, X. F. Zhang, S. Q. Wu, Y. Yang and Z. Z. Zhu, J. Phys. Chem. C, 2019, 123, 13491–13499 CrossRef CAS.
- G. Assat and J.-M. Tarascon, Nat. Energy, 2018, 3, 373–386 CrossRef CAS.
- R. A. House, G. J. Rees, M. A. Pérez-Osorio, J.-J. Marie, E. Boivin, A. W. Robertson, A. Nag, M. Garcia-Fernandez, K.-J. Zhou and P. G. Bruce, Nat. Energy, 2020, 5, 777–785 CrossRef CAS.
- R. A. House, J.-J. Marie, M. A. Pérez-Osorio, G. J. Rees, E. Boivin and P. G. Bruce, Nat. Energy, 2021, 6, 781–789 CrossRef CAS.
- S. Hu, A. S. Pillai, G. Liang, W. K. Pang, H. Wang, Q. Li and Z. Guo, Electrochem. Energy Rev., 2019, 2, 277–311 CrossRef CAS.
- E. Wang, D. Xiao, T. Wu, X. Liu, Y. Zhou, B. Wang, T. Lin, X. Zhang and H. Yu, Adv. Funct. Mater., 2022, 32, 2201744 CrossRef CAS.
- L. Zeng, H. Liang, B. Qiu, Z. Shi, S. Cheng, K. Shi, Q. Liu and Z. Liu, Adv. Funct. Mater., 2023, 33, 2213260 CrossRef CAS.
- J. Huang, B. Ouyang, Y. Zhang, L. Yin, D.-H. Kwon, Z. Cai, Z. Lun, G. Zeng, M. Balasubramanian and G. Ceder, Nat. Mater., 2023, 22, 353–361 CrossRef CAS PubMed.
- Y. Wang, H.-T. Gu, J.-H. Song, Z.-H. Feng, X.-B. Zhou, Y.-N. Zhou, K. Wang and J.-Y. Xie, J. Phys. Chem. C, 2018, 122, 27836–27842 CrossRef CAS.
- P. Vanaphuti, J. Bai, L. Ma, S. Ehrlich, K. Kisslinger, F. Wang and Y. Wang, Energy Storage Mater., 2020, 31, 459–469 CrossRef.
- D. Mao, X. Tan, Z. Fan, L. Song, Y. Zhang, P. Zhang, S. Su, G. Liu, H. Wang and W. Chu, ACS Appl. Mater. Interfaces, 2023, 15, 10774–10784 CrossRef CAS PubMed.
- G. Kresse and D. Joubert, Phys. Rev. B: Condens. Matter Mater. Phys., 1999, 59, 1758–1775 CrossRef CAS.
- G. Kresse and J. Furthmuller, Phys. Rev. B: Condens. Matter Mater. Phys., 1996, 54, 11169–11186 CrossRef CAS PubMed.
- G. Kresse and J. Furthmuller, Comput. Mater. Sci., 1996, 6, 15–50 CrossRef CAS.
- J. P. Perdew, K. Burke and M. Ernzerhof, Phys. Rev. Lett., 1996, 77, 3865–3868 CrossRef CAS PubMed.
- S. L. Dudarev, G. A. Botton, S. Y. Savrasov, C. J. Humphreys and A. P. Sutton, Phys. Rev. B: Condens. Matter Mater. Phys., 1998, 57, 1505–1509 CrossRef CAS.
- F. Zhou, M. Cococcioni, C. A. Marianetti, D. Morgan and G. Ceder, Phys. Rev. B: Condens. Matter Mater. Phys., 2004, 70, 235121 CrossRef.
- Y. Koyama, I. Tanaka, M. Nagao and R. Kanno, J. Power Sources, 2009, 189, 798–801 CrossRef CAS.
- H. J. Monkhorst and J. D. Pack, Phys. Rev. B: Solid State, 1976, 13, 5188–5192 CrossRef.
- L. Wang, T. Maxisch and G. Ceder, Phys. Rev. B: Condens. Matter Mater. Phys., 2006, 73, 195107 CrossRef.
- G. Henkelman, B. P. Uberuaga and H. Jónsson, J. Chem. Phys., 2000, 113, 9901–9904 CrossRef CAS.
- X. Zhang, F. Zheng, S. Wu and Z. Zhu, Phys. Chem. Chem. Phys., 2021, 23, 4829–4834 RSC.
- Y. Xiang and X. Wu, Ionics, 2018, 24, 83–89 CrossRef CAS.
- R. J. Xiao, H. Li and L. Q. Chen, Chem. Mater., 2012, 24, 4242–4251 CrossRef CAS.
- H. Chen and M. S. Islam, Chem. Mater., 2016, 28, 6656–6663 CrossRef CAS.
- R. Kutner, Phys. Lett. A, 1981, 81, 239–240 CrossRef.
| This journal is © The Royal Society of Chemistry 2024 |

