DOI:
10.1039/D4RA04997G
(Paper)
RSC Adv., 2024,
14, 31704-31722
Mixed-ligand copper(II)-diimine complexes of 3-formylchromone-N4-phenyl thiosemicarbazone: 5,6-dmp co-ligand confers enhanced cytotoxicity†
Received
10th July 2024
, Accepted 22nd September 2024
First published on 7th October 2024
Abstract
The promising biological applications of thiosemicarbazone derivatives have inspired the design, synthesis, and study of their Cu(II) complexes for anticancer therapeutic applications. Herein, we have evaluated the DNA/protein binding, DNA cleaving, and cytotoxic properties of four mixed-ligand Cu(II) complexes of the type [Cu(L)(diimine)](NO3) 1–4, where HL is 4-oxo-4H-chromene-3-carbaldehyde-4(N)-phenylthiosemicarbazone and diimine is 2,2′-bipyridine (bpy, 1) 1,10-phenanthroline (phen, 2), 5,6-dimethyl-1,10-phenanthroline (5,6-dmp, 3), or dipyrido-[3,2-f:2′,3′-h]-quinoxaline (dpq, 4). Interestingly, complex 3 with higher lipophilicity shows stronger DNA binding and oxidative DNA cleavage, higher ROS production, and more reversible redox behaviour, resulting in its remarkable cytotoxicity (IC50, 1.26 μM) against HeLa cervical cancer cells, and rendering it 5 times more potent than the widely used drug cisplatin. The same complex induces enhanced apoptotic cell death on HeLa cells but lower toxicity towards the non-cancerous PBMC cells. Molecular docking studies suggest that all the complexes bind in the minor groove of DNA and subdomain II of HSA, which is in close agreement with the experimental results. Also, 3 shows cytotoxicity higher than the analogous mixed ligand Cu(II) complexes, reported already, emphasizing the importance of co-ligand in tuning the anticancer activity.
Introduction
In very recent years, thiosemicarbazone (TSC) derivatives and their metal complexes have gained much attention because of their wide range of therapeutic uses, such as antimicrobial, antimalarial, and anticancer agents.1–3 The anticancer activity of TSCs is mainly due to their interference with the cell cycle progression, inhibition of cancer cell growth,4–7 generation of reactive oxygen species (ROS), and deactivation of ribonucleotide reductase (RR).8 Despite their promising applications, a significant drawback is the high toxicity of TSCs observed in clinical trials.9–11 Certain transition metals, particularly copper(II) and iron(II), exhibit synergistic interactions with TSC ligands, enhancing the bioactivity or conferring new bioactivity on the complexes.12–14 Copper(II) is highlighted because of its biocompatibility and redox-active properties under physiological conditions,15,16 leading to an elevated intracellular ROS production and, consequently, altering redox homeostasis inside cancer cells.17 Due to their biological and pharmacological features, copper(II) complexes have garnered much interest for development as potential anticancer agents.18–20 To date, many research groups have reported the anticancer activity of TSC derivatives and their copper(II) complexes.21–24 The anticancer activities of Cu(II)-TSCs mainly stem from their redox potentials that are easily accessible by cellular oxidants and reductants,25 and inhibition of topoisomerase IIα (Topo-IIα),26–28 and ribonucleotide reductase (RR) enzymes.23,24,29 Despite the higher cytotoxicity of several TSCs and their copper(II) complexes reported so far, the origin of their cytotoxicity has not been fully understood because different TSCs have shown different types of action. Also, none of the copper-based therapeutics (CBT) has emerged as drugs for humans. Thus, the design and investigation of anticancer activities of different Cu(II)-TSCs have drawn considerable attention from medicinal inorganic chemists. Very recently, our research group has synthesised a series of mixed ligand Cu(II) complexes of the type [Cu(L)(diimine)](ClO4), where HL is 2-formylpyridine-N4-phenylthiosemicarbazone and diimine is 2,2′-bipyridine, 4,4′-dimethyl-2,2′-bipyridine, 1,10-phenanthroline, 5,6-dimethyl-1,10-phenanathroline, 3,4,7,8-tetramethyl-1,10-phenanthroline and dipyrido-[3,2-f:2′,3′-h]quinoxaline, and examined30 their cytotoxicity in HeLa cervical cancer cells. Remarkably, the bpy and 5,6-dmp complexes have demonstrated phenomenal cytotoxicity with IC50 values of 7.0 and 13.57 nM, respectively, at 48 h in HeLa cervical cancer cells and they are less toxic to HEK293 normal cells.30 This finding augmented our interest in the design and synthesis of new types of mixed ligand copper(II) complexes by replacing pyridyl moieties in these complexes with different biologically relevant moieties like chromones.
The chromones are heterocyclic compounds that contain oxygen and also have a benzoannelated γ-pyrone ring, a rational scaffold in several pharmaceuticals.31,32 They show numerous pharmacological characteristics, including anti-inflammatory, antibacterial, anticancer, antioxidant, anti-HIV, vasodilator, antiviral, and antiallergenic properties.8,33 The high degree of variability these chromone compounds exhibit regarding their pharmacological activity and structural changes has been proven to help design new therapeutic medicines.34 The Schiff bases produced from 3-formylchromone, in particular and their transition metal complexes, have shown the best anti-thymidine phosphorylase inhibitory, antifungal, and antioxidant actions.35–37 Cancer-targeted drugs to chromone-based heterocyclic compounds that can inhibit a variety of cancer targets, including membrane receptors, protein kinases, and TNF-α signaling.38 The anticancer properties of a few copper–chromone complexes have been studied, and a majority of them demonstrate increased cytotoxicity against various phenotypes of cancers with varying potencies.39–41 Different chemically structured thiosemicarbazones have been studied, but only a few of these studies have focused on derivatives of the chromone skeleton. Prabhakaran et al. have recently reported the in vitro cytotoxicity of water-soluble copper(II) complexes of 7-hydroxy-4-oxo-4H-chromene thiosemicarbazones towards MCF-7 and A549 cell lines.42 Karvembu et al. have studied the cytotoxicity of another type of water-soluble mono- and bimetallic Cu(II) complexes of chromone-appended TSCs with HeLa cervical cancer cells.43
Mixed ligand Cu(II) complexes, compared to simple complexes, have attracted a lot of attention very recently due to their potential to be optimized for a variety of physicochemical characteristics. Some of the mixed-ligand Cu(II) complexes have already entered clinical trials for diverse cancer types.44,45 Our research group has been interested in designing and studying the anticancer activity of mixed ligand copper(II)–diimine complexes. We have shown that primary ligands tune the electronic properties of copper(II) while the diimine ligands act as recognition elements when the complexes bind to DNA and proteins, cleave them, and confer enhanced cytotoxic properties on the complexes.46–49 So, our success has encouraged us to synthesize and study a chromone-conjugated TSC, mixed-ligand copper(II) complexes of the type [Cu(L)(diimine)](NO3) (1–4), where HL is 2-((4-oxo-4H-chromen-3-yl)methylene)-N-phenylhydrazinecarbothioamide, and the diimines are 2,2′-bipyridine (bpy, 1) 1,10-phenanthroline (phen, 2), 5,6-dimethyl-1,10-phenanathroline (5,6-dmp, 3), and dipyrido-[3,2-f:2′,3′-h]quinoxaline (dpq, 4) (Fig. 1), and study their anticancer property. The primary ligand TSC is a new kind of chromone-appended thiosemicarbazone derivative that possesses donor atoms N, S, and O, which have the potential to form hydrogen bonds with the functional groups in DNA and protein molecules and enhance the binding affinity. The incorporation of diimine co-ligands is expected to tune the DNA binding affinity, the hydrophobic/lipophilic characteristics, and hence the cytotoxicity of the complexes. The phen and bpy co-ligands have a considerably higher affinity for copper(II) and engage in groove binding with DNA.50–52 Also, the methyl-substituted 5,6-dmp can enhance the lipophilicity of the complex and exert higher hydrophobic interaction with DNA and protein. The dpq complex 4 with an extended aromatic ring system can be involved in the intercalative mode of binding with DNA, and the same complex exhibits higher binding affinity with HSA. The structures of all the complexes have been optimized using the DFT method. The DNA binding affinity of the square-based complexes has been determined using fluorescence and viscosity studies. Molecular docking studies reveal that complexes 1–4 bind in the minor groove of DNA and subdomain II of HSA, which is in close agreement with the experimental results. The 5,6-dmp complex 3 exhibits higher DNA and protein binding affinities than the other complexes in the series, displays significant oxidative DNA cleavage activity, and has a higher ability to generate ROS. Its cytotoxicity (IC50, 1.26 μM for 48 h) towards the HeLa cancer cells is higher than the standard drug cisplatin, and remarkably, it shows lower toxicity towards the non-cancerous peripheral blood mononuclear cells (PBMC).
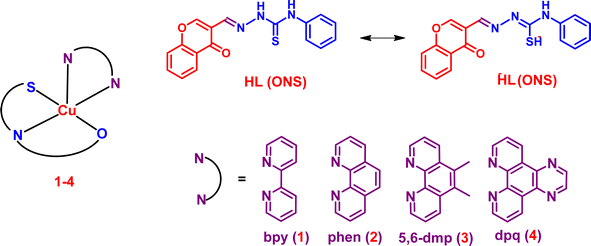 |
| | Fig. 1 Schematic representation of the primary (HL) ligand, diimine (NN) co-ligands, and copper(II) complexes 1–4. | |
Experimental section
Synthesis and characterization of 2-((4-oxo-4H-chromen-3-yl)methylene)-N-phenylhydrazinecarbothioamide (HL)
The chromone appended Schiff base TSC (HL) was synthesized by adopting the procedure already reported.53 Chromone-3-carboxaldehyde (1 mmol, 0.174 g) was added to an ethanolic (20 mL) solution of 4-phenylthiosemicarbazide (1 mmol, 0.167 g) with constant stirring, followed by 2–3 drops of glacial acetic acid. The reaction mixture was refluxed for 6 h. The white precipitate was collected by filtration, washed with ice-cold ethanol, and dried. The resulting crude product was recrystallized in ethanol and dried in a vacuum over P2O5. Yield: 84%. FT-IR (ν, cm−1): ν(N–H) 3267(w), ν(C![[double bond, length as m-dash]](https://www.rsc.org/images/entities/char_e001.gif) O) 1631 (m), ν(HC = N) 1546 (m), ν(C
O) 1631 (m), ν(HC = N) 1546 (m), ν(C![[double bond, length as m-dash]](https://www.rsc.org/images/entities/char_e001.gif) S) 848 (m). (br, broad; s, strong; w, weak; m, medium; vs., very strong). HR-MS (+) in MeOH (m/z): calculated for C17H13N3O2SNa [M + Na]+: 346.06207; found: 346.06249. 1H NMR (400 MHz, DMSO-d6): δ [ppm] 11.96 (s, 1H), 10.14 (s, 1H), 9.35 (s, 1H), 8.30 (s, 1H), 8.12 (d, J = 7.9 Hz, 1H), 7.85 (t, J = 8.2 Hz, 1H), 7.73 (d, J = 8.4 Hz, 1H), 7.57–7.53 (m, 3H), 7.38 (t, J = 7.6 Hz, 2H), 7.22 (t, J = 7.3 Hz, 1H). 13C NMR (100 MHz, DMSO-d6): δ [ppm] 176.4, 175.2, 156.2, 139.3, 135.1, 135.0, 128.6, 126.5, 126.4, 125.9, 125.6, 123.8, 119.2, 118.6.
S) 848 (m). (br, broad; s, strong; w, weak; m, medium; vs., very strong). HR-MS (+) in MeOH (m/z): calculated for C17H13N3O2SNa [M + Na]+: 346.06207; found: 346.06249. 1H NMR (400 MHz, DMSO-d6): δ [ppm] 11.96 (s, 1H), 10.14 (s, 1H), 9.35 (s, 1H), 8.30 (s, 1H), 8.12 (d, J = 7.9 Hz, 1H), 7.85 (t, J = 8.2 Hz, 1H), 7.73 (d, J = 8.4 Hz, 1H), 7.57–7.53 (m, 3H), 7.38 (t, J = 7.6 Hz, 2H), 7.22 (t, J = 7.3 Hz, 1H). 13C NMR (100 MHz, DMSO-d6): δ [ppm] 176.4, 175.2, 156.2, 139.3, 135.1, 135.0, 128.6, 126.5, 126.4, 125.9, 125.6, 123.8, 119.2, 118.6.
Synthesis of [Cu(L)(bpy)](NO3) (1)
To a stirred hot solution of copper(II) nitrate (1 mmol, 0.241 g), 2-((4-oxo-4H-chromen-3-yl)methylene)-N-phenylhydrazinecarbothioamide (or) HL (1 mmol, 0.323 g) dissolved in ethanol was added slowly. Then, the reaction mixture was refluxed for 1 h and allowed to attain room temperature. To this clear solution, an ethanolic (15 mL) solution of bpy (1 mmol, 0.156 g) was added dropwise, and the stirring continued for another 1 h. The resultant green-colored solution was filtered off, and the clear filtrate was kept at room temperature for slow evaporation. The crystalline green solid was isolated, washed with diethyl ether, and then dried under vacuum over P2O5 (yield: 74%). Anal. calcd. for C27H20CuN6O5S; C: 53.68%, H: 3.34%, N: 13.91%. Found: C: 53.56%, H: 3.25%, N: 13.80%. HRMS or ESI-MS (+) in MeOH: m/z 541.06412 (cal. for C27H20CuN5O2S: m/z 541.06282). FT-IR (ν, cm−1): ν(N–H) 3248(w), ν(C![[double bond, length as m-dash]](https://www.rsc.org/images/entities/char_e001.gif) O) 1600(m), ν(HC
O) 1600(m), ν(HC![[double bond, length as m-dash]](https://www.rsc.org/images/entities/char_e001.gif) N) 1566(w), ν(C–O) 1296(s), ν(N–N) 1029 (m), ν(C–S) 759(s). ΛM/Ω−1 cm2 mol−1: 55.
N) 1566(w), ν(C–O) 1296(s), ν(N–N) 1029 (m), ν(C–S) 759(s). ΛM/Ω−1 cm2 mol−1: 55.
Synthesis of [Cu(L)(phen)](NO3) (2)
Complex 2 was prepared by using the procedure employed for preparing complex 1, but by using phen in the place of bpy. The green-colored crystalline solid was washed with diethyl ether and vacuum-dried over P2O5 (yield: 82%). Anal. calcd for C29H20CuN6O5S; C: 55.45%, H: 3.21%, N: 13.38%. Found: C: 55.34%, H: 3.11%, N: 13.29%. HRMS or ESI-MS (+) in MeOH: m/z 565.06291 [M–NO3]+ (cal. for C29H20CuN5O2S: m/z 565.0634). FT-IR (ν, cm−1): ν(N–H) 3186(w), ν(C![[double bond, length as m-dash]](https://www.rsc.org/images/entities/char_e001.gif) O) 1616(m), ν(HC
O) 1616(m), ν(HC![[double bond, length as m-dash]](https://www.rsc.org/images/entities/char_e001.gif) N) 1558(w), ν(C–O) 1288(s), ν(N–N) 1041(m), ν(C–S) 752(s). ΛM/Ω−1 cm2 mol−1: 59.
N) 1558(w), ν(C–O) 1288(s), ν(N–N) 1041(m), ν(C–S) 752(s). ΛM/Ω−1 cm2 mol−1: 59.
Synthesis of [Cu(L)(5,6-dmp)](NO3) (3)
Complex 3 was prepared by using the procedure employed for preparing complex 1, and using 5,6-dmp in the place of bpy. The green-colored crystalline solid was washed with diethyl ether and vacuum-dried over P2O5 (yield: 80%). Anal. calcd for C31H24CuN6O5S; C: 56.74%, H: 3.69%, N: 12.81%. Found: C: 56.65%, H: 3.58%, N: 12.74%. HRMS or ESI-MS (+) in MeOH: m/z 593.09619 [M–NO3]+ (cal. for C31H24CuN5O2S: m/z 593.09412). FT-IR (ν, cm−1): ν(N–H) 3074(w), ν(C![[double bond, length as m-dash]](https://www.rsc.org/images/entities/char_e001.gif) O) 1608(m), ν(HC
O) 1608(m), ν(HC![[double bond, length as m-dash]](https://www.rsc.org/images/entities/char_e001.gif) N) 1558(w), ν(C–O) 1288(s), ν(N–N) 1033(m), ν(C–S) 759(s). ΛM/Ω−1 cm2 mol−1: 50.
N) 1558(w), ν(C–O) 1288(s), ν(N–N) 1033(m), ν(C–S) 759(s). ΛM/Ω−1 cm2 mol−1: 50.
Synthesis of [Cu(L)(dpq)](NO3) (4)
Complex 4 was prepared by using the procedure employed for preparing complex 1, and using dpq in the place of bpy. The green-colored crystalline solid was washed with diethyl ether and vacuum-dried over P2O5 (yield: 76%). Anal. calcd for C31H20CuN8O5S; C: 54.74%, H: 2.96%, N: 16.47%. Found: C: 54.63%, H: 2.84%, N: 16.35%. HRMS or ESI-MS (+) in MeOH: m/z 617.06781 [M–NO3]+ (cal. for C31H20CuN7O2S: m/z 617.06897). FT-IR (ν, cm−1): ν(N–H) 3086(w), ν(C![[double bond, length as m-dash]](https://www.rsc.org/images/entities/char_e001.gif) O) 1612(m), ν(HC
O) 1612(m), ν(HC![[double bond, length as m-dash]](https://www.rsc.org/images/entities/char_e001.gif) N) 1570(w), ν(C–O) 1288(s), ν(N–N) 1033(m), ν(C–S) 759(s). ΛM/Ω−1 cm2 mol−1: 55.
N) 1570(w), ν(C–O) 1288(s), ν(N–N) 1033(m), ν(C–S) 759(s). ΛM/Ω−1 cm2 mol−1: 55.
Results and discussion
The primary ligand 2-((4-oxo-4H-chromen-3-yl)methylene)-N-phenylhydrazine-carbothioamide (HL) has been synthesized by using a procedure described in the literature43 and characterized by FT-IR, 1H, 13C and HR-MS techniques (Fig. S1–S12†). The IR spectrum of HL shows a broad peak in the region 3267 cm−1, which corresponds to the stretching vibration of the –NH group. The ligand exhibits the carbonyl stretching vibration at 1631 cm−1, the azomethine –CH![[double bond, length as m-dash]](https://www.rsc.org/images/entities/char_e001.gif) N stretching vibration around 1546 cm−1, and the thiocarbonyl –C
N stretching vibration around 1546 cm−1, and the thiocarbonyl –C![[double bond, length as m-dash]](https://www.rsc.org/images/entities/char_e001.gif) S vibration at 848 cm−1 (Fig. S1†). The 1H-NMR spectrum of HL displays a singlet peak at 11.96 ppm, corresponding to the N–H functionality coupled to the azomethine group. The chemical shift value of 10.14 ppm (singlet) corresponds to the N–H proton that is flanked between the phenyl and C
S vibration at 848 cm−1 (Fig. S1†). The 1H-NMR spectrum of HL displays a singlet peak at 11.96 ppm, corresponding to the N–H functionality coupled to the azomethine group. The chemical shift value of 10.14 ppm (singlet) corresponds to the N–H proton that is flanked between the phenyl and C![[double bond, length as m-dash]](https://www.rsc.org/images/entities/char_e001.gif) S groups. The azomethine –CH proton appears as a singlet at 9.35 ppm. All the aromatic protons appear in the range of 8.30–7.20 ppm. The carbon signals for azomethine (–C
S groups. The azomethine –CH proton appears as a singlet at 9.35 ppm. All the aromatic protons appear in the range of 8.30–7.20 ppm. The carbon signals for azomethine (–C![[double bond, length as m-dash]](https://www.rsc.org/images/entities/char_e001.gif) N) and thione (–C
N) and thione (–C![[double bond, length as m-dash]](https://www.rsc.org/images/entities/char_e001.gif) S) functionals appear in the 13C-NMR spectrum at 156.23 and 176.43 ppm, respectively. All the aromatic 13C signals appear in the 118.62–139.38 ppm range. Also, the formation of HL is confirmed by the HRMS spectrum (Fig. S6†), which shows a molecular ion peak at the mass value of 346.06249 [M + Na]+.
S) functionals appear in the 13C-NMR spectrum at 156.23 and 176.43 ppm, respectively. All the aromatic 13C signals appear in the 118.62–139.38 ppm range. Also, the formation of HL is confirmed by the HRMS spectrum (Fig. S6†), which shows a molecular ion peak at the mass value of 346.06249 [M + Na]+.
The mixed ligand Cu(II) complexes 1–4 have been prepared as described in the experimental section and characterized by elemental analysis, HRMS, FT-IR, and UV-visible absorption spectral techniques. A positive ion mode HRMS was observed for all the complexes in methanol (Fig. S7–S10†), and the mass values support the composition of the complexes as [Cu(L)(diimine)](NO3). Good quality single crystals suitable for X-ray structure analysis could not be obtained to confirm the formulae of the complexes. In the IR spectra of the complexes, the medium intensity peaks corresponding to –C![[double bond, length as m-dash]](https://www.rsc.org/images/entities/char_e001.gif) N and –C–S stretching vibrations appear in the frequency ranges of 1558 to 1570 cm−1 and 752 to 759 cm−1, respectively. The presence of ν(C
N and –C–S stretching vibrations appear in the frequency ranges of 1558 to 1570 cm−1 and 752 to 759 cm−1, respectively. The presence of ν(C![[double bond, length as m-dash]](https://www.rsc.org/images/entities/char_e001.gif) N) and ν(C–S) suggests that the primary ligand is coordinated to copper(II) (Fig. S2–S5†). The ν(C
N) and ν(C–S) suggests that the primary ligand is coordinated to copper(II) (Fig. S2–S5†). The ν(C![[double bond, length as m-dash]](https://www.rsc.org/images/entities/char_e001.gif) S) stretching frequency in the complexes appears with values lower than that in the free ligand, suggesting that the thione group undergoes thione to thiol tautomerization upon coordination with the metal center.53 The ν(C
S) stretching frequency in the complexes appears with values lower than that in the free ligand, suggesting that the thione group undergoes thione to thiol tautomerization upon coordination with the metal center.53 The ν(C![[double bond, length as m-dash]](https://www.rsc.org/images/entities/char_e001.gif) O) peak of the free ligand (1631 cm−1) is also shifted to lower values (1, 1600; 2, 1616; 3, 1608; 4, 1612 cm−1), confirming the coordination of the carbonyl group of chromone moiety with Cu(II). The ν(C
O) peak of the free ligand (1631 cm−1) is also shifted to lower values (1, 1600; 2, 1616; 3, 1608; 4, 1612 cm−1), confirming the coordination of the carbonyl group of chromone moiety with Cu(II). The ν(C![[double bond, length as m-dash]](https://www.rsc.org/images/entities/char_e001.gif) O) values of bpy (1, 1600 cm−1) and 5,6-dmp (3, 1608 cm−1) complexes are lower than those for phen (2, 1616 cm−1) and dpq complexes (4, 1612 cm−1), implying stronger σ-bonding and higher π-back bonding of C
O) values of bpy (1, 1600 cm−1) and 5,6-dmp (3, 1608 cm−1) complexes are lower than those for phen (2, 1616 cm−1) and dpq complexes (4, 1612 cm−1), implying stronger σ-bonding and higher π-back bonding of C![[double bond, length as m-dash]](https://www.rsc.org/images/entities/char_e001.gif) O group with Cu(II). The molar conductivity in DMF (50–59 ΛM/Ω−1 cm2 mol−1) reveals that all the complexes exist as 1
O group with Cu(II). The molar conductivity in DMF (50–59 ΛM/Ω−1 cm2 mol−1) reveals that all the complexes exist as 1![[thin space (1/6-em)]](https://www.rsc.org/images/entities/char_2009.gif) :
:![[thin space (1/6-em)]](https://www.rsc.org/images/entities/char_2009.gif) 1 electrolytes in solution (Table S1†).54 The TGA experiments were performed from RT to 700 °C under N2 atmosphere to study the thermal stability of the complexes 1–4. All the complexes show good thermal stability up to 200 °C and no noticeable weight loss is observed in the range 80–150 °C, which confirms that no coordinated and lattice water molecules are present in the complexes43 (Fig. S13†). From the observed TGA curves we could not observe any defined intermediaries even after 200 °C.
1 electrolytes in solution (Table S1†).54 The TGA experiments were performed from RT to 700 °C under N2 atmosphere to study the thermal stability of the complexes 1–4. All the complexes show good thermal stability up to 200 °C and no noticeable weight loss is observed in the range 80–150 °C, which confirms that no coordinated and lattice water molecules are present in the complexes43 (Fig. S13†). From the observed TGA curves we could not observe any defined intermediaries even after 200 °C.
DFT studies: coordination geometries of complexes
A density functional theory (DFT) study has been performed to throw light on the coordination geometries and stabilities of [Cu(L)(diimine)]+ 1–4 complexes. The optimized coordination geometries of the present complexes with Cu(ONS)(NN) coordination sphere are provided in Fig. 2, and the computed structural parameters of the complexes are collected in Tables S2–S4.† The coordination geometries were optimized by taking the relevant initial coordinates from the X-ray structures of similar complexes, but with Cu(NNS)(NN) coordination sphere, reported by us earlier.30 The calculated values of the trigonality index τ (τ = (α − β)/60 = 0.30–0.38) reveal that the coordination geometries of the complexes are described better as trigonal pyramidal distorted square pyramidal (TPDSP) (τ = 0, square planar geometry; τ = 1, trigonal bipyramidal geometry). In all the complexes, the thiolate sulphur and nitrogen atom and the oxygen atom of the carbonyl group of the meridionally coordinated primary ligand (HL) occupy the three corners of the square plane. The remaining corner and the axial position of the square pyramid are occupied by the nitrogen atoms of diimine co-ligands. The equatorial Cu–N2 and axial Cu–N3 bond lengths vary as Cu–N2, 4 (2.022) > 2 (2.017) > 3 (2.013) > 1 (2.007 Å); Cu–N3, 4 (dpq; 2.232) ≈ 2 (phen; 2.232) > 3 (5,6-dmp; 2.215) > 1 (bpy; 2.184 Å), the Cu–N1 bond lengths are almost identical (2.009 Å) for all the complexes. These trends indicate that, as expected, the coordinate bonds formed by bpy and 5,6-dmp co-ligands are stronger than those formed by phen and dpq. The non-planar bpy ligand and the electron-donating methyl groups on the phen ring in 5,6-dmp form Cu–N2 and Cu–N3 bonds slightly stronger than those in phen and dpq complexes. The Cu–O1 bond length varies as 1 (2.007) > 3 (2.068) > 2 (2.062) > 4 (2.055 Å). When the diimine is involved in stronger coordination, the Cu–O1 bond becomes weaker or vice versa, as expected. The variation in the Cu–S1 bond length is the same as the Cu–O1 bond, 1 (2.408) > 3 (2.403) > 2 (2.401) > 4 (2.397 Å), and the Cu–S1 bonds in all the complexes are longer than the other bonds, as expected.
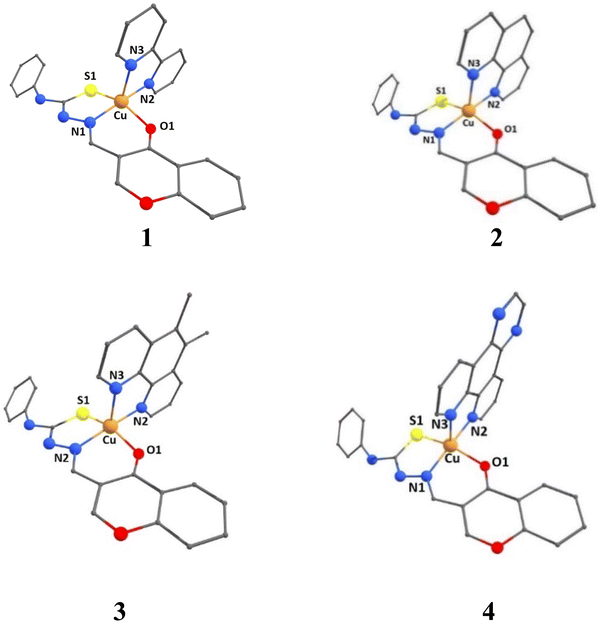 |
| | Fig. 2 DFT optimized structures of complexes [Cu(L)(diimine)]+ (1–4) in B3LYP level of theory with mixed basis sets LANL2DZ/6-31G* and methanol as a solvent in CPCM method. | |
Electronic absorption spectroscopy
The UV-visible spectral data for 1–4 obtained in DMF solution (Table 1 and Fig. S14†) show that all the complexes display a low-intensity broad asymmetric ligand field band (643–667 nm), characteristic of square-based Cu(II) environment. A ligand-to-metal charge-transfer (LMCT) band (390–438 nm) and a band due to intra-ligand transition (π → π*, 267–292 nm) are also observed.43,55 The electronic absorption spectra of the complexes (5 × 10⁻³ M) obtained at various time intervals, 0, 6, 12, 24 and 48 h, verify the stability of the complexes in DMF solution. Even after 24 h, no significant change in band positions is observed (Fig. S15†), confirming the stability of the complexes in the DMF medium.56 Further, the stability of the complexes in PBS (pH 7.2) alone and the trans metallation stability in PBS (pH 7.2) with Zn2+, Fe2+, Co2+, and Ni2+ ions were carried out for the complexes 1–4.46 The results show that the complexes are stable in PBS medium and do not undergo any trans metallation with the metal ions up to 48 h, as evidenced by the absorption spectral data (Fig. S16 and Table S5†). Also, a spectral study of the complexes in 10% serum-PBS buffer medium up to 48 h reveals no significant changes in the band positions, confirming the stability, identity and coordination environment around Cu(II) of the complexes in the cell culture (Fig. S17†) medium.30
Table 1 Electronic absorptiona and EPR spectral properties of copper(II) complexes 1–4
| Complex |
λmax in nm (ε, M−1 cm−1) |
EPR spectra (77 K) |
| Ligand basedb |
CT transitionc |
Ligand fieldd |
g∥ |
g⊥ |
A∥ (10−4 cm−1) |
g∥/A∥e (cm) |
Gf |
| In DMF solution. Concentration, 2 × 10⁻⁵ M. Concentration, 0.3 × 10⁻³ M. Concentration, 5 × 10⁻³ M. A∥ (10−4 cm−1) = 0.46686 g A (gauss). G = (g∥ − 2)/(g⊥ − 2). |
| 1 |
282 (21![[thin space (1/6-em)]](https://www.rsc.org/images/entities/char_2009.gif) 772) 772) |
421sh |
667 (98) |
2.297 |
2.069 |
166 |
138 |
4.3 |
| 2 |
268 (28![[thin space (1/6-em)]](https://www.rsc.org/images/entities/char_2009.gif) 500) 500) |
390sh |
661 (118) |
2.306 |
2.065 |
166 |
139 |
4.7 |
| 3 |
282 (41![[thin space (1/6-em)]](https://www.rsc.org/images/entities/char_2009.gif) 318) 318) |
438sh |
643 (145) |
2.297 |
2.065 |
169 |
136 |
4.6 |
| 4 |
267 (4862) 292sh |
344sh |
663 (67) |
2.298 |
2.060 |
164 |
140 |
4.9 |
Electron paramagnetic resonance spectroscopy
The frozen solution X-band EPR spectra of all the Cu(II) complexes recorded in frozen DMF solution are axial, (g∥ > g⊥ > 2.0, G = [(g∥ − 2)/(g⊥ − 2)] = 4.3–5.2) (Table 1 and Fig. 3), indicating that Cu(II) is located in a square-based coordination environment with a dx2–y2 orbital as the ground state, supporting the electronic absorption spectral observations.57 In general, Cu(II) complexes with CuN4 chromophore have g∥ and A∥ values in the ranges 2.210–2.260 and 175–200 × 10−4 cm−1, respectively. In a square planar coordination geometry, the g∥ value increases, and A∥ decreases when a coordinated nitrogen atom is replaced by oxygen.58 Similarly, when the square planar geometry around Cu(II) undergoes distortion upon strong axial interaction, the g∥ value increases and the A∥ value decreases.58 The present complexes 1–4 show g∥ (2.297–2.306) and A∥ (159–169 × 10−4 cm−1) values, which reveal the coordination of the conjugated carbonyl oxygen atom with Cu(II). The higher g∥ values are attributed to the π-delocalization of the unpaired electron on Cu(II) into the chromone moiety through coordination of the conjugated carbonyl group. This is in line with the lower ν(C![[double bond, length as m-dash]](https://www.rsc.org/images/entities/char_e001.gif) O) values observed for the complexes compared to uncoordinated ligand. Similar higher g∥ values have been observed when flavonolates are coordinated to copper(II).59 Also, an increase in g∥ and decrease in A∥ values and a slightly higher value of g∥/A∥ quotient (136–140 cm) reveals that the complexes have a slightly distorted square-based geometry around Cu(II). This is supported by the calculated values of the trigonality index (τ, 0.30–0.38), which corresponds to the trigonal bipyramidal distorted square pyramidal geometries (TBDSP) around Cu(II), distorted by the presence of strong axial bonding by the nitrogen atom of chelated diamine co-ligand. Further, the observation of five N-super hyperfine (N-shf) lines on the low field parallel component and the perpendicular component reveals that the square-based coordination geometry around Cu(II) is only slightly distorted in solution and that the basal plane contains only two sp2 hybridized nitrogen atoms, one from the diimine ligand and the other from the primary ligand (Fig. S18†).
O) values observed for the complexes compared to uncoordinated ligand. Similar higher g∥ values have been observed when flavonolates are coordinated to copper(II).59 Also, an increase in g∥ and decrease in A∥ values and a slightly higher value of g∥/A∥ quotient (136–140 cm) reveals that the complexes have a slightly distorted square-based geometry around Cu(II). This is supported by the calculated values of the trigonality index (τ, 0.30–0.38), which corresponds to the trigonal bipyramidal distorted square pyramidal geometries (TBDSP) around Cu(II), distorted by the presence of strong axial bonding by the nitrogen atom of chelated diamine co-ligand. Further, the observation of five N-super hyperfine (N-shf) lines on the low field parallel component and the perpendicular component reveals that the square-based coordination geometry around Cu(II) is only slightly distorted in solution and that the basal plane contains only two sp2 hybridized nitrogen atoms, one from the diimine ligand and the other from the primary ligand (Fig. S18†).
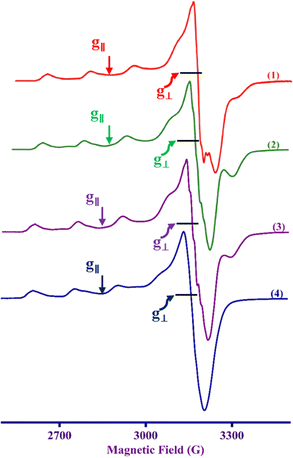 |
| | Fig. 3 X-band EPR spectra of the complexes 1–4 in DMF at 77 K. Frequency 9.1–9.16 GHz. | |
Electrochemical studies
To explore the electrochemical properties of the copper(II) complexes 1–4, cyclic voltammetry (CV) and differential pulse voltammetry (DPV) responses were recorded in DMF/n-Bu4NPF6 using glassy carbon (GC) as the working electrode at a scan rate of 50 mV s−1. The results are summarized in Table 2. In comparison with the ΔEp value of 80 mV obtained for the reversible Fc/Fc+ couple under identical conditions, all the present complexes, which display ΔEp values ranging from 84 to 127 mV, may be considered to undergo reversible to irreversible CuII/CuI electrochemical redox. The 5,6-dmp complex exhibits a reversible CuII/CuI redox while all the other complexes a quasi-reversible redox. The Cu(II)/Cu(I) redox potentials determined from DPV (E1/2, 0.075–0.145 V vs. Fc+/Fc) decreases in the order 4 > 2 > 1 ≈ 3. All the complexes show positive E1/2 values, which is interesting as the analogous pyridyl complexes show negative CuII/CuI redox potential.30 This is reminiscent of the conjugated chromone moiety is involved in π-back bonding in blue copper proteins and small molecules with Cu(II)–S bonds exhibiting positive CuII/CuI redox potentials,60,61 stabilizing Cu(I) over Cu(II) oxidation state, which is in line with the higher g∥ value observed. Among all the complexes, 4 shows the highest positive redox potential due to the presence of dpq with extended π-delocalized aromatic moiety, which destabilizes the Cu(II) oxidation state (Fig. 4 and S19†).62 On the other hand, the methyl-substituted 5,6-dmp complex 3 exhibits an E1/2 value less positive than the phen complex, indicating that the electron-donating methyl substituents stabilize Cu(II) over Cu(I) oxidation state.
Table 2 Electrochemical properties of copper(II) complexes 1–4
| Complex |
Epc (V) |
Epa (V) |
ΔEp (mV) |
E1/2 (V) |
| CVa |
DPVb |
| Measured vs. calomel reference electrode; Fc/Fc+ couple E1/2, 0.424 V (CV), 0.428 V (DPV), scan rate, 50 mV s−1; supporting electrolyte, tetra-N-butylammonium perchlorate (0.1 M); complex concentration, 1 mmol dm−3. Differential pulse voltammetry, scan rate, 5 mV s−1; pulse height, 50 mV. |
| 1 |
0.015 |
0.130 |
115 |
0.072 |
0.075 |
| 2 |
0.040 |
0.152 |
112 |
0.096 |
0.095 |
| 3 |
0.046 |
0.130 |
84 |
0.088 |
0.075 |
| 4 |
0.115 |
0.242 |
127 |
0.178 |
0.145 |
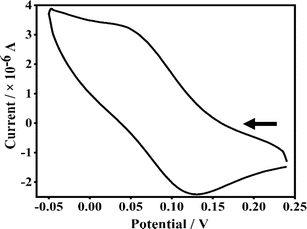 |
| | Fig. 4 Cyclic voltammogram of a 1 mmol dm−3 solution of complex 3 in DMF in the presence of 0.1 M TBAP as the supporting electrolyte and calomel as the reference electrode; scan rate 0.05 V s−1, differential pulse voltammetry, scan rate, 5 mV s−1; pulse height, 50 mV. | |
DNA binding studies
Ethidium bromide displacement assay. This is one of the most often used methods to examine how small molecules bind to DNA using the fluorescence spectral technique. EthBr is well-known to fluoresce strongly when it binds to DNA through an intercalative mode. This fluorescence intensity decreases when a second molecule capable of binding to DNA is added to it. The extent of quenching of the fluorescence intensity of the DNA–EthBr adduct can be directly related to the DNA binding affinity of complexes.63,64 Thus, the fluorescence intensity of DNA-bound EthBr decreases when 1–4 (0–60 μM) are added to CT DNA pre-treated with ethidium bromide ([DNA], 125; [EthBr], 12.5 μM; [DNA]/[EthBr] = 10) in Tris–HCl buffer. The results of the fluorescence spectral titration of complexes with CT-DNA are provided in Fig. 5. From a plot of the observed intensities vs. [complex], the apparent DNA binding constant (Kapp) was determined using the equation defined in the ESI† section.65 Based on the Kapp value, the ability of the complexes to bind with DNA may be arranged in the order 3 > 4 > 2 > 1, with complex 3 showing the highest DNA binding affinity (Table 3 and Fig. S20†). The results imply that the complexes can efficiently interact with EthBr and displace it from the EthBr–DNA adduct. Interestingly, the Kapp value of 3 falls within the range of those of metallo intercalators (105 M−1),66 revealing that 3 is involved in DNA groove binding through the methyl groups interacting hydrophobically with the hydrophobic interior of DNA, which causes changes in the DNA structure and facilitates the displacement of EthBr. Other complexes may be involved in a groove or partial intercalative mode of binding with the DNA.
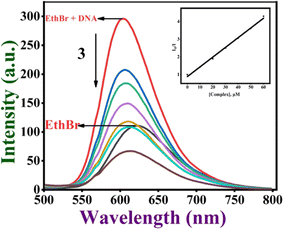 |
| | Fig. 5 Fluorescence titration of the Cu(II) complex 3 (0–60 μM) with DNA (125 μM). Effect of the addition of complex 3 on the emission intensity of CT DNA-bound EthBr. (Inset) The plot of I0/I vs. [complex]. | |
Table 3 Fluorescence spectral properties of copper(II) complexes 1–4 bound to CT-DNA and human serum albumin protein
| Complex |
Kappa (×105 M−1) |
Ksvb (×104 M−1) |
| DNA binding study. Protein binding study. |
| 1 |
0.63 |
11.5 ± 0.005 |
| 2 |
1.23 |
8.60 ± 0.006 |
| 3 |
5.12 |
22.0 ± 0.001 |
| 4 |
3.03 |
30.8 ± 0.003 |
Viscosity measurements. To obtain additional support for the DNA binding modes of 1–4, the viscosity of CT DNA was measured before and after the addition of copper complexes. In general, a significant lengthening of the DNA biopolymer was observed when the small molecules are involved in complete or classical intercalation between the nucleobase pairs of DNA.67 The relative viscosity of CT DNA was monitored upon the incremental addition of 1–4 (1/R = [complex]/[DNA] = 0 to 0.5) to CT DNA (200 μM). The relative specific viscosity of DNA, [ɳ/ȵ]1/3, was plotted vs. 1/R = [complex]/[DNA] (Fig. 6). From the plot, it is inferred that the increase in viscosity follows the trend, EthBr > 3 > 4 > 2 > 1, with 3 showing an increase in DNA viscosity higher than other complexes. This is consistent with the trend observed in Kapp values (cf. above), which supports the propensity of 3 to increase the viscosity of DNA on account of the involvement of coordinated 5,6-dmp in hydrophobic interaction with the DNA groove. We have previously shown that DNA groove binding would also cause the elongation of DNA double helix as much as DNA intercalation.30,55
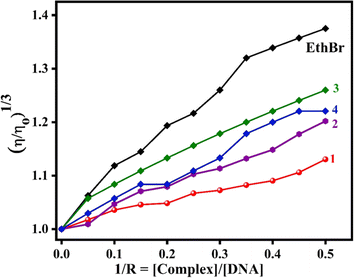 |
| | Fig. 6 Changes in the relative viscosity of CT DNA upon the addition of complexes 1–4. | |
DNA cleavage studies
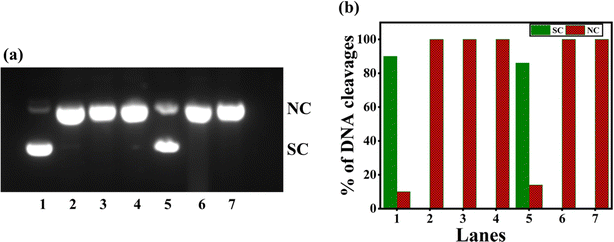
Numerous copper(II) complexes have been identified to effect DNA cleavage that closely matches their in vitro anticancer activity.62,68 In the present study, supercoiled (SC) pUC19 (40 μM in base pairs) was incubated with 1–4 in Tris–HCl buffer (Fig. 7) for 4 hours without adding a reductant. Upon gel electrophoresis of the reaction mixture, interestingly, the complex 3 (100 μM) exhibits a higher percentage of DNA cleavage with 52% NC (form II). However, complexes 1, 2, and 4 show insignificant DNA cleavage (Table S6†). It is evident that 3 is involved in the self-activation of DNA cleavage due to its strong DNA groove binding interaction, which brings it closer to the DNA cleavage sites69 and produces nicked circular (NC) fragments. As the self-activated DNA cleavage of complexes is mostly related to their hydrolytic cleavage, further investigation on the interesting self-activating cleavage of 3 is needed to throw light on the cleavage mechanism.
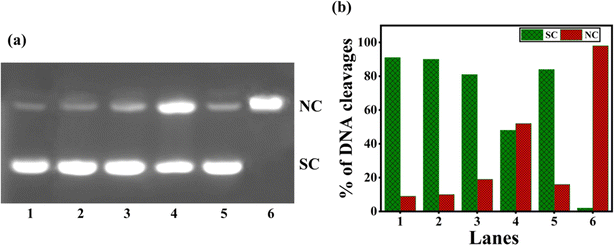 |
| | Fig. 7 (a) Gel electrophoresis diagram showing the self-activated cleavage of supercoiled pUC19 DNA (40 μM in base pair) by complexes 1–4 (100 μM) in 10% DMF-Tris–HCl buffer at pH 7.1 and 37 °C with an incubation time of 4 h: lane 1, DNA (control); lane 2, DNA + 1; lane 3, DNA + 2; lane 4, DNA + 3; lane 5, DNA + 4; lane 6, DNA + [Cu(dpq)2]2+. (b) The percentage of DNA cleavage shows an increase in SC and NC Forms with an incubation time of 4 h. Forms SC and NC are supercoiled and nicked circular, respectively. | |
When 1–4 were incubated with SC pUC19 DNA in the Tris–HCl buffer in the presence of the reducing agent ascorbic acid (H2A) and O2, oxidative DNA cleavage was observed (Fig. 8). When 4 produces only 60% NC form, 2 and 3 yields the highest percentage of cleaved NC DNA fragments (100%) relative to the control DNA (lane 1, (Fig. 8 and Table S7†)). The effective DNA cleavage is affected by 2 and 3 due to their strong hydrophobic interaction with DNA.49 The cleavage of 3 was performed in the presence of several scavengers such as DMSO, NaN3, catalase, and SOD to scavenge hydroxyl radical, singlet oxygen, H2O2, and superoxide, respectively, to understand the mechanism of cleavage. While catalase, an H2O2 radical scavenger, almost entirely suppresses DNA cleavage (Fig. 9 and Table S8†), hydroxyl and superoxide radical (O2−˙) scavengers fail to do so. On the other hand, the DNA cleavage was not suppressed in the presence of singlet oxygen quencher sodium azide, which rules out the involvement of singlet oxygen in DNA cleavage. The significant inhibition of DNA cleavage in the presence of catalase reveals that H2O2 is an essential intermediary species involved in the mechanism of DNA cleavage. Thus, it is inferred that the DNA cleavage involves the reduction of Cu(II) by H2A, and the reduction of O2 to O2−˙. Also, the reaction of Cu(I) form of 3 with O2−˙ produces a freely diffusible hydroxyl radical that could oxidatively damage DNA.70–73
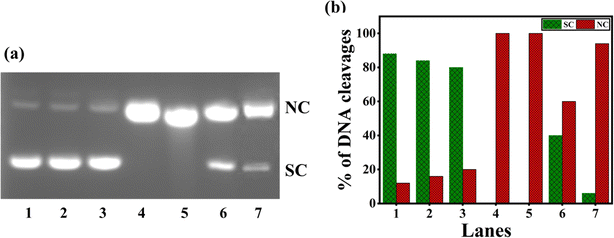 |
| | Fig. 8 (a) Oxidative cleavage of pUC19 SC plasmid DNA (40 μM), with ascorbic acid (50 μM) added as reductant, by the copper(II) complexes 1–4 (100 μM) in 10% DMF-Tris–HCl buffer and 37 °C with an incubation time of 30 minutes: lane 1, DNA (control); lane 2, DNA + H2A; lane 3, DNA + H2A + 1; lane 4, DNA + H2A + 2; lane 5, DNA + H2A + 3; lane 6, DNA + H2A + 4; lane 7, DNA + H2A + [Cu(dpq)2]2+. (b) Percentage efficiencies of DNA cleavage showing an increase in forms SC (supercoiled) and NC (nicked circular) with an incubation time of 30 minutes. | |
 |
| | Fig. 9 (a) Gel electropherogram showing the cleavage of pUC19 SC plasmid DNA (40 μM), with various radical scavengers and in the presence of ascorbic acid (50 μM) by complex 3 (100 μM) at 1 h incubation. (1) DNA; (2) pUC19 DNA + H2A + 3; (3) pUC19 DNA + H2A + DMSO + 3; (4) pUC19 DNA + H2A + NaN3 + 3; (5) pUC19 DNA + H2A + catalase + 3; (6) pUC19 DNA + H2A + SOD + 3; (7) pUC19 DNA + H2A + 3 + N2. (b) A graph shows the percentage of SC (supercoiled) and NC (nicked circular) forms of DNA that exist in each lane with an incubation time of 1 h. | |
Rhodamine B degradation assay
The formation of freely diffusible hydroxyl radicals by 1–4 was verified using the rhodamine B degradation assay. Rhodamine B dye is known to gradually lose its absorbance intensity when a freely diffusible hydroxyl radical reacts with it and degrades it.46,74 When 1–4 (50 μM) were added to Rhodamine B dye (5 μM) in the presence of ascorbic acid (0.5 mM) the absorbance at 552 nm decreases and reaches the minimum within an hour (Fig. 10). As the dye does not deteriorate in the absence of ascorbic acid, it is evident that readily diffusible hydroxyl radicals formed in the presence of ascorbic acid facilitate redox-induced DNA damage. The time-dependent dye degradation profile reveals that 3 produces a higher amount of hydroxyl radicals than the other complexes in the series and facilitates higher oxidative DNA cleavage.
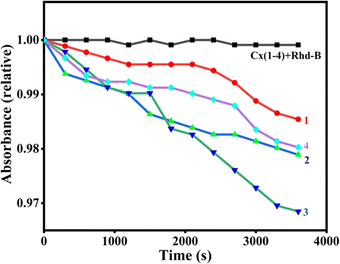 |
| | Fig. 10 Rhodamine B degradation by the complexes 1–4 was followed by measuring the absorbance at 552 nm at pH 7.1 in 10 mM phosphate buffer in the presence 1 (●), 2 (▲), 3 (◄), 4 (♦) and absence (1–4 ■) of ascorbic acid. | |
Protein binding experiments
The protein widely recognized as serum albumin (SA) increases the solubility of drugs in blood plasma and has the ability to bind, transport, and deliver a wide range of endogenous and exogenous substances, including fatty acids, nutrients, steroids, specific metal ions, hormones, and a number of biological chemicals, to their intended target organs.75,76 So, the propensity of complexes 1–4 to interact and bind with human serum albumin (HSA) was investigated utilizing the tryptophan fluorescence quenching technique. The tryptophan fluorescence is known to frequently change due to protein conformational shifts, subunit interactions, substrate binding, or denaturation, and the degree of exposure of the tryptophan residues to the polar aqueous media is determined by the HSA emission intensity.77,78 The emission intensity is reduced when the complexes are added to HSA (Fig. 11, S21† and Table 3). It is clear that the protein binding of complexes causes changes in the secondary protein structure and tryptophan environment of HSA.78 As the value of Stern–Volmer constant (Ksv) obtained from a linear plot of slope I0/I vs. [complex] is a measure of the ability of a complex to quench the fluorescence intensity, and hence its ability to bind to proteins,79 the trend in the calculated Ksv values 4 > 3 > 1 > 2, shows the decreasing order of protein binding affinity. It is interesting to note that 4 and 3 than other complexes, on account of the extended aromatic dpq moiety (4) and the methyl group (3), which involve hydrophobic interaction with the interior hydrophobic pockets of the protein.
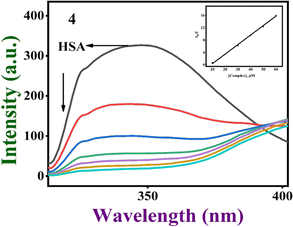 |
| | Fig. 11 The gradual quenching of fluorescence of HSA at around 347 nm upon adding [Cu(L)(dpq)]+ 4 at pH 7.1. (Inset) The plot of I0/I vs. [complex]. | |
Molecular docking studies
To substantiate the experimental binding results and locate the binding sites of the metal complexes on the DNA and HSA, molecular docking was investigated for the present complexes 1–4. The molecular docking was performed using autodock 4.2, with the resultant interaction visualized via the Discovery Studio Visualizer software and protein–ligand interaction profiler (PLIP).
Docking with DNA
To rationalize the experimental results, the docking study of Cu(II) complexes 1–4 with duplex DNA of the sequence d(CGCGAATTCGCG)2 dodecamer (PDB ID: 1BNA) was performed. Out of 10 docking conformations obtained, the best-docked pose is depicted in Fig. 12 and S22–S24.† The binding energy, number of hydrogen bonds, and hydrophobic interactions are summarized in Table 4. The docking results reveal that all the complexes bind non-covalently on the minor groove of the duplex DNA through van der Waals interactions, and hydrogen bond and hydrophobic interactions (Fig. 12 and S22–S24†).80–83 The order of binding energy obtained, 4 (−12.04) > 3 (−11.29) > 2 (−11.14) > 1 (−10.97 kcal mol−1), reveals that the complex 4 bearing dpq with extended planar aromatic moiety, exhibits DNA binding energy being the highest among the present series of complexes. Followed by 4, the 5,6-dmp complex 3 displays higher binding affinity. The higher DNA binding affinity of 4 may be attributed to the involvement of two hydrogen bonding interactions with guanine12 (2.26 Å) and guanine14 (2.54 Å) and five hydrophobic interactions with guanine14 (2.53 Å), adenine (3.23 Å), adenine (3.45 Å), guanine (2.81 Å), and guanine (3.68 Å) nucleobases. The 5,6-dmp (3) and phen (2) complexes display four hydrophobic interactions each while 2 shows one hydrogen bond with guanine16 (2.23 Å) in addition to hydrophobic interactions. However, the difference in binding energies of these two complexes is not significant. The bpy complex 1 exhibits more number (five) of hydrogen bonds than all the other complexes but shows only three hydrophobic interactions, and hence its DNA binding affinity is lower than others. It is interesting to note that, in addition to hydrogen bonding and hydrophobic interactions, the binding orientation of the complexes also contributes to the DNA binding affinity of the complexes. Thus, interestingly, the complexes of phen, 5,6-dmp, and dpq co-ligands dock with DNA through intercalation between the base pairs of the DNA than the complex 1 with bpy co-ligand (Fig. 12, S23 and S24†). This reveals that the complexes 2–4 bind with the DNA through intercalative mode of interaction. Among them, the dpq complex penetrates more deeply into the base pairs of DNA, as evident in the docking pose (Fig. 12). Hence, in addition to hydrogen bonding and hydrophobic interactions, the intercalative mode of binding also contributes to the binding strength of the complex with DNA. The docking results are in close agreement with the experimental results; however, a small variation in the order of binding warrants further studies to understand the binding propensity of the complexes.
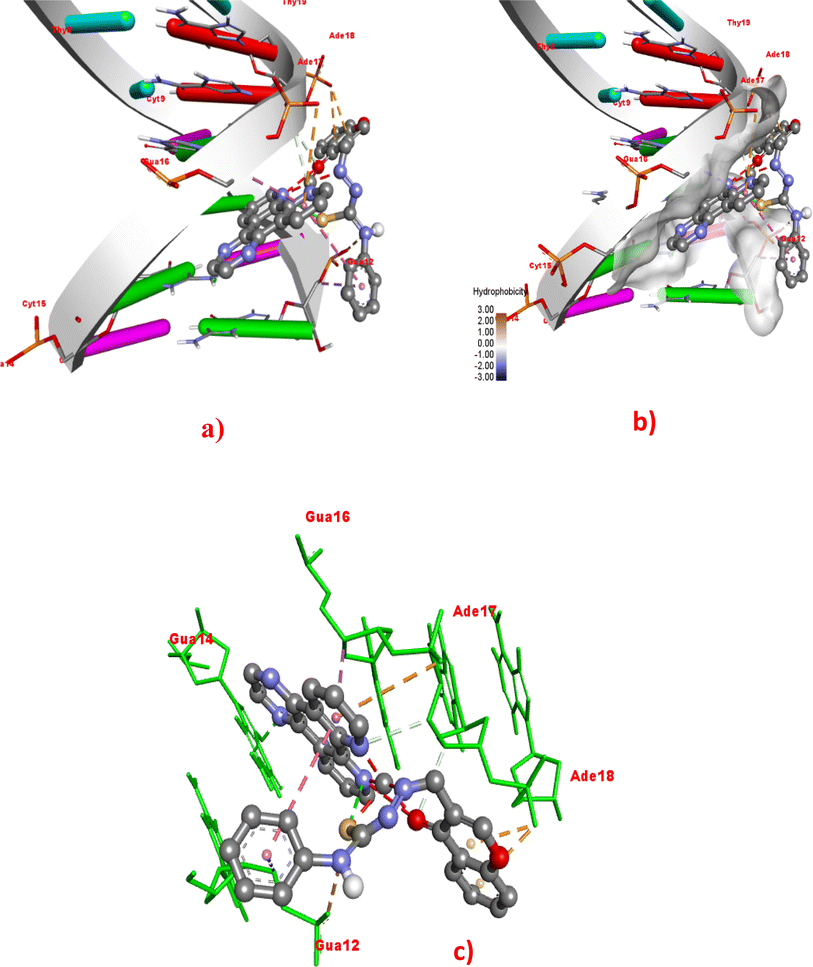 |
| | Fig. 12 Molecular docking of the dpq complex 4 with DNA (PDB: 1BNA). (a) Full 3D-view of DNA with complex 4 in the minor groove. (b) Detailed interactions of 4 with surrounding nucleobase residues. (c) 3D-view of hydrophobic interactions with dodecamer DNA nucleobase residues. | |
Table 4 Summary of the docking results of copper complexes 1–4 with duplex DNA
| Complex |
Binding energy (kcal mol−1) |
Hydrogen bond interactions |
Hydrophobic interactions |
Distance (Å) |
| Residue type |
Distance (Å) |
Complex atom |
Residue atom |
| 1 |
−10.97 |
DG16, DG10, DG16, DG12, DA18 |
2.67, 2.98, 3.07, 2.21, 2.44 |
O2, O2, O2, O2, N1 |
N2, N3, N3, O3, O2 |
ADE18, ADE17, CYT11 |
2.70, 3.33, 3.06 |
| 2 |
−11.14 |
DG16 |
2.23 |
N1 |
O3 |
GUA16, ADE17, CYT11, GUA12 |
2.23, 3.91, 3.41, 3.24 |
| 3 |
−11.29 |
— |
— |
— |
— |
ADE17, CYT11, GUA12, GUA16 |
3.66, 3.31, 3.09, 3.54 |
| 4 |
−12.04 |
DG12, DG14 |
2.26, 2.54 |
N1, N3 |
O3, N2 |
GUA14, ADE18, ADE17, GUA12, GUA16 |
2.53, 3.23, 3.45, 2.81, 3.68 |
Protein docking analysis
To assess the binding ability of complexes 1–4 with the blood serum albumin (SA), molecular docking simulations were carried out with Human Serum Albumin (HSA) (PDB: 8H0O).84,85 As illustrated in Fig. 13a, HSA is a helical heart-shaped protein and has two high-affinity binding sites, namely, Sudlow's site 1 in sub-domain IIA and Sudlow's site 2 in sub-domain IIIA for pharmaceuticals.81,86–88 All the complexes 1–4 docked successfully into the binding site of HSA. Out of 10 docking conformations obtained, the best docking pose was selected for analysis, and the binding energy of complexes 1–4 varies as follows: 4 (−5.59) > 3 (−5.42) > 2 (−5.41) > 1 (−5.26 kcal mol−1) (Table 5). The specific binding interactions of 1–4 with the proximity amino acid residues in the binding site are illustrated in Fig. 13 and S25–S27† with labelled vital residues. Further, the Discovery Studio Bio-visualizer and protein–ligand interaction profiles (PLIP) were used to visualize the metal complex–protein interactions. The comprehensive analysis of these interactions is listed at the atom level in Table 5. The binding energy reveals that all the complexes show good binding affinity with the HSA protein through non-covalent van der Waals interactions such as hydrogen bonds and hydrophobic and π-cationic interactions. Among them, the dpq (4) complex exhibits binding affinity with the HSA higher than other complexes in the series.
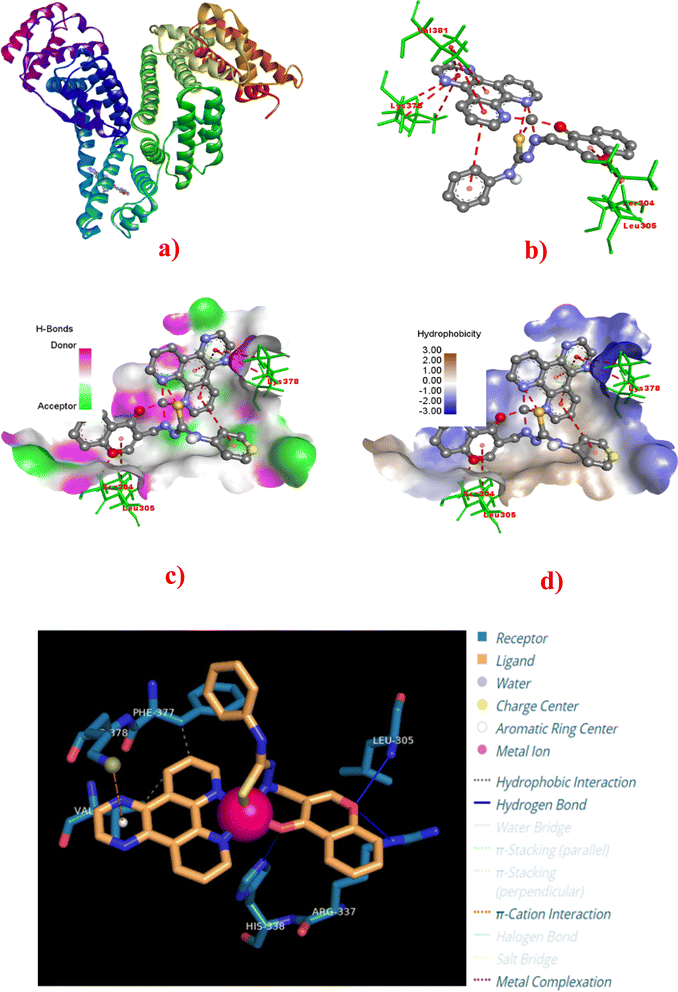 |
| | Fig. 13 Molecular docking of HSA (PDB: 8H0O) with complex 4. (a) Full view of HSA with color-coded subdomains showing the binding site of 4 in HSA. (b) Detailed interactions of 4 with surrounding amino acid residues. (c) 3D-view of hydrogen bonding interactions. (d) 3D-view of hydrophobic interactions with amino acid residues. (e) Detailed interaction of 4 with surrounding amino acid residues. | |
Table 5 Summary of docking results of copper(II) complexes 1–4 with HSA
| Complex |
Binding sites |
Binding energy (kcal mol−1) |
π-Cation interactions |
Hydrophobic interactions |
Hydrogen bond |
| Residue type |
Distance (Å) |
Offset |
Residue type |
Distance (Å) |
Residue type |
Distance (Å) |
Complex atom |
Residue atom |
| 1 |
HSA domain IIA |
−5.26 |
— |
— |
— |
ARG114, ILE142, PHE149, PHE149, LEU154, PHE157, TYR161, ARG186, LYS190 |
3.97, 3.86, 3.96, 3.20, 3.13, 3.69, 3.77, 3.79, 3.94 |
LEU115, HIS146 |
2.68, 3.00 |
NH, N3 |
O2, NH |
| 2 |
HSA domain IIA |
−5.41 |
LYS137 |
5.89 |
1.94 |
VAL116, VAL116, PHE134, LYS137, TYR138 |
3.72, 3.73, 3.76, 3.44, 3.72 |
GLU119 |
2.89 |
O2 |
NH |
| 3 |
HSA domain IIA |
−5.42 |
LYS137 |
5.59 |
1.37 |
VAL116, VAL122, ALA126, PHE134, LYS137, TYR138, GLU141 |
3.87, 3.85, 3.78, 3.81, 3.40, 3.86, 3.99 |
LYS137 |
3.25 |
NH |
N3+ |
| 4 |
HSA domain IIA |
−5.59 |
LYS378 |
4.56 |
0.62 |
PHE377, VAL381 |
3.32, 3.75 |
LEU305, ARG337, HIS338 |
2.69, 3.06, 3.08 |
O2, O2, O2 |
NH, NH, NH |
According to docking data, the dpq complex 4 exhibits three hydrogen bonds with LEU305 (2.69 Å), ARG337 (3.06 Å), and HIS338 (3.08 Å) and two hydrophobic interactions with PHE377 (3.32 Å) and VAL381 (3.75 Å), and one π-cation interaction with LYS378 (4.56 Å) (Table 5). Though 4 displays fewer hydrophobic interactions than other complexes, it exhibits more hydrogen bonding interactions and more vital π-cation interaction with the amino acid residues. It is clear that 4 shows HSA binding affinity higher than other complexes. Among 1–3, the complexes 2 and 3 show π-cation interaction with LYS137 (5.89 Å) and LYS137 (5.59 Å), respectively. On the other hand, complex 1 doesn't show any π-cation interaction. Thus, 2 and 3 show a little higher binding energy than 1, even though the latter shows two hydrogen bonds and more hydrophobic interactions. From these investigations, we may conclude that complexes 1–4 bind mainly in the subdomain IIA of HSA, and most importantly, they interact with the amino acid residues which are close to tryptophan (TRP214), which is responsible for the intrinsic fluorescence of HSA that is subsequently quenched by 1–4.82,83,85,89,90 As a result, the order of binding affinity obtained from the docking studies agrees with the experimentally observed one. On the other hand, there is a slight, but negligible, difference in binding energies of 1 and 2.
Cytotoxicity of complexes: MTT assay
The cytotoxicity of complexes 1–4 was screened against the cervical cancer cell line (HeLa cells) and compared with the currently used drug cisplatin under identical experimental conditions. All the complexes show time-dependent IC50 values, which are lower at 48 h than at 24 h incubation. Importantly, they exhibit IC50 values lower than cisplatin (6.81 ± 0.11 μM) and the free ligand HL (91.92 ± 0.37), and the decreasing trend in IC50 values at 48 h is 1 (3.29 ± 0.9) > 4 (2.43 ± 0.12) > 2 (1.73 ± 0.07) > 3 (1.26 ± 0.14 μM) (Table 6). The most prominent cytotoxicity of 3 may be attributed to the higher DNA binding affinity and DNA cleaving ability of 3, which arise on account of the methyl substituents. Also, the increased hydrophobicity of the 5,6-dmp co-ligand facilitates its transport across the cell membrane.
Table 6 MTT assay of finding viability of HeLa cancer cells treated with copper(II) complexes 1–4
| Complex |
24 h IC50a/μM |
48 h IC50a/μM |
PBMC |
Log![[thin space (1/6-em)]](https://www.rsc.org/images/entities/char_2009.gif) P P |
| IC50 = the concentration of the drug required to inhibit the growth of cells to 50%. |
| 1 |
5.73 ± 0.54 |
3.29 ± 0.90 |
— |
1.890 |
| 2 |
1.83 ± 0.17 |
1.73 ± 0.07 |
— |
1.067 |
| 3 |
2.97 ± 0.92 |
1.26 ± 0.14 |
109.9 ± 0.01 |
2.917 |
| 4 |
2.66 ± 0.30 |
2.43 ± 0.12 |
— |
2.511 |
| HL |
>100 |
91.92 ± 0.37 |
— |
— |
| Cisplatin |
14.76 ± 0.18 |
6.81 ± 0.11 |
— |
— |
To assess its selectivity to cancer cells, the cytotoxicity of 3 was tested against human peripheral blood mononuclear cells (PBMC), which are healthy white blood cells with a predominance of lymphocytes. At 24 h treatment, the complex shows a higher IC50 value (109.9 μM) in PBMC cells, and the selectivity index (SI) reveals that 3 is approximately 90 times less toxic to healthy cells (Fig. S28†). Interestingly, the present mixed ligand complexes 2 (IC50, 1.73 μM) and 3 (IC50, 1.26 μM) demonstrate cytotoxicity higher than the already reported analogous mono- and bimetallic Cu(II) complexes (IC50, 2.24–5.4 μM) in HeLa cells,43 revealing that the incorporation of diimines as co-ligands in mixed ligand complexes lead to enhanced anticancer efficiency. However, the present complexes show cytotoxicity lower than the analogous complexes [Cu(L)(bpy)](ClO4) (IC50, 7 nM) and [Cu(L)(5,6-dmp)](ClO4) (IC50, 13.57 nM) where L is 2-formylpyridine-N4-phenylthiosemicarbazone in HeLa cervical cancer cells.30
Fluorescence microscopic analysis of cell death: AO/EthBr and Hoechst 33258 staining assays
Both the AO/EB and Hoechst staining assays have been employed to visualize the morphological changes that happen upon the treatment of 1–4 with cancer cells.91 The staining assays reveal the presence of a well-choreographed series of morphological events. The dying cell experiences nuclear and cytoplasmic condensation and blebbing of the plasma membrane and, ultimately, disintegrates into membrane-enclosed components known as apoptotic bodies that comprise intact organelles and parts of the nucleus. The phagocytes and nearby cells quickly identify, consume, and disintegrate these apoptotic bodies. The complexes 2, 3, and 4 exhibiting lower IC50 values were subjected to AO/EB staining. Untreated HeLa cells (control), as seen in Fig. 14, display intact cell shape and uniformly distributed strong green fluorescence, while the cells treated with 2–4 show certain obvious morphological changes indicative of apoptosis, such as membrane blebbing and rounding of cells, caused by the death of cancer cells within 24 and 48 hours (Fig. 15). These studies demonstrate the potency of the present Cu(II) complexes as cytotoxic agents against HeLa cells, and also their propensity to cause apoptotic cell death, which follows the order 3 > 4 > 2.
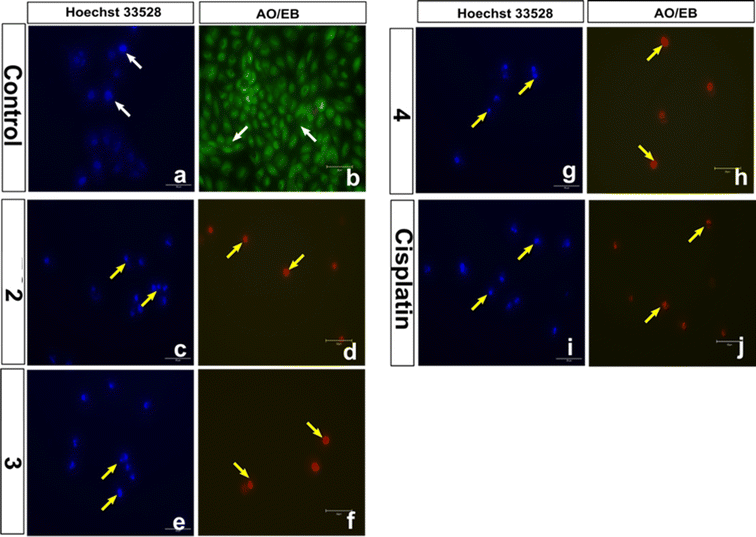 |
| | Fig. 14 Representative morphological changes observed in compound-treated HeLa cells; detected using AO/EB staining and Hoechst 33258 staining (white arrow indicates healthy cells and yellow arrow indicates apoptotic cells) (scale bar – 50 μm, 40× magnification). | |
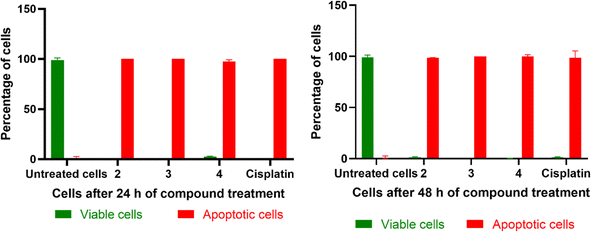 |
| | Fig. 15 Graph representing the percentage of normal cells and apoptotic cells in untreated cells (control), compound-treated cells (2, 3, 4), and cisplatin-treated cells for 24 h and 48 h incubation (data are mean% ± SD% of each triplicate). | |
The Hoechst 33258 staining studies reveal morphological alterations in cells treated with complexes 2, 3 and 4, which include chromatin fragmentation, bi- and/or multinucleation, cytoplasmic vacuolation, nuclear enlargement, cytoplasmic blebbing, and late apoptosis indicative of dot-like chromatin condensation (Fig. 14). Also, the number of abnormal cells rises with incubation time, demonstrating that all three complexes cause cytological alterations in a time-dependent way (Fig. 16). Interestingly, 4 induces more apoptotic cell death in spite of its lower cytotoxicity. Additional experimental supports are needed to justify the above observations; however, the protein binding data support the trend (4 > 3 > 2).
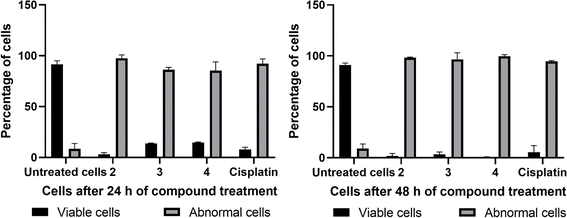 |
| | Fig. 16 Graphs representing the percentage of normal cells and cells with abnormal nuclei (abnormal cells) in untreated cells (control), compound-treated cells (2, 3, and 4), and cisplatin-treated cells for 24 h and 48 h (data are mean% ± SD% of each triplicate). | |
Intracellular ROS generation
Reactive oxygen species (ROS) have been proposed as potential mediators of copper(II) complex-induced apoptosis via oxidative stress. To quantify the intracellular ROS, a cell-permeable non-fluorescent compound 2′,7′-dichlorofluorescein diacetate (DCFH-DA) is employed for the present complexes. Upon entering the cell, the non-fluorescent DCFH-DA is deacetylated by the esterase in the cell and then oxidized by ROS to fluorescent DCF. The ability of 2 and 3, which show higher cytotoxicity, to generate ROS in HeLa cells at IC50 concentrations was investigated by adding DCFH-DA, and the fluorescence intensity of DCF with reference to the control was determined after 24 h (Fig. 17). Both complexes show an increase in fluorescence intensity of the cells, with 3 demonstrating a higher number of fluorescent cells. For 3, the amount of ROS produced is closely consistent with its reversible CuII/CuI redox couple, higher cytotoxicity, and ability to effect higher oxidative DNA cleavage (cf. above). The quantitative data also supports the ability of 3 to produce a higher amount of ROS in the cellular environment (Fig. 18). A similar trend was observed for the Cu(II) complex containing 2-formylpyridine-N4-phenylthiosemicarbazone and 2,2′-bipyridine,30 which shows reversible Cu(II)/Cu(I) redox process and higher ROS production. Whenever Cu(II) complexes are involved in a reversible redox process, the Cu(I) species escape from access by the more abundant intracellular Cu(I)-chelators such as glutathione (GSH) and metallothioneins (MTs),17,92,93 which do not allow the Cu(I) species to oxidize back to Cu(II). However, more research is required to illustrate the process of cell death effected by the complexes.
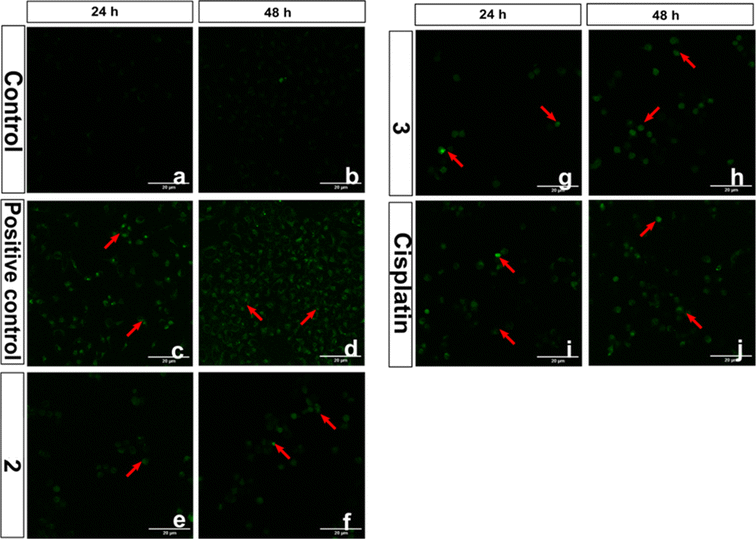 |
| | Fig. 17 Intracellular ROS levels evaluation in confocal microscope using DCFH-DA stain in HeLa cells treated with compounds (2 and 3), control drug cisplatin and 100 μM H2O2 positive control. The scale bar indicates 20 μm. Red coloured arrows indicate the presence of ROS in compound-treated HeLa cells. | |
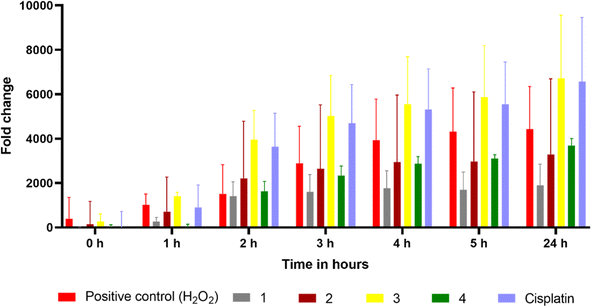 |
| | Fig. 18 Quantitative measurement of intracellular ROS levels for 0–24 h in complexes 1–4, cisplatin, and 100 μM H2O2-treated HeLa cells using DCFH-DA in a fluorescence multi-plate reader (data are mean% ± SD% of each triplicate). | |
Lipophilicity
Lipophilicity is one of the chemical absorption, distribution, metabolism, excretion, and toxicity (ADMET) properties that a drug must possess to cross the cell membrane.94–97 It is determined by measuring the partition coefficient (log![[thin space (1/6-em)]](https://www.rsc.org/images/entities/char_2009.gif) Po/w or log
Po/w or log![[thin space (1/6-em)]](https://www.rsc.org/images/entities/char_2009.gif) P) between octanol and water on a logarithmic scale.98–100 When determined by the shaking flask method, it typically ranges as −2 < log
P) between octanol and water on a logarithmic scale.98–100 When determined by the shaking flask method, it typically ranges as −2 < log![[thin space (1/6-em)]](https://www.rsc.org/images/entities/char_2009.gif) P < 4.101,102 The log
P < 4.101,102 The log![[thin space (1/6-em)]](https://www.rsc.org/images/entities/char_2009.gif) P values of the present complexes range from 1.067 to 2.917 (Table 6), and interestingly, complex 3 has a greater log
P values of the present complexes range from 1.067 to 2.917 (Table 6), and interestingly, complex 3 has a greater log![[thin space (1/6-em)]](https://www.rsc.org/images/entities/char_2009.gif) P value (2.917) than their analogous complexes and exhibits stronger hydrophobic interaction and higher cytotoxicity and ROS production.
P value (2.917) than their analogous complexes and exhibits stronger hydrophobic interaction and higher cytotoxicity and ROS production.
Conclusions
Mixed-ligand Cu(II) complexes, formulated as [Cu(L)(diimine)](NO3) 1–4, and containing a chromone-appended phenylthiosemicarbazone Schiff base (L) and a diimine like bpy, phen, 5,6-dmp, or dpq, have been synthesized and their potential as a cytotoxic agent studied by using many techniques. DFT calculations reveal that the optimized structures of the complexes possess a distorted square-pyramidal geometry. The tridentate primary ligand employs the thiolate sulphur, imine nitrogen and the carbonyl oxygen atom of the thiolate tautomer to strongly coordinate to Cu(II) meridionally, and one of the nitrogen atoms of the diimine co-ligand occupies the equatorial position while the other one the axial position at a longer distance. The involvement of enhanced π-delocalization of chromone moiety leads to an increase in g∥ value and positive values of Cu(II)/Cu(I) redox potential. Interestingly, 3 shows Cu(II)/Cu(I) redox behaviour more reversible than other complexes. The DNA binding studies reveal that the higher DNA binding affinity of the 5,6-dmp complex 3 is on account of the DNA groove binding, while those of dpq and phen complexes are on account of their extended aromatic rings. The 5,6-dmp complex 3 cleaves pUC19 plasmid DNA oxidatively in the presence of ascorbic acid, and the DNA cleavage is mediated by the generation of hydroxyl radical, which is supported by the Rhodamine B degradation assay the HSA binding study indicates that the dpq complex 4 shows a stronger protein binding affinity on account of the extended aromatic ring of the diimine. Molecular docking studies suggest that all the complexes bind in the minor groove of DNA and subdomain II of HSA, which are in close agreement with the experimental results. The higher DNA binding ability, lipophilicity, reversible CuII/CuI redox behaviour and ability to oxidatively cleave DNA, and the ability to produce ROS confers on 3 a remarkable cytotoxicity (IC50, 1.26 μM) against HeLa cervical cancer cells. Also, 3 is 5 times more potent than the currently used drug cisplatin. Further, the present mixed ligand complexes 2 (IC50, 1.73 μM) and 3 (IC50, 1.26 μM) demonstrate higher cytotoxicity than the already reported analogous mono- and bimetallic Cu(II) complexes (IC50, 2.24–15.4 μM) in HeLa cells.43 This observation reveals the importance of diimine co-ligands in conferring anticancer efficiency on the mixed ligand complexes. AO/EthBr staining assay illustrates that 3 induces remarkable apoptotic cell death and produces a higher amount of ROS intracellularly, which is consistent with its higher cytotoxicity and ability to effect oxidative DNA cleavage. As many chromone appended compounds act as potential drug molecules, it is expected that the present copper(II) complexes derived from a thiosemicarbazone appended with chromone moiety, which exhibit excellent and interesting in vitro cytotoxicity, would evolve as potent anticancer agents. However, more biological experiments are to be performed to unravel their cytotoxic potential. Nevertheless, the 5,6-dmp complex 3, which shows cytotoxic potential similar to other cytotoxic agents that have already entered clinical trials, has the potential to be developed as an ideal candidate for cancer therapy.
Data availability
The authors confirm that the data supporting the findings of this study are available within the article and its ESI.†
Author contributions
Anjaneyulu Mamindla: synthesis, characterization, methodology, investigation, writing – original draft, data curation. Dhanashree Murugan: in vitro anti-cancer experiments, writing, analysis. Manikandan Varadhan: molecular docking studies conceptualization, methodology, investigation, writing – original draft, visualization, data curation, software. Tamilarasan Ajaykamal: DFT calculation. Loganathan Rangasamy: in vitro anti-cancer experiments, writing, analysis, supervision. Mallayan Palaniandavar: validating DFT calculation, writing results and discussion, and overall editing. Venugopal Rajendiran: supervision, conceptualization, methodology, data curation, validation, overall review, and editing. All the authors reviewed the manuscript.
Conflicts of interest
There are no conflicts to declare.
Acknowledgements
V. R. thanks the Department of Biotechnology (DBT), New Delhi, for the research grant (BT/PR36476/NNT/28/1723/2020), DST-FIST (SR/FST/CS-1/2021/215), New Delhi. M. P. thanks the Indian National Science Academy (INSA), New Delhi, for the INSA Senior Scientist research grant. L. R. acknowledges DBT, New Delhi, for the DBT Ramalingaswami Re-entry Fellowship project (BT/RLF/Reentry/44/2018) and the Science and Engineering Research Board (SERB), New Delhi, for a Core Research Grant (CRG) (CRG/2020/001213), the Board of Research in Nuclear Sciences (BRNS) 54/14/03/2022-BRNS/10207, ICMR Extramural Small Grant (Discovery/IIRP/SG-2387/2023) and VIT SEED GRANT 2020–21, 2021–2022 for the financial support. The authors thank the Trichy Research Institute of Biotechnology Pvt. Ltd, Tiruchirappalli 620018, Tamil Nadu, India [website: https://www.trcbt.com] for the help in testing the complex 3 on human peripheral lymphocytes.
References
- P. Heffeter, V. F. S. Pape, É. A. Enyedy, B. K. Keppler, G. Szakacs and C. R. Kowol, Antioxid. Redox Signaling, 2018, 30, 1062–1082 CrossRef.
- K. C. Park, L. Fouani, P. J. Jansson, D. Wooi, S. Sahni, D. J. R. Lane, D. Palanimuthu, H. C. Lok, Z. Kovačević, M. L. H. Huang, D. S. Kalinowski and D. R. Richardson, Metallomics, 2016, 8, 874–886 CrossRef CAS PubMed.
- B. Heloisa and G. Dinorah, Mini Rev. Med. Chem., 2004, 4, 31–39 CrossRef.
- A. I. Matesanz, I. Leitao and P. Souza, J. Inorg. Biochem., 2013, 125, 26–31 CrossRef CAS.
- C. Vandana, Spectrochim. Acta, Part A, 2014, 129, 333–338 CrossRef.
- K. Alomar, A. Landreau, M. Allain, G. Bouet and G. Larcher, J. Inorg. Biochem., 2013, 126, 76–83 CrossRef CAS PubMed.
- Y. Gou, J. Wang, S. Chen, Z. Zhang, Y. Zhang, W. Zhang and F. Yang, Eur. J. Med. Chem., 2016, 123, 354–364 CrossRef CAS.
- G. Pelosi, Open Crystallogr. J., 2010, 3, 16–28 CrossRef CAS.
- J. J. Knox, S. J. Hotte, C. Kollmannsberger, E. Winquist, B. Fisher and E. A. Eisenhauer, Invest. New Drugs, 2007, 25, 471–477 CrossRef CAS PubMed.
- C. M. Nutting, C. M. L. Van Herpen, A. B. Miah, S. A. Bhide, J.-P. Machiels, J. Buter, C. Kelly, D. De Raucourt and K. J. Harrington, Ann. Oncol., 2009, 20, 1275–1279 CrossRef CAS.
- A. M. Traynor, J.-W. Lee, G. K. Bayer, J. M. Tate, S. P. Thomas, M. Mazurczak, D. L. Graham, J. M. Kolesar and J. H. Schiller, Invest. New Drugs, 2010, 28, 91–97 CrossRef CAS.
- C. Balachandran, J. Haribabu, K. Jeyalakshmi, N. S. P. Bhuvanesh, R. Karvembu, N. Emi and S. Awale, J. Inorg. Biochem., 2018, 182, 208–221 CrossRef CAS.
- D. Rogolino, A. Cavazzoni, A. Gatti, M. Tegoni, G. Pelosi, V. Verdolino, C. Fumarola, D. Cretella, P. G. Petronini and M. Carcelli, Eur. J. Med. Chem., 2017, 128, 140–153 CrossRef CAS.
- P. V Bernhardt, P. C. Sharpe, M. Islam, D. B. Lovejoy, D. S. Kalinowski and D. R. Richardson, J. Med. Chem., 2009, 52, 407–415 CrossRef.
- L. Ruiz-Azuara and M. E Bravo-Gomez, Curr. Med. Chem., 2010, 17, 3606–3615 CrossRef CAS.
- L. Finney, S. Vogt, T. Fukai and D. Glesne, Clin. Exp. Pharmacol. Physiol., 2009, 36, 88–94 CrossRef CAS.
- U. Jungwirth, C. R. Kowol, B. K. Keppler, C. G. Hartinger, W. Berger and P. Heffeter, Antioxid. Redox Signaling, 2011, 15, 1085–1127 CrossRef CAS.
- S. Tabassum, A. Asim, F. Arjmand, M. Afzal and V. Bagchi, Eur. J. Med. Chem., 2012, 58, 308–316 CrossRef CAS.
- J. Ravichandran, P. Gurumoorthy, M. A. I. Musthafa and A. K. Rahiman, Spectrochim.
Acta, Part A, 2014, 133, 785–793 CrossRef CAS PubMed.
- V. S. Periasamy, A. Riyasdeen, V. Rajendiran, M. Palaniandavar, H. Krishnamurthy, A. A. Alshatwi and M. A. Akbarsha, Molecules, 2020, 25, 4504 CrossRef CAS.
- D. X. West, A. E. Liberta, S. B. Padhye, R. C. Chikate, P. B. Sonawane, A. S. Kumbhar and R. G. Yerande, Coord. Chem. Rev., 1993, 123, 49–71 CrossRef CAS.
- H. Beraldo and D. Gambinob, Mini-Rev. Med. Chem., 2004, 4, 31–39 CrossRef CAS.
- D. S. Kalinowski, P. Quach and D. R. Richardson, Future Med. Chem., 2009, 1, 1143–1151 CrossRef CAS PubMed.
- F. Tisato, C. Marzano, M. Porchia, M. Pellei and C. Santini, Med. Res. Rev., 2010, 30, 708–749 CrossRef CAS.
- C. R. Kowol, P. Heffeter, W. Miklos, L. Gille, R. Trondl, L. Cappellacci, W. Berger and B. K. Keppler, J. Biol. Inorg. Chem., 2012, 17, 409–423 CrossRef CAS PubMed.
- J. Easmon, G. Pürstinger, G. Heinisch, T. Roth, H. H. Fiebig, W. Holzer, W. Jäger, M. Jenny and J. Hofmann, J. Med. Chem., 2001, 44, 2164–2171 CrossRef CAS PubMed.
- M. C. Miller, C. N. Stineman, J. R. Vance, D. X. West and I. H. Hall, Anticancer Res., 1998, 18, 4131–4139 CAS.
- B. M. Zeglis, V. Divilov and J. S. Lewis, J. Med. Chem., 2011, 54, 2391–2398 CrossRef CAS.
- K. Suzuki, S. Yahara, K. Maehata and M. Uyeda, J. Nat. Prod., 2001, 64, 204–207 CrossRef CAS PubMed.
- R. Kartikeyan, D. Murugan, T. Ajaykamal, M. Varadhan, L. Rangasamy, M. Velusamy, M. Palaniandavar and V. Rajendiran, Dalton Trans., 2023, 52, 9148–9169 RSC.
- S. Bhatnagar, S. Sahi, P. Kackar, S. Kaushik, M. K. Dave, A. Shukla and A. Goel, Bioorg. Med. Chem. Lett., 2010, 20, 4945–4950 CrossRef CAS.
- M. Kalanithi, D. Kodimunthiri, M. Rajarajan and P. Tharmaraj, Spectrochim. Acta, Part A, 2011, 82, 290–298 CrossRef CAS PubMed.
- J. Reedijk, Pure Appl. Chem., 1987, 59, 181–192 CrossRef CAS.
- S. Emami and Z. Ghanbarimasir, Eur. J. Med. Chem., 2015, 93, 539–563 CrossRef CAS PubMed.
- C. Liu, Z. Yang and M. Yan, J. Coord. Chem., 2012, 65, 3845–3850 CrossRef CAS.
- V. Y. Sosnovskikh, V. S. Moshkin and M. I. Kodess, Tetrahedron Lett., 2008, 49, 6856–6859 CrossRef CAS.
- M. Gaber, N. El-Wakiel, K. El-Baradie and S. Hafez, J. Iran. Chem. Soc., 2019, 16, 169–182 CrossRef CAS.
- S. Singh, A. T. Baviskar, V. Jain, N. Mishra, U. C. Banerjee, P. V Bharatam, K. Tikoo and M. P. S. Ishar, Medchemcomm, 2013, 4, 1257–1266 RSC.
- B. Wang, Z.-Y. Yang, M. Lü, J. Hai, Q. Wang and Z.-N. Chen, J. Organomet. Chem., 2009, 694, 4069–4075 CrossRef CAS.
- V. Barve, F. Ahmed, S. Adsule, S. Banerjee, S. Kulkarni, P. Katiyar, C. E. Anson, A. K. Powell, S. Padhye and F. H. Sarkar, J. Med. Chem., 2006, 49, 3800–3808 CrossRef CAS PubMed.
- M. Gaber, N. El-Wakiel, K. El-Baradie and S. Hafez, J. Iran. Chem. Soc., 2019, 16, 169–182 CrossRef CAS.
- G. Kalaiarasi, S. Rex Jeya Rajkumar, S. Dharani, N. P. Rath and R. Prabhakaran, Polyhedron, 2019, 173, 114120 CrossRef CAS.
- N. Balakrishnan, J. Haribabu, A. K. Dhanabalan, S. Swaminathan, S. Sun, D. F. Dibwe, N. Bhuvanesh, S. Awale and R. Karvembu, Dalton Trans., 2020, 49, 9411–9424 RSC.
- L. H. Damelin, R. Jivan, R. B. Veale, A. L. Rousseau and D. Mavri-Damelin, BMC Cancer, 2014, 14, 1–11 CrossRef.
- N. Alvarez, M. G. Kramer, J. Ellena, A. Costa-Filho, M. H. Torre and G. Facchin, Cancer Rep. Rev., 2018, 2, 1–5 CrossRef CAS.
- S. Karpagam, A. Mamindla, V. Kumar Sali, R. S. Niranjana, V. S. Periasamy, A. A. Alshatwi, M. A. Akbarsha and V. Rajendiran, Inorg. Chim. Acta, 2022, 531, 120729 CrossRef CAS.
- K. Radhakrishnan, T. Khamrang, K. Sambantham, V. K. Sali, U. Chitgupi, J. F. Lovell, A. A. Mohammad and R. Venugopal, Polyhedron, 2021, 194, 114886 CrossRef CAS.
- A. Mamindla, M. Varadhan, R. Kartikeyan, A. Amuthamozhi, M. A. Akbarsha and V. Rajendiran, Polyhedron, 2023, 243, 116534 CrossRef CAS.
- S. Karpagam, R. Kartikeyan, P. Paravai Nachiyar, M. Velusamy, M. Kannan, M. Krishnan, U. Chitgupi, J. F. Lovell, M. Abdulkader Akbarsha and V. Rajendiran, J. Coord. Chem., 2019, 72, 3102–3127 CrossRef CAS.
- I. Correia, S. Borovic, I. Cavaco, C. P. Matos, S. Roy, H. M. Santos, L. Fernandes, J. L. Capelo, L. Ruiz-Azuara and J. C. Pessoa, J. Inorg. Biochem., 2017, 175, 284–297 CrossRef CAS.
- L. Gasque, R. Moreno-Esparza and L. Ruiz-Ramírez, J. Inorg. Biochem., 1992, 48, 121–127 CrossRef CAS.
- W. L. Kwik, K. P. Ang and G. Chen, J. Inorg. Nucl. Chem., 1980, 42, 303–313 CrossRef CAS.
- G. Kalaiarasi, S. R. J. Rajkumar, S. Dharani, V. M. Lynch and R. Prabhakaran, Inorg. Chim. Acta, 2018, 471, 759–776 CrossRef CAS.
- I. Ali, W. A. Wani and K. Saleem, Synth. React. Inorg., Met.-Org., Nano-Met. Chem., 2013, 43, 1162–1170 CrossRef CAS.
- V. Rajendiran, R. Karthik, M. Palaniandavar, H. Stoeckli-Evans, V. S. Periasamy, M. A. Akbarsha, B. S. Srinag and H. Krishnamurthy, Inorg. Chem., 2007, 46, 8208–8221 CrossRef CAS.
- K. Radhakrishnan, T. Khamrang, K. Sambantham, V. K. Sali, U. Chitgupi, J. F. Lovell, A. A. Mohammad and R. Venugopal, Polyhedron, 2021, 194, 114886 CrossRef CAS.
- M. Vaidyanathan, R. Viswanathan, M. Palaniandavar, T. Balasubramanian, P. Prabhaharan and P. Muthiah, Inorg. Chem., 1998, 37, 6418–6427 CrossRef CAS PubMed.
- U. Sakaguchi and A. W. Addison, J. Chem. Soc., Dalton Trans., 1979, 600 RSC.
- T. Ajaykamal, M. Köckerling and M. Palaniandavar, Inorg. Chim. Acta, 2023, 556, 121673 CrossRef CAS.
- R. Balamurugan, M. Palaniandavar and R. Srinivasa Gopalan, Inorg. Chem., 2001, 40, 2246–2255 CrossRef CAS.
- U. Sivagnanam and M. Palaniandavar, J. Chem. Soc., Dalton Trans., 1994, 2277–2283 RSC.
- R. Loganathan, S. Ramakrishnan, E. Suresh, A. Riyasdeen, M. A. Akbarsha and M. Palaniandavar, Inorg. Chem., 2012, 51, 5512–5532 CrossRef CAS PubMed.
- M.-J. Li, T.-Y. Lan, X.-H. Cao, H.-H. Yang, Y. Shi, C. Yi and G.-N. Chen, Dalton Trans., 2014, 43, 2789–2798 RSC.
- C. Liu, J. Zhou and H. Xu, J. Inorg. Biochem., 1998, 71, 1–6 CrossRef CAS.
- M. Lee, A. L. Rhodes, M. D. Wyatt, S. Forrow and J. A. Hartley, Biochemistry, 1993, 32, 4237–4245 CrossRef CAS PubMed.
- S. M. G. Leite, L. M. P. Lima, S. Gama, F. Mendes, M. Orio, I. Bento, A. Paulo, R. Delgado and O. Iranzo, Inorg. Chem., 2016, 55, 11801–11814 CrossRef CAS PubMed.
- X.-H. Zou, B.-H. Ye, H. Li, J.-G. Liu, Y. Xiong and L.-N. Ji, J. Chem. Soc., Dalton Trans., 1999, 1423–1428 RSC.
- S. Ramakrishnan and M. Palaniandavar, Dalton Trans., 2008, 3866–3878 RSC.
- A. Sreedhara, J. D. Freed and J. A. Cowan, J. Am. Chem. Soc., 2000, 122, 8814–8824 CrossRef CAS.
- A. I. B. Romo, D. S. Abreu, T. F. Paulo, M. S. P. Carepo, E. H. S. Sousa, L. Lemus, C. Aliaga, A. A. Batista, O. R. Nascimento and H. D. Abruña, Chem.–Eur. J., 2016, 22, 10081–10089 CrossRef CAS.
- W. M. T. Q. de Medeiros, M. J. C. de Medeiros, E. M. Carvalho, J. A. de Lima, V. da S. Oliveira, A. C. F. B. Pontes, F. O. N. da Silva, J. A. Ellena, A. O. Hugo and E. H. S. de Sousa, RSC Adv., 2018, 8, 16873–16886 RSC.
- B. K. Santra, P. A. N. Reddy, G. Neelakanta, S. Mahadevan, M. Nethaji and A. R. Chakravarty, J. Inorg. Biochem., 2002, 89, 191–196 CrossRef CAS.
- S. Banerjee, A. Dixit, K. S. Maheswaramma, B. Maity, S. Mukherjee, A. Kumar, A. A. Karande and A. R. Chakravarty, J. Chem. Sci., 2016, 128, 165–175 CrossRef CAS.
- C. Sissi, F. Mancin, M. Gatos, M. Palumbo, P. Tecilla and U. Tonellato, Inorg. Chem., 2005, 44, 2310–2317 CrossRef CAS.
- N. Ibrahim, H. Ibrahim, S. Kim, J.-P. Nallet and F. Nepveu, Biomacromolecules, 2010, 11, 3341–3351 CrossRef CAS PubMed.
- X. M. He and D.
C. Carter, Nature, 1992, 358, 209–215 CrossRef CAS PubMed.
- T. Peters Jr, Adv. Protein Chem., 1985, 37, 161–245 CrossRef CAS PubMed.
- N. Shahabadi, S. M. Fili and S. Kashanian, J. Coord. Chem., 2018, 71, 329–341 CrossRef CAS.
- J. R. Lakowicz, in Principles of Fluorescence Spectroscopy, Springer, 1999, pp. 25–61 Search PubMed.
- M. Sharma, M. Ganeshpandian, A. Sanjeev, A. Tamilarasan, V. S. K. Mattaparthi, N. S. Islam and M. Palaniandavar, Inorg. Chim. Acta, 2020, 504, 119450 CrossRef CAS.
- M. Kumar, G. Kumar and D. T. Masram, New J. Chem., 2020, 44, 8595–8613 RSC.
- I. Yousuf, F. Arjmand, S. Tabassum, L. Toupet, R. A. Khan and M. A. Siddiqui, Dalton Trans., 2015, 44, 10330–10342 RSC.
- A. A. Olanrewaju, C. U. Ibeji and O. E. Oyeneyin, SN Appl. Sci., 2020, 2, 1–11 Search PubMed.
- Y. Wu, D. Bhattacharyya, C. L. King, I. Baskerville-Abraham, S. H. Huh, G. Boysen, J. A. Swenberg, B. Temple, S. L. Campbell and S. G. Chaney, Biochemistry, 2007, 46, 6477–6487 CrossRef CAS.
- K. Paliwal, P. Haldar, P. K. S. Antharjanam and M. Kumar, ACS Omega, 2022, 7, 21961–21977 CrossRef CAS.
- S. Mukherjee, K. Ganorkar, A. Kumar, N. Sehra and S. K. Ghosh, Bioorg. Chem., 2019, 84, 63–75 CrossRef CAS PubMed.
- R. A. C. Souza, W. R. P. Costa, E. F. Faria, M. A. S. Bessa, R. P. Menezes, C. H. G. Martins, P. I. S. Maia, V. M. Deflon and C. G. Oliveira, J. Inorg. Biochem., 2021, 223, 111543 CrossRef CAS PubMed.
- S. Al-Harthi, J. I. Lachowicz, M. E. Nowakowski, M. Jaremko and Ł. Jaremko, J. Inorg. Biochem., 2019, 198, 110716 CrossRef CAS PubMed.
- J. Mullaivendhan, I. Akbar, M. K. Gatasheh, A. A. Hatamleh, A. Ahamed, M. H. S. Abuthakir and R. Gurusamy, BMC Chem., 2023, 17, 1–16 CrossRef.
- B. P. Sharma, N. Channa, Y. Jiangnan, P. K. Chand, S. K. Pandey, B. P. Marasini, M. L. Sharma and S. Shrestha, J. Coord. Chem., 2024, 77, 1623–1644 CrossRef CAS.
- I. M. Ghobrial, T. E. Witzig and A. A. Adjei, Ca-Cancer J. Clin., 2005, 55, 178–194 CrossRef PubMed.
- P. A. W. P. J. Barnard, S. R. Bayly, J. P. Holland and J. R. Dil Worth, Nucl. Med. Mol. Imaging, 2008, 52, 235–244 CAS.
- A. Santoro, D. L. Pountney and G. Meloni, Chem. Soc. Rev., 2017, 46, 7683–7693 RSC.
- R. Mannhold, H. Kubinyi and G. Folkers, Drug Bioavailability: Estimation of Solubility, Permeability, Absorption and Bioavailability, John Wiley & Sons, 2009 Search PubMed.
- M. J. Waring, Expert Opin. Drug Discovery, 2010, 5, 235–248 CrossRef CAS.
- M. V. S. Varma, Z. A. Radi, C. J. Rotter, J. Litchfield and A. F. El-Kattan, Encycl. Drug Metab. Interact., 2011, 1–18 Search PubMed.
- A. Mälkiä, L. Murtomäki, A. Urtti and K. Kontturi, Eur. J. Pharm. Sci., 2004, 23, 13–47 CrossRef PubMed.
- C. M. Hansch and P. Peyton, Nature, 1962, 194, 178–180 CrossRef CAS.
- C. Hansch and T. Fujita, J. Am. Chem. Soc., 1964, 86, 1616–1626 CrossRef CAS.
- A. Leo and C. Hansch, Partit. coefficients their uses, Chem. Rev, 1971, 71, 525–616 CrossRef CAS.
- OECD, OECD Guidel. Test. Chem. Sect., 1992, 2, 1–8 Search PubMed.
- C. A. Lipinski, F. Lombardo, B. W. Dominy and P. J. Feeney, Adv. Drug Delivery Rev., 2012, 64, 4–17 CrossRef.
Footnote |
| † Electronic supplementary information (ESI) available: Materials, physical measurements, and experimental procedures, Fig. S1–S28, and Tables S1–S8. See DOI: https://doi.org/10.1039/d4ra04997g |
|
| This journal is © The Royal Society of Chemistry 2024 |
Click here to see how this site uses Cookies. View our privacy policy here.  Open Access Article
 c,
Loganathan Rangasamyb,
Mallayan Palaniandavar
 *c and
Venugopal Rajendiran
 *a
*a

![[double bond, length as m-dash]](https://www.rsc.org/images/entities/char_e001.gif) O) 1631 (m), ν(HC = N) 1546 (m), ν(C
O) 1631 (m), ν(HC = N) 1546 (m), ν(C![[double bond, length as m-dash]](https://www.rsc.org/images/entities/char_e001.gif) S) 848 (m). (br, broad; s, strong; w, weak; m, medium; vs., very strong). HR-MS (+) in MeOH (m/z): calculated for C17H13N3O2SNa [M + Na]+: 346.06207; found: 346.06249. 1H NMR (400 MHz, DMSO-d6): δ [ppm] 11.96 (s, 1H), 10.14 (s, 1H), 9.35 (s, 1H), 8.30 (s, 1H), 8.12 (d, J = 7.9 Hz, 1H), 7.85 (t, J = 8.2 Hz, 1H), 7.73 (d, J = 8.4 Hz, 1H), 7.57–7.53 (m, 3H), 7.38 (t, J = 7.6 Hz, 2H), 7.22 (t, J = 7.3 Hz, 1H). 13C NMR (100 MHz, DMSO-d6): δ [ppm] 176.4, 175.2, 156.2, 139.3, 135.1, 135.0, 128.6, 126.5, 126.4, 125.9, 125.6, 123.8, 119.2, 118.6.
S) 848 (m). (br, broad; s, strong; w, weak; m, medium; vs., very strong). HR-MS (+) in MeOH (m/z): calculated for C17H13N3O2SNa [M + Na]+: 346.06207; found: 346.06249. 1H NMR (400 MHz, DMSO-d6): δ [ppm] 11.96 (s, 1H), 10.14 (s, 1H), 9.35 (s, 1H), 8.30 (s, 1H), 8.12 (d, J = 7.9 Hz, 1H), 7.85 (t, J = 8.2 Hz, 1H), 7.73 (d, J = 8.4 Hz, 1H), 7.57–7.53 (m, 3H), 7.38 (t, J = 7.6 Hz, 2H), 7.22 (t, J = 7.3 Hz, 1H). 13C NMR (100 MHz, DMSO-d6): δ [ppm] 176.4, 175.2, 156.2, 139.3, 135.1, 135.0, 128.6, 126.5, 126.4, 125.9, 125.6, 123.8, 119.2, 118.6.
![[double bond, length as m-dash]](https://www.rsc.org/images/entities/char_e001.gif) O) 1600(m), ν(HC
O) 1600(m), ν(HC![[double bond, length as m-dash]](https://www.rsc.org/images/entities/char_e001.gif) N) 1566(w), ν(C–O) 1296(s), ν(N–N) 1029 (m), ν(C–S) 759(s). ΛM/Ω−1 cm2 mol−1: 55.
N) 1566(w), ν(C–O) 1296(s), ν(N–N) 1029 (m), ν(C–S) 759(s). ΛM/Ω−1 cm2 mol−1: 55.
![[double bond, length as m-dash]](https://www.rsc.org/images/entities/char_e001.gif) O) 1616(m), ν(HC
O) 1616(m), ν(HC![[double bond, length as m-dash]](https://www.rsc.org/images/entities/char_e001.gif) N) 1558(w), ν(C–O) 1288(s), ν(N–N) 1041(m), ν(C–S) 752(s). ΛM/Ω−1 cm2 mol−1: 59.
N) 1558(w), ν(C–O) 1288(s), ν(N–N) 1041(m), ν(C–S) 752(s). ΛM/Ω−1 cm2 mol−1: 59.
![[double bond, length as m-dash]](https://www.rsc.org/images/entities/char_e001.gif) O) 1608(m), ν(HC
O) 1608(m), ν(HC![[double bond, length as m-dash]](https://www.rsc.org/images/entities/char_e001.gif) N) 1558(w), ν(C–O) 1288(s), ν(N–N) 1033(m), ν(C–S) 759(s). ΛM/Ω−1 cm2 mol−1: 50.
N) 1558(w), ν(C–O) 1288(s), ν(N–N) 1033(m), ν(C–S) 759(s). ΛM/Ω−1 cm2 mol−1: 50.
![[double bond, length as m-dash]](https://www.rsc.org/images/entities/char_e001.gif) O) 1612(m), ν(HC
O) 1612(m), ν(HC![[double bond, length as m-dash]](https://www.rsc.org/images/entities/char_e001.gif) N) 1570(w), ν(C–O) 1288(s), ν(N–N) 1033(m), ν(C–S) 759(s). ΛM/Ω−1 cm2 mol−1: 55.
N) 1570(w), ν(C–O) 1288(s), ν(N–N) 1033(m), ν(C–S) 759(s). ΛM/Ω−1 cm2 mol−1: 55.
![[double bond, length as m-dash]](https://www.rsc.org/images/entities/char_e001.gif) N stretching vibration around 1546 cm−1, and the thiocarbonyl –C
N stretching vibration around 1546 cm−1, and the thiocarbonyl –C![[double bond, length as m-dash]](https://www.rsc.org/images/entities/char_e001.gif) S vibration at 848 cm−1 (Fig. S1†). The 1H-NMR spectrum of HL displays a singlet peak at 11.96 ppm, corresponding to the N–H functionality coupled to the azomethine group. The chemical shift value of 10.14 ppm (singlet) corresponds to the N–H proton that is flanked between the phenyl and C
S vibration at 848 cm−1 (Fig. S1†). The 1H-NMR spectrum of HL displays a singlet peak at 11.96 ppm, corresponding to the N–H functionality coupled to the azomethine group. The chemical shift value of 10.14 ppm (singlet) corresponds to the N–H proton that is flanked between the phenyl and C![[double bond, length as m-dash]](https://www.rsc.org/images/entities/char_e001.gif) S groups. The azomethine –CH proton appears as a singlet at 9.35 ppm. All the aromatic protons appear in the range of 8.30–7.20 ppm. The carbon signals for azomethine (–C
S groups. The azomethine –CH proton appears as a singlet at 9.35 ppm. All the aromatic protons appear in the range of 8.30–7.20 ppm. The carbon signals for azomethine (–C![[double bond, length as m-dash]](https://www.rsc.org/images/entities/char_e001.gif) N) and thione (–C
N) and thione (–C![[double bond, length as m-dash]](https://www.rsc.org/images/entities/char_e001.gif) S) functionals appear in the 13C-NMR spectrum at 156.23 and 176.43 ppm, respectively. All the aromatic 13C signals appear in the 118.62–139.38 ppm range. Also, the formation of HL is confirmed by the HRMS spectrum (Fig. S6†), which shows a molecular ion peak at the mass value of 346.06249 [M + Na]+.
S) functionals appear in the 13C-NMR spectrum at 156.23 and 176.43 ppm, respectively. All the aromatic 13C signals appear in the 118.62–139.38 ppm range. Also, the formation of HL is confirmed by the HRMS spectrum (Fig. S6†), which shows a molecular ion peak at the mass value of 346.06249 [M + Na]+.
![[double bond, length as m-dash]](https://www.rsc.org/images/entities/char_e001.gif) N and –C–S stretching vibrations appear in the frequency ranges of 1558 to 1570 cm−1 and 752 to 759 cm−1, respectively. The presence of ν(C
N and –C–S stretching vibrations appear in the frequency ranges of 1558 to 1570 cm−1 and 752 to 759 cm−1, respectively. The presence of ν(C![[double bond, length as m-dash]](https://www.rsc.org/images/entities/char_e001.gif) N) and ν(C–S) suggests that the primary ligand is coordinated to copper(II) (Fig. S2–S5†). The ν(C
N) and ν(C–S) suggests that the primary ligand is coordinated to copper(II) (Fig. S2–S5†). The ν(C![[double bond, length as m-dash]](https://www.rsc.org/images/entities/char_e001.gif) S) stretching frequency in the complexes appears with values lower than that in the free ligand, suggesting that the thione group undergoes thione to thiol tautomerization upon coordination with the metal center.53 The ν(C
S) stretching frequency in the complexes appears with values lower than that in the free ligand, suggesting that the thione group undergoes thione to thiol tautomerization upon coordination with the metal center.53 The ν(C![[double bond, length as m-dash]](https://www.rsc.org/images/entities/char_e001.gif) O) peak of the free ligand (1631 cm−1) is also shifted to lower values (1, 1600; 2, 1616; 3, 1608; 4, 1612 cm−1), confirming the coordination of the carbonyl group of chromone moiety with Cu(II). The ν(C
O) peak of the free ligand (1631 cm−1) is also shifted to lower values (1, 1600; 2, 1616; 3, 1608; 4, 1612 cm−1), confirming the coordination of the carbonyl group of chromone moiety with Cu(II). The ν(C![[double bond, length as m-dash]](https://www.rsc.org/images/entities/char_e001.gif) O) values of bpy (1, 1600 cm−1) and 5,6-dmp (3, 1608 cm−1) complexes are lower than those for phen (2, 1616 cm−1) and dpq complexes (4, 1612 cm−1), implying stronger σ-bonding and higher π-back bonding of C
O) values of bpy (1, 1600 cm−1) and 5,6-dmp (3, 1608 cm−1) complexes are lower than those for phen (2, 1616 cm−1) and dpq complexes (4, 1612 cm−1), implying stronger σ-bonding and higher π-back bonding of C![[double bond, length as m-dash]](https://www.rsc.org/images/entities/char_e001.gif) O group with Cu(II). The molar conductivity in DMF (50–59 ΛM/Ω−1 cm2 mol−1) reveals that all the complexes exist as 1
O group with Cu(II). The molar conductivity in DMF (50–59 ΛM/Ω−1 cm2 mol−1) reveals that all the complexes exist as 1![[thin space (1/6-em)]](https://www.rsc.org/images/entities/char_2009.gif) :
:![[thin space (1/6-em)]](https://www.rsc.org/images/entities/char_2009.gif) 1 electrolytes in solution (Table S1†).54 The TGA experiments were performed from RT to 700 °C under N2 atmosphere to study the thermal stability of the complexes 1–4. All the complexes show good thermal stability up to 200 °C and no noticeable weight loss is observed in the range 80–150 °C, which confirms that no coordinated and lattice water molecules are present in the complexes43 (Fig. S13†). From the observed TGA curves we could not observe any defined intermediaries even after 200 °C.
1 electrolytes in solution (Table S1†).54 The TGA experiments were performed from RT to 700 °C under N2 atmosphere to study the thermal stability of the complexes 1–4. All the complexes show good thermal stability up to 200 °C and no noticeable weight loss is observed in the range 80–150 °C, which confirms that no coordinated and lattice water molecules are present in the complexes43 (Fig. S13†). From the observed TGA curves we could not observe any defined intermediaries even after 200 °C.
![[thin space (1/6-em)]](https://www.rsc.org/images/entities/char_2009.gif) 772)
772)![[thin space (1/6-em)]](https://www.rsc.org/images/entities/char_2009.gif) 500)
500)![[thin space (1/6-em)]](https://www.rsc.org/images/entities/char_2009.gif) 318)
318)![[double bond, length as m-dash]](https://www.rsc.org/images/entities/char_e001.gif) O) values observed for the complexes compared to uncoordinated ligand. Similar higher g∥ values have been observed when flavonolates are coordinated to copper(II).59 Also, an increase in g∥ and decrease in A∥ values and a slightly higher value of g∥/A∥ quotient (136–140 cm) reveals that the complexes have a slightly distorted square-based geometry around Cu(II). This is supported by the calculated values of the trigonality index (τ, 0.30–0.38), which corresponds to the trigonal bipyramidal distorted square pyramidal geometries (TBDSP) around Cu(II), distorted by the presence of strong axial bonding by the nitrogen atom of chelated diamine co-ligand. Further, the observation of five N-super hyperfine (N-shf) lines on the low field parallel component and the perpendicular component reveals that the square-based coordination geometry around Cu(II) is only slightly distorted in solution and that the basal plane contains only two sp2 hybridized nitrogen atoms, one from the diimine ligand and the other from the primary ligand (Fig. S18†).
O) values observed for the complexes compared to uncoordinated ligand. Similar higher g∥ values have been observed when flavonolates are coordinated to copper(II).59 Also, an increase in g∥ and decrease in A∥ values and a slightly higher value of g∥/A∥ quotient (136–140 cm) reveals that the complexes have a slightly distorted square-based geometry around Cu(II). This is supported by the calculated values of the trigonality index (τ, 0.30–0.38), which corresponds to the trigonal bipyramidal distorted square pyramidal geometries (TBDSP) around Cu(II), distorted by the presence of strong axial bonding by the nitrogen atom of chelated diamine co-ligand. Further, the observation of five N-super hyperfine (N-shf) lines on the low field parallel component and the perpendicular component reveals that the square-based coordination geometry around Cu(II) is only slightly distorted in solution and that the basal plane contains only two sp2 hybridized nitrogen atoms, one from the diimine ligand and the other from the primary ligand (Fig. S18†).


![[thin space (1/6-em)]](https://www.rsc.org/images/entities/char_2009.gif) P
P![[thin space (1/6-em)]](https://www.rsc.org/images/entities/char_2009.gif) Po/w or log
Po/w or log![[thin space (1/6-em)]](https://www.rsc.org/images/entities/char_2009.gif) P) between octanol and water on a logarithmic scale.98–100 When determined by the shaking flask method, it typically ranges as −2 < log
P) between octanol and water on a logarithmic scale.98–100 When determined by the shaking flask method, it typically ranges as −2 < log![[thin space (1/6-em)]](https://www.rsc.org/images/entities/char_2009.gif) P < 4.101,102 The log
P < 4.101,102 The log![[thin space (1/6-em)]](https://www.rsc.org/images/entities/char_2009.gif) P values of the present complexes range from 1.067 to 2.917 (Table 6), and interestingly, complex 3 has a greater log
P values of the present complexes range from 1.067 to 2.917 (Table 6), and interestingly, complex 3 has a greater log![[thin space (1/6-em)]](https://www.rsc.org/images/entities/char_2009.gif) P value (2.917) than their analogous complexes and exhibits stronger hydrophobic interaction and higher cytotoxicity and ROS production.
P value (2.917) than their analogous complexes and exhibits stronger hydrophobic interaction and higher cytotoxicity and ROS production.


