 Open Access Article
Preparation of biomass-derived red emission carbon dots for real-time and long-term tracking of cells and tumor growth
Yuefang Hu†
 a,
Yuxin Chen†a,
Wenwang Wei*a and
Hanfu Liu*b
aGuangxi Key Laboratory of Calcium Carbonate Resources Comprehensive Utilization, College of Materials and Chemical Engineering, Hezhou University, Hezhou, Guangxi 542899, China. E-mail: 635775053@qq.com
bCollege of Pharmacy, Guilin Medical University, Guilin, Guangxi 541004, China
First published on 19th November 2024
Abstract
Effective real-time cell tracking and tumor growth monitoring are important for precise diagnosis and therapy of tumors and can also be used to monitor biological processes. In this study, a facile, green microwave method was developed to synthesize biomass-derived red emission carbon dots (RCDs) using the ethanolic extract of holly leaves. Owing to the advantages of the prepared RCDs, such as near infrared emission, stability, strong fluorescence intensity, excellent biocompatibility, penetration of thick tissues, avoiding background fluorescence interference, and improvement of the signal-to-noise ratio of biological imaging, they were applied to cell imaging, real-time cell tracking and tumor growth monitoring. Experimental results revealed that the RCDs could present strong red fluorescence emission when they entered the cells. The labeled cells still emitted red fluorescence after 13 generations of passage and could monitor tumor growth in real-time for more than 18 days. These results indicated that RCDs could be used as effective long-term near-infrared fluorescent imaging probes for cells and tumors, presenting broad application prospects in image-guided therapy.
1 Introduction
In recent years, urbanization and industrialization have led to changes in environmental factors and people's lifestyle. The incidence of malignant tumors (cancer), recognized as one of the most challenging diseases with a high mortality rate, has been steadily increasing in China, seriously threatening public health and life.1 With the rapid development of modern medicine, some cancers can be effectively diagnosed and cured.2,3 At present, the primary diagnostic methods for cancer include ultrasonic imaging, single-photon emission computed tomography, positron emission tomography, X-ray computed tomography, magnetic resonance imaging, and other molecular imaging methods.4,5 However, these detection methods entail unavoidable radiation risks and, unfortunately, exhibit deficiencies in specificity, sensitivity, resolution, and other aspects.6In addition, cancer cells are prone to spreading through blood circulation or transferring to other parts of the lymphatic system, exacerbating cancer and making the treatment more challenging.7,8 Chemotherapy combined with surgery to remove the primary tumor and some surrounding normal tissue is the usual treatment; however, early metastasis and the dissemination of tumor cells may not manifest clinically, escaping detection by the naked eye or tumor diagnostic techniques, resulting in postoperative tumor recurrence and metastasis in several cancer patients.9,10 Therefore, effective real-time monitoring of tumor cells and tumor growth can significantly improve cancer treatment and prognostic assessment of patients.11
Recently, long-term in vivo fluorescent tracers, a highly sensitive and noninvasive technique, have been applied by researchers in cancer diagnosis, tumor growth monitoring, image-guided surgery, and other fields considering that they allow visualization of the tumor location and evaluation of its growth process.12,13 Red emission fluorescent materials have excellent optical performance and present the unique structure and size characteristics of nanomaterials. They can prevent interferences from the body itself, deepen the depth of penetration into the tissue, quickly cross through the cell membrane, and extend the residence time within the cell. Recently, they have received extensive attention from researchers in the fields of real-time cell tracking and tumor growth monitoring.
At present, the most widely used near-infrared fluorescence imaging probes are organic fluorescent materials and inorganic quantum dots.14 However, some quantum dots are more toxic to organisms, limiting their use in long-term imaging.15,16 Red emission carbon dots (RCDs), whose fluorescence emission spectrum ranges between 650 and 900 nm, possess smaller radiant energy; moreover, few organisms exhibit autofluorescence in this range with minimal absorption by hemoglobin, water, and lipids in living organisms.17,18 In addition, RCDs can generate optical signals in deep tissues with little effect on the tissues themselves, avoiding background interference and allowing for high analysis sensitivity. In particular, compared with cadmium telluride (CdTe) and cadmium selenide (CdSe), environmentally friendly materials, RCDs exhibited obvious superiority for human body analysis when applied to biological sample analysis, tracking, and other fields.19 So far, many RCDs have been successfully synthesized and applied to cell imaging.20–23 However, some RCDs have disadvantages, like use of toxic chemical precursors, weak fluorescence emission in the near-infrared region, complex post-processing, and high cost. Thus, it is significant and urgent to establish a greener, simpler, and cheaper approach to prepare RCDs with excellent performance.
In the present study, biomass-derived RCDs were successfully prepared by one-step microwave treatment using the extract of holly leaves as the precursor. The maximum emission peak of the obtained RCDs was 684 nm, and they presented good water solubility, light stability, biological compatibility, and low toxicity. Owing to these advantages, the RCDs could be used as a near infrared fluorescence imaging probe and could be applied to cell imaging, real-time and long-time cell tracking in vitro, and real-time and long-time tumor growth monitoring in vivo. The schematic illustration of the preparation of biomass derived carbon dot near infrared fluorescence imaging probes for real-time cell tracking and tumor growth monitoring is shown in Scheme 1.
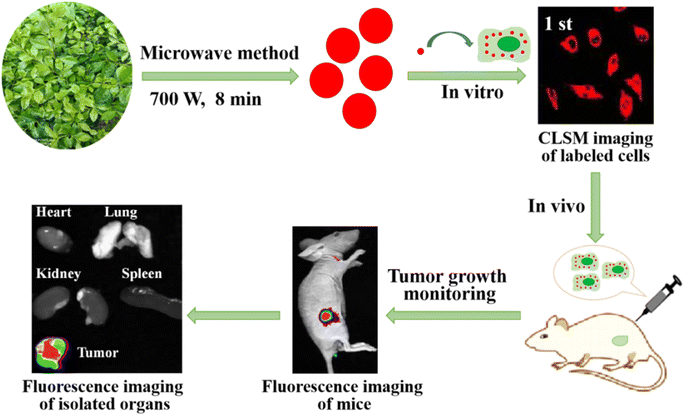 | ||
| Scheme 1 Schematic illustration of the preparation of biomass derived carbon dot near infrared fluorescence imaging probes for real-time cell tracking and tumor growth monitoring. | ||
2 Experimental section
2.1 Materials
Holly leaves were collected on the campus of Hezhou University (Hezhou, China). Fetal bovine serum, high sugar medium (Dulbecco's modified Eagle medium (DMEM)), pancreatin, and 100 U penicillin–streptomycin were purchased from Sigma Company (USA). Human normal liver cells (HL-7702 cells), human liver cancer cells (HepG2 cells), human bladder cancer cells (T24 cells), and human cervical cancer cells (HeLa cells) were purchased from Dingguo Biological Technology Co., Ltd (Beijing, China). Cell Counting Kit-8 (CCK-8) was purchased from Aladdin Corporation (Shanghai, China). BALB/C nude mice (5–6 weeks old) were purchased from Shanghai Experimental Animals Co., Ltd (Shanghai, China). Dialysis bags (molecular weight cut-off (MWCO): 1000 Da, pore size: ca. 1.0 nm) were purchased from Bioengineering Co., Ltd (Shanghai, China). 1,3-Diphenyl isobenzofuran (DPBF), phosphate-buffered solution (PBS) and other chemical reagents used in the experiment were all analytically pure and acquired in China. The water used in the experiment was prepared by using a water purification system (Millipore, Bedford, MA).2.2 Apparatus
Transmission electron microscopy (TEM) images were taken on a Tecnai G2 F20 transmission electron microscope (FEI, USA) to record RCDs' appearance and morphology and measure RCDs' size. An FTIR spectrometer (FTIR-Spectrum Two, USA) was used to evaluate the presence of organic ingredients in RCDs. The composition and crystallographic structures of RCDs were analyzed by using X-ray photoelectron spectroscopy (XPS, ESCALAB 250Xi, USA). Their UV-vis absorption spectra were collected on a Cary 60 UV-vis spectrophotometer (Agilent, USA). Fourier transform infrared (FT-IR) spectra were recorded using a PE Spectrum One FT-IR spectrometer (PE, USA). Cell imaging was performed by a confocal laser scanning microscope LSM710 (Zeiss, Germany). A Bruker FX Pro small animal living imager (Bruker MI SE, Billerica, MA, USA) was used for living imaging analysis of mice, and the supporting software (Bruker Molecular Imaging) was used to process the images.2.3 Synthesis of RCDs
Fresh holly leaves were immersed in anhydrous ethanol and stirred continuously for 5 hours. The extract was then centrifuged at 6000 rpm for 20 minutes to obtain a clear supernatant. Subsequently, the supernatant was filtered and concentrated using a rotating evaporator until a slurry sample appeared. The slurry sample was then mixed with a small amount of ultrapure water and heated in a typical ceramic crucible in a 750 W power microwave oven for 8 minutes. After heating, the residue was dispersed in anhydrous ethanol. Pure RCDs were obtained by further filtration through a 0.22 μm filter.2.4 Calculation of fluorescence quantum yield and fluorescence lifetime
Comparing the quantum yield (QYref) value of quinine sulfate in a 0.1 mol L−1 sulfuric acid solution, the fluorescence quantum yield (QYsam) of RCD samples was calculated using the following formula:| QYsam = QYref × (Isam/Iref) × (Aref/Asam) × (ηsam2/ηref2) |
In this formula, I represents the total emission intensity, and η and A represent the refractive index and optical density, respectively.
The time-resolved fluorescence decay curve is used to estimate the fluorescence lifetime, and the average fluorescence lifetime is calculated by the following formula:
| τ = (B1τ1 + B2τ2 + B3τ3)/(B1 + B2 + B3) |
2.5 Cell cytotoxicity and imaging
HepG2 cells were inoculated into a 96-well cell culture plate and incubated in an incubator at 37 °C with a 5% CO2 atmosphere. When the growth density of HepG2 cells reached approximately 80%, the extracellular medium was removed, and solutions of RCDs at concentrations of 0, 10, 30, 50, 100, and 300 μg mL−1 were added to each well of the cell culture plate. The plate was then returned to the incubator and incubated for 24 hours under the same conditions. After incubation, the cells were washed and incubated for 4 hours with 200 μL of fresh medium containing 20 μL of 20% 3-(4,5-dimethylthiazol-2-yl)-2,5-diphenyltetrazolium bromide (MTT). Subsequently, the mixture was further incubated for 4 hours. Next, the culture medium was removed, and 100 μL of dimethyl sulfoxide (DMSO) was added to each well to react with the cells for 15 minutes. The absorbance of the wells was then measured optically based on enzyme-linked immunosorbent assay at 570 nm to assess the cytotoxicity of RCDs.When the growth density of HL-7702 cells, HepG2 cells, T24 cells, and HeLa cells reached approximately 80%, they were digested with trypsin, and the resulting cell suspension was inoculated into 35 mm cell culture dishes for confocal laser scanning microscope (CLSM) analysis (with approximately 2.0 × 10⁴ cells per dish). The cell culture dishes were then placed in an incubator at 37 °C with a 5% CO2 atmosphere for 24 hours. Following incubation, the cells were treated with 10 μg mL−1 RCDs in cell culture medium at 37 °C with a 5% CO2 atmosphere for 40 minutes. Subsequently, the cells were rinsed with cell culture medium three times before imaging using a CLSM. During imaging, the excitation wavelength was set at 417 nm, and fluorescence in the range of 620–700 nm was collected for image acquisition.
2.6 Real-time and long-term tracking of cells
HepG2 cells were seeded in 48-well culture plates at a density of 3 × 10⁴ cells per well or in confocal microscope dishes with 5 × 10⁴ cells. After allowing the cells to fully attach, the old DMEM culture medium was discarded, and a 10 μg mL−1 solution of RCDs was added to the culture flask. Following incubation at 37 °C for 4 hours, the cells were washed with PBS and detached by adding 0.6 mL of trypsin for 1 to 2 minutes. Subsequently, the detached cells were gently agitated, and centrifuged at 1000 rpm for 2 minutes, the trypsin digestion solution was discarded, fresh medium was added, and the cell suspension was diluted by half. The cells were then inoculated into the culture dish and placed back into the cell incubator at 37 °C with a 5% CO2 atmosphere for subculture. At specific time intervals, the cells were detached and suspended using trypsin digestion solution, fixed with 4% paraformaldehyde for 15 minutes, and imaged using a laser confocal microscope with the excitation wavelength set at 417 nm. Fluorescence in the range of 620–700 nm was collected for imaging, and intracellular fluorescence was observed.2.7 In vivo real-time and long-term tumor growth monitoring
BALB/C nude mice were kept in the animal laboratory of Guangxi Normal University. All in vivo procedures performed in this study were approved by the Animal Care and Use Committee of Guangxi Normal University, in line with current ethical considerations and following the guidelines for the Care and Use of Experimental Animals. After HepG2 cells adhered to the wall, the culture medium was changed to a 20 μg mL−1 solution of RCDs for 4 hours. Subsequently, the culture solution was discarded, and the cells were digested and suspended in trypsin digestion solution. The solution was centrifuged at 1000 rpm for 2 minutes, and then the clear liquid was removed. DMEM culture solution was added. The HepG2 cell suspension was subcutaneously injected into the upper leg of nude mice (1 × 10⁶ cells/100 μL of DMEM solution). Following tumor cell inoculation in nude mice in vivo, at specified time intervals (0, 3, 6, 9, 12, and 18 days), the mice were anesthetized with isoflurane, and in vivo imaging experiments were carried out using a small animal imager (Bruker FX Pro, with 600 nm excitation and 684 nm emission).Then, the nude mice were anesthetized again with isoflurane and dissected. The hearts, livers, spleens, lungs, kidneys, and tumors of the nude mice were collected and subjected to fluorescent imaging using the small animal imager.
2.8 Histological analysis
After the fluorescence imaging experiments, the hearts, livers, spleens, lungs, kidneys, and tumors of nude mice were fixed with 4% paraformaldehyde for 24 hours. They were then stained with H&E and photographed using an inverted microscope for histological analysis.3 Results and discussion
3.1 Characterization of RCDs
The morphology of RCDs was characterized by transmission electron microscopy (TEM). Fig. 1a shows the TEM image of RCDs, revealing uniform spherical dots with good dispersion.24 The inset of Fig. 1a presents the high-resolution TEM image of RCDs, depicting a clear lattice spacing of 0.24 nm, similar to the (100) diffraction surface of graphite. By analyzing approximately 100 RCD particles, the size distribution diagram is depicted in Fig. 1b. It can be observed that the particle diameter of RCD nanoparticles ranged between 2.0 and 4.5 nm, with an average diameter of about 3.5 nm.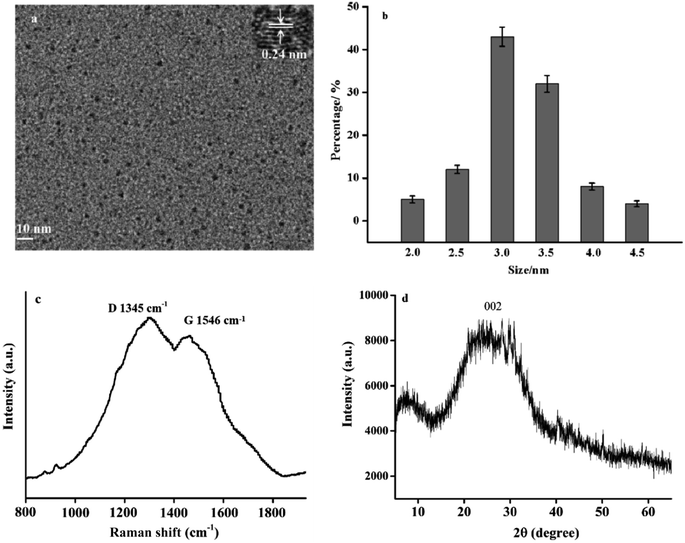 | ||
| Fig. 1 (a) The TEM of RCDs (inset: high-resolution TEM); (b) distribution diagram of particle size; (c) the Raman spectra of RCDs; (d) XRD spectra of RCDs. | ||
Raman spectra are used to confirm the degree of graphite crystallization of the synthesized RCDs. As shown in Fig. 1c, two bands at 1345 and 1546 cm−1 appear in the Raman spectra of RCDs, representing the D and G bands of RCDs, respectively.24 Raman spectra show that RCDs are composed of graphite sp2 carbon atoms and sp3 carbon defects, and the coexistence of the two peaks indicates that RCDs have a locally irregular graphene-like structure.
The crystal structure of RCDs was studied by XRD. Fig. 1d shows the XRD pattern of RCDs. A wide diffraction peak appears at the position of 22.1°, which is considered to be the crystal face of the amorphous carbon structure. The characteristic diffraction peak structure of other graphite is excluded, indicating that the crystal face of these RCDs is similar to that of graphite (002).25
Fig. 2a shows the Fourier transform infrared (FT-IR) spectrum of RCDs in the wavelength range of 500–4000 cm−1. FT-IR confirmed the surface functional groups of RCDs, shown in the figure. The synthesized RCDs revealed the main absorption band at 3329 cm−1 related to the O–H bond.25 The band at 2946 cm−1 belongs to C–H bond tensile vibration. Besides, the tensile vibration of C![[double bond, length as m-dash]](https://www.rsc.org/images/entities/char_e001.gif) O/C
O/C![[double bond, length as m-dash]](https://www.rsc.org/images/entities/char_e001.gif) C at 1603 cm−1 and the bending vibration of C–O at 1040 cm−1 are observed.26 The FT-IR spectrum confirmed that the carbonyl, hydroxyl, aminogroups of the RCDs are very abundant, which could improve the hydrophilicity of the RCD.27
C at 1603 cm−1 and the bending vibration of C–O at 1040 cm−1 are observed.26 The FT-IR spectrum confirmed that the carbonyl, hydroxyl, aminogroups of the RCDs are very abundant, which could improve the hydrophilicity of the RCD.27
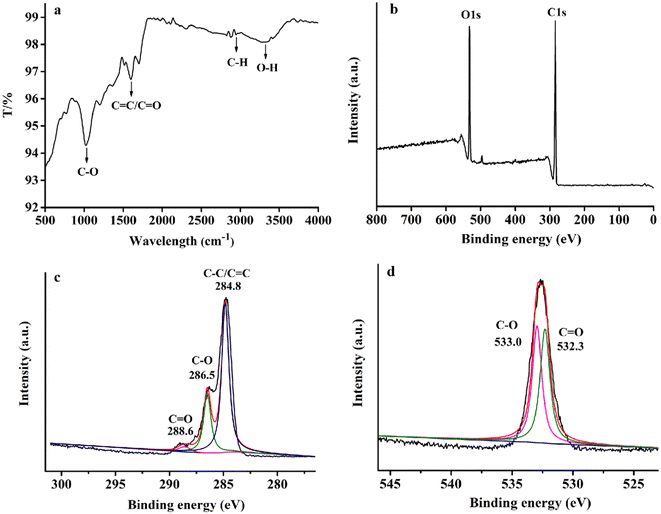 | ||
| Fig. 2 FT-IR spectra of RCDs (a), XPS spectra of RCDs (b) and the high-resolution XPS spectra of C1s and O1s, respectively (c), (d). | ||
The composition and surface bonding states of RCDs were further verified by XPS characterization. As shown in Fig. 2b, two typical peaks located at 285.6 eV and 532.5 eV appeared in the full XPS scanning spectrum, respectively, representing the typical peaks of C1s and O1s.28 Moreover, the high-resolution XPS spectra of C1s (Fig. 2c) present three peaks at 284.8, 286.5, and 288.6 eV, indicating the presence of C–C/C![[double bond, length as m-dash]](https://www.rsc.org/images/entities/char_e001.gif) C, C–O, and C
C, C–O, and C![[double bond, length as m-dash]](https://www.rsc.org/images/entities/char_e001.gif) O on the surface of RCDs. The high-resolution XPS spectra of O1s (Fig. 2d) show two main bands at 532.3 eV and 533.0 eV, corresponding to C
O on the surface of RCDs. The high-resolution XPS spectra of O1s (Fig. 2d) show two main bands at 532.3 eV and 533.0 eV, corresponding to C![[double bond, length as m-dash]](https://www.rsc.org/images/entities/char_e001.gif) O and C–O bonds, respectively.29 These XPS spectra revealed the existence of the same elements and functional groups as the FT-IR spectra, which confirms that C has been successfully doped into the skeleton of the red emission carbon dots and validates a carbonyl and hydroxyl group rich environment on the surface of the RCDs.
O and C–O bonds, respectively.29 These XPS spectra revealed the existence of the same elements and functional groups as the FT-IR spectra, which confirms that C has been successfully doped into the skeleton of the red emission carbon dots and validates a carbonyl and hydroxyl group rich environment on the surface of the RCDs.
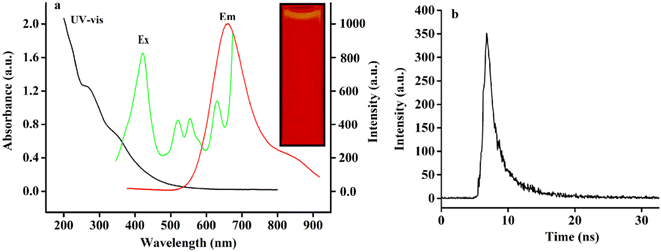
In order to study the optoelectronic properties of RCDs, the fluorescence spectra (FL) and UV-vis spectra of RCDs were measured. The UV-vis spectrum (black spectrum) of RCDs at room temperature presents two characteristic peaks at 276 and 340 nm (Fig. 3). It is reported that the 276 nm peak belongs to the π → π* transition in the aryl ring sp2 domain.30 The peak at 340 nm is attributed to the capture of excited-state energy.31 As can be seen from the figure, the maximum emission wavelength of RCDs is 684 nm (red Em spectrum). The emission wavelength was set at 684 nm and the excitation spectra (green Ex spectra) of RCDs were obtained by scanning. The red emission of RCDs may be due to the carbonization of chlorophyll extract of holly leaves in a high temperature microwave oven (>150 °C, 8 min), and the oxidation process, decomposition or modification. The intense oxidation process leads to the formation of oxygen-containing functional groups with different structures and involves the adjustment of oxidation states, which leads to the reduction of band gap and the production of red emission fluorescence.32
From the excitation spectra, it was clear that the RCD solution could excite and emit near infrared fluorescence at 417 nm, 513 nm, 545 nm and 632 nm. The Ex and Em spectra of RCDs show that the RCDs prepared have near infrared excitation and emission, which indicates that the RCDs have great prospects for in vivo and in vitro visualization imaging and biomedical applications.
With quinine sulfate as the reference, the QY of RCDs prepared from holly leaves was 19.88%. The fluorescence lifetime refers to the time when the fluorescence produced by the fluorescent material is excited by a transient time pulse and attenuates to a certain degree with time. By calculation, and as shown in Fig. 3b, the fluorescence lifetime of RCDs is 4.08 ns (τ1 = 2.07 and τ2 = 6.47). It shows that the RCDs have great potential for application in biological imaging and other fields.
3.2 Fluorescence stability of RCDs
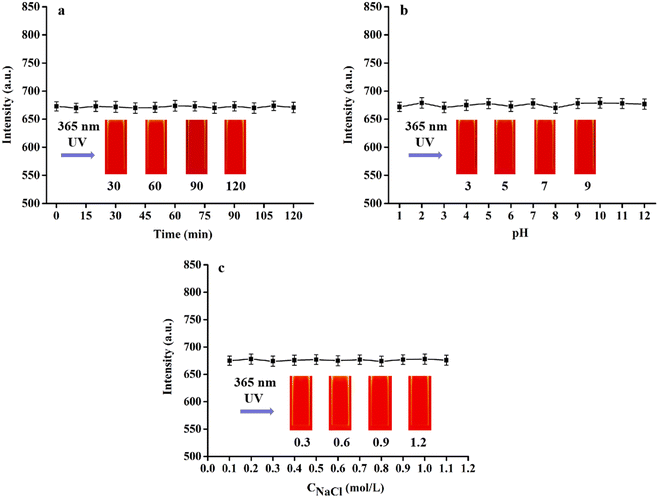
To assess the stability of RCDs, various properties under different conditions were examined. When stored in solution at room temperature for six months, the fluorescence intensity and shape of RCDs remained unchanged (Fig. 4a), indicating excellent resistance to photobleaching. However, the FL of RCDs varied with the increase in pH from 2 to 13 (Fig. 4b). This variation may be attributed to the abundance of O–H and COO-groups in the samples, causing imbalance in their performance under different pH conditions. Furthermore, the fluorescence intensity of RCDs showed minimal change with varying concentrations of NaCl (Fig. 4c). These findings suggest that RCDs exhibit satisfactory stability.3.3 Cytotoxicity
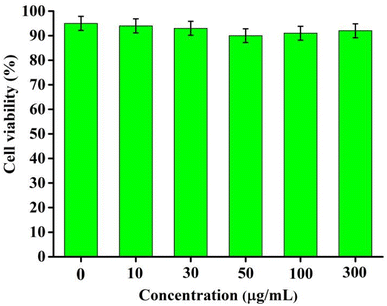
To investigate the biological application of RCDs, cytotoxicity experiments were conducted using the HepG2 cell line. Fig. 5 shows that cell viability remains above 90% even when the concentration of RCDs reaches up to 300 μg mL−1, indicating low cytotoxicity and excellent biocompatibility of RCDs. Moreover, it suggests significant potential for applications in living cell imaging and real time cell tracing in vitro.3.4 Cell imaging
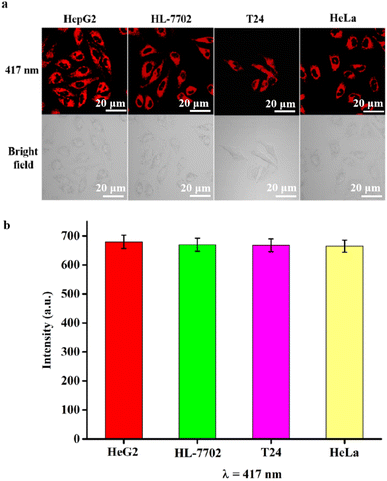
To further confirm the excellent fluorescence properties, such as good biocompatibility, stability, and low cytotoxicity, RCDs were incubated with HepG2, HL-7702, T24, and HeLa cell lines, respectively, in four cell culture dishes for 4 hours. Subsequently, cell imaging was performed using a confocal laser microscope. Fig. 6 shows the laser confocal fluorescence images and the fluorescence intensity of HepG2, HL-7702, T24, and HeLa cells incubated with RCDs with excitation at 417 nm. It is evident from Fig. 6a that all four types of cell lines emitted red fluorescence, and their morphologies appeared normal under a bright-field microscope. Fig. 6b shows that the fluorescence intensity of HepG2, HL-7702, T24, and HeLa cells is very strong, and the strength is between 660 and 680 a.u. These results indicated that RCDs could penetrate different cell membranes and enter various cell types, demonstrating good biocompatibility and potential application in cell imaging across different cell lines.3.5 Real-time and long-term tracking of cells
Based on the excellent properties of RCDs, such as near-infrared fluorescence emission, good biocompatibility and stability, and low cytotoxicity, RCDs were used as a long-term fluorescence tracer in vitro for HepG2 cells. HepG2 cells were exposed to a 20 μg mL−1 solution of RCDs for 4 hours, serving as the first generation. Subsequently, cells were cultured until reaching 80% confluency, harvested, and serially subcultivated. The fluorescence intensity of each cell generation was measured by laser confocal microscopy. As shown in Fig. 7, red fluorescence was observed in HepG2 cells of each generation, with faint red fluorescence persisting even in the 13th generation. Meanwhile, intracellular fluorescence intensity gradually decreased with successive cell passages (Fig. 7a), potentially attributed to cell mitosis, which reduces the concentration of RCDs by half in each daughter cell, consequently diminishing the intracellular fluorescence intensity of labeled cells after the passage. As shown in Fig. 7a and b, after 13 generations of intracellular proliferation, HepG2 cells retained the fluorescence signal with lower fluorescence intensity, underscoring the ability of RCDs to trace cells.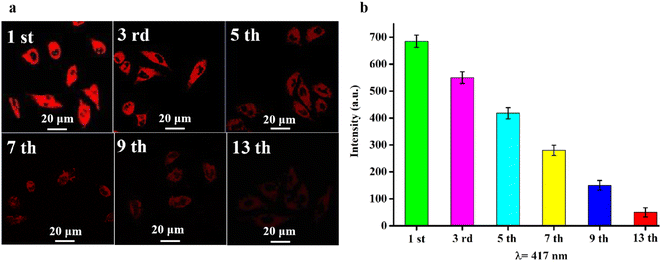 | ||
| Fig. 7 (a) Long-term tracing CLSM image of HepG2 cells labeled with RCDs, the error bar represents the standard deviation (n = 3); (b) fluorescence intensity of each cell generation. | ||
3.6 In vivo real-time and long-term tumor growth tracking
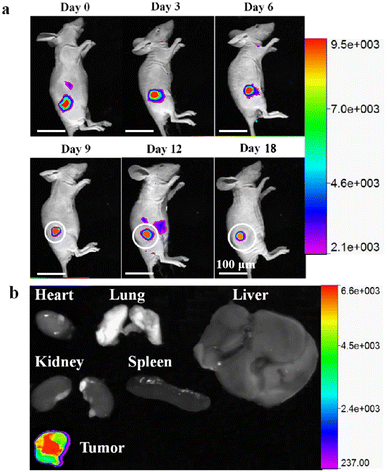
Owing to near-infrared fluorescence emission (684 nm), excellent biocompatibility and stability, low toxicity, and long-term tracking ability, the synthesized RCDs were further used for real-time and long-term tracking of tumor growth in vivo. HepG2 cells were treated with 20 μg mL−1 RCDs for 4 hours at 37 °C. Subsequently, the HepG2 cell suspension (1 × 10⁶ cells per 100 μL of DMEM solution) was subcutaneously injected into nude mice (in the upper leg). Tumor growth was monitored using a small animal living imager at specified intervals to observe changes in fluorescence intensity at the inoculation site. As depicted in Fig. 8a, the inoculation sites of nude mice presented red fluorescence under laser excitation. Notably, the red fluorescent signal remained detectable even after 18 days, with the tumor volume at the inoculation sites increasing over time. These findings confirmed the significant potential of RCDs for long-term, noninvasive detection of tumors, suggesting their efficacy as long-term tracking probes in vivo.After 18 days of tumor growth monitoring, the nude mice were euthanized, and their organs (heart, lungs, liver, kidneys, and spleen) and tumor were collected. Ex vivo fluorescent imaging of the organs and tumor was conducted. Fig. 8b reveals significant fluorescence observed only in the tumors. No fluorescence signal was detected in the other isolated organs, confirming the presence of labeled cells throughout the tumor tissue.
Subsequently, the isolated organs were stained with hematoxylin and eosin (H&E). No apoptosis or necrosis was observed in any of the organs of the nude mice, indicating that RCDs had few side effects (Fig. 9). RCD nanoparticles did not enter the bloodstream due to the subcutaneous injection method used in the in vivo tumor growth tracking experiment. These findings strongly proved that RCDs could serve as effective long-term tracer probes for monitoring tumor growth in vivo and hold great potential for long-term noninvasive fluorescence imaging applications.
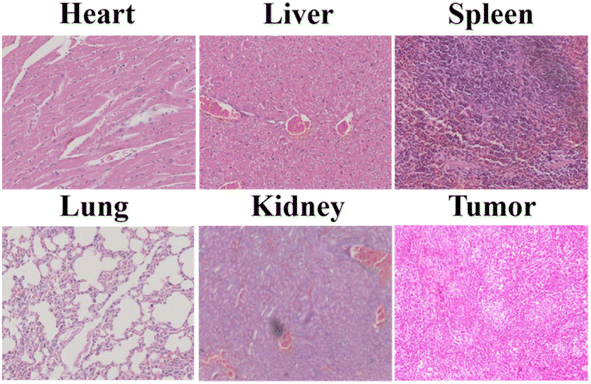 | ||
| Fig. 9 H&E staining of isolated organs (heart, liver, spleen, lungs, and kidneys) and tumor of the nude mice after 18 days of tumor tracking. | ||
4 Conclusions
The developed RCDs in this study exhibited near-infrared fluorescence emission (684 nm), good biocompatibility and stability, and low toxicity. The RCDs were used as near infrared fluorescence imaging probes for cell imaging, real-time and long-term cell tracking in vitro, and real-time and long-term tumor growth monitoring in vivo. It was found that RCDs could continuously track cells for up to 13 generations, and fluorescent signals at tumor sites could be detected for up to 18 days in vivo with minimal side effects on any tested organs in nude mice. These results indicate that RCDs can serve as effective real-time and long-term near infrared fluorescence imaging and tracer probes for tracking cells in vitro and monitoring tumor growth in vivo, thus presenting broad application prospects in image-guided therapy.Ethical statement
All animal procedures were performed in accordance with the Guidelines for Care and Use of Laboratory Animals of Hezhou University and approved by the Animal Ethics Committee of Hezhou University.Data availability
All relevant data are provided within the paper, and the data are available from the corresponding author upon reasonable request.Author contributions
Yuefang Hu: conceptualisation, methodology, investigation, formal analysis, visualisation, writing – original draft, writing – review and editing. Yuxin Chen: investigation, formal analysis, writing – review and editing. Wenwang Wei: formal analysis, supervision, writing – review and editing. Hanfu Liu: conceptualisation, funding acquisition, supervision, writing – review and editing. All authors have approved the final version of the manuscript.Conflicts of interest
The authors have no conflicts of interest to declare.Acknowledgements
This work was supported by the National Natural Science Foundation of China (Grant No. 12404474); the Natural Science Foundation of Guangxi Province (No. 2022GXNSFAA035469, 2017GXNSFAA198274); the Guangxi Technology Base and Talent Subject (GUIKE AD23023008); the Guangxi Science and Technology Base and Talent Special Project (GUIKE AD23026040); the Hezhou Foundation for Research and Development of Science and Technology (HEKEJI 2024113); The Professor Research Initiation Fund of Hezhou University (HZUJS202204); Guangxi Province College Students Innovation and Entrepreneurship Training Plan Project (No. 202311838001).References
- Y. Xiao and D. Yu, Pharmacol. Ther., 2021, 221, 107753 CrossRef CAS PubMed.
- W. Wei, X. Huang, L. Zeng and J. Zhong, J. Cancer Sci. Ther., 2022, 13, 199–205 CrossRef.
- H. Wu, J. Yuan and L. Qiu, J. Cancer Sci. Ther., 2022, 13, 243–251 CrossRef.
- C. Shen, L. Wang and H. Zhang, Front. Chem., 2020, 8, 589560–589566 CrossRef CAS PubMed.
- G. Pankaj, S. Raghuraman, P. Ankur, K. Praveen, S. Vishal and K. Naveen, J. Hepatol., 2021, 75, 108–119 CrossRef.
- G. Li, W. Li, S. Li, X. Shi, J. Liang, J. Lai and Z. Zhou, Biochem. Eng. J., 2020, 164, 107780–107787 CrossRef CAS.
- S. Caratelli, R. Arriga, T. Sconocchia, A. Ottaviani, G. Lanzilli, D. Pastore, C. Cenciarelli, A. Venditti, M. I. Del Principe, D. Lauro, E. Landoni, H. Du, B. Savoldo, S. Ferrone, G. Dotti and G. Sconocchia, Int. J. Cancer, 2020, 146, 236–247 CrossRef CAS.
- N. Yamada, R. Matsushimanishiwaki and O. Kozawa, Arch. Biochem. Biophys., 2020, 682, 108296 CrossRef CAS PubMed.
- Y. Wang, H. Liao, T. Zheng, J. Wang, D. Guo, Z. Lu, Z. Li, Y. Chen, L. Shen, Y. Zhang and J. Gao, Am. J. Cancer Res., 2020, 10, 249–262 CAS.
- M. P. Aleksandra, K. A. Zdzisława and S. K. Marta, Cells, 2020, 9, 612 CrossRef PubMed.
- Y. Cheng, C. Sun, X. Ou, B. Liu, X. Lou and F. Xia, Chem. Sci., 2017, 8, 4571–4578 RSC.
- X. Ning, H. Bao, X. Liu, H. Fu, W. Wang, J. Huang and Z. Zhang, Nanoscale, 2019, 11, 20932 RSC.
- N. Chen, H. Kommidi, H. Guo, A. P. Wu, Z. Zhang, X. Yang, L. Xia, F. An and R. Ting, Mater. Sci. Eng. C, 2020, 111, 110762 CrossRef CAS PubMed.
- Y. Su, C. Lv, Y. Zhang, S. Liu, Z. Xie and M. Zheng, Acta Biomater., 2020, 111, 398–405 CrossRef CAS.
- D. Chen, H. Lei, C. Zhu, X. Chen, H. Tian, W. Fang, H. Qin and X. Peng, J. Am. Chem. Soc., 2022, 144, 8444–8448 CrossRef CAS PubMed.
- C. P. Theurer, A. Weber and M. Richter, Nanotechnology, 2022, 33, 230001–230010 CrossRef CAS PubMed.
- L. Li, L. Shi, J. Jia, O. Eltayeb, W. Lu, Y. Tang, C. Dong and S. Shuang, Sens. Actuators, B, 2021, 332, 129513 CrossRef CAS.
- Y. Hu, Y. Chen, Q. Tang and H. Liu, New J. Chem., 2021, 45, 12613–12621 RSC.
- H. Li, H. G. Ye, R. Cheng, J. Guo and S. Chen, J. Lumin., 2021, 236, 118092 CrossRef CAS.
- Y. Hu, L. Zhang and S. Chen, Nanoscale Adv., 2021, 3, 6869–6875 RSC.
- Y. Bu, T. Xu, X. Zhu, J. Zhang, L. Wang, Z. Yu, J. Yu, A. Wang, Y. Tian, H. Zhou and Y. Xie, Chem. Sci., 2020, 11, 10279–10286 RSC.
- M. Zhang, R. Su, J. Zhong, L. Fei, F. Cai, Q. Guan, W. Li, N. Li, Y. Chen, L. Cai and Q. Xu, Nano Res., 2019, 12, 815–821 CrossRef CAS.
- X. Yang, X. Li and B. Wan, Chin. Chem. Lett., 2022, 332, 613–625 CrossRef.
- Y. Hu, L. Zhang, X. Li, R. Liu, L. Lin and S. Zhao, ACS Sustainable Chem. Eng., 2017, 5, 4992–5000 CrossRef CAS.
- G. Zou, L. Guo and S. Chen, Sens. Actuators, B, 2022, 357, 10–18 CrossRef.
- Y. Hu, Z. Chen, F. Lai and X. Li, J. Mater. Sci., 2019, 54, 8627–8639 CrossRef CAS.
- Y. Hu, L. Lin, J. Li and J. Ye, Anal. Bioanal. Chem., 2019, 411, 3603–3612 CrossRef CAS.
- Y. Hu, J. Zhao, X. Li and S. Zhao, New J. Chem., 2019, 43, 11510–11516 RSC.
- Y. Li, J. Cui, C. Li, C. Deng, G. Deng, H. Zhang and F. An, Chinese Chem Lett., 2023, 349, 108180 CrossRef.
- C. Deng, M. Zheng, J. Xin and F. An, J. Colloid Interface Sci., 2023, 651, 384–393 CrossRef CAS.
- Y. Hu, J. Li and X. Li, Anal. Bioanal. Chem., 2019, 411, 7879–7887 CrossRef CAS PubMed.
- H. Ding, S. Yu, J. Wei and H. Xiong, ACS Nano, 2015, 10, 484–491 CrossRef.
Footnote |
| † These two authors contributed equally to this work. |
| This journal is © The Royal Society of Chemistry 2024 |

