 Open Access Article
A facile synthesis of iron oxide nanoparticles as a nano-sensor to detect levofloxacin and ciprofloxacin in human blood and evaluation of their biological activities†
Erum Hasana,
Ziana Manzar a,
Nabeel Haroon
 a,
Ali Razaa,
Syed Nawazish Ali
 *a,
Mehreen Lateefb and
Sabira Begumc
aDepartment of Chemistry, University of Karachi, Karachi-75270, Pakistan. E-mail: snali@uok.edu.pk
bDepartment of Biochemistry, Multi-Disciplinary Research Laboratory, Bahria University Medical and Dental College, Karachi-75640, Pakistan
cHEJ Research Institute of Chemistry, International Center for Chemical and Biological Sciences (ICCBS), University of Karachi, Karachi-75270, Pakistan
First published on 11th November 2024
Abstract
A rapid synthesis of a pH-stable magnetic nano-sensor (iron oxide nanoparticles, Fe-NPs, ∼2.6 nm) encapsulated with 3-aminobenzoic acid (3-ABA) was achieved. 3-ABA was prepared for the first time through the reduction of 3-nitrobenzoic acid (3-NBA) in the presence of HCl and tin. Electron-impact mass spectrometry (EIMS), Fourier-transform infrared (FTIR), nuclear magnetic resonance (NMR), ultraviolet visible (UV) spectroscopy and atomic force microscopy (AFM) were used for characterization. Ten drugs, namely, ciprofloxacin (CPF), levocetirizine (LCT), levofloxacin (LVF), sulbactam sodium (SBS), ephedrine (EPH), thymine (THM), sertraline (SRT), pyridoxine (PRX), cefotaxime (CFX) and ceftriaxone (CFT) were screened with Fe-NPs. A pronounced hypsochromic shift was observed for levofloxacin and ciprofloxacin, proving that 3-ABA-coated Fe-NPs were an efficient nano-sensor for levofloxacin and ciprofloxacin up to the limit of 0.5 and 0.7 μM, respectively. The stoichiometry of the complexes was conclusively determined as 1![[thin space (1/6-em)]](https://www.rsc.org/images/entities/char_2009.gif) :
:![[thin space (1/6-em)]](https://www.rsc.org/images/entities/char_2009.gif) 1 using Job's plot analysis. Furthermore, the drugs were successfully detected in real samples, including tap water, well water, and human blood. Moreover, the antioxidant activity, urease and lipoxygenase inhibitory potential of these nanoparticles were evaluated, exhibiting promising antioxidant potential.
1 using Job's plot analysis. Furthermore, the drugs were successfully detected in real samples, including tap water, well water, and human blood. Moreover, the antioxidant activity, urease and lipoxygenase inhibitory potential of these nanoparticles were evaluated, exhibiting promising antioxidant potential.
1. Introduction
The proper control and removal of the toxic contaminates are considered serious challenges globally to preserve the environment for both developed and developing countries. One of the most pressing problems that requires constant monitoring is the discharge of pharmaceutical medications into the environment. Shallow, drainage, and sewage water systems have been found to contain alarmingly high amounts of disposed pharmaceuticals.1,2 Fluoroquinolones and other antibiotics have recently been produced in considerable quantities in the sub-continent, where manufacturing effluents are dumped into nearby waterways without being treated.3 Two of the most frequently used antibiotics are ciprofloxacin and levofloxacin, which belong to the second- and third-generation class of fluoroquinolone, respectively. Ciprofloxacin might be utilized to treat and prevent dangerous ailments that are purposely spread such as tularemia (Francisella tularensis) and anthrax (Bacillus anthracis) of the skin or mouth.4 Ciprofloxacin is also often used to treat cat scratch illness, legionnaires' sickness, chancroid, granuloma inguinale and diseases of the external ear that spread to the bones of the face. It may also be utilized to assist in the treatment of tuberculosis and crohn's disease.5 Levofloxacin, as a broad-spectrum antibiotic, is also used to treat infections like diabetic foot and osteomyelitis.6 It inhibits both Gram-negative and Gram-positive bacteria.7 Moreover, it has an activity against unusual respiratory pathogens.8 Patients generally tolerate it well; however, there have been a number of reports of adverse effects including crystal nephropathy,9 tenosynovitis,10 pharmacokinetic interaction,11,12 hepatotoxicity,13 metabolic coma,14 and achilles rupture.15 There are a number of techniques available for the detection and measurement of levofloxacin and ciprofloxacin, including fluorometry,16 spectrophotometric,17 high-performance liquid chromatography (HPLC),18 flow-injection chemi-luminescence,19,20 mass spectrometry,21 atomic absorption spectrophotometry22 and electrochemical techniques.23–25However, some of these technologies lack sensitivity and the majority need costly instrumentation with difficult measurement methods. Recently, a very sensitive technique has been developed for the analysis of ciprofloxacin and levofloxacin via piezoelectric immunosensor redesigned with multiwalled nanotubes of carbon.26
Iron oxide nanoparticles have drawn a notable interest owing to their super-paramagnetic properties, non-toxicity, significant biocompatibility and prospective biomedical applications.27 The labelling and magnetic separation of biological materials, targeted medication delivery, MRI contrast enhancement and hyperthermia treatment are a few possible biomedical uses for magnetic nanoparticles.28 The Food and Drug Administration (FDA) has granted commercial approval for iron oxide nanoparticles.29 Since both maghemite and magnetite are biocompatible as they can prevail naturally. In contrast to conventional medications, which only transport about 1% of their complete dose to the tumour site, MDT distribution on tumours has a total recovery rate of about 57.2%, with about 66.3% of these particles found on the tumour's surface.30 The compound meta-aminobenzoic acid plays a crucial part in the pharmaceutical industry as it has been frequently employed in the manufacture of medicines such as antihypertensive, analgesics, vasodilators and various other drugs.31 Due to its ability to crystallize into five distinct crystal forms, this molecule also serves as an intriguing model system for polymorphism research.32 The biocompatibility and solubility of 3-aminobenzoic acid (3-ABA) in water makes it suitable over other molecules for biomedical applications.33 3-ABA has both amino and carboxyl groups, thus allowing a wide range of interactions with the iron oxide nanoparticles and other molecules. The structural features of 3-ABA have strong potential to protect Fe-NPs from pH, temperature and light, which induce deterioration or aggregation.34 Therefore, as a capping agent, it prevents aggregation and oxidation of the stabilization Fe-NPs for a long time.35 The objective of this research is to develop highly efficient 3-ABA-capped iron oxide nanoparticles for the precise detection of levofloxacin and ciprofloxacin in complex matrices such as human blood, well water, and tap water while establishing their potent antioxidant activity, thus showcasing their significant potential as advanced biological agents.
2. Results and discussion
2.1 Structure elucidation
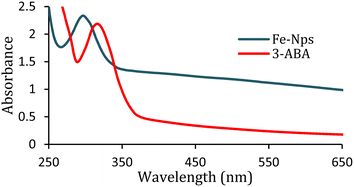
Herein, we present a simple and facile method36 for the preparation of iron oxide nanoparticles by a new capping agent, meta aminobenzoic acid (3-ABA). Meta amino benzoic acid was synthesized from the reduction of 3-nitrobenzoic acid by the reaction of tin and HCl on heating in this study (Scheme 1).3-Aminobenzoic acid was characterized by electron ionization mass spectrometry (Fig. S1, ESI†), nuclear magnetic resonance (Fig. S2, ESI†), ultraviolet-visible (UV-Vis) and Fourier-transform infrared (IR) spectroscopy. The highest absorbance of 3-ABA in UV-visible spectra was observed at 319 nm (Fig. 1), which may be attributed to the transitions from π to π* that have a significant charge transfer (CT) character. This type of intramolecular charge transfer affects 3-aminobenzoic acid as it mostly arises from the amino (NH2) to the carbonyl group, which have a strong electron-accepting nature.37 The production of iron oxide nanoparticles is confirmed by the absorption maxima at 297 nm in the UV-visible spectra, which also agree with the stated value of the O2−/Fe3+ ligand-to-metal charge transfer transitions.38
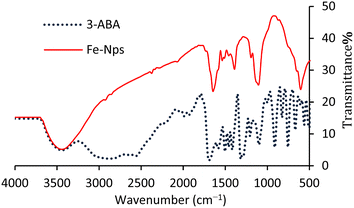
The FTIR spectrum of 3-ABA was compared with that of Fe-NPs. The broadband in the region of ∼3288–3667 cm−1 corresponds to the –NH2 group in both the spectra while the band from ∼3257 to ∼2700 cm−1 represents the –OH group in the spectrum of 3-ABA. Three overtone bands at 1931.5, 1991.8, 1819.6 cm−1 and out-of-plane bending vibrations from 700 to 900 cm−1 confirm the presence of meta-substitution on the aromatic ring.39 However, stretching vibrations at 1696, 1317, 1589–1415 and 1103 cm−1 indicate the signals of C![[double bond, length as m-dash]](https://www.rsc.org/images/entities/char_e001.gif) O, C–O, aromatic C–H and C–N bonds, respectively. The change in –OH and C–O stretching, decrease in the intensity of C
O, C–O, aromatic C–H and C–N bonds, respectively. The change in –OH and C–O stretching, decrease in the intensity of C![[double bond, length as m-dash]](https://www.rsc.org/images/entities/char_e001.gif) C stretching and the appearance of overtones due to meta-substitution and the shifting of the C
C stretching and the appearance of overtones due to meta-substitution and the shifting of the C![[double bond, length as m-dash]](https://www.rsc.org/images/entities/char_e001.gif) O stretching band in the FTIR spectrum (Fig. 2) indicate the involvement of these groups in the stabilization of iron oxide nanoparticles.40
O stretching band in the FTIR spectrum (Fig. 2) indicate the involvement of these groups in the stabilization of iron oxide nanoparticles.40
2.2 AFM analysis
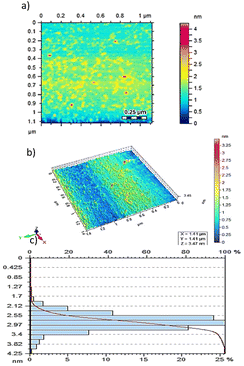
AFM is used for the nanoscopic studies of synthesized nanoparticles. It provides 3D images that demonstrate a perfect sphere with free and detached particles through great stability in the suspension (Fig. 3a and b). Moreover, the histogram shows the small range of the particle sizes (i.e., 1.0 to 3.8 nm), which suggested that 2.6 nm diameter particle size was the highest in concentration (Fig. 4c). This was also confirmed by the logarithmic graph that slows a decline, indicating that less polydispersity and few values of diameters were present and the point of coincidence also confirmed the maximum potential diameter of 2.6 nm.2.3 Screening of drugs
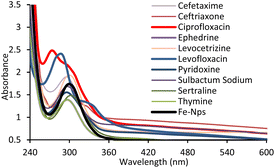
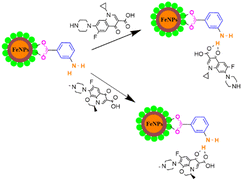
Fe-NPs were used to detect various drugs including ciprofloxacin (CPF), levocetirizine (LCT), levofloxacin (LVF), sulbactam sodium (SBS), ephedrine (EPH), thymine (THM), sertraline (SRT), pyridoxine (PRX), cefotaxime (CFX) and ceftriaxone (CFT) using a UV-visible spectrophotometer.Hypsochromic shifts with enhancement of absorbance were observed in ciprofloxacin and levofloxacin while the remaining drugs did not show any shifting in wavelength and no noticeable change in the absorbance in the spectrum. The hydrogen bonding interaction is one of the reasons for the shifting of the wavelength. However, electron transfer from Fe-NPs to the drugs may be responsible for increasing of UV absorbance of the FeNPs-drug complexes (Fig. 4).41
To identify the stability time, UV spectra were recorded after an interval of 5 min. No significant change was observed in the spectra of levofloxacin at a concentration of 100 μM between 10 and 15 min (Fig. S3, ESI†), which shows that the levofloxacin–Fe-NPs complex was stabilized in 10 min after mixing (Table S1†). However, in case of ciprofloxacin, a gradual decrease was observed in the intensity of absorbance. To find out the accurate stability duration of the ciprofloxacin–Fe-NPs complex, its UV-visible spectra were recorded after a regular interval of 3 min at 100 μM concentration (Fig. S4, ESI†). It was observed that the peak intensity continuously decreases after regular intervals of 3 min and stabilized after 93 min (Table S1†). This may happened due to the greater solubility of levofloxacin in aqueous media because of its s-enantiomeric configuration, which leads to a more feasible interaction with water as compared to ciprofloxacin.42
2.4 pH stability of Fe-NPs and drug complexes
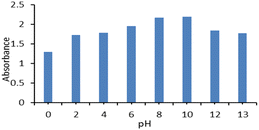
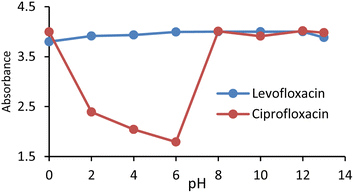
The absorbance of the nanoparticles was measured at different pH values (0–13) adjusted by HCl and NaOH. There was no noticeable change in the pH; therefore, it was revealed that Fe-NPs are pH-stable magnetic nanoparticles. Fe-NPs were stable over a wide pH range of 2–13 (Fig. 5). Due to the protonation of the carboxyl group of 3-ABA at low pH, it was aggregated to reduce absorbance. The similar pattern was observed in the complex of Fe-NPs and levofloxacin. The levofloxacin complex of Fe-NPs was pH-stable up to 0–13 but it maybe decomposed at very low pH near zero (Fig. 9). In an acidic medium, the ciprofloxacin Fe-NPs complex became unstable due to decreasing absorbance, but from neutral to basic pH, its absorbance remained constant, which represents its stability (Fig. 6). It is revealed that deprotonation makes the complex stable. This behaviour may be due to the protonation at the secondary amino group of the piperazine ring in ciprofloxacin,43 which alters the surface charge property of the ciprofloxacin that might affect the complexation.44 The stability is influenced by protonation and deprotonation, particularly affecting the surface charge and complexation properties.2.5 Determination of limit of detection (LOD)
The limit of detection (LOD) of Fe-NPs for both drugs was evaluated by measuring the absorbance with a successive decrease in the concentration of the drugs while the concentration of Fe-NPs remains constant.It was observed that the absorbance was decreased with the decreasing concentration of the drug solution. The limit of detection (LOD) of Fe-NPs for levofloxacin was found to be 0.5 μM (Fig. 6) and for ciprofloxacin, it was found to be with a regression of 0.99 (Fig. 7) and 0.98 (Fig. 8) respectively. The linear interval of methodology was followed, in which absorbance was linearly correlated with a decrease in the drug concentration and supported by the regression value. However, the LOD for levofloxacin and ciprofloxacin was found to be 0.48 and 0.71 μM, respectively, according to IUPAC.
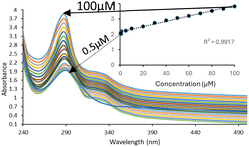 | ||
| Fig. 7 Limit of detection for Fe-NPs for levofloxacin and regression curve to determine uniform absorbance reduction with gradual decreasing of concentration of levofloxacin. | ||
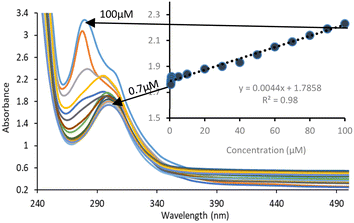 | ||
| Fig. 8 Limit of detection for Fe-NPs for ciprofloxacin and regression curve to determine uniform absorbance reduction with a gradual decrease of the concentration of ciprofloxacin. | ||
According to IUPAC, the LOD is given as
This demonstrates the high sensitivity and precision of the method in accurately detecting these drugs even at very low concentrations.
The binding constant (Ka) for Fe-NPs and the drug complex was determined using the absorbance titration data. This value was computed through Benesi–Hildebrand equation and found to be 6.250 × 10³ M−1 for levofloxacin (Fig. S5, ESI†) and 38.931 × 10³ M−1 for ciprofloxacin (Fig. S6, ESI†).
The binding ratio of the nanoparticles and the drugs were estimated by Job's plot and found to be 1![[thin space (1/6-em)]](https://www.rsc.org/images/entities/char_2009.gif) :
:![[thin space (1/6-em)]](https://www.rsc.org/images/entities/char_2009.gif) 1 for both levofloxacin (Fig. S7, ESI†) and ciprofloxacin (Fig. S8, ESI†).
1 for both levofloxacin (Fig. S7, ESI†) and ciprofloxacin (Fig. S8, ESI†).
2.6 Interference study
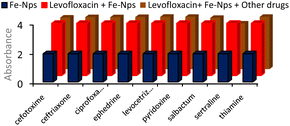
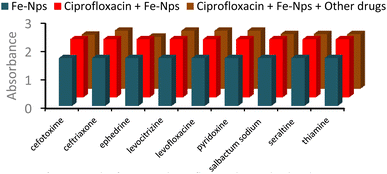
Through an interference analysis, the selectivity of Fe-NPs for levofloxacin and ciprofloxacin in combination with other drugs was analysed. For this study, a mixture of levofloxacin, Fe-NPs and other drugs was taken in equal volume and their absorbance was observed at 275 nm. Levofloxacin showed a remarkable affinity with Fe-NPs and remained unaffected in the presence of other drugs (Fig. 9).On the other hand, the combination of ciprofloxacin, Fe-NPs and other drugs in equal quantity was taken and their interactions were observed at 270 nm. No significant change in the absorbance was observed, which shows the selectivity of Fe-NPs for ciprofloxacin (Fig. 10). The interference analysis confirmed the selectivity of Fe-NPs for levofloxacin and ciprofloxacin as their interactions with Fe-NPs remained unaffected by other drugs. This highlights the strong affinity of Fe-NPs for both antibiotics.
2.7 Insights into the mechanism of drug sensing
In the IR spectra of levofloxacin (Fig. S9, ESI†), the absorptions of ν(C![[double bond, length as m-dash]](https://www.rsc.org/images/entities/char_e001.gif) O) for COOH at 1724 cm−1 and the aromatic ring in the range of 1628 to 1527 cm−1 were observed. The band that appeared at 1620 cm−1 was attributed to the C
O) for COOH at 1724 cm−1 and the aromatic ring in the range of 1628 to 1527 cm−1 were observed. The band that appeared at 1620 cm−1 was attributed to the C![[double bond, length as m-dash]](https://www.rsc.org/images/entities/char_e001.gif) O stretching mode of the ring carbonyl group. Moreover, the peak at 840 cm−1 corresponds to the C–F stretching, while the broad split band between 3456 and 3284 cm−1 is assigned to the O–H stretching vibrations, which also includes the N–H stretching vibration of the piperazinyl moiety.46 The IR of CPF (Fig. S10, ESI†) exhibits a band in the range 1724–1707 cm−1, which was ascribed to the vibration of the carboxylic C
O stretching mode of the ring carbonyl group. Moreover, the peak at 840 cm−1 corresponds to the C–F stretching, while the broad split band between 3456 and 3284 cm−1 is assigned to the O–H stretching vibrations, which also includes the N–H stretching vibration of the piperazinyl moiety.46 The IR of CPF (Fig. S10, ESI†) exhibits a band in the range 1724–1707 cm−1, which was ascribed to the vibration of the carboxylic C![[double bond, length as m-dash]](https://www.rsc.org/images/entities/char_e001.gif) O group. The intense band at 1625 cm−1 could be assigned to the C
O group. The intense band at 1625 cm−1 could be assigned to the C![[double bond, length as m-dash]](https://www.rsc.org/images/entities/char_e001.gif) O of pyridone. The band in the region of 3492–3380 cm−1 is assigned to the O–H stretching vibrations along with the NH group of the piperazine moiety.47 In both IR spectra, the disappearance of peaks in the range of 1700–1725 cm−1 indicates interaction with the C
O of pyridone. The band in the region of 3492–3380 cm−1 is assigned to the O–H stretching vibrations along with the NH group of the piperazine moiety.47 In both IR spectra, the disappearance of peaks in the range of 1700–1725 cm−1 indicates interaction with the C![[double bond, length as m-dash]](https://www.rsc.org/images/entities/char_e001.gif) O groups of the drugs, signifying the formation of a drug–nanoparticle complex.
O groups of the drugs, signifying the formation of a drug–nanoparticle complex.
Additionally, the smoothening of peaks in the 1000–1600 cm−1 region reflects the interaction of the quinolone ring of the drugs with the nanoparticles (Fig. 11).48
2.8 Detection of drugs in real samples
The practical applicability of Fe-NPs to sense levofloxacin and ciprofloxacin was evaluated by spiking drugs in human blood, tap water and well water (Fig. S21–S26, ESI†). It was observed that both drugs were selectively recognized by the synthesized Fe-NPs in the real samples. The acceptable ranges of levofloxacin and ciprofloxacin in serum or plasma are approximately 5.5–13.7 μM and 1.5–15 μM, respectively, as declared by Clinical and Laboratory Standards Units (CLSI), depending on the type of infection being treated. In environmental cases, an acceptable concentration is many fold smaller, in the nanomolar range and is restrained by specific guidelines. The study reports a limit of detection (LOD) of 0.5 μM for levofloxacin and 0.7 μM for ciprofloxacin. These LODs are well below the therapeutic ranges, indicating good sensitivity for clinical monitoring. However, they may be too high to detect environmentally relevant concentrations, potentially limiting the method's utility for environmental monitoring. These LODs are significantly lower than the therapeutic concentrations and show good sensitivity applicability for clinical purpose.Five peaks were obtained for the blood samples, which characterizes the haemoglobin (Hb) macromolecule. The peak observed at 280 nm corresponds to the aromatic amino acids, 340 nm corresponds to globin–heme interaction, 420 nm was assigned to the heme, 540 nm was attributed to the heme–heme interaction and 578 nm corresponded to the haemoglobin oxygen affinity.49 On adding FeNPs in the mixture of blood and drugs, a bathochromic shift was observed at 280 nm. The decrease in the intensity of the heme peak at 420 nm observed in both may be due to the complexation between iron and the nitrogens of heme. Hence, the presence of drugs in blood was identified through FeNPs by observing the bathochromic shift in the aromatic amine region and disappearance of the heme–globin interaction at 340 nm.50
2.9 Biological potential and insights into the bioactivities of iron oxide nanoparticles (Fe-NPs)
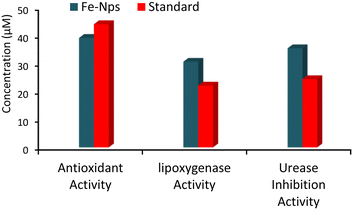
Fe-NPs and 3-ABA were also analysed for bioactivities including antioxidant, lipoxygenase and urease enzyme inhibition activities (Fig. 12). When these nanoparticles were tested for their antioxidant activity, they showed lesser IC50 value than the standard BHA. These results indicate that a lesser concentration (39.2 μM) of Fe-NPs is required to scavenge 50% DPPH radicals than the standard BHA (44.1 μM), which specifies the efficacy of the nanoparticles. Hence, these particles can be used as potential candidates in drug delivery to reduce the oxidative stress caused by several diseases and cancer-related problems (Table 1).| Samples | IC50 (μM) | ||
|---|---|---|---|
| Antioxidant | Lipoxygenase | Urease | |
| 3-ABA | 45.3 ± 0.42 | 61.4 ± 0.36 | 31.4 ± 0.48 |
| Fe-NPs | 39.2 ± 0.14 | 30.7 ± 0.31 | 35.5 ± 0.52 |
| BHA | 44.1 ± 0.14 | — | — |
| Bacilien | — | 22.2 ± 0.09 | — |
| Thiourea | — | — | 24.5 ± 0.47 |
The evaluation of lipoxygenase and urease inhibition activities showed the bioactive potential of these particles against cancer and ulcer, respectively.51 FeNPs play an important role in inhibiting lipoxygenase activity at low concentration and inhibit 50 percent enzyme at a concentration of 30.7 μM in comparison with standard bacilien, which shows an IC50 value of 22.2 μM.
In vitro studies showed the significant inhibitory potential of these nanoparticles against the urease enzyme, which is responsible for ulcers and related infections by H. Pylori bacteria due to the excessive production of urease in the stomach.52 The IC50 of 3-ABA was 31.4 μM, while Fe-NPs showed a value of 35.5 μM, both higher than the standard urea at 24.5 μM, indicating the lower inhibitory potency. Fe-NPs exhibited strong antioxidant, lipoxygenase and urease inhibition activities, making them potential candidates for drug delivery against oxidative stress, cancer and ulcers. Despite lower urease inhibition compared to urea, they show therapeutic promise.
3. Experimental
3.1 Instrumentation
UV-visible spectra were recorded on a Shimadzu UV-240 spectrophotometer in the range of 200–800 nm with 1 cm path length in quartz cell whereas the pH was measured by a PHS-3B microprocessor pH meter. The infrared spectra were obtained through an FTIR spectrophotometer (Shimadzu IR-Prestige-21) using KBr pellet. EIMS (mass spectrometry, JEOL JMS600H-1) was performed to confirm the molecular mass of 3-ABA. The size of iron oxide nanoparticles were characterized by AFM (Agilent Technologies 5500, USA).3.2 Material and methods
3-Nitrobenzoic acid, tin, hydrochloric acid, sodium hydroxide and all active ingredients including ciprofloxacin (CPF), levocetirizine (LCT), levofloxacin (LVF), sulbactam sodium (SBS), ephedrine (EPH), thymine (THM), sertraline (SRT), pyridoxine (PRX), cefotaxime (CFX) and ceftriaxone (CFT) were purchased from Sigma Aldrich.3.3 Synthesis of 3-ABA
Tin granules (4 g, 33.69 mmol) were dissolved in concentrated HCl (40 mL) at 100 °C (Scheme 1). As the granules completely dissolved, 3-nitrobenzoic acid (2 g, 11.967 mmol) was added in the round-bottom flask with constant heating. After the complete dissolution of 3-NBA, the reaction mixture was cooled, which afforded 3-ABA as a white precipitate.EIMS m/z (%): m/z 137.1 [M+] (100.0), m/z 120.1 [M − 17] (65.8), m/z 92.0 [M − 45] (60.5), m/z 65.0 (27.7). IR (KBr) (![[small upsilon, Greek, macron]](https://www.rsc.org/images/entities/i_char_e0d5.gif) max, cm−1): broad band ∼3257 to ∼2700 (–OH), three overtone bands at 1932.5, 1986.8 and 1819.6 along with out-of-plane bending vibrations from 700 to 900 confirmed the presence of meta-substitution on the aromatic ring, ∼1589–1415 (aromatic C
max, cm−1): broad band ∼3257 to ∼2700 (–OH), three overtone bands at 1932.5, 1986.8 and 1819.6 along with out-of-plane bending vibrations from 700 to 900 confirmed the presence of meta-substitution on the aromatic ring, ∼1589–1415 (aromatic C![[double bond, length as m-dash]](https://www.rsc.org/images/entities/char_e001.gif) C), ∼1696 (–C
C), ∼1696 (–C![[double bond, length as m-dash]](https://www.rsc.org/images/entities/char_e001.gif) O), 1317 (–C–O), ∼1103 (–C–N). 1H NMR (500 MHz, CDCl3) δ = 10.74 (s, 1H), 8.21 (s, 1H), 7.82–7.797 (m, 1H), 7.74–7.72 (d, 1H), 7.41–7.37 (t, 1H), 4.84 (s, 2H).
O), 1317 (–C–O), ∼1103 (–C–N). 1H NMR (500 MHz, CDCl3) δ = 10.74 (s, 1H), 8.21 (s, 1H), 7.82–7.797 (m, 1H), 7.74–7.72 (d, 1H), 7.41–7.37 (t, 1H), 4.84 (s, 2H).
3.4 Preparation of iron oxide nanoparticles (Fe-NPs)
3-ABA (0.165 g, 1.203 mmol) was dissolved in deionized water at 80 °C. An aqueous solution of FeCl3·6H2O (2.403 mmol, 0.650 g) was added dropwise into the solution of 3-ABA and then the aqueous solution of FeSO4·6H2O (1.203 mmol, 0.3127 g) was poured slowly. NH4OH (5 mL) was added dropwise with a 5 minutes interval, as a result of which brown-colored precipitates were obtained. For the optimization of Fe-NPs, the reaction mixture was stirred for two hours. Centrifugation was done to purify the nanoparticles by deionised water, subsequently with methanol and collected in acetone to prevent agglomeration.533.5 Preparation of the drug solution and real samples
In deionized water, a stock solution (1 mM) of several drugs was prepared and diluted to 100 μM. Using a 1![[thin space (1/6-em)]](https://www.rsc.org/images/entities/char_2009.gif) :
:![[thin space (1/6-em)]](https://www.rsc.org/images/entities/char_2009.gif) 1 mixture of Fe-NPs and various drug solutions, the chemosensing characteristics of the synthesized nanoparticles were investigated by measuring their absorbance in a UV-visible spectrophotometer.
1 mixture of Fe-NPs and various drug solutions, the chemosensing characteristics of the synthesized nanoparticles were investigated by measuring their absorbance in a UV-visible spectrophotometer.
For the real samples, water was collected from 2 sources, tap and well. 100 μM solutions of levofloxacin and ciprofloxacin were prepared in tap water and well water for the analysis. Two stock solutions were prepared in both samples of water. One contained 1 mL water sample and one mL drug solution (100 μM) while the second solution was prepared by mixing 1 mL water sample, 1 mL drug solution (100 μM) and 1 mL Fe-NPs. Blood sample was collected from a person in good physical condition via venipuncture. Three solutions, namely, A, B and C were prepared for the analysis of blood. Solution A contained blood and Fe-NPs, solution B comprised of blood and drugs solution (100 μM) and solution C had blood, Fe-NPs and drugs solution (100 μM).
3.6 Antioxidant activity
A solution of 0.3 mM DPPH (1,1-diphenyl-2-picryl-hydrazyl) free radicals in ethanol was prepared and 5 μL of DPPH at various concentrations of the particles (10–500 μM) was combined with 95 μL of DPPH solution. The quantities were incubated in plates for 30 minutes at 37 °C. A microtitre plate reader (Spectramax plus 385 molecular Device, Union City, CA, USA) was used to measure the absorbance at 515 nm. Butylhydroxyl anisole was used as the standard to compare the activity with a control that was treated with dimethyl sulfoxide therapy.DPPH scavenging effect (%) = (Ac − As)/Ac × 100 is the formula used to calculate the percentage of the scavenging effect, where Ac is the absorbance of the control (DMSO treated) and As is the absorbance of the Fe-NPs (GraphPad Prism® version 4.0, San Diego, CA was used for determination of IC50 values).
3.7 Lipoxygenase inhibition assay
The lipoxygenase inhibitory activity was assessed according to a described method. A 200 mL assay mixture containing sodium phosphate buffer (100 mM, pH 8.0) (160 mL), Fe-NPs (10–500 μM) and purified lipoxygenase (20 mL total volume) was prepared. The mixture was pre-incubated for 10 minutes at 25 °C, and the reaction was initiated by adding 10 mL of linoleic acid (substrate solution) in phosphate buffer. Absorbance changes were recorded at 234 nm after 6 minutes of incubation. The experiments were conducted in triplicate using a 96-well microplate reader (Synergy HT, Biotek, Winooski, VT). Positive and negative controls were included.The percentage of inhibition was calculated using the formula % inhibition = (C − T) × 100, where C represents total enzyme activity without the inhibitor and T represents the activity with Fe-NPs. IC50 values were determined using GraphPad Prism® (Version 4.0, San Diego, CA).
3.8 Urease inhibition assay
The urease enzyme inhibition by Fe-NPs was determined by measuring the ammonia produced during the reaction using the indophenol method. A blank, inhibitor, and control were prepared in a 96-well plate with phosphate buffer (0.01 M, pH 8.2), EDTA (1 mM) and LiCl (0.01 M), respectively. Jack-bean urease enzyme was combined with 5 mL of Fe-NPs at various concentrations (10–500 M) in a total reaction volume of 10 mL. The mixture was incubated for 15 minutes at 30 °C, with thiourea used as the control. Reagents including 50 mL phenol (1%), 70 mL NaOCl (0.1%), 50 mL sodium nitroprusside (0.005%), and 70 mL NaOH (0.5%) were added to the wells. Absorbance readings were taken every 50 minutes at 630 nm (Spectramax Plus 384, Molecular Device, USA). All reactions were performed in triplicate and the inhibition percentage was calculated using the formula: % inhibition = [(OD control − OD test)/OD control] × 100. IC50 values were determined using GraphPad Prism™ (version 4.0, San Diego, CA, USA).4. Conclusions
In this study, we have reported the successful synthesis of iron oxide nanoparticles stabilized by 3-aminobenzoic acid. 3-ABA was obtained by the reduction of 3-nitrobenzoic acid in the laboratory. It was observed by FT-IR analysis that the hydroxyl (–OH), carbonyl (C![[double bond, length as m-dash]](https://www.rsc.org/images/entities/char_e001.gif) O) and aromatic ring is responsible for the stabilization of Fe-NPs. The synthesized Fe-NPs showed excellent selectivity for levofloxacin and ciprofloxacin even in the presence of other drugs. Fe-NPs also have the potential to detect levofloxacin and ciprofloxacin in well water, tap water and human blood. These magnetic nanoparticles showed promising antioxidative activity along with antiulcer activity. In the future, Fe-NPs can be utilized as imminent candidates to monitor these drugs in human blood, which would be harmful if exceed the limit. Moreover, it could also help in reducing the water pollution by detecting these drugs in water.
O) and aromatic ring is responsible for the stabilization of Fe-NPs. The synthesized Fe-NPs showed excellent selectivity for levofloxacin and ciprofloxacin even in the presence of other drugs. Fe-NPs also have the potential to detect levofloxacin and ciprofloxacin in well water, tap water and human blood. These magnetic nanoparticles showed promising antioxidative activity along with antiulcer activity. In the future, Fe-NPs can be utilized as imminent candidates to monitor these drugs in human blood, which would be harmful if exceed the limit. Moreover, it could also help in reducing the water pollution by detecting these drugs in water.
Data availability
The data supporting this article have been included as part of the ESI†.Conflicts of interest
There are no conflicts to declare.Acknowledgements
We are greatly thankful to Higher Education Commission (HEC), Pakistan and DFS Research Grant by University of Karachi for this work.References
- P. Ondruch, M. P. Schluesener, G. Dierkes, K. Jewell, T. Kirchgeorg, S. Hasenbein, T. A. Ternes and A. Wick, Mar. Pollut. Bull., 2023, 195, 115427 CrossRef CAS.
- M. Scheurell, S. Franke, M. R. Shah and H. Hühnerfuss, Chemosphere, 2009, 77, 870–876 CrossRef CAS.
- C. Rutgersson, J. Fick, N. Marathe, E. Kristiansson, A. Janzon, M. Angelin, A. Johansson, Y. Shouche, C. F. Flach and D. J. Larsson, Environ. Sci. Technol., 2014, 48, 7825–7832 CrossRef CAS.
- J. A. Generali and D. J. Gada, Hosp. Pharm., 2015, 50, 274–276 CrossRef CAS.
- D. E. King, R. Malone and S. H. Lilley, Am. Fam. Physician, 2000, 61, 2741–2748 CAS.
- M. E. Shirtliff, J. H. Calhoun and J. T. Mader, J. Antimicrob. Chemother., 2001, 48, 253–258 CrossRef CAS PubMed.
- I. Odenholt, E. Löwdin and O. Cars, Clin. Microbiol. Infect., 1998, 4, 264–270 CrossRef CAS.
- R. P. Smith, A. L. Baltch, M. A. Franke, P. B. Michelsen and L. H. Bopp, J. Antimicrob. Chemother., 2000, 45, 483–488 CrossRef CAS PubMed.
- Y. Liu, Q. He and M. Wu, Nephrology, 2015, 20, 437–438 CrossRef.
- J. Torre-Cisneros, R. San-Juan, C. M. Rosso-Fernández, J. T. Silva, A. Muñoz-Sanz, P. Muñoz, E. Miguez, P. Martín-Dávila, M. A. López-Ruz, E. Vidal and E. Cordero, Clin. Infect. Dis., 2015, 60, 1642–1649 CrossRef CAS.
- A. Czyrski, K. Kondys, E. Szałek, A. Karbownik and E. Grześkowiak, Pharmacol. Rep., 2015, 67, 542–544 CrossRef CAS.
- M. Fayyaz, R. I. Yousuf, M. H. Shoaib, T. Ali, I. Nasiri and N. Ashraf, Pak. J. Pharm. Sci., 2015, 28, 119–128 CAS.
- M. Gulen, M. O. Ay, A. Avci, A. Acikalin and F. Icme, Am. J. Ther., 2015, 22, 93–96 CrossRef.
- N. Bansal, D. Manocha and B. Madhira, Am. J. Ther., 2015, 22, 48–51 CrossRef PubMed.
- A. M. Budny and A. N. Ley, J. Foot Ankle Surg., 2015, 54, 494–496 CrossRef.
- J. M. Jurado and J. A. Ocaña, Anal. Sci., 2007, 23, 337–341 CrossRef.
- F. M. Abdel-Gawad, Y. M. Issa, H. M. Fahmy and H. M. Hussein, Mikrochim. Acta, 1998, 130, 35–40 CrossRef CAS.
- S. E. Toker, G. E. Kızılçay and O. Sagirli, Bioanalysis, 2021, 13, 1063–1070 CrossRef CAS PubMed.
- L. R. Guidi, F. A. Santos, A. C. S. R. Ribeiro, C. Fernandes, L. H. M. Silva and M. B. A. Gloria, Food Chem., 2018, 245, 1232–1238 CrossRef CAS.
- R. Karami-Osboo, M. H. Shojaee, R. Miri, F. Kobarfard and K. Javidnia, Anal. Methods, 2014, 6, 5632–5638 RSC.
- S. A. Zelenitsky and R. E. Ariano, J. Antimicrob. Chemother., 2010, 65, 1725–1732 CrossRef CAS.
- S. Mostafa, M. El-Sadek and E. Awadalla, J. Pharm. Biomed. Anal., 2002, 27, 133–142 CrossRef CAS.
- J. He, N. Li, D. Zhang, G. Zheng, H. Zhang, K. Yu and J. Jiang, Environ. Sci.: Water Res. Technol., 2020, 6, 181–188 RSC.
- P. A. Pushpanjali, J. G. Manjunatha and M. T. Shreenivas, ChemistrySelect, 2019, 4, 13427–13433 CrossRef CAS.
- A. Joshi and K. H. Kim, Biosens. Bioelectron., 2020, 153, 112046 CrossRef CAS.
- I. S. Evgenia, V. F. Olga, I. J. A. Shanin, A. E. Sergei and N. E. Tatyana, Anal. Lett., 2021, 55, 1164–1177 Search PubMed.
- S. Laurent, D. Forge, M. Port, A. Roch, C. Robic, L. Vander Elst and R. N. Muller, Chem. Rev., 2008, 108, 2064–2110 CrossRef CAS.
- E. M. Materón, C. M. Miyazaki, O. Carr, N. Joshi, P. H. Picciani, C. J. Dalmaschio, F. Davis and F. M. Shimizu, Appl. Surf. Sci., 2021, 6, 100163 CrossRef.
- M. A. Busquets, S. R and J. Estelrich, Nanoscale Res. Lett., 2014, 9, 538 CrossRef.
- R. Tietze, J. Zaloga, H. Unterweger, S. Lyer, R. P. Friedrich, C. Janko, M. Pöttler, S. Dürr and C. Alexiou, Biochem. Biophys. Res. Commun., 2015, 18, 463–470 CrossRef PubMed.
- M. A. Palafox, M. Gill and J. L. Núñez, Spectrosc. Lett., 1996, 29, 609–629 CrossRef CAS.
- P. A. Williams, C. E. Hughes, G. K. Lim, B. M. Kariuki and K. D. Harris, Cryst. Growth Des., 2012, 12, 3104–3113 CrossRef CAS.
- A. Hirayam, T. Eguchi and F. Kudo, ChemBioChem, 2013, 14, 1198–1203 CrossRef PubMed.
- S. Habib, M. Talhami, A. Hassanein, E. Mahdi, A. E. Maryam, M. K. Hassan, A. Altaee, P. Das and A. H. Hawari, Nanoscale, 2024, 16, 13331–13372 RSC.
- L. S. Arias, J. P. Pessan, A. P. Vieira, T. M. Lima, A. C. Delbem and D. R. Monteiro, Antibiotics, 2018, 7, 46 CrossRef PubMed.
- E. Hasan, S. N. Ali, A. Zia, S. Begum, S. T. Khan and S. F. Bukhari, J. Turk. Chem. Soc., Sect. A, 2023, 10, 277–286 CrossRef CAS.
- T. Stalin and N. Rajendiran, J. Photochem. Photobiol., A, 2006, 182, 137–150 CrossRef CAS.
- N. Ferroudj, J. Nzimoto, A. Davidson, D. Talbot, E. Briot, V. Dupuis, A. Bée, M. S. Medjram and S. Abramson, Appl. Catal., B, 2013, 136, 9–18 CrossRef.
- J. Seo, S. Warnke, S. Gewinner, W. Schöllkopf, M. T. Bowers, K. Pagel and G. von Helden, Phys. Chem. Chem. Phys., 2016, 18, 25474–25482 RSC.
- D. L. Pavia, G. M. Lampman, G. S. Kriz and J. R. Vyvyan, Introduction to Spectroscopy, 2015, edn. 3, pp. 29–30 Search PubMed.
- S. Z. H. Hashmi, T. K. Dhiman, N. Chaudhary, A. K. Singh, R. Kumar, J. G. Sharma, A. Kumar and P. R. Solanki, Frontal Nanotechnol. Res., 2016, 3, 616186 CrossRef.
- S. V. Blokhina, A. V. Sharapova, M. V. Ol'khovich, T. V. Volkova and G. L. Perlovich, Eur. J. Pharm. Sci., 2016, 93, 29–37 CrossRef CAS PubMed.
- S. A. Carabineiro, T. Thavorn-Amornsri, M. F. Pereira, P. Serp and I. L. Figueiredo, Catal. Today, 2012, 186(1), 29–34 CrossRef CAS.
- S. Xing, W. Li, B. Liu, Y. Wu and Y. Gao, J. Chem. Eng., 2020, 382, 122837 CrossRef CAS.
- F. Poggialini, S. Legnaioli, B. Campanella, B. Cocciaro, G. Lorenzetti, S. Raneri and V. Palleschi, Appl. Sci., 2023, 13, 3642 CrossRef CAS.
- A. W. Qassim, Int. J. Drug Dev. Res., 2015, 5, 4702–4706 Search PubMed.
- N. E. A. El-Gamel, M. F. Hawash and M. A. Fahmey, J. Therm. Anal. Calorim., 2011, 108, 253–262 CrossRef.
- Q. Zhang, Q. Lv, D. Zhang, W. Jiang, H. Zhang and W. Zhang, Processes, 2023, 11, 2077 CrossRef CAS.
- M. A. K. Abdelhalim, M. S. Al-Ayed, A. S. Alhomida and S. A. A. Moussa, Afr. J. Biotechnol., 2011, 10, 16654–16660 CAS.
- N. A. Zakariya, S. Majeed and W. H. Jusof, Sens. Int., 2022, 3, 100164 CrossRef.
- H. Wu, J. J. Yin, W. G. Wamer, M. Zeng and Y. M. Lo, J. Food Drug Anal., 2014, 22, 86–94 CrossRef CAS.
- K. S. Sadeghi, B. Shareghi and M. Salavati, J. Nanostruct., 2014, 4, 217–226 Search PubMed.
- E. Hasan, S. N. Ali, A. Zia, S. Begum, S. Khan and S. Bukhari, J. Turk. Chem. Soc., Sect. A, 2023, 10(2), 277–286 CrossRef CAS.
Footnote |
| † Electronic supplementary information (ESI) available. See DOI: https://doi.org/10.1039/d4ra05024j |
| This journal is © The Royal Society of Chemistry 2024 |


