 Open Access Article
A Cd-based MOF: iodine capture and enhanced efficiency of perovskite solar cells†
Yaxin Houab,
Yang Liua and
Juan Chai *a
*a
aInstitute of Fire Safety Materials, School of Materials Science and Engineering, NingboTech University, Ningbo, 315100, P. R. China. E-mail: chaijuan@nbt.edu.cn
bMinhang Crosspoint Academy at Shanghai Wenqi Middle School, Shanghai 200245, P. R. China
First published on 2nd September 2024
Abstract
In this work, a Cd-based metal–organic framework (MOF) {Cd(H2L)2}n (Cd-MOF) (L = 5-(3-carboxypyridin-4-yl)isophthalic acid) has been synthesized solvothermally and characterized. The nitrogen-containing π-electron-rich moieties render Cd-MOF an ideal platform for iodine uptake. Its static adsorption and adsorption kinetics were also investigated. The Cd-MOF efficiently captures iodine and removal efficiency was achieved at 68.6% after 40 h. Furthermore, the Cd-MOF was chosen as the interfacial modification material between the perovskite layer and hole transport layer in the perovskite solar cells (PSCs), Cd-MOF can passivate surface defects and promote hole extraction. Consequently, the Cd-MOF-modified PSCs yield enhanced power conversion efficiencies (PCEs) of 23.71%, outperforming the reference PSCs (21.68%).
Introduction
Metal–organic frameworks (MOFs) are coordination compounds with a periodic network structure formed by combining inorganic metal ions/clusters and organic linkers, which have gained tremendous attention due to their fascinating topology and wide applications, especially in gas storage and separation, chemical sensing, adsorption, catalysis and energy-related fields.1–3Nuclear energy is a sustainable and renewable energy source that has advanced rapidly.4,5 However, with the development of the nuclear industry, disposal of nuclear waste has drawn significant concern across the world. Among the common fission products, the 129I isotope, with a half-life of 15.7 million years, adversely affects our metabolic processes through bioaccumulation in the food chain.6–8 Therefore, the development of stable and effective material and technology to capture the higher amount of radioactive iodine is of primary importance and urgent.
Over the past few decades, a variety of porous adsorption materials like silica, activated carbon, zeolites, chalcogenide aerogels and microporous polymers have been explored to capture radioactive iodine.9–14 The development of novel material and technology to selectively remove the radioactive iodine with high efficiency is of importance and challenging. MOFs allow selective capture and release of specific compounds due to their well-defined cages and channels in the structure, which has attracted intense interest. Assaad reported that higher I2 and radioiodine adsorption kinetics was shown by activated MIL-101 in cyclohexane with iodine removal of 97.9% after 24 h.15 Parise et al. have reported two microporous MOFs of SBMOF-1 and SBMOF-2 for the adsorption of iodine and the specific interaction of benzene ring-halogen can preferentially adsorb iodine molecules instead of water molecules in a humid environment.16 The host MOF rich in π electrons and N-containing species can form charge transfer compounds with guest iodine molecules and improve the affinity of MOF to iodine.17 Therefore the accurate choice of the ligand is crucial for the rational design of functional MOFs that can adsorb iodine molecules. 5-(3-Carboxypyridin-4-yl)isophthalic (H3L), as a nitrogen-containing heterocyclic carboxylate bifunctional ligand, for the construction of multifunctional MOFs, have aroused a good deal of interest owing to their various coordination modes.
In addition to adsorption capacity, MOFs are also of great interest in other fields. In recent years, perovskite solar cells (PSCs) have witnessed tremendous advancements in power conversion efficiency (PCE) and operating lifetime.18–21 MOFs have also been applied in PSCs, which have the potential to improve the device efficiency and stability.22,23 The Wei group prepared a ZIF-8 layer coated on the surface of the mp-TiO2 film, ZIF-8 combined mp-TiO2 film can increase the particle size of the adjacent perovskite films, thus increasing the device performance of the resultant PSCs.24 Hu et al. have reported one type of Zr-MOF of UiO-66 modified PSCs, which deliver a champion PCE exceeding 23% with noticeably improved stability.25
In this work, based on nitrogen-containing heterocyclic carboxylate ligand H3L, a new compound {Cd(H2L)2}n (Cd-MOF) was synthesized under solvothermal conditions, featuring a 2D layer with honeycomb architecture. The presence of π-electron-rich moieties and uncoordinated nitrogen atoms in the framework make Cd-MOF an adsorbent to capture iodine reversibly in cyclohexane solution. The static adsorption and adsorption kinetics of Cd-MOF for iodine anions removal were investigated. Moreover, the 2D Cd-MOF as an interlayer material can be introduced in PSCs to increase the power conversion efficiency of the PSC by reducing surface defects and enhancing holes extraction ability.
Experimental
Materials and methods
All starting materials of MOFs and ligand (H3L) were bought and directly used without further purification. The SnO2 (tin(IV) oxide) colloid dispersion (15 wt%) was obtained from Alfa Aesar. N,N-Dimethylformamide (DMF, anhydrous), dimethyl sulfoxide (DMSO, anhydrous), lead bromide (PbBr2, 99.99%), lithium bis(trifluoromethanesulfonyl) imide (LiTFSI) and 4-t-butylphenylammonium iodide (tBP) were purchased from Sigma-Aldrich. The patterned indium tin oxide (ITO) glass substrates (15 Ω sq−1), lead(II) iodide (PbI2, 99.999%), formamidinium iodide (FAI, 99.5%), and spiro-OMeTAD (99.99%) were purchased from Advanced Election Technology Co., Ltd. Methylammonium chloride (MACl) (99.5%), methylammonium bromide (MABr).Powder X-ray diffraction (PXRD) was carried out on a D8 Advance davinci diffractometer (Cu Kα radiation; λ = 1.54178 Å). The Fourier transform infrared (FTIR) spectra were recorded in KBr discs on a Nicolet 6700 FTIR spectrometer in the 400–4000 cm−1 region. Elemental content (C, H and N) was studied on an Elementar Vario EL elemental analyzer. Scanning electron microscopy (SEM) images were taken from a Verios G4 UC scanning electron microscope. UV spectroscopy measurements were implemented by a UV-vis 5200 PC spectrophotometer. X-ray photoelectron spectra (XPS) was recorded on a Kratos AXIS Ultra DLD spectrometer using an Al Kα radiation source. Raman spectroscopy was performed using a Renishaw inVia Reflex instrument with an excitation wavelength of 532 nm. The current–voltage (J–V) measurement and steady-state power output of the devices were performed on Keithley 2400 Series Source Meter under standard AM 1.5 G illumination via a solar simulator (SS-F5-3A, Enlitech), and the light was calibrated to 100 mW cm−2 using a calibrated silicon reference cell. The J–V measurements were carried out in nitrogen-filled glove box. The devices were measured both in reverse scan (1.2–0.1 V, step 0.02 V) and forward scan (−0.1–1.2 V, step 0.02 V), and the delay time was 20 ms. The external quantum efficiency (EQE) data were obtained by using the solar-cell spectral-response measurement system (QE-R, Enlitech).
Preparation of Cd-MOF
A mixture of H3L (0.025 mmol, 7.1 mg), Cd(NO3)2·4H2O (0.1 mol L−1, 0.5 mL), 1 mL of CH3CN, 4 mL of deionized water, and 100 μL of HNO3 (1 mol L−1) was added into a glass reactor, which was heated at 100 °C for 48 h. The colorless plate crystals of Cd-MOF were gathered after cooling, rinsed with CH3CN, and dried at room temperature. Yield: 62%. Anal. calcd for C28H16CdN2O12 (%): C, 49.12; H, 2.34; N, 4.09. Found (%): C, 48.52; H, 2.46; N, 3.61.X-ray crystallography
Crystallographic data of Cd-MOF were collected at room temperature on a Bruker APEX-II CCD Venture diffractometer with graphite-monochromated Mo Kα radiation (λ = 0.71073 Å). The structure was solved with the SHELXT structure solution program using intrinsic phasing and refined with the SHELXL refinement package using least squares minimization by Olex2 program. All non-hydrogen atoms were refined with anisotropic displacement parameters during the final cycles. The hydrogen atoms were calculated in ideal positions with isotropic displacement parameters. The final empirical formula was obtained by combining the crystallographic, elemental and thermogravimetric analysis data. The crystallographic data and structural results are summarized in Table S1.†Iodine capture experiment
Prior to iodine adsorption, the Cd-MOF were first heated in vacuum at 120 °C overnight. Furthermore, the iodine adsorption experiments were also performed in the solution state using solvent cyclohexane. 40 mg fresh samples were added into a 15 mL cyclohexane solution of I2 (0.2 mg mL−1). UV-visible spectrophotometer was implemented to monitor the color change at different time intervals. Iodine was released using ethanol, 40 mg iodine adsorbed Cd-MOF sample in 5 mL ethanol at room temperature for 48 h and absorbance data was collected using a UV-visible spectrophotometer.The iodine adsorption efficiency was calculated as eqn (1)
| % removal = [C0 − Ct]/C0 × 100 | (1) |
Device fabrication
The ITO glass was cleaned in deionized water, ethanol, and isopropyl alcohol sequentially, then treated with ultraviolet ozone (UVO) for 20 min before coated with SnO2 precursor (diluted by water with the ratio of SnO2![[thin space (1/6-em)]](https://www.rsc.org/images/entities/char_2009.gif) :
:![[thin space (1/6-em)]](https://www.rsc.org/images/entities/char_2009.gif) H2O = 1
H2O = 1![[thin space (1/6-em)]](https://www.rsc.org/images/entities/char_2009.gif) :
:![[thin space (1/6-em)]](https://www.rsc.org/images/entities/char_2009.gif) 4, v/v) at 4000 rpm for 30 s. After thermal annealed the ITO/SnO2 samples at 150 °C for 30 min in ambient air, the substrates were treated by UVO for 20 min. The perovskite precursor solution (1.53 M PbI2, 1.4 M FAI, 0.5 M MACl, and 0.153 M (10 mol%) MAPbBr3 in DMF
4, v/v) at 4000 rpm for 30 s. After thermal annealed the ITO/SnO2 samples at 150 °C for 30 min in ambient air, the substrates were treated by UVO for 20 min. The perovskite precursor solution (1.53 M PbI2, 1.4 M FAI, 0.5 M MACl, and 0.153 M (10 mol%) MAPbBr3 in DMF![[thin space (1/6-em)]](https://www.rsc.org/images/entities/char_2009.gif) :
:![[thin space (1/6-em)]](https://www.rsc.org/images/entities/char_2009.gif) DMSO = 8
DMSO = 8![[thin space (1/6-em)]](https://www.rsc.org/images/entities/char_2009.gif) :
:![[thin space (1/6-em)]](https://www.rsc.org/images/entities/char_2009.gif) 1) was then deposited via a consecutive two-step spin coating procedure at 1000 rpm for 10 s, and 5000 rpm for 30 s, respectively. During the second step, 150 μL chlorobenzene (CB) drop-casted on the sample at the end of 15 s. Afterwards, the FTO/SnO2/perovskite sample was annealed at 100 °C for 60 min. After cooling to room temperature, for the film treated with Cd-MOF, 60 μL Cd-MOF with in isopropanol was deposited at 3000 rpm for 30 s. Then the hole transporting layer was fabricated on the top of the perovskite film by spin-coating the spiro-OMeTAD solution at 3500 rpm for 30 s with the composition of 72.8 mg spiro-OMeTAD, 18.8 μL Li-TFSI solution (500 mg in 1 mL acetonitrile), 28.8 μL tBP solution, 30 μL Co(III) TFSI solution (300 mg in 1 mL acetonitrile), and 1 mL chlorobenzene. Finally, 100 nm Au was deposited via thermal evaporation.
1) was then deposited via a consecutive two-step spin coating procedure at 1000 rpm for 10 s, and 5000 rpm for 30 s, respectively. During the second step, 150 μL chlorobenzene (CB) drop-casted on the sample at the end of 15 s. Afterwards, the FTO/SnO2/perovskite sample was annealed at 100 °C for 60 min. After cooling to room temperature, for the film treated with Cd-MOF, 60 μL Cd-MOF with in isopropanol was deposited at 3000 rpm for 30 s. Then the hole transporting layer was fabricated on the top of the perovskite film by spin-coating the spiro-OMeTAD solution at 3500 rpm for 30 s with the composition of 72.8 mg spiro-OMeTAD, 18.8 μL Li-TFSI solution (500 mg in 1 mL acetonitrile), 28.8 μL tBP solution, 30 μL Co(III) TFSI solution (300 mg in 1 mL acetonitrile), and 1 mL chlorobenzene. Finally, 100 nm Au was deposited via thermal evaporation.
Results and discussion
Crystal structure of Cd-MOF
X-ray crystallography determination reveals that Cd-MOF crystallized in a monoclinic system with space group C2/c and exhibited a two-dimensional (2D) network. The asymmetric unit is composed of one Cd(II) ion and two H2L− ligands. In Fig. 1a, the coordinated environment of the Cd ion can be described as a distorted octahedral geometry, defined by six O atoms from four different H2L− ligands. The Cd–O distances are in the ranges of 2.217(2)–2.361(2) Å, all within the normal range.26 The HL2− block functions as a μ2-O3 linker and its two deprotonated COO-functionalities are monodentate and bidentate. In H2L− block, the dihedral angle among the picolinate and isophthalate functionalities are 84.6(9)° and 79.5(9)°, respectively (Fig. 1b).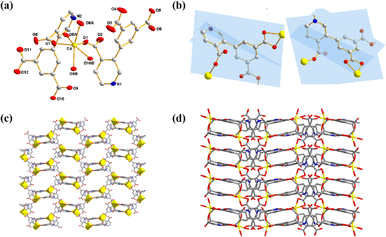 | ||
| Fig. 1 (a) Coordination environment of Cd(II) ions. (b) Coordination mode of H2L− ligand. (c) 2D structure of Cd-MOF. (d) 3D supramolecular structure. | ||
As depicted in Fig. S5,† two HL2− ligands as μ2-O3 linkers joins two adjacent Cd(II) centers with monodentate and bidentate mode to generate a binuclear [Cd2O2(L)2(COO)2] cluster. These binuclear clusters are further linked via the carboxylic groups of HL2− ligands to build a 2D honeycomb architecture layer (Fig. 1c). There is a large amount of hydrogen bonds: N–H⋯O and O–H⋯O in Cd-MOF (Fig. S6†). The N–H⋯O and O–H⋯O distances are 1.944 Å(6) and 1.798(7) Å, respectively. These hydrogen bonds link adjacent layers to construct a stable 3D supramolecular structure (Fig. 1d).
Characterization
The PXRD patterns was performed to confirm the phase purity of the sample. The as-synthesized patterns of MOF powder match well with the simulated patterns as depicted in Fig. S1.† Thermogravimetric analysis (TGA) was used to investigate the stability of Cd-MOF upon heating under an air atmosphere (Fig. S4†). Cd-MOF exhibits a sharp weight loss above 340 °C, which is ascribed to the decomposition of the framework and showed the higher thermal stability. SEM images showed the outer morphology of the single crystals of the Cd-MOF. The IR spectra of Cd-MOF show the characteristic bands of the carboxylic groups in the usual region around 1404 cm−1 for the symmetric vibrations and at 1586 cm−1 for the asymmetric vibrations, respectively (Fig. S2†). The peak around 1702 cm−1 indicates that some carboxyl groups of organic moieties are not deprotonated, which is consistent with the result of the single-crystal X-ray analysis.Iodine capture
Owing to the presence of pyridinium (–NH) group and the π-electron in the framework of Cd-MOF, a series of tests was performed to evaluate its ability of Cd-MOF corresponding to the adsorption and release of iodine in the solution phase. The activated sample of Cd-MOF (40 mg) was soaked in 15 mL 0.2 mg mL−1 cyclohexane solution of I2 in a sealed vial at room temperature (without stirring). As shown in Fig. S9,† it was observed that the deep purple color of the iodine solution faded gradually over time in glass vial. Meanwhile, the color of Cd-MOF changed from colourless to dark brown over time, indicating the iodine adsorption from the solution into the Cd-MOF framework. The change of I2 concentration in solution with time was monitored by UV-vis absorption spectroscopy. The absorption peak nearly at 500 nm corresponds to iodine in the cyclohexane solution. As can be seen from Fig. 2a, the absorption intensities of I2 gradually decreased with increasing immersion time.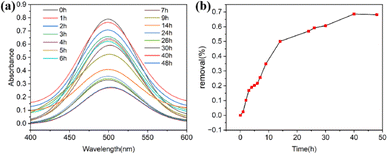 | ||
| Fig. 2 (a) UV-vis spectra of Cd-MOF adsorbing iodine over time in a cyclohexane solution of iodine. (b) Removal efficiency of Cd-MOF toward iodine in cyclohexane solution of iodine. | ||
As shown in Fig. 2b, rapid adsorption of Cd-MOF for iodine was detected at the initial stage. The removal efficiency was achieved at 32% and the adsorption amount could reach 26.2 mg g−1 after 9 h. The absorption peak falled to a minimum and the removal efficiency was achieved at 68.6% after 40 h, indicated that the adsorption process reached the sorption equilibrium. The adsorption system of Cd-MOF toward iodine capture established equilibrium and adsorption capacity was about 51.4 mg g−1 in the solution phase after 40 h.
Adsorption kinetics
The kinetics of I2 adsorption for Cd-MOF was employed to further understand the impact of the contact time of Cd-MOF on iodine solution. The kinetics fitted well with a pseudo-second-order kinetics model (Qe and Qt represent the adsorption amounts (mg g−1) at equilibrated and determined times, respectively, t represents the time, and k2 is the pseudo-second-order rate constant).27,28 The fitted result demonstrated that the R2 value of the pseudo-second-order model is 0.981 (Fig. 3a), demonstrating a rate-controlling step during the adsorption process for Cd-MOF. Desorption experiment was performed by soaking iodine-loaded Cd-MOF crystals in ethanol. The UV-vis absorption peaks showed desorption process of iodine at room temperature obviously. As shown in Fig. S9,† the absorption bands observed at 290 nm and 358 nm can be assigned to I3− and I5−, respectively. Approximately 2 hours, desorption process reached equilibrium, and the absorption peak almost reached its maximum intensity. The PXRD pattern of Cd-MOF after the iodine adsorption experiment is in agreement with the simulated one, indicating that after absorbing the I2 the host framework is well maintained. The difference in intensity may be ascribed to the preferred orientation of the powder samples or diffuse scattering of adsorbed iodine.8,29,30
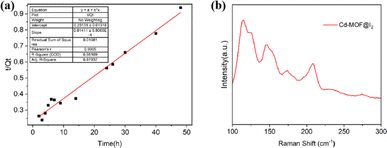 | ||
| Fig. 3 (a) Pseudo-second-order kinetics for the adsorption process of iodine by Cd-MOF in cyclohexane solution. (b) Raman spectra of Cd-MOF after iodine loading. | ||
Adsorption mechanism
To the evaluation of the adsorption effect of iodine ions by Cd-MOF, a series of characterizations such as PXRD, Raman were conducted. As shown in Fig. S1,† the primary characteristic peaks of Cd-MOF still was retained after adsorption and desorption process but the intensity varies. Furthermore, Raman spectroscopy was employed to analyse the interaction between adsorbed I2 molecules and the MOF. Raman spectra were also recorded and showed two types of peaks in Fig. 3b, which appeared at approximately 147 cm−1, 173 cm−1 and 208 cm−1, corresponding to the asymmetric stretching mode of I5−, I3− and the vibration of neutral I2, respectively.31,32 Combining the results of characterizations with the adsorption experiment, it can be concluded that (1) I2 could interact with molecules containing donor element–N in the structure of MOF to give charge-transfer (CT) adducts; (2) abundant π-electron of framework contribute to strengthen the affinity of MOF toward iodine.PSCs with Cd-MOF
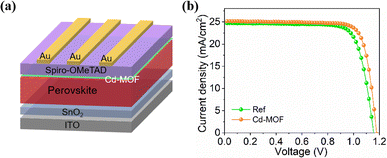
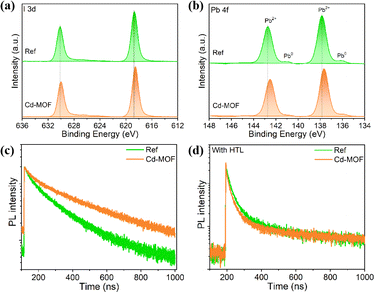
We employed the Cd-MOF in the PSCs at the perovskite surface with the device structure of ITO-glass/SnO2/perovskite/Cd-MOF/spiro-OMeTAD/Au (Fig. 4a). The current density versus voltage (J–V) curves of with Cd-MOF treatment was examined as shown in Fig. 4b. The reference PSC exhibits a short-circuit current density (JSC) of 24.71 mA cm−2, an open circuit voltage (VOC) of 1.170 V and a fill factor (FF) of 74.95%, yield a PCE of 21.68%. While the PSC with Cd-MOF displays a higher PCE of 23.71% (JSC of 25.16 mA cm−2, VOC of 1.179 V and FF of 79.90%). We further applied X-ray photoelectron spectroscopy (XPS) to characterize the elemental distribution on the surface of perovskite films without and with Cd-MOF treatment, and the result was shown in Fig. 5a and b. The peaks of Pb 4f and I 3d of perovskite film with Cd-MOF both shift to lower binding energy compared to the reference perovskite film, indicating the Cd-MOF can interact with the surface perovskite. In addition, the perovskite film with Cd-MOF shows weaker Pb0 peak than those in the reference samples, indicating that the reduction of Pb2+ was inhibited effectively due to the reduced superoxide ions (O2−) concentrations. Therefore, the surface defects related to Pb0 were effectively passivated by Cd-MOF. Furthermore, time-resolved photoluminescence (TrPL) spectrum of two kinds perovskite films with and without hole transport layer (HTL) was conducted, as shown in Fig. 5c and d. The lifetime of the Cd-MOF treated film is longer than that of the reference film thanks to reduced defects. TRPL spectra of perovskite films with spiro-OMeTAD HTL were analyzed. The lifetime of two films is substantially shortened when the HTL was applied because of the charge extraction. The Cd-MOF treated film exhibits much better hole extraction than that of the reference films (Fig. 5d). Moreover, we took the electrochemical impedance spectroscopy (EIS) measurement of PSCs in the dark as shown in Fig. S11.† The fitting values of the series resistance (Rrec) corresponding to PSC without and with Cd-MOF are 1727 and 2146 Ω. It was obvious that the devices with Cd-MOF treatment exhibited a larger value of Rrec than the reference solar cells, The larger Rrec indicates effective suppression of the charge recombination, which is beneficial to improve the PCE of devices. These results clearly verify that the Cd-MOF treatment assists efficient hole extraction due to its passivation of surface defects and suppressed charge recombination, which is conducive to achieve highly efficient device.Conclusions
In summary, we reported a novel 2D Cd-MOF based on semirigid 5-(4-carboxypyridin-3-yl)isophthalic ligand, which exhibited honeycomb architecture with hexagonal windows. Owing to the uncoordinated N sites and aromatic rings in frameworks, Cd-MOF can be used as a promising candidate for the iodine capture in cyclohexane solution and the removal efficiency of iodine reached 68.6% after 40 h. Meanwhile, we have constructed 2D Cd-MOF to passivate surface defect in the PSCs, leading to efficient hole extraction, thus boosting the device PCE to 23.71%, outperforming the reference device of 21.68%. This work unravels the effectiveness of using perovskite/MOF heterojunction to fabricate efficient solar cells, providing a new strategy for the future design of PSCs.Data availability
Data will be made available on request.Conflicts of interest
There are no conflicts to declare.Acknowledgements
This work is financially supported by the Talent Introduction Foundation (1140457G20220546).Notes and references
- J. Lee, O. K. Farha, J. Roberts, K. A. Scheidt, S. T. Nguyen and J. T. Hupp, Chem. Soc. Rev., 2009, 38, 1450–1459 RSC
.
- K. Shen, L. Zhang, X. Chen, L. Liu, D. Zhang, Y. Han, J. Chen, J. Long, R. Luque, Y. Li and B. Chen, Science, 2018, 359, 206–210 CrossRef CAS PubMed
.
- X.-W. Wang, L. S. Fu and G.-H. Cui, Polyhedron, 2023, 244, 116624 CrossRef CAS
.
- J. Y. Cheng, K. L. Liu, X. Li, L. Huang, J. Liang, G. P. Zheng and G. C. Shan, Environ. Sci. Technol., 2020, 3, 100035 Search PubMed
.
- Q. T. N. Le and K. Cho, J. Colloid Interface Sci., 2021, 581, 741–750 CrossRef CAS PubMed
.
- Y.-E. Jung, S.-W. Kang and M.-S. Yim, Ind. Eng. Chem. Res., 2021, 60, 5964–5975 CrossRef CAS
.
- R. A. Agarwal, Cryst. Growth Des., 2021, 21, 2046–2055 CrossRef CAS
.
- P. Chen, X. H. He, M. B. Pang, X. T. Dong, S. Zhao and W. Zhang, ACS Appl. Mater. Interfaces, 2020, 12, 20429–20439 CrossRef CAS PubMed
.
- S. M. Scott, T. Hu, T. K. Yao, G. Q. Xin and J. Lian, Carbon, 2015, 90, 1–8 CrossRef CAS
.
- J. E. T. Hoeve and M. Z. Jacobson, Energy Environ. Sci., 2012, 5, 8743–8757 RSC
.
- K. S. Subrahmanyam, D. Sarma, C. D. Malliakas, K. Polychronopoulou, B. J. Riley, D. A. Pierce, J. Chun and M. G. Kanatzidis, Chem. Mater., 2015, 27, 2619–2626 CrossRef CAS
.
- Y. S. Shimamoto, Y. Takahashi and Y. Terada, Environ. Sci. Technol., 2011, 45, 2086–2092 CrossRef CAS PubMed
.
- F. C. Küpper, M. C. Feiters, B. Olofsson, T. Kaiho, S. Yanagida, M. B. Zimmermann, L. J. Carpenter, G. W. Luther, Z. L. Lu, M. Jonsson and L. Kloo, Angew. Chem., Int. Ed., 2011, 50, 11598–11620 CrossRef PubMed
.
- Y.-T. Yang, C.-Z. Tu, J.-Y. Shi, X.-L. Yang, J.-J. Liu and F.-X. Cheng, J. Solid State Chem., 2022, 311, 123133 CrossRef CAS
.
- T. Assaad and B. Assfour, J. Nucl. Mater., 2017, 493, 6–11 CrossRef CAS
.
- D. Banerjee, X. Y. Chen, S. S. Lobanov, A. M. Plonka, X. J. Chan, J. A. Daly, T. Kim, P. K. Thallapally and J. B. Parise, ACS Appl. Mater. Interfaces, 2018, 10, 10622–10626 CrossRef CAS PubMed
.
- H. Ma, J.-J. Chen, L. X. Tan, J.-H. Bu, Y. H. Zhu, B. Tan and C. Zhang, ACS Macro Lett., 2016, 5, 1039–1043 CrossRef CAS PubMed
.
- C. Gong, C. Zhang, Q. X. Zhuang, H. Y. Li, H. Yang, J. Z. Chen and Z. G. Zang, Nano-Micro Lett., 2023, 15, 17 CrossRef CAS PubMed
.
- Q. X. Zhuang, H. Y. Li, C. Zhang, C. Gong, H. Yang, J. Z. Chen and Z. G. Zang, Adv. Mater., 2023, 35, 2303275 CrossRef CAS PubMed
.
- H.
Y. Li, C. Zhang, C. Gong, D. L. Zhang, H. Zhang, Q. X. Zhuang, X. M. Yu, S. K. Gong, X. H. Chen, J. B. Yang, X. H. Li, R. Li, J. W. Li, J. F. Zhou, H. Yang, Q. Q. Lin, J. H. Chu, M. Grätzel, J. Z. Chen and Z. G. Zang, Nat. Energy, 2023, 8, 946–955 CrossRef CAS
.
- C. Zhang, H. Y. Li, C. Gong, Q. X. Zhuang, J. Z. Chen and Z. G. Zang, Energy Environ. Sci., 2023, 16, 3825–3836 RSC
.
- D. D. Sante, A. Stroppa, P. Jain and S. Picozzi, J. Am. Chem. Soc., 2013, 135, 18126–18130 CrossRef PubMed
.
- D. Y. Heo, H. H. Do, S. H. Ahn and S. Y. Kim, Polymers, 2020, 12, 2061 CrossRef CAS PubMed
.
- D. L. Shen, A. Y. Pang, Y. F. Li, J. Dou and M. D. Wei, Chem. Commun., 2018, 54, 1253–1256 RSC
.
- X. Liang, K. Zhou, D. W. Duan, F. Wang, C. Y. Ge, X. F. Zhou, M. J. Yuan, Y. M. Shi, H. R. Lin, Q. Y. Zhu, G. Li and H. L. Hu, Chem. Eng. J., 2023, 459, 141524 CrossRef CAS
.
- A. Das, S. A. Hussain, H. Banik, D. Maiti, T. Aktar, B. Paul, P. Debnath, L. Sieroñ, A. Bhattacharya, K. L. Bhowmik, W. Maniukiewicz and P. Debnath, Polyhedron, 2024, 247, 116747 CrossRef CAS
.
- Y.-L. Wang, X.-Y. Li, S.-D. Han, J. Pan and Z.-Z. Xue, Cryst. Growth Des., 2022, 22, 3719–3726 CrossRef CAS
.
- S. Kamal, M. Khalid, M. S. Khan, M. Shahid and M. Ahmad, Cryst. Growth Des., 2022, 22, 3277–3294 CrossRef CAS
.
- L. Y. Wang, T. Li, X. T. Dong, M. B. Pang, S. T. Xiao and W. Zhang, Chem. Eng. J., 2021, 425, 130578 CrossRef CAS
.
- X. R. Zhang, I. da Silva, H. G. W. Godfrey, S. K. Callear, S. A. Sapchenko, Y. Q. Cheng, I. Vitórica-Yrezábal, M. D. Frogley, G. Cinque, C. C. Tang, C. Giacobbe, C. Dejoie, S. Rudić, A. J. Ramirez-Cuesta, M. A. Denecke, S. H. Yang and M. Schröder, J. Am. Chem. Soc., 2017, 139, 16289–16296 CrossRef CAS PubMed
.
- L. Y. Xu, Q. Zheng, Y. Y. Wang, L. P. Jiang, J. T. Jiang and J. H. Qiu, Sep. Purif. Technol., 2021, 274, 118436 CrossRef CAS
.
- A. J. Blake, W. S. Li, V. Lippolis, M. Schröder, F. A. Devillanova, R. O. Gould, S. Parsons and C. Radek, Chem. Soc. Rev., 1998, 27, 195–206 RSC
.
Footnote |
| † Electronic supplementary information (ESI) available. CCDC 2371872. For ESI and crystallographic data in CIF or other electronic format see DOI: https://doi.org/10.1039/d4ra05219f |
| This journal is © The Royal Society of Chemistry 2024 |

