 Open Access Article
Salt-resistant continuous solar evaporation composites based on nonwovens with synergistic photothermal effect of graphene oxide/copper sulphide†
Wenbo Sunab,
Huan Qi *bc,
Tan Liab,
Minggang Linab,
Chuyang Zhangab and
Yiping Qiubc
aCollege of Textile and Apparel, Xinjiang University, Urumqi 830000, Xinjiang, China
bInstitute of Smart & Ecological Textile, Quanzhou Normal University, Fujian 362002, China
cCollege of Textiles and Apparel, Quanzhou Normal University, Fujian 362002, China. E-mail: qhqh123@126.com
First published on 12th September 2024
Abstract
Solar interfacial evaporation is an innovative and environmentally friendly technology for producing freshwater from seawater. However, current interfacial evaporators are costly to manufacture, have poor tolerance to environmental conditions, exhibit instability in evaporation efficiency in highly saline solutions, and fail to prevent salt crystallization. The production of user-friendly, durable and salt-resistant interfacial evaporators remains a significant challenge. By spraying graphene oxide on a nonwoven material using PVA as a binder and adding biphasic CuxS by an in situ growth method, we designed 2D/3D micro- and nanostructured graphene oxide nanosheets/copper sulfide nanowires (GO/CuxS) with synergistic photo-thermal effects in the full spectral range. The evaporation efficiency in pure water was 94.61% with an evaporation rate of 1.5622 kg m−2 h−1. In addition, we enhanced convection by employing a vertically aligned water-guide rod structure design, where the concentration difference drives salt dissolution thereby reducing the formation of salt crystals. The evaporation efficiency in 20% salt water was 80.41% with an evaporation rate of 1.3228 kg m−2 h−1 and long-term stability of brine evaporation was demonstrated under continuous sunlight. This solar steam generator expands the potential application areas of desalination and wastewater purification.
1 Introduction
With the rapid industrialization of today's societies, significant amounts of freshwater resources are being consumed and depleted. Seawater is abundant, with total water reserves on Earth of approximately 1386 million cubic kilometers, of which seawater accounts for approximately 97%.1–3 Seawater desalination can be a viable solution to the issue of water scarcity. The primary method for producing fresh water from seawater is reverse osmosis. The equipment used in this process demonstrates a high level of automation, stable efficiency, purity and other characteristics.4–8 However, the reverse osmosis process is very energy-intensive. High-temperature, high-energy consumption equipment is required, and the membrane has a short service life. Therefore, it is necessary to develop sustainable and low-cost desalination technologies. Among these, interfacial solar distillation is a promising sustainable technology that converts abundant solar energy into clean water.9–12Many researchers have focused on the development of highly efficient photothermal materials and advanced evaporation structures, including carbon-based materials,13–17 biomass materials,18–23 polymers,24–27 metal–semiconductor materials,28–31 and natural mineral materials.32–34 Due to their high energy conversion efficiency and sophisticated functional design for solar energy distillation, organic–inorganic composite materials have garnered significant attention in recent years.35–37 These two components are typically used as a solar absorber and insulator, respectively, to achieve synergistic photothermal enhancement.38 Gold nanoparticles (AuNPs) have been widely used in solar evaporation due to the surface plasmon resonance effect.39 Zheng et al. designed colloidal plasma AuNPs capped with ligands of different types and surface coverage densities (i.e., purified and unpurified oleylamine-capped or thiol-protected AuNPs) and investigated the effect of surface chemistry on the self-assembly of AuNPs to achieve excellent evaporation efficiency using photoexcited plasma heating.40 However, the high cost, scarcity and complex preparation process of gold nanomaterials limit their practical applications.
Carbon-based photothermal materials, especially carbon nanotubes, graphene and carbon black, are characterized by a wide range of light absorption and good chemical stability. These materials have been increasingly utilized in the field of photothermal conversion. For instance, Li et al. reported on carbon nanotubes as an efficient solar team generator. The composite evaporator, prepared by embedding multi-armed carbon nanotubes (CNTs) and polydopamine (PDA) on an ES nonwoven fabric, exhibits excellent light absorption and hydrophilicity. Under 1.0 solar irradiation. The light absorption rate reaches as high as 90.77%, and the water evaporation rate is 1.29 kg m−2 h−1.41 However, carbon-based photothermal materials have limitations in terms of thermal conductivity. Semiconductor photothermal materials are receiving increasing attention in the field of solar vapour dialysis due to their low cost, high photothermal conversion efficiency, excellent photostability, and enhanced near-infrared (NIR) absorption through excitation of local surface plasmon resonances (LSPRs). Hang et al. reported an extremely simple and low-cost interfacial heating film for high-efficiency solar steam generation. The composite film consists of a viscose cellulose film loaded with CuS hollow nanospheres. The CuS/cellulose composite film, prepared using a solvothermal method, functions as a highly efficient solar absorber (>94.0%), vapor channel, and thermal insulator (with a thermal conductivity of 0.06 W m−1 K−1), achieving an efficiency of 85% under solar irradiation (1.0 kW m−2).42 During seawater evaporation, salt crystals continue to accumulate on the surface of composites, significantly reducing the efficiency of the evaporation process. The hydrophobic treatment of the surface by chemical reagents can well prevent the generation of salt crystals. Zhang et al. reported the preparation of a hydrophobic and porous carbon nanofiber (HPCNF) by combining porogen sublimation and fluorination. Under sunlight irradiation, the evaporation rate and efficiency can reach up to 1.43 kg m−2 h−1 and 87.5%, respectively.43 Importantly, the exceptional water resistance provides the absorber with superior corrosion resistance and salt rejection performance. Surface fluoridation is likely to cause environmental pollution and even secondary pollution of water due to incorrect preparation and application methods. Therefore, it is particularly important to develop more environmentally friendly methods to resist salt crystallisation.
Fibrous materials with unique flexibility, durability, processability, practicability, and multifunctionality have attracted considerable attention in the ISSG field. Ge et al. reported the basics of fibrous materials, such as their classification, manufacturing methods and flexible fibrous structure, are firstly introduced. The outstanding properties of fibrous materials on different dimensions are demonstrated, as well as the versatile morphologies and structures that allow fibrous materials to carry out different roles in ISSG.44 Nonwoven materials are also gradually being used for interface evaporation due to their low production costs and other characteristics. Zhao et al. This article reviews the recent progress of electrospun nanofiber-based evaporation systems focusing on polymer selection, available solar materials, incorporation strategies of solar materials, system configurations, factors influencing the performance, and applications of electrospun nanofiber evaporation systems.45 Chong et al. hydrophobic industrial-grade carbon fiber membrane (CFM) with good photoabsorption was surface-modified with polydopamine (PDA) to prepare superhydrophilic CFM@PDA for the construction of efficient hanging-model evaporators without salt accumulation.46 Needle-punched PET nonwoven materials are made of PET fibres, which have the characteristics of cost-effective, high porosity, fluffy and soft. Therefore, the fabrication of durable nonwoven fabric-based evaporators has considerable potential for application.
Herein, inspired by nature, we have designed interfacial evaporators with lotus leaf-like vertical water-conducting structures, which effectively utilize concentration differences to drive reduced salt crystallization and can be used for sustained solar-powered evaporation and desalination. We fabricated 2D/3D micro- and nanostructured graphene nanosheets/copper sulphide nanowires with a synergistic photothermal effect by coating graphene nanosheets on needle-punched nonwoven fabrics using a spraying method. Subsequently, biphasic copper sulphide Cu2−xS (0 < x < 1) was generated through in situ oxidation and precipitation transformations. The hierarchical structure of GO/CuxS @PET composites promotes light reflection and scattering, while the combined photothermal effect of GO and CuxS significantly improves light absorption. On this basis, the mechanisms of resistance to evaporation and salt crystallization of the composites were proposed. The excellent evaporation stability of the prepared nonwoven composites makes them potential candidates for treating seawater and wastewater.
2 Materials and methods
2.1 Materials
Needle-punched polyester nonwoven fabric (110 g m−2) was provided by Zhuofang Industry Co., Ltd, (Dongguan, China). Graphene oxide (length ≤ 30.0 μm, diameter 15 ± 5.0 nm) was purchased from Shanghai Aladdin Reagent Co., Ltd, (Shanghai, China). Polyvinyl alcohol pellets, copper chloride dihydrate (CuCl2·2H2O), sodium hydroxide (NaOH) and sodium sulphate (Na2S), and anhydrous ethanol were purchased from McLean Reagent Co., Ltd, (Shanghai, China). All chemicals were used without further purification.2.2 Fabrication of the composite evaporator
2.3 Characterization
Scanning electron microscopy (SEM, TESCAN MIRA LMS, Czech Republic) was used to characterize the micromorphology and elemental distribution of the solar interface composite evaporator. The surface chemistry of the coated PET fibres was analysed by FTIR spectrometer (ATR, Thermo Scientific Nicolet iN10, USA), X-ray diffractometer (Rigaku SmartLab SE, Japan), and X-ray photoelectron spectrometer (Thermo Scientific K-Alpha, USA). The ultraviolet-visible-near-infrared absorption spectrometer (Shimadzu UV-3600i Plus, Japan) was used to determine the light absorption capacity of the evaporator in the wavelength range of 200 to 2500 nm. A sunlight simulator (Sola-500 T Nbet, Beijing, China) and a handheld infrared thermal imager (FLIR-E64501, US) was used in combination to evaluate the photothermal conversion efficiency of the evaporator. The surface wettability of the composite was characterized by measuring the water contact angle using an optical contact angle meter (CA-100A Innuo, Shanghai, China). An inductively coupled plasma spectrometer (Optima 7300 DV, USA) was used to measure the ion concentration of the simulated seawater before and after the solar desalination process. Carrier concentration, resistivity and mobility were measured using Hall Effect Tester (Ecopia HMS-7000, Korea). The wettability of the composite surfaces was characterized using an optical contact angle meter (CA-100A Innuo, Shanghai, China).2.4 Solar-driven evaporation measurement
Experimental data were obtained from a solar evaporator operating within a temperature range of 25.0 ± 1.0 °C and 60.0–70.0% humidity. Analogously, a sunlight source (Sola-500 T Nbet, Beijing, China) was used to provide various sunlight intensities for radiation, while an infrared thermal image was captured using an infrared thermal camera (FLIR-E64501, USA). An optical power meter (FZ400, Nbet, Beijing, China) was used to test the power of simulated sunlight. The temperature of the sample surface and water was recorded using a multi-channel thermocouple temperature tester (TA612C, TASi, China). An electronic balance (FA224C, Bona, China) was used to record changes in water mass during evaporation. Freshwater was collected in a lidded cylindrical acrylic container for evaporation experiments.3 Results and discussion
3.1 Preparation of the photothermal layer
The preparation process of the composite evaporator CuxS@PVA-GO-PET photothermal layer is depicted in Fig. 1a, where a commercial needle-punched PET nonwoven (110 g m−2) was used as the substrate. In addition to the advantages of chemical resistance and low cost, the multi-fine porous structure of PET nonwovens provides effective core absorption, while the high porosity enhances interfacial evaporation performance. Graphene oxide (GO) was utilized as a heat-absorbing material, which was sprayed onto the upper surface of PET and then dried at 80 °C for 10 minutes. The PVA solution was then sprayed onto the surface to coat the GO particles. Cross-linking occurs between the –OH group of PVA and the –COOH on the graphene oxide sheet to form an ester bond at high temperature (100 °C)47–49 Fig. 1b. And, the changes in chemical group content after cross-linking of PVA and GO can also be clearly seen by XPS test analysis Fig. S1,† and high-resolution XPS spectra of C 1s and O 1s XPS clearly shows that the cross-linking has a larger area and an increased number of ester groups. Fig. S2.† In addition, due to the connect of graphene oxide and PVA, more gaps are formed on the fiber surface, which increases the specific surface area of the fiber. The original non-woven material consists of PET fibers with fewer reactive groups except for the two end hydroxyl groups of the molecular chain. The introduction of PVA makes the fibers have a large number of reactive groups, which can adsorb copper ions onto the surface of the PVA film through van der Waals forces (intermolecular forces). So that copper ions form a physical adsorption layer of monomolecular multimolecular layers on the membrane surface. It greatly increases the loading of CuxS, which is favourable to the photothermal effect. The Cu2+-coated fabrics were subsequently immersed in NaOH solution and grew into dense and robust Cu(OH)2 nanostructures on the fiber surface. Since the solubility product constant (Ksp) of Cu2S (2.5 × 10−48) is much smaller than that of Cu(OH)2 (2.2 × 10⁻²⁰).24,50 A precipitation transformation process was used to immerse the Cu(OH)2 samples directly into Na2S aqueous solution to obtain dense and robust Cu2S nanoparticles.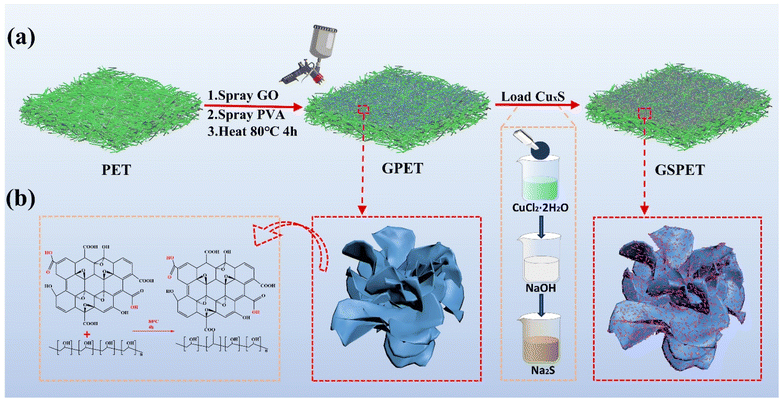 | ||
| Fig. 1 (a) Schemes for the preparation of GSPET, and microcharacterization of photothermal materials. (b) Process of cross-linking GO and PVA. | ||
3.2 Characterization of the composites
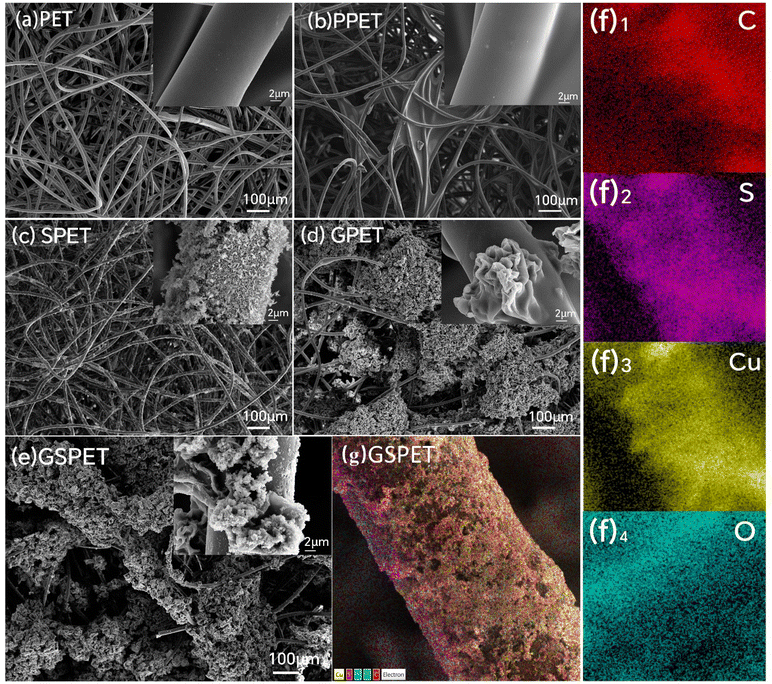
Field emission scanning electron microscopy (SEM) was used to obtain micromorphological and optical images of PET, GPET, SPET and GSPET. The surface of the raw PET fibers was smooth (Fig. 2a). The microscopic morphology of GPET after spraying shows that the fiber surface is overed with numerous graphene oxide particles coated with polyvinyl alcohol, creating a rough cluster structure (Fig. 2b). Additionally, more voids are formed on the surface, increasing the specific surface area of the fiber. This promotes diffuse reflection of light, increasing the efficiency of photothermal conversion. In addition, the dense copper sulphide nanoparticles grown in situ on the surface of PET fibers, forming a hierarchical structure, could be observed through the microscopic morphology of the SPET. The fibers were covered with massive copper sulphide particles exhibiting a wavy nanoscale structure (Fig. 2c). The presence of poly (vinyl alcohol) introduced a large number of hydroxyl groups, enabling the growth of nanoscale copper sulphide in large quantities on the surface (Fig. 2d). This increased the loading of Cu2S and led to a rougher surface for the flower-clustered graphene fibers. Formation of micrometer/nanometer-scale structures composed of GO and Cu2S particles. The gradient porous micro/nanostructure with a rough surface increases the specific surface area of the fiber. This structure also reduces the specular reflection of light and enhances the light absorption on the fiber surface, thereby increasing the photothermal conversion efficiency.The elemental composition of GSPET is illustrated in Fig. 2e. Fig. 2f(1)–f(3) illustrate the uniform distribution of the target elements C, Cu, and S. The elemental contents and distributions of the different samples are further compared in Fig. S1.† Only elements C, N and O are present on the surface of PET and GPET, while elements S and Cu are present in SPET and GSPET. These differences are attributed to the treatment with CuCl2, NaOH, and Na2S solution, which resulted in an abundance of copper sulphide on the surface of SPET and GSPET. The elements C, N, O, Cu and S were uniformly distributed across the entire surface of the modified PET, confirming the homogeneity of the in situ growth.
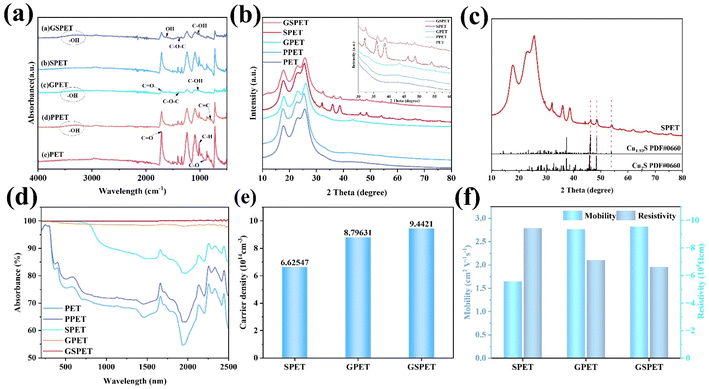
Fourier Transform Infrared (FTIR) characterization revealed changes in the chemical groups of PET, PPET, GPET, SPET and GSPET, displaying characteristic peaks of –OH and ethyl after PVA loading (Fig. 3a). These peaks were still clearly visible after the in situ loading of GO and CuxS. The characteristic PET peaks at 1408 cm−1 and 1339 cm−1 were obscured, resulting in a decrease in the peaks, which indicates the successful loading of these two substances. The results show that graphite oxide has a broader and stronger absorption peak at 3430 cm−1, which is attributed to the stretching vibrational peak of –OH groups. The telescopic vibrational peak of C![[double bond, length as m-dash]](https://www.rsc.org/images/entities/char_e001.gif) O on the carbonyl group of graphite oxide is observed at 1725 cm−1. The absorption peak at 1630 cm−1 corresponds to the bending vibrational absorption peak of C–OH, while the peak at 1110 cm−1 represents the vibrational absorption peak of C–O–C. In the XRD test curve, a sharp diffraction peak at 2θ = 12.9° was observed due to the (002) reflection of graphene oxide (Fig. 3b). Another sharp diffraction peak at 2θ = 43.3° was attributed to the (101) reflection of graphene oxide, providing evidence of successful loading of GO.
O on the carbonyl group of graphite oxide is observed at 1725 cm−1. The absorption peak at 1630 cm−1 corresponds to the bending vibrational absorption peak of C–OH, while the peak at 1110 cm−1 represents the vibrational absorption peak of C–O–C. In the XRD test curve, a sharp diffraction peak at 2θ = 12.9° was observed due to the (002) reflection of graphene oxide (Fig. 3b). Another sharp diffraction peak at 2θ = 43.3° was attributed to the (101) reflection of graphene oxide, providing evidence of successful loading of GO.
The XRD curves at 2θ of 32.28° and 48.6° showed diffraction peaks corresponding to reflections from the (103) and (110) crystal planes, respectively. This observation could confirm the successful growth of copper sulphide. The SPET samples were analyzed to determine the type of copper sulphide (Fig. 3c). The regenerated diffraction peaks correspond well to pyrochlore Cu2S (JCPDS No. 1), and the diffraction peak at 2θ = 54.0° can be attributed to the presence of djurleite Cu1.93S (JCPDS No. 34-0660).50 It should be noted that distinguishing between pyroxene and pear amphibole from X-ray diffraction (XRD) diagrams is challenging due to the similarity of their diffraction peaks. Therefore, xps tests were carried out to analyse the characteristic peaks of Cu 2p and S 2p, which were more pronounced (Fig. S1†). We further characterized the sample's carrier concentration, resistivity, mobility and UV-Vis-NIR spectra (Fig. 3d–f) to investigate the light absorption behaviour of the samples. Carrier concentration and mobility are the key factors affecting the photothermal effect. The carrier densities of SPET, GPET, and GSPET were 6.62547 × 10¹⁴, 8.79631 × 10¹⁴, and 9.4421 × 10¹⁴, respectively. The high carrier densities favoured the enhancement of the LSPRs effect in the NIR region. The superior photothermal efficiency of GSPET was attributed to the compact stacking of chalcopyrite Cu2S and syenite Cu1.93S in the CuxS composite in the CuxS composite, which synergistically enhances bandgap absorption and LSPRs throughout the solar spectrum. Overall, GSPET exhibits high carrier concentration and high mobility, which also contributes to its enhanced light absorption behaviour (Fig. 3f).
3.3 Evaporation performance
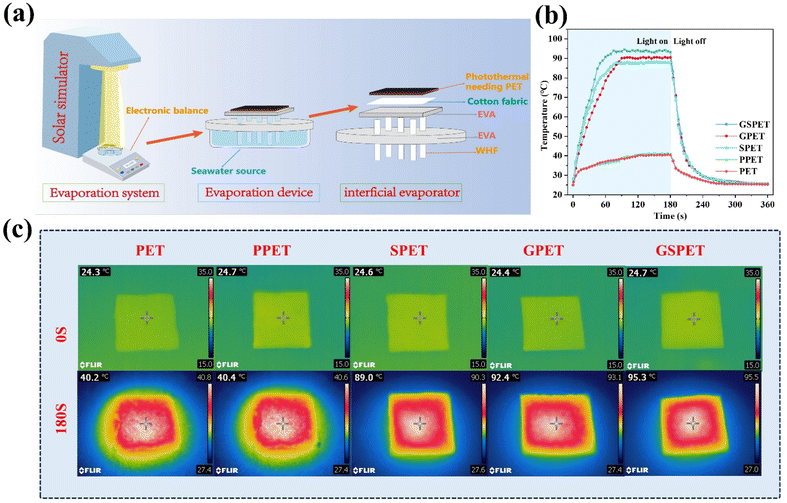
Photothermal conversion efficiency of different samples in dry conditions (Fig. 4b) was as follows: GSPET (93.6 °C) > GPET (90.6 °C) > GSPET (88.2 °C) > PPET (40.4 °C) = PET (40.5 °C). Before exposure to sunlight, the surface temperature of GSPET is approximately 24.5 °C, which is the same as room temperature. During an exposure period of 1.0 sun lux, the temperature significantly rises to 90.0 °C within 60 seconds and eventually stabilizes at 93.6 °C within 180 s (Fig. 4c). It is higher than that of GPET and SPET. This phenomenon is consistent with the results of UV-Vis-NIR spectroscopy. It indicates that the higher the absorptivity, the higher the thermal conversion rate, and consequently, the higher the surface temperature. This also suggests that the assembled CuxS and GO (2d/3d) structural combination enhances light absorption, promotes non-radiative recombination and facilitates the release of thermal energy.24,51–54
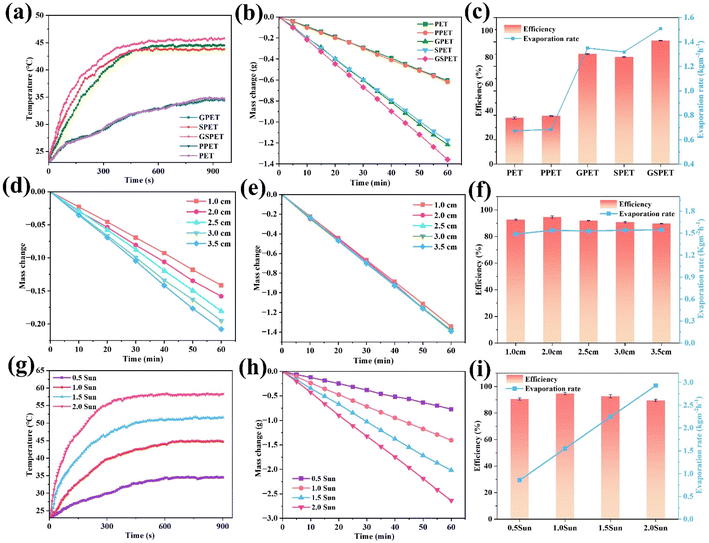
The polyvinyl alcohol (PVA) solely functions as an adhesive and does not contribute to the photothermal conversion effect. This is evidenced by the heating rate and final temperature of the PVA. For this reason, the PPET samples will not be discussed in the following experiments. High evaporation efficiency is crucial for the performance of an evaporator. Therefore, solar evaporation was systematically evaluated to determine water evaporation rates by monitoring the GSPET evaporator foam in real-time under 100 mW cm−2 of solar radiation. The results of the wet heating rate for different samples align with the dry heating rate (Fig. 5a), and the infrared image of the wet heating process is depicted in Fig. S5.† Excluding the natural evaporation of water (0.156 kg m−2 h−1), this test demonstrates that both GPET and SPET evaporators outperformed PET in terms of evaporation efficiency (Fig. 5b), which is attributed to the excellent photothermal conversion of GO and CuxS. In particular, the GSPET evaporator loaded with both GO and CuxS exhibited the best evaporation efficiency (Fig. 5c). The order of magnitude of the evaporation efficiencies was as follows: GSPET (1.5079 kg m−2 h−1) > GPET (1.3494 kg m−2 h−1) > SPET (1.3178 kg m−2 h−1) > PET (0.6721 kg m−2 h−1).
To evaluate the solar steam evaporation capacity, the solar vapour conversion efficiency is calculated by the following equation55
 | (1) |
| M = msolar − mdark | (2) |
 | (3) |
 | (4) |
For formula (3), ω, k0 and h represent angular frequency, Boltzmann constant and Planck constant, respectively. Based on this formula, it can be inferred that the higher the temperature of T, the larger μ. In the formula (4), n, p, q, μn and μp are concentration of electrons, concentration of holes, charge quantity, charge transfer rate of n-type and p-type semiconductors, respectively.62 It can be observed that as the temperature increases, the rate of photogenerated carrier transport also increases, while the resistance decreases. The high temperature of graphene oxide under light accelerates the carrier separation and photo-induced charge transfer of CuxS, reducing their compound and ultimately enhancing its thermal conductivity.63–65 Copper sulphide is a three-dimensional metallic compound with excellent thermal conductivity, which facilitates the efficient transfer of internal heat to the surface of the composite. On the other hand, graphene oxide is a two-dimensional material that impedes the rapid transfer of internally generated heat to the material's surface.66 Notably, the graphene oxide/copper sulphide (2D/3D) structure exhibits an outstanding light trapping effect. The synergistic photothermal effect of both materials enables the GSPET to achieve optimal light absorption, high carrier concentration, mobility, and low resistivity characteristics across the entire wavelength range (300–2500 nm). Consequently, it is distinguished by its high temperature and rapid temperature ris.67,68
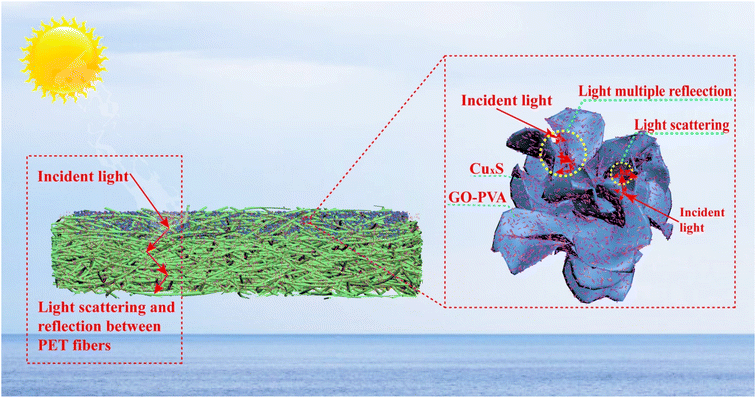
In addition to the aforementioned findings, the evaporation process of the composite solar evaporator is analyzed in Fig. 6. The layered structure created on the surface of GSPET fibers facilitates efficient light scattering.56 This resulted in light not only being reflected within the micron-sized porous structure of the fabric but also undergoing multiple scattering due to the presence of GO and CuxS nanoparticles. As a result, light absorption is significantly enhanced. In addition, the synergistic effect of GO and CuxS can significantly enhance light absorption. With solar energy utilization. Our evaporation efficiency of 94.71% outperformed that of other solar interface evaporation composites (Table 1†).
3.4 Salt resistance and durability
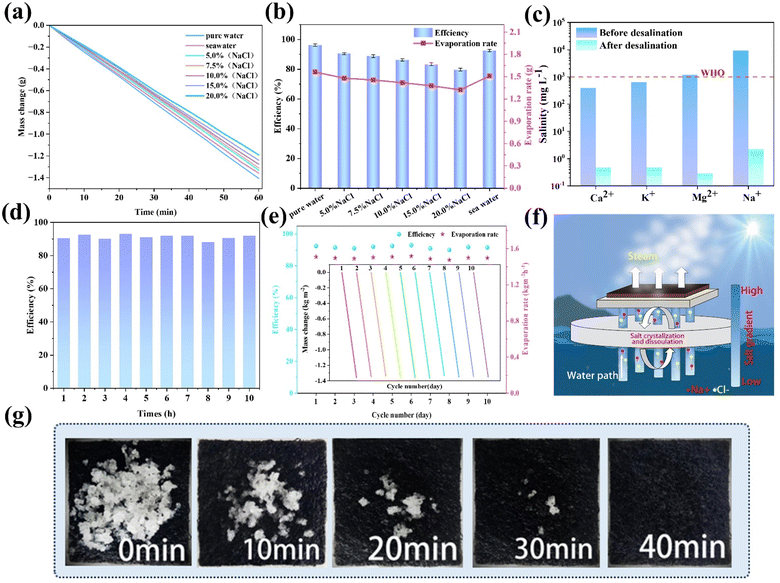
The main components of seawater are inorganic salts, and their content changes with the geographical environment and seasonal ocean currents. In order to evaluate the application performance of GSPET samples under different salt concentration scenarios, the evaporation efficiency of GSPET was investigated under varying mass concentrations of NaCl solution and seawater (Fig. 7a and b). The results indicate that the evaporation efficiency of the photothermal evaporator decreases as the salt concentration increases from 0% to 20.0%. This is because the higher the brine salt concentration, the stronger the intermolecular forces that need to be overcome during the evaporation process. Furthermore, the increase in evaporation enthalpy results in a reduction in evaporation efficiency. To analyze the desalination performance of the GSPET evaporation system in real seawater, the vapors produced were collected using an acrylic tank, and then the ion concentrations were evaluated using ICP-OES. The concentrations of the four main ions (Ca2+, K+, Mg2+ and Na+) before and after desalination are shown in Fig. 7c. It can be observed that the concentrations of the purified metal ions were all reduced by two to three orders of magnitude, significantly below the safe concentration levels set by the standards established by the World Health Organization (WHO).Continuous operating efficiency and recirculation rate are also two key factors affecting the efficiency of desalination processes. During the 10 hours continuous seawater evaporation process in the GSPET evaporator, the evaporation rate slightly decreased due to the salt content in the seawater. However, the evaporation efficiency remained stable and efficient in the subsequent evaporation process (Fig. 7d). The GSPET evaporator was then tested on a ten-day cycle and found to maintain an evaporation efficiency of about 1.51 kg m−2 h−1 per unit of evaporation, which is approximately 92.31% (Fig. 7e). In addition, no salt crystals appeared on the surface after 4 hours of evaporation experiments with various salt concentrations and seawater (Fig. S8†). To assess the salt resistance of the GSPET evaporator, 1.0 g of NaCl crystals placed on the surface of the GSPET were completely dissolved after the solar evaporator was immersed in actual seawater for 40 min (Fig. 7g).
To investigate the salt suppression mechanism of the evaporator, experiments were conducted under simulated sunlight using simulated seawater as the water source. The phenomenon of NaCl flowing in the water source could be observed (Video S1†). Therefore, the salt suppression mechanism of the evaporator was summarized as diffusion and convection (Fig. 7f). Specifically, the photothermal and absorbent layers are moistened with simulated seawater before illumination, and the concentration of simulated seawater in the photothermal layer matches the concentration of water in the container. After turning on the light, the salt concentration in the photothermal layer quickly exceeds that of the water in the container due to evaporation. As a result, the evaporator can desalinate highly saline water through convection and diffusion. At the same time, enough simulated seawater is transferred from the vessel to the photothermal layer through the water guide rods. The high-salinity water in the photothermal layer is then transported back to the vessel, driven by the difference in chemical potentials between the two. This clearly demonstrates GSPET's salt tolerance and stability in seawater. The water washing experiments were performed on the GPET photothermal layer with and without a PVA coating (Video S2 and S3†).
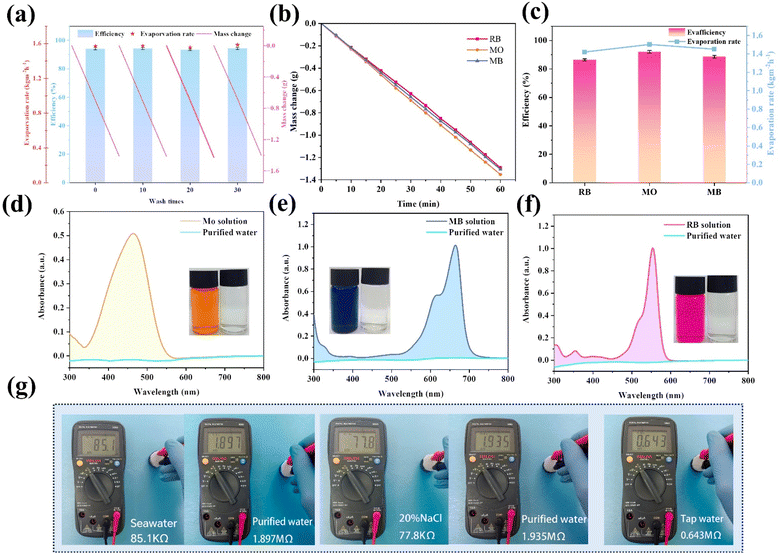
After several shakes and oscillations in deionized water, the PVA-coated samples showed no residue remaining in the water after washing. In contrast, the GPET without PVA coating showed a significant amount of residue after washing (Fig. S9a and b†). Evaporation experiments were conducted on the GSPET samples after undergoing repeated water washing cycles. The evaporation rate remained constant at approximately 1.536 kg m−2 h−1, with an evaporation efficiency of around 94.11%. These results suggest that the evaporator demonstrates excellent durability (Fig. 8a). This is mainly due to the strong adhesion resulting from the encapsulation of graphene oxide by PVA on the evaporator surface and the growth of copper sulphide on the PVA surface, forming strong chemical bonds. If the evaporator lacks a PVA coating, the photothermal material load might not be robust enough to resist being washed away by water. This could lead to a reduction in the photothermal efficiency of the evaporator.
3.5 Practical applications of solar evaporator
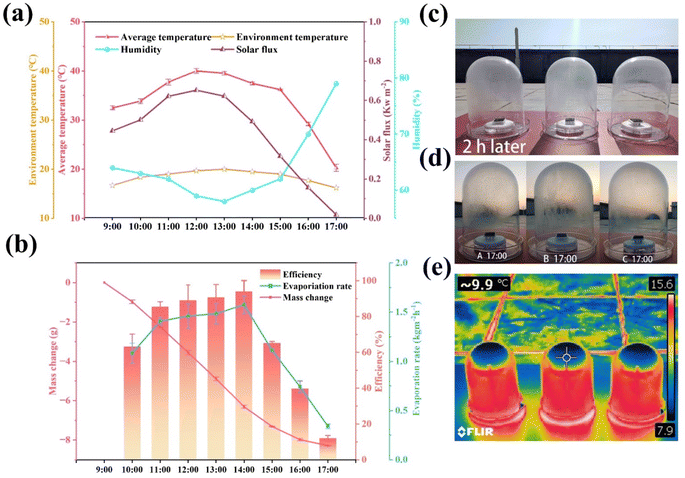
In order to confirm the excellent and sustainable purification performance of the GSPET evaporator for dyeing effluents, the effluent purification performance was assessed using simulated effluents containing methyl orange (MO), methylene blue (MB) and rhodamine B (RB) at concentrations of 10.0 mg L−1. The evaporation efficiency of the solar generators is characterized by the change in water mass under solar irradiation (Fig. 8b), and the corresponding water evaporation rate is calculated (Fig. 8c). The evaporation rate was approximately 1.48 kg m−2 h−1, which corresponds to an evaporation efficiency of around 90%. The orange, blue and red solutions became transparent after purification. In addition, the characteristic absorption peaks of methyl orange (465 nm), methylene blue (665 nm) and rhodamine B (554 nm) almost disappeared from the UV-visible spectrum of the treated wastewater. The concentration of residual dyes was negligible, confirming the complete removal of the dyes from the water (Fig. 8d–f). The resistance values of seawater samples and a 20.0% NaCl solution were tested before and after evaporation to assess water quality, further confirming the feasibility of GSPET in desalination applications. The resistance of the actual seawater was about 85.1 kΩ, while that of the distilled seawater was approximately 1.897 MΩ. There is a 22.3-fold increase in the resistance of the water purified by the GSPET evaporator. The resistance of the 20.0% NaCl solution was about 77.8 kΩ, while that of the distilled seawater was approximately 1.935 MΩ, indicating a significant decrease in the ionic concentration of the water (Fig. 8g). The electrical resistance of purified water is higher than that of tap water. This indicates that the quality of water after purification by GSPET evaporator is higher than that of domestic water, and the water quality is significantly improved. Evaporation under natural light is crucial for practical applications. An outdoor evaporation test was conducted using real seawater from the East China Sea to demonstrate its promising potential for practical application. Three sets of evaporation experimental setups, labelled A, B and C, were established to minimize experimental errors. Seawater was utilized as the water source for the evaporation experiments. All data were collected every 60 minutes from 9:00 a.m. to 5:00 pm during daylight hours. Light intensity, relative humidity, ambient temperature, and surface temperature were recorded (Fig. 9a). Due to the excellent light absorption capability of the photothermal layer, water vapor started to accumulate on the surface of the collector two hours after the experiment commenced (Fig. 9c). By 5:00 pm, more purified water had been collected in all three groups of evaporation experiments after 7 hours of exposure to natural light (Fig. 9d). Due to the influence of different breezes at various times, errors occurred in the experimental data. The average total mass change of the three groups of experiments was approximately 9.20 kg m−2, which is sufficient to meet the water requirements of four individuals (Fig. 9b). The infrared photographs show that the temperature is lower than the box temperature due to the condensation of large amounts of water vapor at the top (Fig. 9e). Additionally, no salt crystals were observed on the evaporator surface at the end of the test. It is verified that the solar thermal conversion evaporator has efficient outdoor solar desalination capability and excellent potential for scalable practical applications.Furthermore, the estimated cost of the developed photothermal evaporator is approximately $8.0712 per m2 (Table S2†), the cost-effectiveness of the CuxS@ PVA-GO-PET is compared with that of the most recently reported evaporators, and it is found that the CuxS@PVA-GO-PET is highly cost-effective (Fig. S10†) Thus, the evaporator in this study not only demonstrates excellent evaporation efficiency, self-desalination capability, and sustained durability but also exhibits high cost-effectiveness. It is a candidate to become a practical material for desalination or freshwater production.
4 Conclusion
In this work, we coated graphene oxide (GO) in situ and grew CuxS on PET needle-punched nonwoven fabrics. We designed two-dimensional/three-dimensional microstructure graphene oxide nanosheets/copper sulphide nanowires (GO/CuxS) with synergistic photothermal effects. Additionally, a vertically aligned water-conducting rod structure was employed to enhance convection, thereby minimizing the formation of salt crystals. The strong adhesion and abundant active groups of PVA were utilized to ensure a high loading of photothermal materials. Under a single solar flux irradiation, the adhesion of GO resulted in a surface temperature reaching as high as 90.6 °C. The growth of CuxS further increased the surface temperature of the material to 93.6 °C without affecting the water absorption properties of the material. The combination of GO and CuxS coatings exhibited a synergistic effect, leading to an efficient photothermal performance on the evaporator surface. At a water supply height of 2.0 cm and solar irradiance of 1.0 kW m−2, the evaporation rate was 1.5622 kg m−2 h−1 with a solar thermal efficiency of 94.61%. In addition, the concentration of salt ions in the fresh water evaporated by the GSPET composite was well below the drinking water standards set by the World Health Organization. More importantly, the GSPET evaporator maintained a high efficiency of 92.31% after 10 days of continuous use, ensuring long-term stable and reliable operation. Therefore, the GSPET evaporator has great potential for efficient and stable desalination under solar irradiation.Data availability
The data are available from the corresponding author on reasonable request.Author contributions
Wenbo Sun: investigation, data curation, writing – original draft. Huan Qi: conceptualization, methodology, writing – review & editing, formal analysis, supervision. Tan Li: software, validation. Minggang Lin: software, validation. Chuyang Zhang: project administration. Yiping Qiu: supervision. All the authors endorsed the final version of the manuscript.Conflicts of interest
There are no conflicts to declare.Acknowledgements
This research was funded by the Fujian Provincial Co-innovation Platform Project Program (No. 2021FX08). The authors are grateful to the Apparel of QNU for providing laboratory facilities.Notes and references
- Z. Liu, J. Ying, C. He, D. Guan, X. Pan, Y. Dai, B. Gong, K. He, C. Lv, X. Wang, J. Lin, Y. Liu and B. A. Bryan, Landsc. Ecol., 2024, 39, 86 CrossRef.
- S. Greenhalgh and O. Samarasinghe, Ecol. Soc., 2018, 23, 44 CrossRef.
- D. Zamrsky, G. H. P. Oude Essink and M. F. P. Bierkens, Earth's Future, 2024, 12, e2023EF003581 CrossRef.
- C. Chen, Y. Yang, C.-H. Lee, S. Takizawa, Z. Zhang, H. Y. Ng and L.-a. Hou, Water Res., 2024, 253, 121358 CrossRef CAS PubMed.
- L. B. Grossi, L. C. Lange and M. C. S. Amaral, J. Cleaner Prod., 2024, 435, 140521 CrossRef.
- J. Kim, K. Park, D. R. Yang and S. Hong, Appl. Energy, 2019, 254, 113733 CrossRef.
- B. A. Shoemaker, O. Khalifa and A. Haji-Akbari, ACS Nano, 2024, 18, 1420–1431 CrossRef CAS PubMed.
- Z. Zhu, J. Xu, Y. Liang, X. Luo, J. Chen, Z. Yang, J. He and Y. Chen, Environ. Sci. Technol., 2024, 58, 3800–3811 CrossRef CAS PubMed.
- X. Zhong, Y. Wu, P. Zhang, Y. Chen, Y. Cai, W. Wang, X. Min, J. Xiong and M. Li, J. Cleaner Prod., 2023, 417, 138827 CrossRef.
- Z. Zheng, W. Li, H. Liu and X. Wang, ACS Appl. Mater. Interfaces, 2022, 14, 50966–50981 CrossRef CAS PubMed.
- M. Yang, L. Zhang, D. Ye, Y. Dong, Y. Zhan and X. Jiang, Chem. Eng. J., 2024, 480, 148121 CrossRef.
- W. Xie, P. Tang, Q. Wu, C. Chen, Z. Song, T. Li, Y. Bai, S. Lin, A. Tiraferri and B. Liu, Chem. Eng. J., 2022, 428, 132624 CrossRef CAS.
- R. Li, C. Zhou, L. Yang, J. Li, G. Zhang, J. Tian and W. Wu, J. Hazard. Mater., 2022, 424, 127559 CrossRef PubMed.
- Y. Fan, W. Bai, P. Mu, Y. Su, Z. Zhu, H. Sun, W. Liang and A. Li, Sol. Energy Mater. Sol. Cells, 2020, 206, 110268 CrossRef.
- J. He, G. Zhao, P. Mu, H. Wei, Y. Su, H. Sun, Z. Zhu, W. Liang and A. Li, Sol. Energy Mater. Sol. Cells, 2019, 201, 110141 CrossRef.
- M. Xia, L. Chen, C. Zhang, Q.-M. Hasi, Z. Li and H. Li, Appl. Clay Sci., 2020, 189, 105519 CrossRef.
- H. Ghasemi, G. Ni, A. M. Marconnet, J. Loomis, S. Yerci, N. Miljkovic and G. Chen, Nat. Commun., 2014, 5, 4449 CrossRef CAS PubMed.
- Q. Fang, T. Li, Z. Chen, H. Lin, P. Wang and F. Liu, ACS Appl. Mater. Interfaces, 2019, 11, 10672–10679 CrossRef CAS PubMed.
- L. Zhang, B. Bai, N. Hu and H. Wang, Sol. Energy Mater. Sol. Cells, 2021, 221, 110884 CrossRef.
- J. Wu, X. Yang, X. Jia, J. Yang, X. Miao, D. Shao, H. Song and Y. Li, Chem. Eng. J., 2023, 471, 144365 CrossRef.
- W. Chao, S. Pi, Y. Yang, Z. Li, Y. Yu, Y. Yang, R. Yang, H. Li and L. Lu, Chem. Eng. J., 2023, 468, 143593 CrossRef.
- L. Sun, X. Zhang, H. Yuan, H. Cong, Y. Shi, J. Lu, W. Shi and F. Guo, Chem. Eng. J., 2023, 477, 147072 CrossRef.
- J. Li, X. Zhou, G. Chen, F. Wang, J. Mao, Y. Long, H. Sun, Z. Zhu, W. Liang and A. Li, Sol. Energy Mater. Sol. Cells, 2021, 222, 110965 CrossRef.
- Z. Zhang, H. Liu, Z. Kong, M. Fang, M. Wang and Y. Zhu, ACS Appl. Nano Mater., 2022, 5, 4931–4937 CrossRef CAS.
- Y. Xu, T. Xu, Y. Guo, W. Liu and J. Wang, Sep. Purif. Technol., 2023, 312, 123433 CrossRef.
- Y. Guo, H. Wu, S. Guo and J. Qiu, Sep. Purif. Technol., 2022, 302, 122163 CrossRef.
- L. Wang, G. Xi, Z. Chen, Q. Wang, J. Liu, R. Zhang, T. Jia and X. Zhao, J. Solid State Chem., 2023, 324, 124070 CrossRef.
- A. Ahmad, A. S. qureshi, L. Li, J. Bao, X. Jia, Y. Xu and X. Guo, Colloids Surf., B, 2016, 143, 490–498 CrossRef CAS PubMed.
- F. Ali, S. B. Khan, T. Kamal, Y. Anwar, K. A. Alamry and A. M. Asiri, Chemosphere, 2017, 188, 588–598 CrossRef CAS PubMed.
- K. Chu, X.-h. Wang, Y.-b. Li, D.-j. Huang, Z.-r. Geng, X.-l. Zhao, H. Liu and H. Zhang, Mater. Des., 2018, 140, 85–94 CrossRef CAS.
- N. Rani, K. Khurana and N. Jaggi, Surf. Interfaces, 2021, 27, 101492 CrossRef CAS.
- X. Zhao, Y. Tang, J. Wang, Y. Li, D. Li, X. Zuo and H. Yang, ACS Appl. Mater. Interfaces, 2023, 15, 49132–49145 CrossRef CAS PubMed.
- J. Li, Y. Jing, X. Zhou, J. Mao, Y. Chen, H. Sun, X. Deng and C. Gao, Int. J. Energy Res., 2021, 45, 20132–20142 CrossRef CAS.
- C. Pan, X. Li, G. Fan, H. Yang, Y. Long and F. Wu, Arabian J. Chem., 2023, 16, 105051 CrossRef PubMed.
- M. Zhao, Y. Zhu, Y. Pan, Y. Wang, T. Xu, X. Zhao, T. Jia, Z. Zhang and Z. Chen, ACS Appl. Energy Mater., 2022, 5, 15758–15767 CrossRef CAS.
- G. Chen, N. Zhang, N. Li, L. Yu and X. Xu, Adv. Mater. Interfaces, 2019, 7, 1901715 CrossRef.
- H. Sang, C. Tang, K. Ma and X. Li, J. Water Process Eng., 2023, 56, 104461 CrossRef.
- J. Wang, M. Sun, C. Liu, Y. Ye, M. Chen, Z. Zhao, Y. Zhang, X. Wu, K. Wang and Y. Zhou, Adv. Mater., 2023, 35, e2212258 CrossRef PubMed.
- I. Zaaroura, S. Harmand, J. Carlier, M. Toubal, A. Fasquelle and B. Nongaillard, Appl. Therm. Eng., 2021, 183, 116203 CrossRef.
- F. Zheng, Y. Zhang, L. Dong, D. Zhao, R. Feng, P. Tao, W. Shang, B. Fu, C. Song and T. Deng, Nanoscale, 2021, 13, 20521–20530 RSC.
- T. Li, M. Lin, H. Lu, Y. Chen, C. Zhang and H. Qi, J. Environ. Chem. Eng., 2023, 11, 109788 CrossRef.
- M. Shang, S. Xu, J. Li, H. Sun, J. Peng, S. Wang and M. Zhang, Energy Technol., 2021, 10(2), 2100805 CrossRef.
- W.-m. Zhang, J. Yan, Q. Su, J. Han and J.-f. Gao, J. Colloid Interface Sci., 2022, 612, 66–75 CrossRef CAS PubMed.
- C. Ge, D. Xu, H. Du, Z. Chen, J. Chen, Z. Shen, W. Xu, Q. Zhang and J. Fang, Adv. Fiber Mater., 2022, 5, 791–818 CrossRef.
- J. Zhao, Z. Liu, S. C. Low, Z. Xu and S. H. Tan, Adv. Fiber Mater., 2023, 5, 1318–1348 CrossRef CAS.
- W. Chong, R. Meng, Z. Liu, Q. Liu, J. Hu, B. Zhu, D. K. Macharia, Z. Chen and L. Zhang, Adv. Fiber Mater., 2023, 5, 1063–1075 CrossRef CAS.
- H. Li, C. Xue, W. Cheng, L. Gao, X. Wang, H. Wei, H. Nan, G. Wang and H. Lin, Prog. Org. Coat., 2021, 160, 106526 CrossRef CAS.
- J. Li, Y. Li, S. Niu and N. Li, Ultrason. Sonochem., 2017, 36, 277–285 CrossRef CAS PubMed.
- X. Li, T. Liu, D. Wang, Q. Li, Z. Liu, N. Li, Y. Zhang, C. Xiao and X. Feng, ACS Appl. Mater. Interfaces, 2018, 10, 21672–21680 CrossRef CAS PubMed.
- C. Zhou, H. Li, J. Lin, K. Hou, Z. Yang, P. Pi, S. Xu, X. Wen and J. Cheng, J. Phys. Chem. C, 2017, 121, 19716–19726 CrossRef CAS.
- X. Fan, X. Qiu, L. Lu and B. Zhou, Sol. Energy Mater. Sol. Cells, 2021, 223, 110948 CrossRef.
- L. Han, Y.-N. Hao, X. Wei, X.-W. Chen, Y. Shu and J.-H. Wang, ACS Biomater. Sci. Eng., 2017, 3, 3230–3235 CrossRef CAS PubMed.
- H. Li, Y. Wang, J. Huang, Y. Zhang and J. Zhao, Electrochim. Acta, 2017, 225, 443–451 CrossRef CAS.
- G. M. Neelgund, A. Oki, S. Bandara and L. Carson, J. Mater. Chem. B, 2021, 9, 1792–1803 RSC.
- J. A. Bush, J. Vanneste, E. M. Gustafson, C. A. Waechter, D. Jassby, C. S. Turchi and T. Y. Cath, J. Membr. Sci., 2018, 554, 366–377 CrossRef CAS.
- H. Li, H. Wen, J. Li, J. Huang, D. Wang and B. Z. Tang, ACS Appl. Mater. Interfaces, 2020, 12, 26033–26040 CrossRef CAS PubMed.
- Z. Liu, H. Song, D. Ji, C. Li, A. Cheney, Y. Liu, N. Zhang, X. Zeng, B. Chen, J. Gao, Y. Li, X. Liu, D. Aga, S. Jiang, Z. Yu and Q. Gan, Global chall., 2017, 1, 1600003 CrossRef PubMed.
- S. Song, H. Kim, C. Kang and J. Bae, Nanomaterials, 2023, 13, 1948 CrossRef CAS PubMed.
- Z. Tang, A. George, A. Winter, D. Kaiser, C. Neumann, T. Weimann and A. Turchanin, Chem.–A Euro. J., 2020, 26, 6473–6478 CrossRef CAS PubMed.
- Y. Xie, A. Riedinger, M. Prato, A. Casu, A. Genovese, P. Guardia, S. Sottini, C. Sangregorio, K. Miszta, S. Ghosh, T. Pellegrino and L. Manna, J. Am. Chem. Soc., 2013, 135, 17630–17637 CrossRef CAS PubMed.
- S. Hu, J. Shi, B. Luo, C. Ai and D. Jing, J. Colloid Interface Sci., 2022, 608, 2058–2065 CrossRef CAS PubMed.
- K. Chen, Y. Shi, P. Shu, Z. Luo, W. Shi and F. Guo, Chem. Eng. J., 2023, 454, 140268 CrossRef.
- C. Du, B. Yan and G. Yang, Nano Energy, 2020, 76, 105052 CrossRef.
- S. Lu, F. Liu, P. Qiu, M. Qiao, Y. Li, Z. Cheng, N. Xue, X. Hou, C. Xu, Y. Xiang, F. Peng and Z. Guo, Chem. Eng. J., 2020, 379, 122285 CrossRef.
- X. Sun, Y. Shi, J. Lu, W. Shi and F. Guo, Appl. Surf. Sci., 2022, 606, 154960 CrossRef.
- Y. Shi, L. Li, Z. Xu, F. Guo and W. Shi, Chem. Eng. J., 2023, 459, 141602 CrossRef.
- J. Lu, Y. Shi, Z. Chen, X. Sun, H. Yuan, F. Guo and W. Shi, Chem. Eng. J., 2023, 453, 139826 CrossRef.
- X. Tan, Y. Cheng and S. Wang, Int. J. Therm. Sci., 2022, 179, 107567 CrossRef.
Footnote |
| † Electronic supplementary information (ESI) available. See DOI: https://doi.org/10.1039/d4ra05241b |
| This journal is © The Royal Society of Chemistry 2024 |

