 Open Access Article
Theoretical investigations of optoelectronic properties, photocatalytic performance as a water splitting photocatalyst and band gap engineering with transition metals (TM = Fe and Co) of K3VO4, Na3VO4 and Zn3V2O8: a first-principles study
Muhammad Awais Alia,
Maryam Noor Ul Aina,
Asim Mansha*a,
Sadia Asimb and
Ameer Fawad Zahoor *a
*a
aDepartment of Chemistry, Government College University Faisalabad, Pakistan. E-mail: asimmansha@gcuf.edu.pk; fawad.zahoor@gcuf.edu.pk
bDepartment of Chemistry, Government College Women University Faisalabad, Pakistan
First published on 17th October 2024
Abstract
First-principles density functional investigations of the structural, electronic, optical and thermodynamic properties of K3VO4, Na3VO4 and Zn3V2O8 were performed using generalized gradient approximation (GGA) via ultrasoft pseudopotential and density functional theory (DFT). Their electronic structure was analyzed with a focus on the nature of electronic states near band edges. The electronic band structure revealed that between 6% Fe and 6% Co, 6% Co significantly tuned the band gap with the emergence of new states at the gamma point. Notable variations were highlighted in the electronic properties of Na3V(1−x)FexO4, Na3V(1−x)CoxO4, K3V(1−x)FexO4, K3V(1−x)CoxO4, Zn3(1−x)V2(1−x)CoxO8 and Zn3(1−x)V2(1−x)FexO8 (where x = 0.06) due to the different natures of the unoccupied 3d states of Fe and Co. Density of states analysis as well as α (spin up) and β (spin down) magnetic moments showed that cobalt can reduce the band gap by positioning the valence band higher than O 2p orbitals and the conduction band lower than V 3d orbitals. Mulliken charge distribution revealed the presence of the 6s2 lone pair on Zn, greater population and short bond length in V–O bonds. Hence, the hardness and covalent character develops owing to the V–O bond. Elastic properties, including bulk modulus, shear modulus, Pugh ratio and Poisson ratio, were computed and showed Zn3V2O8 to be mechanically more stable than Na3VO4 and K3VO4. Optimal values of optical properties, such as absorption, reflectivity, dielectric function, refractive index and loss functions, demonstrated Zn3V2O8 as an efficient photocatalytic compound. The optimum trend within finite temperature ranges utilizing quasi-harmonic technique is illustrated by calculating thermodynamic parameters. Theoretical investigations presented here will open up a new line of exploration of the photocatalytic characteristics of orthovanadates.
1. Introduction
Oxide-based semiconductors as water splitting photocatalysts have gained much attention in an effort to help with environmental preservation and the growing energy issue facing our society.1 Owing to the world's extensive reliance on less efficient non-renewable fossil fuels (e.g., coal, oil, and ethanol), a substantial amount of carbon dioxide is produced, which causes the greenhouse effect. One of the most promising alternatives to fossil fuels is the conversion of water into elemental components using incident photons. Because of its exceptionally clean combustion and green impact on the environment, photocatalytic materials furnish a direct pathway for converting solar radiation into hydrogen fuel.2 A TiO2 photocatalyst was firstly utilized for the efficient conversion of solar energy into chemical energy and emphasized the development of a photocatalytic system having the potential to split water into H2 and O2.3,4 Unfortunately, its practical applications are limited by its fairly wide band gap as UV photons are the only primary source for its photocatalytic activity.5 However, only 4% of solar energy is accessible. It is possible to develop photocatalytic materials that rely on less intense but more prevalent visible light that can harness a significant portion of the solar spectrum.6 Such a compelling rationale for obtaining a stable, efficient, and cost-effective photocatalyst remains a goal to pursue for application in the field of photochemical cells (PECs).The major role of a photocatalyst is to absorb incident light and create charge carriers, i.e., electrons and holes. With the absorption of light having wavelengths equal to the band gap of the semiconductor, electrons are excited from the valence band (VB) to the conduction band (CB), creating holes in the VB.7 These charge carriers can then interact with pollutants, undergo oxidation–reduction processes, and result in products being adsorbed on the semiconductor's surface. The hole in the valence band and electrons in the conduction band can recombine at the same time. Effective light absorption, high redox potential, and limiting the photoinduced charge recombination are helpful methods of chemical conversion that improve the photocatalytic process efficiency.8,9
Recent studies on photosensitive materials for solar energy conversion have mainly focused on two primary goals: modification of conventional photocatalysts and development of a novel photocatalyst or photocatalytic system.10 Moreover, due to their relative stability against photocorrosion (photo-oxidative disintegration), environmental friendliness, and ease of production, metal oxide semiconductors had attracted a lot of attention.11 To date, the most efficient semiconductor photocatalysts to be reported are Fe2O3,12 ZrO2,13 ZnO,14 SnO2,15 TiO2 (ref. 16) and bismuth halides.17
Vanadates have gained much attention due to their interesting physicochemical properties and exceptional performance.18 They are preferred over titanium and zinc oxide photocatalysts due to their narrower band gap,19 lower recombination rate,20,21 and higher quantum efficiency.22 Simultaneously, the complex structural chemistry of vanadates, which readily adapt to various shapes, including tetrahedral, distorted octahedral and dodecahedral, demonstrates their unique character. Due to the structural differences, they may be applied as photocatalysts or optoelectronic materials. The V-3d orbital usually offers a lower conduction band in the band gap structure, which is why vanadates are regarded as potent visible light-driven photocatalysts.23 Having isolated discrete units, the orthovanadates (VO4−3) class is the simplest of all vanadates. Numerous visible-light activated photocatalysts, such as YVO4,24 InVO4,25 and BiVO4,26 have been reported for hydrogen production and the photodegradation of dyes.
This research work focuses on the systematic theoretical comparison of alkali-metal orthovanadate (K3VO4, Na3VO4) with transition metal orthovanadate (Zn3V2O8). Having exceptional chemical strength, low band gap, economical, and an ecofriendly nature, one of the most promising photocatalysts for pollutant degradation and water splitting process is Zn3V2O8. Sajid et al. reported that Zn3(VO4)2 and its hydrates are effective photocatalysts and solar energy conversion materials.27 Slobodin et al. proposed the color features and luminescence behavior of AVO3 (A = K, Rb, and Cs), and reported on the synthesis of M3V2O8 (M = Mg, Zn) by solid-state reaction method.28
Cobalt (Co) has been reported as an efficient dopant with a suitable valence band structure to photo-oxidize water to H2, while having a band gap covering the entire range of visible light. Examples include the Co-doped Fe2O3–TiO2,29 Co2+-doped-TiO2,30 LaCoxFe1−xO3 (x = 0.01, 0.05, 0.1),31 and BiFe1−xCoxO3 (x = 0, 0.025, 0.05, 0.075 & 0.10).32 In the same way, iron (Fe) has also been found as an effective dopant in various water splitting photocatalysts, such as Fe3+-doped TiO2,33 Fe-doped TiO2 and SrTiO3 nanotubes,34 Fe-doped BiVO4,35 and many others. Subsequent to the reported methodical photocatalytic efficiency of Fe and Co dopants, this research has also explored the enhancement of the photocatalytic efficiency with 6% Fe and 6% Co doped on Na3VO4, K3VO4 and Zn3V2O8.
A review of the literature revealed that neither theoretical nor experimental studies of the electronic, elastic, optical, and thermodynamic parameters of these compounds have been reported yet. Herein, we report the first attempt to computationally design these water spitting photocatalysts with theoretical insights into the evolution of (OH−˙) and O2−˙ radicals. The aforementioned motivation inspired us to carry out all these calculations using the full potential linear augmented plane wave (FPLAW) approach to ascertain the previous efforts on this subject, and offer reference data to experimentalists. Therefore, our investigation of all these parameters and band structure analysis with doping effects exhibited a reasonable explanation for the photocatalytic water splitting and degradation activity, which can assist in designing potentially effective vanadium-based photocatalyst materials.
2. Computational details
First-principles calculation of orthovanadates was accomplished through Cambridge Sequential Total Energy Package (CASTEP) code36 in DS-BIOVIA Material Studio software.37 Geometric optimization, electronic density of states, α (spin up) and β (spin down) magnetic moments, optical, elastic, and thermodynamic parameters have been computed using the FPLAPW density functional theory.38 To study the exchange correlation interaction, the Perdew–Burke–Ernzerhof (PBE) function with generalized gradient approximation (GGA) scheme39 was employed. Ultrasoft pseudopotentials were utilized to determine the valence electronic configuration (Na: 3s1, K 4s1, Zn: 3d104s2, V: 3d34s2, and O: 2S2 2P4). Convergence criteria were set to fine quality with kinetic energy, i.e., 500 eV for Na3VO4, K3VO4 and 700 eV for Zn3V2O8. Before performing electronic calculations, the lattice constants and atomic positions were fully optimized by keeping the residual force on each atom at less than 0.05 eV Å−1. All geometry structures were fully relaxed with 0.002 Å force displacement and an energy value of 2 × 10⁻⁵ eV per atom. The Brillouin zone was sampled by the Monkhorst–Pack scheme with a mesh size of 8 × 8 × 6 for Na3VO4, K3VO4, and 10 × 5 × 7 for Zn3V2O8. Meanwhile, a k-point grid of 1 × 1 × 1 was used during the calculation of the elastic and thermodynamic properties of all models. The Mulliken population was computed to analyze the bond population and bonding nature. Moreover, the thermodynamic parameters were studied via Troullier–Martin norm-conserving pseudopotentials. The optical properties of the compounds were studied via frequency-dependent dielectric function α(ω).403. Results and discussion
3.1. Crystal structure
The optimized structures of the orthorhombic (Zn3V2O8) and tetragonal (Na3VO4 and K3VO4) phases are shown in Fig. 1a. The Zn3V2O8 crystal was constructed in the Cmca space group, having three independent lattice parameters such as a = 6.18 Å, b = 11.76 Å, c = 8.38 Å. The crystal is composed of isolated VO4 tetrahedra, spreading around the Zn atoms to form the ZnO8 octahedra. The VO43− tetrahedra share edges with the ZnO8 dodecahedron, forming a chain parallel to the environment of the V-atoms.41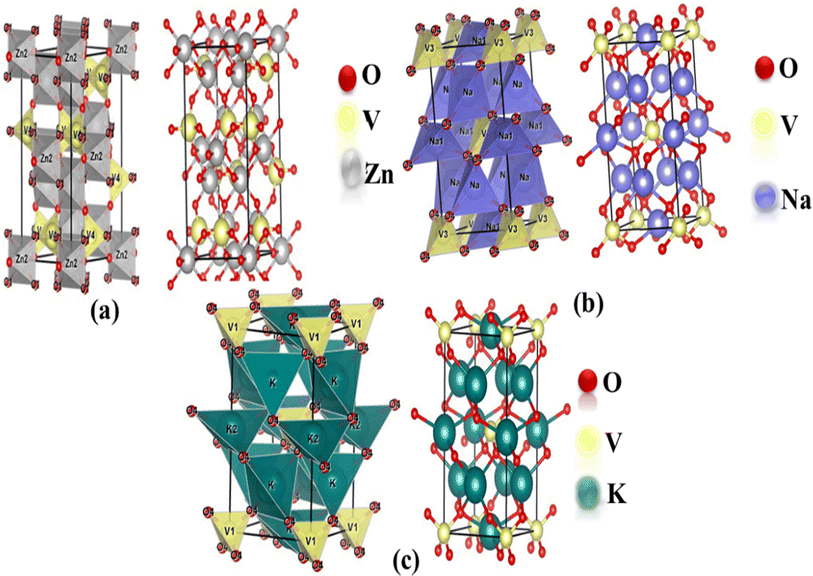 | ||
| Fig. 1 Mixed polyhedral and ball-and-stick model of the optimized crystal structures of (a) Zn3V2O8 (orthorhombic), (b) Na3VO4 (tetragonal) and (c) K3VO4 (tetragonal). | ||
There are two independent lattice parameters, such as ‘a’ and ‘c’, for the tetragonal phase structure. The unit cell parameters are summarized in Table 1. There are two inequivalent coordinated sites in the Na3VO4 crystal system shown in Fig. 1b. In the first site, it forms a distorted tetrahedron (NaO4) that gets bonded with four oxygen atoms, thereby sharing corners with the VO4 tetrahedron. Secondly, Na coordinates with four oxygen atoms and forms NaO4, which shares sites with the VO4 and NaO4 tetrahedra.42 Similar to Na3VO4, the tetragonal crystal structure K3VO4 crystallizes with the I![[4 with combining macron]](https://www.rsc.org/images/entities/char_0034_0304.gif) 2m space group, in which V ions are tetrahedrally coordinated. Meanwhile, K1+ ions have two types of chemically distinct environments, which are depicted in Fig. 1. In the first environment, K1+ is bonded to four oxygen atoms, forming a distorted trigonal pyramid that shares edges with the VO4 tetrahedra. At the second site, the K1+ ions combine with four oxygen atoms to form the KO4 tetrahedra.19
2m space group, in which V ions are tetrahedrally coordinated. Meanwhile, K1+ ions have two types of chemically distinct environments, which are depicted in Fig. 1. In the first environment, K1+ is bonded to four oxygen atoms, forming a distorted trigonal pyramid that shares edges with the VO4 tetrahedra. At the second site, the K1+ ions combine with four oxygen atoms to form the KO4 tetrahedra.19
| Crystals | Lattice constants | Angles | Cell volume (Å)3 | Lattice energy (eV) | ||||
|---|---|---|---|---|---|---|---|---|
| a (Å) | b (Å) | c (Å) | α | β | γ | |||
| Zn3V2O8 | 6.15 | 11.70 | 8.34 | 90 | 90 | 90 | 600.87 | −50340.43 |
| Zn3(1−0.06)V2(1−0.06)Fe0.06O8 | 6.25 | 11.87 | 8.13 | 90 | 90 | 90 | 603.62 | −52422.60 |
| Zn3(1−0.06)V2(1−0.06)Co0.06O8 | 6.20 | 11.76 | 8.36 | 90 | 90 | 90 | 609.85 | −52831.13 |
| Na3VO4 | 5.02 | 5.02 | 9.79 | 90 | 90 | 90 | 247.01 | −15288.88 |
| Na3V(1−0.06)Fe0.06O4 | 5.06 | 5.06 | 9.78 | 90 | 90 | 90 | 250.42 | −15072.91 |
| Na3V(1−0.06)Co0.06O4 | 5.09 | 5.09 | 9.80 | 90 | 90 | 90 | 254.42 | −15134.94 |
| K3VO4 | 5.72 | 5.72 | 10.05 | 90 | 90 | 90 | 329.38 | −12140.37 |
| K3V(1−0.06)Fe0.06O4 | 5.8 | 5.8 | 10 | 90 | 90 | 90 | 338.68 | −11985.15 |
| K3V(1−0.06)Co0.06O4 | 5.95 | 5.95 | 9.31 | 90 | 90 | 90 | 329.59 | −11994.68 |
When foreign atoms are doped into the host lattice, the lattice distorts as a result of changes in the ionic radii and electronic states. However, the lattice distortions in the Co-doped and Fe-doped Zn3V2O8, K3VO4, and Na3VO4 are not apparent after placing the dopant atom, which could be explained by the low impurity concentration and similar radii.
3.2. Band structure
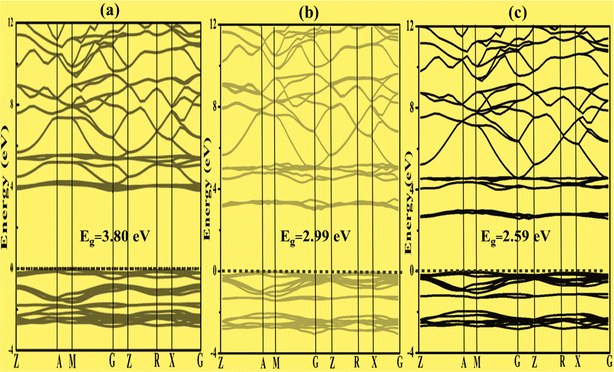
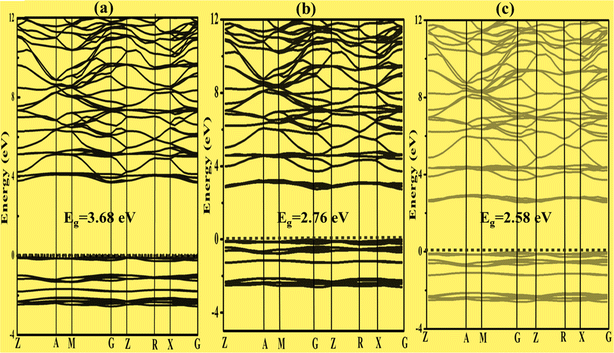
To better characterize the electronic properties, the band structure provides significant information. Around the Fermi level, the electronic structures exhibit separation of the conduction and valence bands.43 Here, the Fermi level is set to zero. A set of certain line segments linking distinctive Brillouin zone (BZ) points, as well as those connecting the distinctive BZ sites with the Γ-points, are chosen as the band pathways (Fig. 2). Fig. 3a, 4a and 5a illustrate the high symmetry points along the selected Brillouin zone path: G(0 0 0) − Z(0 0 0.5) − T(−0.5 0 0.5) Y(−0.5 0 0) − S(−0.5 0.5 0) − X(0 0.5 0) − U(0 0.5 0.5) − R(−0.5 0.5 0.5), Z(0 0 0.5) − A(0.5 0.5 0.5) − M(0.5 0.5 0.0) − G(0 0 0) − Z(0 0 0.5) − R(0 0.5 0.5) − X(0 0.5 0) − G(0 0 0), and Z(0 0 0.5) − A(0.5 0.5 0.5) − M(0.5 0.5 0) − G(0 0 0) − Z(0 0 0.5) − R(0 0.5 0.5) − X(0 0.5 0.0) − G(0 0 0) for Zn3V2O8,44 Na3VO4 (ref. 45) and K3VO4 (ref. 46) photocatalysts, respectively. From Fig. 3a and 4a, the top of the valence band is ostensibly obtained within the G line for Zn3V2O8 and at the M line for Na3VO4. Subsequently, the bottom of the conduction band is connected in the Y point and G point between the SIG of the Brillouin zone for Zn3V2O8 and Na3VO4; hence, indicating the indirect band gap. In the case of K3VO4, the G point specifies the direct band gap between the valence and conduction bands, as shown in Fig. 5a. Concerning the photocatalytic activity, the indirect band gap is more effective than direct ones.47 Due to the difference in the momentum between the location of the two high symmetry points, it prevents the recombination of excited electrons with holes.48 The estimated theoretical band gaps of Zn3V2O8, Na3VO4 and K3VO4 are 2.69 eV, 3.80 eV and 3.65 eV, respectively.49 The electronic properties of zinc orthovanadate are in good agreement with the reported theoretical study of orthovanadates.50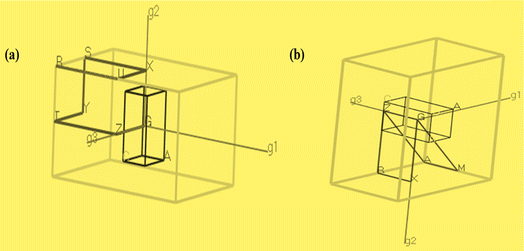 | ||
| Fig. 2 Brillouin zone showing k points of (a) orthorhombic Zn3V2O8 as well as (b) tetragonal Na3VO4 and K3VO4. | ||
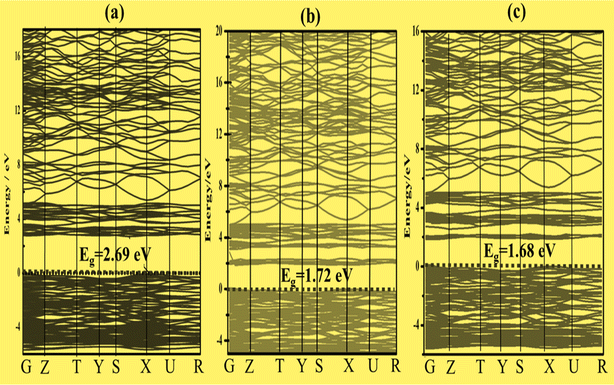 | ||
| Fig. 3 Band structure with the indicated dashed line at 0 eV as the Fermi level of (a) Zn3V2O8, (b) Zn3(1−0.06)V2(1−0.06)Fe0.06O8 and (c) Zn3(1−0.06)V2(1−0.06)Co0.06O8. | ||
 | ||
| Fig. 4 Band structure of (a) Na3VO4, (b) Na3V(1−0.06)Fe0.06O4, and (c) Na3V(1−0.06)Co0.06O4, in which the Fermi level is referenced as 0 eV as indicated by the horizontal dashed line. | ||
 | ||
| Fig. 5 Band structure of (a) K3VO4, (b) K3V(1−0.06)Fe0.06O4 and (c) K3V(1−0.06)Co0.06O4, in which the Fermi level is referenced as 0 eV as indicated by the horizontal dashed line. | ||
The band gap varies inversely with the atomic mass. This agrees with the sequence of band gap values for the selected compounds, such as Na3VO4 > K3VO4 > Zn3V2O8.51 However, among all compounds, the dramatic decrease in the band gap of Zn3V2O8 is due to the transition metal involving the d-orbital in bonding. Specifically, Zn (3d-orbital) is involved in the excitation of electrons from VB to CB.19
3.3. Doping/band gap engineering
To construct the band gap covering the whole range of visible light, 6% Fe was doped on the vanadium atom of Na3VO4 and K3VO4. Similarly, 6% Co was doped on the V-3D sites of the crystal lattices, and their band structures were compared. Meanwhile, in the case of Zn3V2O8, the doping of 6% Fe or Co only on the V-3D sites was not significant. However, doping both Zn and V atoms with 6% Fe or Co magnified the narrowing of the band gap. The Co-doped Zn3V2O8 system shows the narrowest energy gap between the dopant states and the VBM. Fig. 3 shows the reduction in the band gap values as follows: 2.69 eV > 1.72 eV > 1.68 eV for Zn3V2O8 > Zn3(1−0.06)V2(1−0.06)Fe0.06O8 > Zn3(1−0.06)V2(1−0.06)Co0.06O8, respectively. Meanwhile, in the case of Na3VO4, Na3V(1−0.06)Fe0.06O4 and Na3V(1−0.06)Co0.06O4, the computed band gaps are 3.80 eV, 2.99 eV and 2.59 eV, respectively (Fig. 4). Similarly, the sequence of reduction in the band gap has been observed as 3.68 eV > 2.76 eV > 2.58 eV for K3VO4 > K3V(1−0.06)Fe0.06O4 > K3V(1−0.06)Co0.06O4, respectively (Fig. 5). In all three host crystal lattices, cobalt is computed as being a vital dopant for enhancing their photocatalytic activity.3.4. Density of state
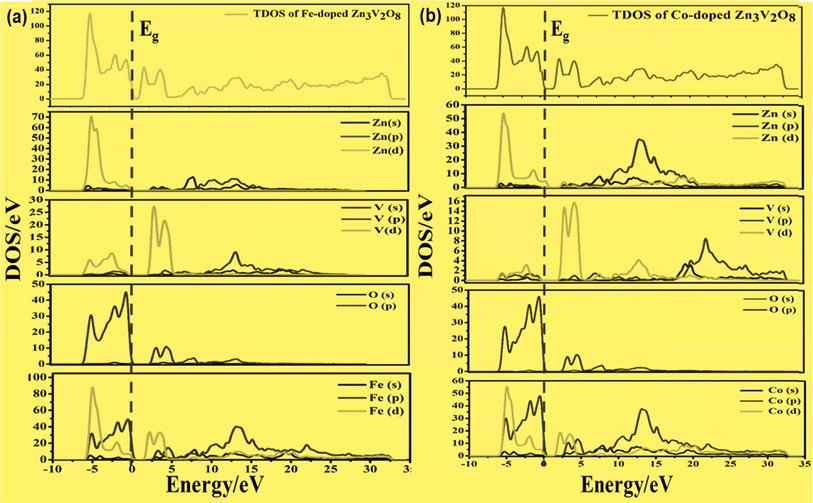
To develop qualitative insight into the nature of orbitals and their splitting, the total and projected density of states are examined. This provided substantial information for the characterization of the electronic properties of the materials. As a central atom, vanadium has a 3-d orbital that splits into two sets. The “e” state (including 3dx2y2 and 3dz2) and t2 state (having 3dxy, 3dyz, and 3dxz) are considered as two distinct parts in crystal field theory.52 The conduction band is mainly composed of the vanadium 3d atom for tetragonal and orthorhombic phase structures. This band falls in the energy region between 0 and 10 eV. There is also a minor contribution of O-2p states, resulting in p–d hybridization.53The upper valence band of Zn3V2O8 ranging from 0–3.5 eV is mainly dominated by the O-2p state, which is the major hallmark of oxide-based semiconductor materials, as shown in Fig. 6. The V-3d and Zn-3d orbitals are also involved in the upper valence band. One of the most striking attributes is the involvement of Zn-3d in the entire VB. However, p–d hybridization results in a strong covalent interaction between the Zn-3d and O-2p states.50 The calculated DOS and PDOS for the Fe-doped and Co-doped systems with 6% concentration are compared in Fig. 7a and b. The Fermi level of each doped system lies within the dopant states, which means that both dopants inherently have empty states that can accept the active electrons. The dopant states become eminently closer in the case of the Co-dopant, and the energy gap is noted to be significantly narrower for Zn3(1−0.06)V2(1−0.06)Co0.06O8. Moreover, expansion of the VBM can be attributed to the increasing contribution of Co-3d states in the conduction band, as evident from the PDOS plots shown in Fig. 6b. Similarly, Fig. 7a and b show that the contribution and distribution of O-2p states in the valence bands are not significantly altered.
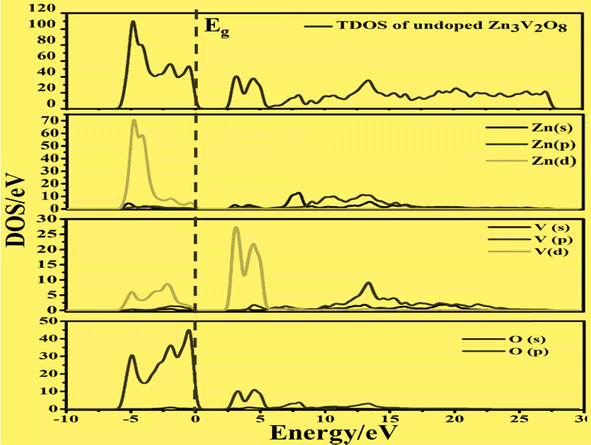 | ||
| Fig. 6 Calculated total density of states and partial density of states of pure Zn3V2O8 showing the O-2p states and V-3d states below and above the Fermi level (Eg). | ||
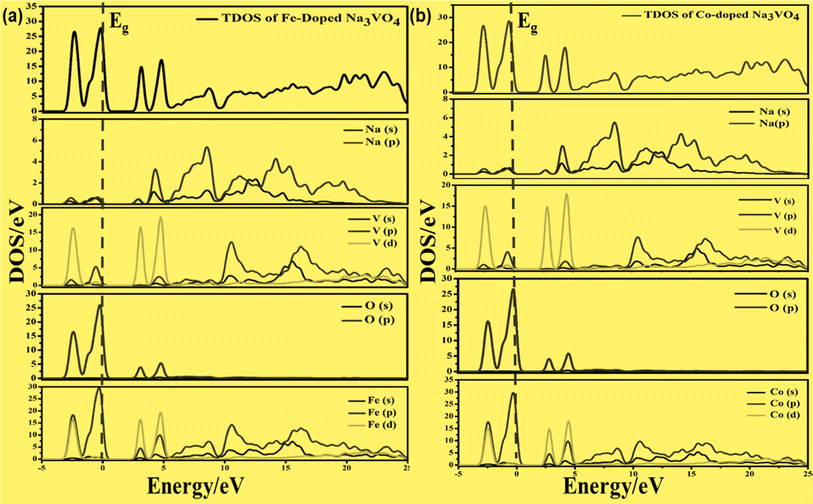
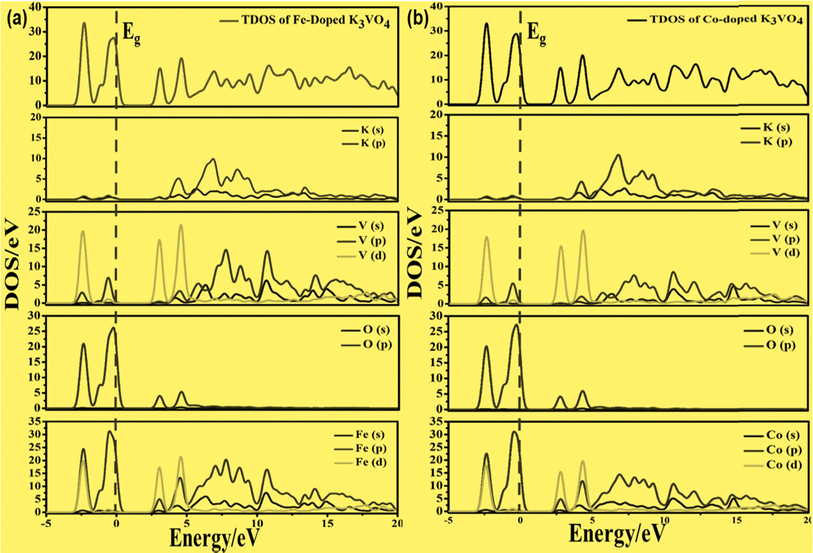
On the other hand, the VBM of the tetragonal phase system is composed of O 2p states. There is a contribution of V 3d, Na 3s, and K 4s in the CBM of these isostructural crystal systems, as shown in Fig. 8 and 10. Fig. 9a and 11a reveal that the Fe-dopant prominently induces its 3d before the V 3d state in Na3V(1−0.06)Fe0.06O4 and K3V(1−0.06)Fe0.06O4, thus placing the CBM near the Fermi level (Eg). Meanwhile, in the case of the Co-doped alkali metal orthovanadates, such as Na3V(1−0.06)Co0.06O4 and K3V(1−0.06)Co0.06O4, the CBM has been computed to shift closer to Eg, resulting in the vital reduction of the band gap due to the low-lying Co 3d state (Fig. 9a and b).
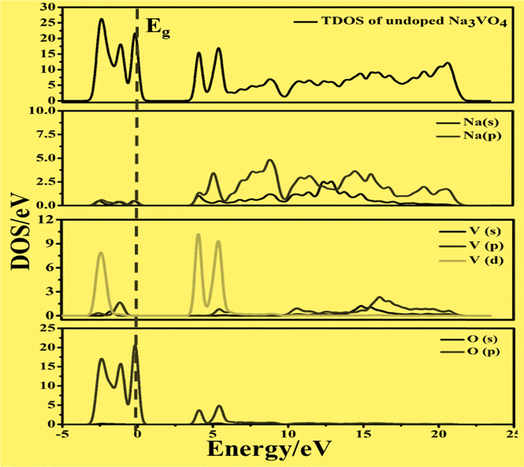 | ||
| Fig. 8 Calculated total density of states (TDOS) and partial density of states of pure Na3VO4, showing O-2p and V-3d states below and above the Fermi level (Eg). | ||
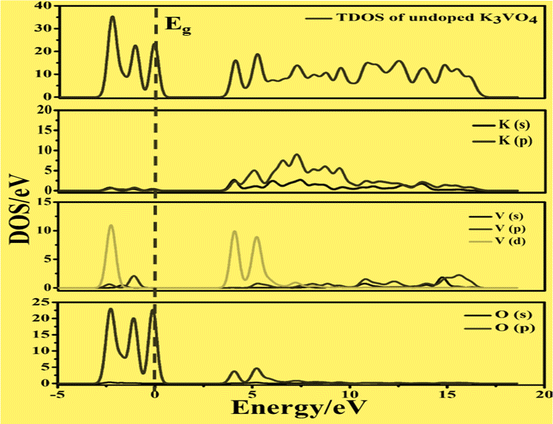 | ||
| Fig. 10 Calculated total density of states (TDOS) and partial density of states of pure K3VO4, showing the O-2p states and V-3d states below and above the Fermi level (Eg). | ||
3.5. Magnetic properties
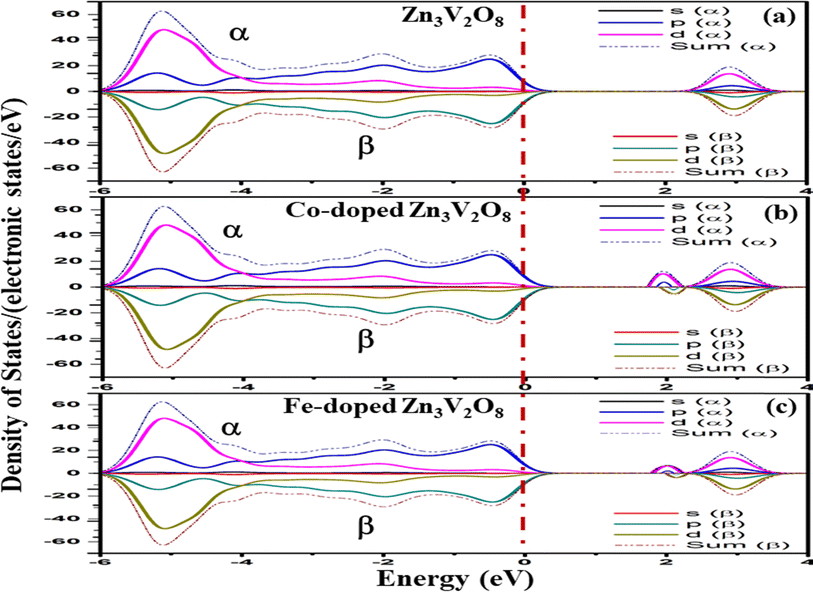
Since Fe and Co are magnetic elements54 as compared to V, the inversion symmetry of the atomic geometry diminishes in the direction normal to the plane of symmetry, while it still persists within the plane. Nevertheless, it is possible for spin polarization to break the in-plane inversion symmetry of spin-resolved electronic states, resulting in energetic spin splitting at the Fermi level.55 Therefore, the spin electron density in real space and the spin-dependent orbital-resolved (partial) atomic-projected density of states (DOS) were calculated by collinear spin polarization to investigate the spin asymmetry magnetic order and the atom-orbital contributions to the spin magnetic moment.In the total electron density, the major α (spin up) and β (spin down) components of the spin-polarized electrons are appreciably distinguished by the positive and negative spin densities of the s, p and d orbitals.56 The α and β spin states for the undoped and doped Zn3V2O8 Na3VO4 and K3VO4 are shown in Fig. 12–14, respectively. In Zn3V2O8, the valence band is attributed mainly to the α-spin states of O 2p with a minor contribution from the 3d α-spin electrons of Zn and V. Particularly, the higher absolute value of the α-dominated spin density of the V-3d electrons in the conduction band compared to that of the β-dominated electrons indicates the presence of more α electrons than β electrons, as manifested in Fig. 12a. However, the α-spin magnetic moment predominantly originates in the conduction band from the spin-polarized components of the V-3d and Co-3d orbitals in Zn2.82V1.88Co0.12O4, and the V-3d and Fe-3d orbitals in Zn2.82V1.88Fe0.12O4 with an energetic-preferential spin splitting near the Fermi level, as shown in Fig. 12b and c.
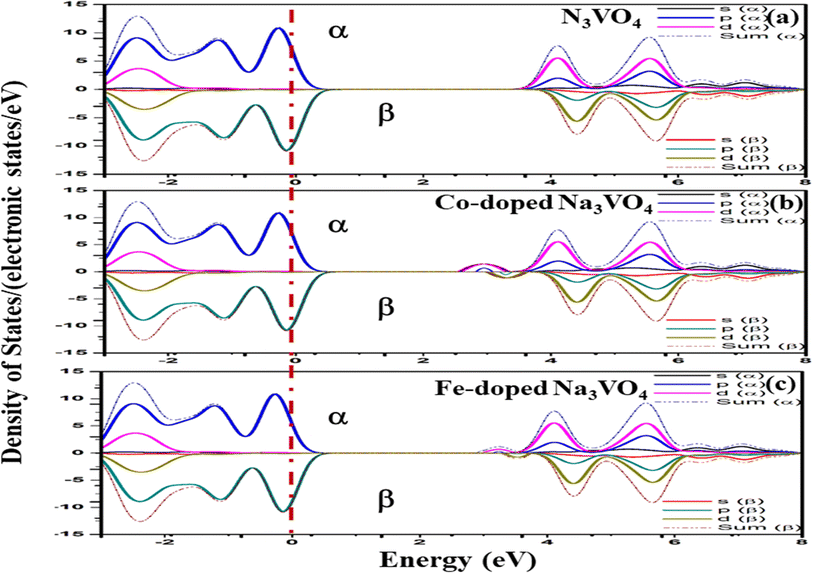 | ||
| Fig. 13 Spin-up (↑) and spin-down (↓) partial density of states of (a) Na3VO4, (b)- Na3V(1−0.06)Co0.06O4, and (c) Na3V(1−0.06)Fe0.06O4 with indicated dashed lines as the Fermi level (Eg). | ||
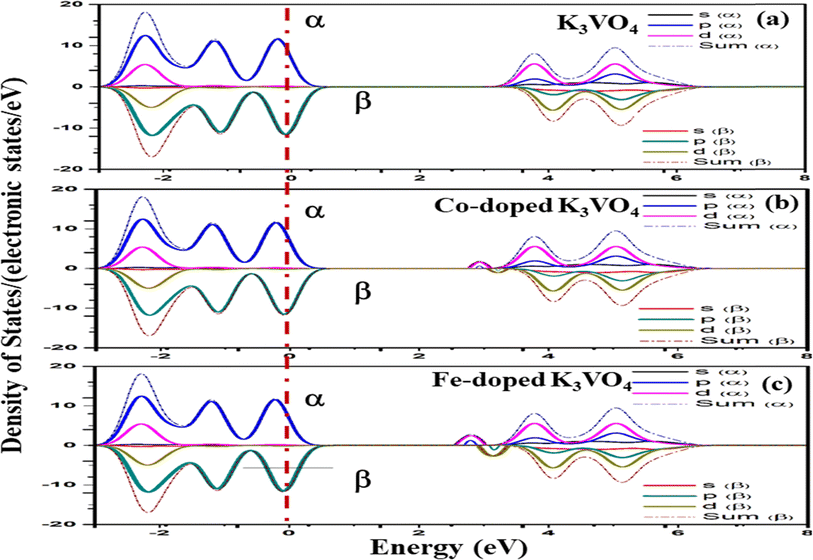 | ||
| Fig. 14 Spin-up (↑) and spin-down (↓) partial density of states of (a) K3VO4, (b) K3V(1−0.06)Co0.06O4, and (c) K3V(1−0.06)Fe0.06O4 with indicated dashed lines as the Fermi level (Eg). | ||
For Na3VO4 and K3VO4, the entire crystal lattice comprises the α-dominated spin states of O-2p and V-3d near the Fermi level (Fig. 13 and 14). The valence band maximum (VBM) and conduction band minimum (CBM) are mainly from the α-spin states of the O-2p and V-3d orbitals. Meanwhile, the 3d α-spin states of the Fe and Co dopants significantly shifted the CBM close to the Fermi level. However, the β-dominated electrons occur less frequently in VBM and CBM (Fig. 13b, c and 14b, c). It is evident from the spin polarization that Co and Fe are magnetic metals because both up-spin and down-spin DOS cross the Fermi level with a clear polarization between the DOS of the two spin channels.57 In Zn3V2O8, Fe and Co established the p-type extrinsic semiconductor with the shifting of the Fermi level towards VB.58 Meanwhile, in the case of Na3VO4 and K3VO4, DOS more prominently crosses the Fermi level, indicating Fe-doped and Co-doped p-type extrinsic semiconductors.
3.6. Mulliken population analysis
Mulliken charge analysis and bond population facilitated the investigation of the bonding behavior of the Zn3V2O8, Na3VO4 and K3VO4 crystal systems. The bond population and atomic bond lengths are expressed in Table 2.| Compounds | Population R–O | Bond length R–O/Å | Bond length V–O/Å | Population V–O |
|---|---|---|---|---|
| Zn3V2O8 | 0.33, 0.20, 0.17 | 2.04, 2.23, 2.18 | 1.71, 1.74, 1.81 | 0.76, 0.67, 0.64 |
| Na3VO4 | 0.10, 0.08 | 2.32, 2.36 | 1.73 | 0.74 |
| K3VO4 | 0.04, −0.05 | 2.60, 2.8 | 1.74 | 0.76 |
The R and V atoms of the photocatalytic systems have higher positive charge, while oxygen has a negative charge. The data sets in Table 3 demonstrate that charge transfer is carried out from R and V to O atoms. Moreover, the higher positive charge transfer values demonstrated the greater overlap between the atoms of the bonding atoms.44
| Compounds | Species | Mulliken atomic population | Mulliken charge/e | Hirshfeld charge/e | |||
|---|---|---|---|---|---|---|---|
| s | p | d | Total | ||||
| Zn3V2O8 | Zn | 0.34, 0.31 | 0.65, 0.67 | 9.97, 9.98 | 10.97, 10.96 | 1.03, 1.04 | 0.46, 0.45 |
| V | 2.25 | 6.43 | 3.35 | 12.03 | 0.97 | 0.46 | |
| O | 1.86, 1.85 | 4.73, 4.79, 4.84 | 0.00 | 6.59, 6.70, 6.64 | −0.59, −0.70, −0.64 | −0.28, −0.29 | |
| Na3VO4 | Na | 2.14 | 6.09, 6.10 | 0.00 | 8.24 | 0.76 | 0.34, 0.32 |
| V | 2.25 | 6.82 | 3.42 | 12.48 | 0.52 | 0.49 | |
| O | 1.87 | 4.83 | 0.00 | 6.70 | −0.70 | −0.37 | |
| K3VO4 | K | 2.18, 2.11 | 5.81, 5.96 | 0.00, 0.00 | 7.99, 8.07 | 1.01, 0.93 | 0.36, 0.45 |
| V | 2.27 | 6.87 | 3.44 | 12.59 | 0.41 | 0.45 | |
| O | 1.90 | 4.92 | 0.00 | 6.82 | −0.82 | −0.40 | |
The characteristic of a bond as either covalent or ionic can be evaluated by the overlap population of the orbitals. A complete ionic bond has a value of zero in the overlap bond population. Conversely, bonds having values greater than zero have a higher covalent character.59 So, the stronger covalency is implied by the greater bond population, whereas the opposite is true for the ionic character. The V–O bond populations for these three systems (0.76, 0.74, 0.64, 0.67) are much higher than the R–O bonds (0.04, −0.05, 0.10, 0.08, 0.33, 0.20, 0.17). As compared to the R–O bond, the covalent character is stronger in the V–O bond. Na3VO4 and Zn3V2O8 exhibit more covalent character, as listed in Table 2. Meanwhile, the bonding of K3VO4 is actually a mixture of covalent–ionic properties. Having greater bond population and shorter bond lengths, the V–O bonds also have a considerable impact on the hardness, instead of the R–O bonds, in the R3VO4 and R3V2O8 crystal systems.
The crystal structures and electronic band structures have led to the conclusion that vanadium atoms develop covalent and ionic interactions with O to produce VO43+, which confirmed the lack of a lone pair electron in the V atoms. Therefore, the interaction forces between R2+ and V5+ are directly related to the V–O bonds. The distortion in the Zn–O bond lengths in Zn3V2O8 is due to the 4s2 or 6s2 lone pair of the transition metal (Zn+2). The strong photocatalytic activity of visible light is greatly influenced by this attribute,44 which seems favorable for Zn3V2O8.
3.7. Elastic and mechanical properties
The Debye temperature, dynamic properties, and stress strain behavior are all influenced by a solid's mechanical properties and elastic constants, which are crucial parameters. Moreover, the structural stability and binding energy are associated with the elastic properties. As the elastic constants vary depending on the crystal symmetry,60 there are six distinct elastic constants for the tetragonal systems: C11, C33, C44, C66, C12, C13.61 Meanwhile, the orthorhombic system has nine independent elastic parameters; namely, C11, C22, C33, C44, C55, C66, C12, C13, C23.62 The positively defined quadratic form of the energy density, in which the coefficients are determined from the DFT calculations (elastic stiffness), fulfill the following fundamental criteria of the tetragonal and orthorhombic structures that explore the mechanical stability of the compounds.63• Born stability standard for the tetragonal system (Na3VO4 and K3VO4):
| C11 > |C12|; 2C132 < C33 (C11 + C12), C44 > 0; C66 > 0 |
• Criteria for the mechanical stability of the orthorhombic system (Zn3V2O8) is:
| (C11 > 0; C11C12 > C122 |
| C11C22C33 + 2C12C13C23 − C11C232 –C22C132 − C33C122 > 0 |
| C44 > 0; C55 > 0; C66 > 0 |
Table 4 shows that the values of all elastic parameters are positive, and meet all aforementioned requirements. So, the crystal systems are mechanically stable.
| Compounds | C11 | C33 | C44 | C66 | C12 | C13 | C16 | C22 | C23 | C55 |
|---|---|---|---|---|---|---|---|---|---|---|
| Zn3V2O8 | 173.98 | 164.66 | 53.86 | 19.44 | 52.25 | 87.42 | — | 182.03 | 97.04 | 61.23 |
| Na3VO4 | 71.70 | 52.97 | 26.51 | 20.75 | 31.70 | 32.84 | 0.00 | — | — | — |
| K3VO4 | 50.40 | 32.07 | 18.80 | 11.45 | 19.19 | 29.58 | 0.00 | — | — | — |
To assess the aggregate average elastic characteristics of the crystal structure, additional approximations named as isostress (Reuss state) and isostrain (Voigt state) were used. Hill demonstrated that the Voigt and Reuss approximations accurately exhibit the upper and lower limits of the elastic constants. The Voigt (Bv) and Reuss (BR) bulk modulus is given as:64
For the tetragonal system, the bulk modulus can be calculated as:65
whereas, C2 = (C11 + C12) C33 − 2C132, M = C11 + C12 + 2C33 − 4C13
The Voigt–Reuss shear modulus is then derived as:
The VRH averages for the shear modulus (G) and bulk modulus (B) are given as:
While the Young's modulus (E) and Poisson ratio (v) are computed as:
The bulk and shear modulus for the orthorhombic system can be calculated by the following equations:66
| BR = χ(C11(C22 + C33 − 2C33) + C22(C33 − 2C13) − 2C33C12 + C12(2C23 − C12) + C13(2C12 − C13) + C23(2C13 − C23))−1 |
The way to calculate the Young's modulus and Poisson ratio is the same as stated for the tetragonal systems. The Voigt and Reuss equations define the upper and lower limits of polycrystalline elastic constants, respectively, and the arithmetic mean of these two limits is used to estimate the realistic bulk and shear modulus. The bulk modulus (B) measures the resistance to volume change, along with the bond length caused by applied pressure. The significant strength of the solid bonds is an indication of the higher bulk modulus.67 The condition of the bulk modulus stated as C12 < B < C11 seems to satisfy all these crystal systems.
Panda & Chandran68 developed equations to investigate the Young's modulus and Poisson ratio. The resistance to reversible deformation under shear stress was investigated by the shear modulus (G), which is known as the stiffness of a material. A greater shear modulus suggests a stronger degree of bonding between atoms.69 As a result, the Zn3V2O8 system is stiffer and exhibits stronger bonding than the other two systems.
Pugh's ratio defines the nature of bonding, which is either ionic or covalent, on the basis of the ductile and brittle character of the fabricated material. G/B < 6 indicates the ductility (ionic bonding) of the material, and the reverse is for the brittle (covalent bonding) nature.70 Therefore, K3VO4 and Zn3V2O8 have higher ductile nature.
The directionality of the covalent bonds is quantified by the Poisson ratio. In contrast to ionic materials, which have a Poisson ratio ≥0.25, covalent materials have a smaller value (v = 0.1). The lower and higher boundaries of the central force in solids are 0.25 and 0.5, respectively.71 Our results indicate that all compounds have ionic contribution and central interatomic forces.
Another crucial factor used to assess the constant nature of the structural qualities in all directions is the anisotropy of materials. A suitable parameter is required to describe the degree of anisotropy, as all single crystals are actually anisotropic. Anisotropy factors for the tetragonal structure are as follows:44
Using elastic constants, calculations can also be done for the orthorhombic system:
The calculated values of all these parameters are listed in Table 5. As the index for these materials is not zero, all are considered to be anisotropic in nature. Moreover, the elastic anisotropy is associated with the inter-atomic bond strength.
| Compounds | Bv | BR | BH | GV | GR | GH | Y | ν | G/B | A1 | A2 | A3 | ξ |
|---|---|---|---|---|---|---|---|---|---|---|---|---|---|
| Zn3V2O8 | 110.45 | 109.5 | 109.98 | 45.83 | 37.3 | 41.57 | 110.69 | 0.33 | 0.378 | 1.31 | 1.60 | 0.31 | 0.44 |
| Na3VO4 | 43.46 | 42.57 | 43.02 | 21.35 | 19.83 | 20.59 | 53.26 | 0.29 | 2.86 | 1.79 | — | 0.14 | 0.57 |
| K3VO4 | 32.18 | 31.27 | 31.72 | 13.44 | 7.59 | 10.52 | 28.40 | 0.35 | 0.33 | 3.24 | — | 0.73 | 0.52 |
To define the relative positions of the cation and anion sub-lattices under the maintained volume-strain distortions (for which the positions are variable according to symmetry), Kleemann established a significant factor known as the internal strain parameter (ξ). It describes the coloration of the bond stretching and bending.44
The minimum bond bending is expressed when ξ = 0. In the case of ξ = 1, there will be minimum bond stretching. Table 5 illustrates that bond-bending is prominent in these photocatalytic materials.
3.8. Optical properties
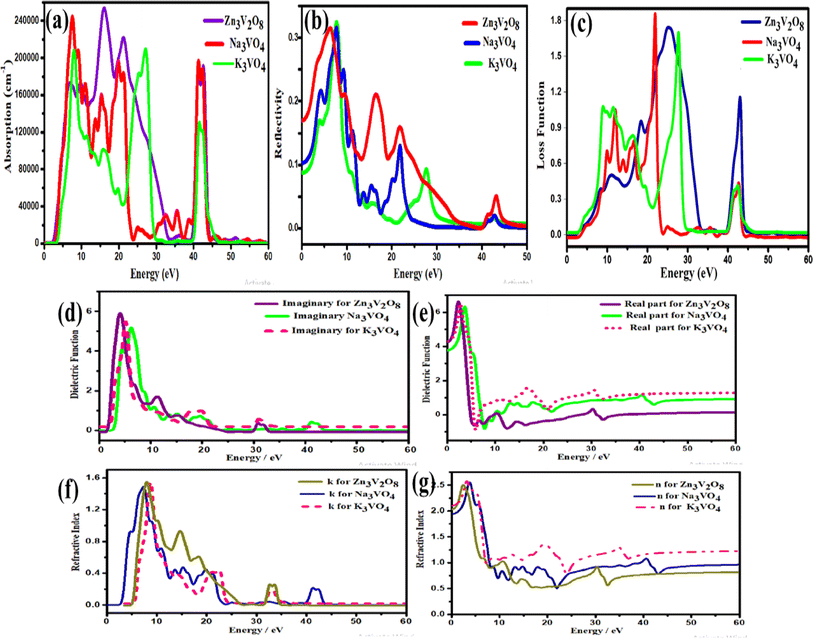
Optical properties play an important role in determining the photocatalytic activity of photocatalysts, defining their mode of interaction with light. Herein, the absorption, reflection, refractive index, dielectric constant, and loss function are the optical properties calculated in the photon range of 0–60 eV.
 | (1) |
The most prominent estimated absorption apexes are 252![[thin space (1/6-em)]](https://www.rsc.org/images/entities/char_2009.gif) 269 cm−1, 177
269 cm−1, 177![[thin space (1/6-em)]](https://www.rsc.org/images/entities/char_2009.gif) 245 cm−1, and 152
245 cm−1, and 152![[thin space (1/6-em)]](https://www.rsc.org/images/entities/char_2009.gif) 260 cm−1 for Zn3V2O8, Na3VO4 and K3VO4, respectively. The absorption values fluctuate with increasing photon energy. Meanwhile, optimum values were obtained at about 15.8 eV, 7.39 eV, and 26.9 eV for Zn3V2O8, Na3VO4 and K3VO4, respectively. The absorption cut-off band edge lies at 2.94 eV. This result indicates that the most likely electron transition to occur is VB to CB, as it has been studied for the BiVO4 photocatalyst.72 All these materials have almost zero absorption in the area of low-frequency photons. The photocatalytic degradation of pollutants is directly related to absorption.73 Photo-induced charge carriers (electron and hole pairs) are produced when light interacts and activates the photocatalytic material, causing the migration of photo-sensitive electrons from VB to CB. When these electron and hole pairs interact with water, it results in highly reactive hydroxyl and superoxide radicals. Therefore, these radicals interact with pollutants, and partially or completely degrade them.14 A lower band gap has a synergetic effect on enhancing the photocatalytic process by allowing the photocatalyst to absorb more photons, and become more sensitive to absorbing incident light.74 Hence, from Fig. 15a, Zn3V2O8 exhibits higher absorption than the other two photocatalyst materials.
260 cm−1 for Zn3V2O8, Na3VO4 and K3VO4, respectively. The absorption values fluctuate with increasing photon energy. Meanwhile, optimum values were obtained at about 15.8 eV, 7.39 eV, and 26.9 eV for Zn3V2O8, Na3VO4 and K3VO4, respectively. The absorption cut-off band edge lies at 2.94 eV. This result indicates that the most likely electron transition to occur is VB to CB, as it has been studied for the BiVO4 photocatalyst.72 All these materials have almost zero absorption in the area of low-frequency photons. The photocatalytic degradation of pollutants is directly related to absorption.73 Photo-induced charge carriers (electron and hole pairs) are produced when light interacts and activates the photocatalytic material, causing the migration of photo-sensitive electrons from VB to CB. When these electron and hole pairs interact with water, it results in highly reactive hydroxyl and superoxide radicals. Therefore, these radicals interact with pollutants, and partially or completely degrade them.14 A lower band gap has a synergetic effect on enhancing the photocatalytic process by allowing the photocatalyst to absorb more photons, and become more sensitive to absorbing incident light.74 Hence, from Fig. 15a, Zn3V2O8 exhibits higher absorption than the other two photocatalyst materials.
 | (2) |
The high energy region and low energy region are two zones for describing the macroscopic and microscopic parameters of the materials.6 The critical onset values for the high energy region are 25 eV, 21 eV, and 27 eV for Zn3V2O8, Na3VO4 and K3VO4, respectively. As in the visible region, photocatalysts cannot attenuate incident light, which results in less plasmonic excitation. However, the composition and electronic structure can be designed via a low energy function region that is almost less than 1 eV, as shown in Fig. 15c.
| ε(ω) = εRe(ω) + iεIm(ω) | (3) |
The initial threshold of the dielectric function's imaginary part is basically referred to as the first absorption peak. Such peaks correlate with the electronic transition between the occupied and unoccupied states near the Fermi level. The electron transition takes place between the V-3d and O-2p states. In addition to some other peaks, the critical onset points for the orthorhombic and tetragonal phases are 5.26 eV and 6.20 eV, respectively. By comparing the function of these three materials, the highest dielectric function of Zn3V2O8 confirms its excellent dielectric properties (Fig. 15d).
| N(ω) = n(ω) + ik(ω) | (4) |
The variable n(ω) determines the extent of the electromagnetic wave slowdown in comparison to the vacuum speed. The real part of the complex function of such photocatalyst materials shows an inverse pattern. As depicted in Fig. 15g, n(ω) has a larger refractive index in the early stage of photon energy than k(ω), which is virtually zero. Therefore, the real and imaginary parts of the complex N(ω) function are slightly greater for Zn3V2O8 and K3VO4, as compared to Na3VO4.
3.9. Thermodynamic properties
To analyze the entropy, enthalpy, Gibbs free energy, and specific heat capacity at constant volume, the phonon density of states was calculated (Fig. 16). These parameters have been investigated in temperatures ranging from 0 to 1100 K, where the quasi-harmonic model is valid.80 Therefore, the phonon contribution to all thermodynamic properties at elevated temperatures is illustrated in this work.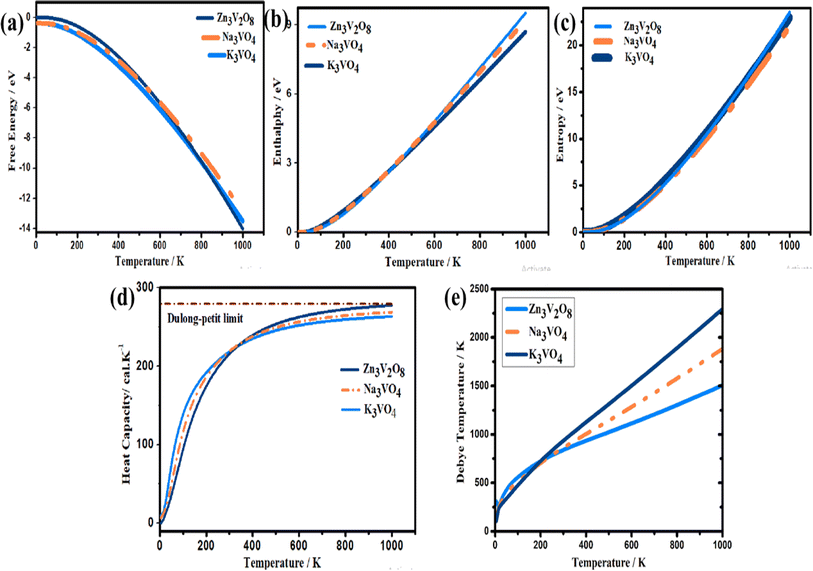 | ||
| Fig. 16 Calculated thermodynamic parameters, (a) Gibb's free energy, (b) enthalpy, (c) entropy, (d) heat capacity and (e) Debye temperature of Na3VO4, K3VO4 and Zn3V2O8. | ||
The Gibbs free energy (G) effectively defines the stability of a compound.81 Fig. 16a shows the variation in the Gibbs free energy of these systems with temperature. The decreasing trend of the Gibbs free energy for the systems is as follows: K3VO4 > Na3VO4 > Zn3V2O8. The Gibbs free energy corresponds to the amount of energy of the system that is required for work to be done. Thus, a system having a lower Gibbs energy (G) is thought to be thermodynamically favorable.82 The rising trend in the enthalpy and entropy curves with increasing temperature can also be observed in Fig. 16b and c, respectively. The behavior of these two factors is the opposite of that of the Gibbs free energy.83 Because it possesses the highest entropy, enthalpy, and lowest Gibbs energy, the Zn3V2O8 photocatalyst is thermodynamically more stable.
Solid-state physics also involves the investigation of a crystal's specific heat capacity at constant volume.84 The phonon thermal softening at high temperature is highlighted by the increasing trend of the Cv curves. When the temperature is low, Cv is proportional to T3. However, at elevated temperature, the heat capacity complies with the Dulong–Petit law, and reaches the asymptotic limit, i.e., 3nR. Here, n is the atom's number in the primitive cell, while R is the general gas constant.41 The highest heat capacity of Zn3V2O8 is 277.29 cal K−1 at 1000 K (Fig. 16d).
For qualitative insight into the atomic thermal vibrations, the Debye temperature (θD) was studied, as these two parameters are parallel (Fig. 16e). According to the Debye theory, the Debye temperature is compatible with the phonon frequency.85 Additionally, it represents the stability of the structure and the strength of the bonds, which directly corresponds to several physical characteristics, like the melting temperature and specific heat. The Debye temperature is derived from elastic constants, and observed heat measurements are equivalent at low temperatures. Computing θD via elastic constants is one of the standard methods of calculation. Thus, the Debye temperature (θD) can be estimated from the average sound velocity (νm), as described in the following equation:86
The transverse and longitudinal sound velocities (νt and νl) of a solid material can be determined from the Navier equation using the values of bulk and shear modulus.
The values of all these parameters are summarized in Table 6. To the best of our knowledge, there is no comparable experimental or theoretical data. Therefore, the stated findings are considered as the first-ever prediction. Thus, these results still need an experimental confirmation.
| Crystal systems | V (Å3) | ρ (kg m−3) | νl (m s−1) | νt (m s−1) | νm (ms−1) | θD |
|---|---|---|---|---|---|---|
| Zv3V2O8 | 600.83 | 46![[thin space (1/6-em)]](https://www.rsc.org/images/entities/char_2009.gif) 500 500 |
6446 | 15![[thin space (1/6-em)]](https://www.rsc.org/images/entities/char_2009.gif) 548 548 |
7295.71 | 1520.52 |
| Na3VO4 | 329.38 | 24![[thin space (1/6-em)]](https://www.rsc.org/images/entities/char_2009.gif) 600 600 |
2803 | 5348 | 3229.71 | 449.90 |
| K3VO4 | 247.01 | 26![[thin space (1/6-em)]](https://www.rsc.org/images/entities/char_2009.gif) 100 100 |
2004 | 3891 | 2244.78 | 344.72 |
3.10. Photocatalytic activity
The electronic properties can be used to quantitatively explore the systematic framework of narrowing band gap, separation, and migration of photoinduced charge carriers that will consequently enhance the photoactivity of a substance. However, this improvement might not be enough to achieve the entire photoactivity required for the degradation and water splitting processes.87 It is obvious that the band structure requires a widely applicable design strategy, including band-edge placements and band gaps of newly produced materials.88 An efficient tool to examine the enhanced photocatalytic activity of semiconductors for photoelectrochemical water splitting and pollutant degradation is provided by this theoretical calculation method.89 Inter-particle electron transfer occurs when the optical incident light is equivalent to or greater than the band gap in semiconductor photocatalysts.90 After the absorption of light, electrons are excited from VB to CB, producing e− and h+ charge carriers with oxidative and reductive capabilities.91 The band edge potentials can be calculated as follows:| EVB = EVB + Eg |
| Compounds | χ | Eg (eV) | CB (eV) | VB (eV) |
|---|---|---|---|---|
| Zn3V2O8 | 5.80 | 2.69 | −0.63 | 2.06 |
| Zn3(1−0.06)V2(1−0.06)Fe0.06O8 | 5.90 | 1.72 | −0.36 | 1.36 |
| Zn3(1−0.06)V2(1−0.06)Co0.06O8 | 5.93 | 1.68 | −0.31 | 1.37 |
| Na3VO4 | 4.77 | 3.80 | −1.63 | 2.17 |
| Na3V(1−0.06)Fe0.06O4 | 4.78 | 2.99 | −1.23 | 1.76 |
| Na3V(1−0.06)Co0.06O4 | 4.78 | 2.59 | −1.02 | 1.57 |
| K3VO4 | 4.50 | 3.65 | −1.83 | 1.82 |
| K3V(1−0.06)Fe0.06O4 | 4.50 | 2.76 | −1.38 | 1.38 |
| K3V(1−0.06)Co0.06O4 | 4.53 | 2.58 | −1.26 | 1.32 |
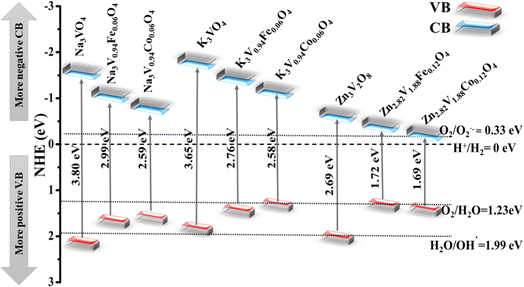 | ||
| Fig. 17 Schematic with band edge positions of pure and doped Na3VO4, K3VO4, and Zn3V2O8 in the photocatalytic water splitting process. | ||
The following equation is used to calculate the electronegativity of a material:87
According to the equation, the generation of superoxide acid (−HO2) and superoxide radical (O2−˙) is an essential step for the solar degradation of pollutants. However, photogenerated holes can oxidize the OH− ion and fabricate the reactive hydroxyl radical (OH−), as shown in the chemical equations below:92
| O2 + H+ + e− → HO2 |
| O2 + e− → O2−˙ |
| OH− + h+ → OH−˙ |
As discussed earlier, the conduction band potential for all of these systems is more negative as compared to the redox potential of O2/O−2˙ (−0.33 eV), indicating the reduction of O2 to the O2−˙ radical anion. Although the conduction band edge potential of the photocatalyst systems is more negative than that of O2/H2O2 (0.685 eV potential), this suggests that H2O2 is formed when electrons react with adsorbed oxygen molecules. This H2O2 combines with electrons to produce hydroxyl radicals. Furthermore, the valence band potential is more positive than that of HO−/HO˙ potential (1.99 eV), indicating that photogenerated holes in these systems oxidize hydroxyl ions to the reactive hydroxyl radicals required in the photocatalytic degradation of pollutants.93
All of the three host systems, either pure, Fe-doped or Co-doped photocatalysts, have a higher positive valence band potential than that of O2/H2O (1.23 eV), which is consistent with all of the aforementioned observations, and indicates a strong oxidation potential for the evolution of O2. Highly reactive radicals (OH−˙ and O2−˙) will oxidize both organic and inorganic substances, resulting in water and other non-toxic molecules.94 Interestingly, the CB positions of Na3VO4, Na3V0.94Fe0.06O4, Na3V0.94Co0.06O4, K3VO4, K3V0.94Fe0.06O4, K3V0.94Co0.06O4, Zn3V2O8, Zn2.82V1.88Fe0.12O4, and Zn2.82V1.88Co0.12O4 are negative as compared to the H2/H+ (0 eV) redox potential. A more positive potential provides the strong oxidizing potential for oxygen evolution in these photocatalysts, despite the fact that they are efficient at producing hydrogen gas. Higher positive VB and more negative CB potentials are among the best benchmarks for photocatalytic processes.95 The peculiar higher photocatalytic activity of Zn3V2O8 compared to other compounds can be ascribed to the location of the higher V-3d and Fe-3d or Co-3d states, compared with those of Na3VO4 and K3VO4. For efficient photocatalysis, electron–hole pairs should be energetically and geometrically separated.
Solubility is a key parameter in determining the photocatalytic efficiency. At present, most of the photocatalytic materials usually comprised insoluble semiconductors, while soluble semiconductor materials have restricted validity in photocatalysis.96 Soluble inorganics can dissolve in water due to the attraction of positive and negative charges, resulting in the disintegration of crystalline structures and the loss of energy band structures for light absorption.97 Meanwhile, the addition of an insoluble solute to its saturated solution will remain as crystals, and these undissolved photocatalytic materials will retain the geometrical shapes required for light absorption and photogenerated carrier transfer.96 Higher lattice energies are typically associated with less solubility because they demand more energy to break the ionic bonds within the lattice.98 Lattice energy minimization techniques have been used in attempt to enhance the effectiveness of water-soluble photocatalysts.99 The lattice energy of Zn3V2O8 (−50340.43 eV) is highest among all three studied orthovanadates, indicating its lowest solubility as compared to K3VO4 and Na3VO4 (Table 1). Moreover, the smaller size and greater charge on the Zn2+ ion than Na+ and K+ ions enables it to develop the strongest forces of attraction within the lattice, which are difficult to overcome, hence making it significantly less soluble in water. Furthermore, neither distortion of the crystal lattice nor significant reduction in the lattice energy was observed after doping. The solubility trend for all un-doped and doped orthovanadates is as follows: Zn3V2O8 > Zn3(1−0.06)V2(1−0.06)Co0.06O8 > Zn3(1−0.06)V2(1−0.06)Fe0.06O8 > Na3VO4 > Na3V(1−0.06)Co0.06O4 > Na3V(1−0.06)Fe0.06O4 > K3VO4 > K3V(1−0.06)Co0.06O4 > K3V(1−0.06)Fe0.06O4.
4. Conclusion
This study explored the first-principles calculations of vanadium-based Na3VO4, K3VO4, and Zn3V2O8 photocatalysts. The covalent character is associated with a higher degree of positive charge (for the V–O and R–O bonds). Moreover, the shorter bond length and high electronegativity of the V–O bond introduce hardness in all of these materials. The elastic constants and aggregate elastic modulus (B, G, Y, G/B, Poisson ratio) are also discussed, which signify the stiffness, ductility, anisotropy, and mechanical stability of these compounds. Using a quasi-harmonic approach, the thermodynamic parameters illustrated that a sharp decline in the Gibbs energy can be observed with increased temperature. The increasing heat capacity approaches the Dulong–Petit limit. Hence, K3VO4, Na3VO4, and Zn3V2O8 are thermodynamically stable photocatalysts. As optical properties, materials showing lower reflectivity and higher absorption are associated with a high dielectric constant, so these parameters actually enhance the photocatalytic activity. A more negative CB value and a more positive VB value are appropriate criteria for photocatalytic water splitting and pollutant degradation. Na3VO4 is photocatalytically more active despite its prominent flaw, i.e., band gap, which can be resolved in the future. The electronic structure of a narrow band gap is significantly influenced by cations without a noble gas configuration. The estimated indirect band gap of Zn3V2O8 is 2.69 eV, which is less than the values of 3.80 eV and 3.65 eV for Na3VO4 and K3VO4, respectively. However, doping with 6% iron and 6% cobalt turned the indirect band gap into a direct one with a prominent reduction in the band gap, especially with 6% Co as compared to 6% Fe. When the electronegativity of the doping species is smaller than that of oxygen, the impurity states will lie above the V. B. M. As a result, interactions between Co 3d and O 2p, as demonstrated by PDOS and the spin up (α) and spin down (β) magnetic moments, destabilize the VB and dramatically reduce the band gap, leading to the most effective photoresponse of Zn3(1−0.06)V2(1−0.06)Co0.06O8 under visible light irradiation. Furthermore, based on the definition of the semiconductor electronegativity, the CB and VB edge positions demonstrated that the Fe or Co-doped Zn3V2O8 possesses favorable redox potentials under visible light, making it a promising material for further applications.Data availability
All data are present in the manuscript.Conflicts of interest
There are no conflicts to declare.References
- V. Dhiman and N. Kondal, Phys. B, 2022, 628, 413569 CrossRef CAS.
- M.-Y. Qi, M. Conte, M. Anpo, Z.-R. Tang and Y.-J. Xu, Chem. Rev., 2021, 121, 13051–13085 CrossRef CAS.
- K. Nakata and A. Fujishima, J. Photochem. Photobiol., C, 2012, 13, 169–189 CrossRef CAS.
- E. M. Saggioro, A. S. Oliveira and J. C. Moreira, Text Wastewater Treat, 2016 Search PubMed.
- Z. Shayegan, C.-S. Lee and F. Haghighat, Chem. Eng. J., 2018, 334, 2408–2439 CrossRef CAS.
- A. Al Mamun, M. Monsur Alam, A. Habib, U. Chakma, M. Sikder and A. Kumer, Egypt. J. Chem., 2021, 64, 5117–5126 Search PubMed.
- C. Karthikeyan, P. Arunachalam, K. Ramachandran, A. M. Al-Mayouf and S. Karuppuchamy, J. Alloys Compd., 2020, 828, 154281 CrossRef CAS.
- Y. Chen, C. Shen, J. Wang, G. Xiao and G. Luo, ACS Sustain. Chem. Eng., 2018, 6, 13276–13286 CrossRef CAS.
- R. A. Omar, D. Chauhan, N. Talreja, R. Mangalaraja and M. Ashfaq, in Agri-Waste and Microbes for Production of Sustainable Nanomaterials, Elsevier, 2022, pp. 281–298 Search PubMed.
- S. Tu, Y. Guo, Y. Zhang, C. Hu, T. Zhang, T. Ma and H. Huang, Adv. Funct. Mater., 2020, 30, 2005158 CrossRef CAS.
- K. W. Bourkeb and O. Baaloudj, J. Solid State Electrochem., 2022, 26, 571–580 CrossRef.
- C. Hitam and A. Jalil, J. Environ. Manage., 2020, 258, 110050 CrossRef CAS.
- C. V. Reddy, I. N. Reddy, K. Ravindranadh, K. R. Reddy, D. Kim and J. Shim, Sep. Purif. Technol., 2020, 252, 117352 CrossRef CAS.
- K. M. Lee, C. W. Lai, K. S. Ngai and J. C. Juan, Water Res., 2016, 88, 428–448 CrossRef CAS.
- K. Prakash, P. Senthil Kumar, S. Pandiaraj, K. Saravanakumar and S. Karuthapandian, J. Exp. Nanosci., 2016, 11, 1138–1155 CrossRef CAS.
- Q. Guo, C. Zhou, Z. Ma and X. Yang, Adv. Mater., 2019, 31, 1901997 CrossRef CAS.
- Y. Dai, C. Poidevin, C. Ochoa-Hernández, A. A. Auer and H. Tüysüz, Angew. Chem., 2020, 132, 5837–5845 CrossRef.
- X. Liu, S. Depaifve, T. Leyssens, S. Hermans and A. Vlad, Batteries Supercaps, 2019, 2, 1016–1025 CrossRef CAS.
- M. R. Dolgos, A. M. Paraskos, M. W. Stoltzfus, S. C. Yarnell and P. M. Woodward, J. Solid State Chem., 2009, 182, 1964–1971 CrossRef CAS.
- W. Zhang, H. Zhang, W. Huang, X. Lu, S. Gao, J. Wang, D. Zhang, X. Zhang and M. Wang, Inorg. Chem. Front., 2022, 9, 977–986 RSC.
- T. Iqbal, A. Hassan, M. Ijaz, M. Salim, M. Farooq, M. Zafar and M. Tahir, Appl. Nanosci., 2021, 11, 1661–1671 CrossRef CAS.
- T. Nakajima, M. Isobe, Y. Uzawa and T. Tsuchiya, J. Mater. Chem. C, 2015, 3, 10748–10754 RSC.
- C.-M. Huang, G.-T. Pan, Y.-C. M. Li, M.-H. Li and T. C.-K. Yang, Appl. Catal., A, 2009, 358, 164–172 CrossRef CAS.
- R. Mohamed, F. Harraz and I. Mkhalid, J. Alloys Compd., 2012, 532, 55–60 CrossRef CAS.
- J. Ye, Z. Zou, M. Oshikiri, A. Matsushita, M. Shimoda, M. Imai and T. Shishido, Chem. Phys. Lett., 2002, 356, 221–226 CrossRef CAS.
- A. Malathi, J. Madhavan, M. Ashokkumar and P. Arunachalam, Appl. Catal., A, 2018, 555, 47–74 CrossRef CAS.
- M. M. Sajid, N. A. Shad, S. B. Khan, Z. Zhang and N. Amin, J. Alloys Compd., 2019, 775, 281–289 CrossRef CAS.
- B. Slobodin, A. Ishchenko, R. Samigullina, O. Teslenko, B. Shul’gin and D. Y. Zhurakovskii, Inorg. Mater., 2011, 47, 1126–1131 CrossRef CAS.
- F. Wang, T. Shen, Z. Fu, Y. Lu and C. Chen, Nanotechnology, 2017, 29, 035702 CrossRef.
- İ. Tatlıdil, E. Bacaksız, C. K. Buruk, C. Breen and M. Sökmen, J. Alloys Compd., 2012, 517, 80–86 CrossRef.
- A. James, J. D. Rodney, A. Manojbabu, S. Joshi, L. Rao, B. R. Bhat and N. Udayashankar, J. Mater. Sci.: Mater. Electron., 2024, 35, 190 CrossRef CAS.
- C. Ponraj, P. S. Kumar, S. Sarkar, C. Krishnamoorthi, N. Manikandan, G. Vinitha and J. Daniel, Surf. Interfaces, 2022, 31, 102050 CrossRef CAS.
- M. A. Khan, S. I. Woo and O.-B. Yang, Int. J. Hydrogen Energy, 2008, 33, 5345–5351 CrossRef CAS.
- S. Piskunov, O. Lisovski, J. Begens, D. Bocharov, Y. F. Zhukovskii, M. Wessel and E. Spohr, J. Phys. Chem. C, 2015, 119, 18686–18696 CrossRef CAS.
- C. Regmi, Y. K. Kshetri, T.-H. Kim, R. P. Pandey and S. W. Lee, Mol. Catal., 2017, 432, 220–231 CrossRef CAS.
- M. Segall, P. J. Lindan, M. a. Probert, C. J. Pickard, P. J. Hasnip, S. Clark and M. Payne, J. Phys.: Condens. Matter, 2002, 14, 2717 CrossRef CAS.
- S. Hall, I. Hamerton, B. Howlin and A. Mitchell, Mol. Simul., 2008, 34, 1259–1266 CrossRef CAS.
- S. Fagan, R. Mota, R. J. Baierle, G. Paiva, A. Da Silva and A. Fazzio, J. Mol. Struct.: THEOCHEM, 2001, 539, 101–106 CrossRef CAS.
- J. P. Perdew, K. Burke and M. Ernzerhof, Phys. Rev. Lett., 1996, 77, 3865 CrossRef CAS.
- M. Neumann and O. Steinhauser, Chem. Phys. Lett., 1983, 102, 508–513 CrossRef CAS.
- X. Jin, R. Wang, Y. Zhou, J. Lai, J. Li, G. Pei, S. Chen, X. Wang, J. Xiang and Z. Zhu, J. Alloys Compd., 2022, 896, 162862 CrossRef CAS.
- A. B. Garg, D. Errandonea, P. Rodríguez-Hernández and A. Muñoz, J. Phys.: Condens. Matter, 2016, 29, 055401 CrossRef.
- S. Tang, C. Zhang, C. Jia, H. Ryu, C. Hwang, M. Hashimoto, D. Lu, Z. Liu, T. P. Devereaux and Z.-X. Shen, APL Mater., 2018, 6, 026601 CrossRef.
- A. F. U. Islam, M. N. H. Liton, H. T. Islam, M. Al Helal and M. Kamruzzaman, Chin. Phys. B, 2017, 26, 036301 CrossRef.
- S.-F. Sheng, Phys. B, 2013, 426, 20–23 CrossRef CAS.
- Z. Huang, L. Zhang and W. Pan, J. Solid State Chem., 2013, 205, 97–103 CrossRef CAS.
- J. Zhang, P. Zhou, J. Liu and J. Yu, Phys. Chem. Chem. Phys., 2014, 16, 20382–20386 RSC.
- R. Wallauer, R. Perea-Causin, L. Münster, S. Zajusch, S. Brem, J. Güdde, K. Tanimura, K.-Q. Lin, R. Huber and E. Malic, Nano Lett., 2021, 21, 5867–5873 CrossRef CAS.
- R. Liu, Z. Chen, Y. Yao, Y. Li, W. A. Cheema, D. Wang and S. Zhu, RSC adv., 2020, 10, 29408–29418 RSC.
- Z. Luo, X. Chen, J. Chen and X. Wang, Eur. J. Oper. Res., 2017, 259(2), 437–451 CrossRef.
- R. Gedam and D. Ramteke, J. Rare Earths, 2012, 30, 785–789 CrossRef CAS.
- A. Chaudhuri, L. Mandal, X. Chi, M. Yang, M. Scott, M. Motapothula, X. Yu, P. Yang, Y. Shao-Horn and T. Venkatesan, Phys. Rev. B, 2018, 97, 195150 CrossRef CAS.
- S. S. Kekade, P. V. Gaikwad, S. A. Raut, R. J. Choudhary, V. L. Mathe, D. Phase, A. Kshirsagar and S. I. Patil, ACS Omega, 2018, 3, 5853–5864 CrossRef CAS.
- A. Langenberg, K. Hirsch, A. Ławicki, V. Zamudio-Bayer, M. Niemeyer, P. Chmiela, B. Langbehn, A. Terasaki, B. v. Issendorff and J. Lau, Phys. Rev. B, 2014, 90, 184420 CrossRef.
- M.-H. Lv, C.-M. Li and W.-F. Sun, Nanomaterials, 2022, 12, 382 CrossRef CAS.
- M. Zhang, Z. Huang, X. Wang, H. Zhang, T. Li, Z. Wu, Y. Luo and W. Cao, Sci. Rep., 2016, 6, 19504 CrossRef CAS.
- J. Zhang, D. Gao and K. Xu, Sci. China: Phys., Mech. Astron., 2012, 55, 428–435 CrossRef CAS.
- V. K. Sharma and G. D. Varma, Adv. Mater. Lett., 2012, 3, 126–129 CrossRef CAS.
- L. Ren, J. Xu, S.-C. Pan, H.-Y. Yu, T. Zhang, T. Shoji, N.-N. Li, D.-Y. Zhang and D.-B. Sun, Colloids Surf., A, 2021, 617, 126393 CrossRef CAS.
- J.-H. Wang and Z.-Y. Zhao, Materials, 2022, 15, 1361 CrossRef CAS.
- A. Mirzai, S. Melin and A. Ahadi, Comput. Mater. Sci., 2022, 214, 111741 CrossRef CAS.
- F. Subhan, S. Azam, G. Khan, M. Irfan, S. Muhammad, A. G. Al-Sehemi, S. Naqib, R. Khenata, S. Khan and I. V. Kityk, J. Alloys Compd., 2019, 785, 232–239 CrossRef CAS.
- F. Mouhat and F.-X. Coudert, Phys. Rev. B, 2014, 90, 224104 CrossRef.
- L. Zuo, M. Humbert and C. Esling, J. Appl. Crystallogr., 1992, 25, 751–755 CrossRef.
- Z. Huang, J. Feng and W. Pan, J. Solid State Chem., 2012, 185, 42–48 CrossRef CAS.
- C. Chen, L. Liu, Y. Wen, Y. Jiang and L. Chen, Crystals, 2019, 9, 497 CrossRef.
- V. Kumar, A. Shrivastava and V. Jha, J. Phys. Chem. Solids, 2010, 71, 1513–1520 CrossRef CAS.
- K. Panda and K. R. Chandran, Acta Mater., 2006, 54, 1641–1657 CrossRef CAS.
- M. Ali, M. Hadi, M. Hossain, S. Naqib and A. Islam, Phys. Status Solidi B Basic Res., 2017, 254, 1700010 CrossRef.
- M. A. Rahman, M. Z. Rahaman and M. A. Rahman, Int. J. Mod. Phys. B, 2016, 30, 1650199 CrossRef CAS.
- M. J. Islam, M. S. H. Sohag, U. Chakma, A. Kumer, M. M. Alam and M. Nazrul Islam Khan, Advances in Condensed Matter Physics, 2023, p. 2023 Search PubMed.
- J. Liu, F. Liu, H. Bai, W. Zhuang and Y. Xu, Mol. Phys., 2022, 120, e2002958 CrossRef.
- S. Pasternak and Y. Paz, ChemPhysChem, 2013, 14, 2059–2070 CrossRef CAS.
- N. Khalid, A. Hammad, M. Tahir, M. Rafique, T. Iqbal, G. Nabi and M. Hussain, Ceram. Int., 2019, 45, 21430–21435 CrossRef CAS.
- M. J. Islam and A. Kumer, SN Appl. Sci., 2020, 2, 251 CrossRef CAS.
- M. Houari, B. Bouadjemi, M. Matougui, S. Haid, T. Lantri, Z. Aziz, S. Bentata and B. Bouhafs, Opt. Quantum Electron., 2019, 51, 1–14 CrossRef CAS.
- B. Zhao, Y. Du, Z. Yan, L. Rao, G. Chen, M. Yuan, L. Yang, J. Zhang and R. Che, Adv. Funct. Mater., 2023, 33, 2209924 CrossRef CAS.
- M. A. Kamboh, L. Hao, M. Farhan, Y. Su, L. Wang, Q. Chen, H. Wang, J. Zhang and Q. Wang, J. Mater. Sci., 2022, 57, 18905–18922 CrossRef CAS.
- S. Kanwal, J. Wen, B. Yu, X. Chen, D. Kumar, Y. Kang, C. Bai, S. Ubaid and D. Zhang, Nanomaterials, 2020, 10, 1439 CrossRef CAS.
- M. Isik, G. Surucu, A. Gencer and N. Gasanly, Mater. Today Commun., 2021, 27, 102299 CrossRef CAS.
- J. Buckeridge, D. O. Scanlon, A. Walsh and C. R. A. Catlow, Comput. Phys. Commun., 2014, 185, 330–338 CrossRef CAS.
- B. H. Solis and S. Hammes-Schiffer, Inorg. Chem., 2014, 53, 6427–6443 CrossRef CAS.
- S. J. McCormack and A. Navrotsky, Acta Mater., 2021, 202, 1–21 CrossRef CAS.
- L. Qiu, N. Zhu, Y. Feng, E. E. Michaelides, G. Żyła, D. Jing, X. Zhang, P. M. Norris, C. N. Markides and O. Mahian, Phys. Rep., 2020, 843, 1–81 CrossRef CAS.
- G. J. Snyder, M. T. Agne and R. Gurunathan, Natl. Sci. Rev., 2019, 6, 380–381 CrossRef.
- S. Boucetta and F. Zegrar, J. Magnesium Alloys, 2013, 1, 128–133 CrossRef CAS.
- D. Toprek and V. Koteski, Mater. Chem. Phys., 2021, 264, 124439 CrossRef CAS.
- B.-X. Zhou, W.-Q. Huang, K. Yang, S. S. Ding, Z. Xie, A. Pan, W. Hu, P. Peng and G.-F. Huang, J. Phys. Chem. C, 2018, 122, 28065–28074 CrossRef CAS.
- R. Saravanan, S. Karthikeyan, V. Gupta, G. Sekaran, V. Narayanan and A. Stephen, Mater. Sci. Eng. C, 2013, 33, 91–98 CrossRef CAS.
- D. Zheng and X. Wang, Appl. Catal., B, 2015, 179, 479–488 CrossRef CAS.
- P. Praus, Carbon, 2021, 172, 729–732 CrossRef CAS.
- H. Yan, X. Wang, M. Yao and X. Yao, Prog. Nat. Sci.: Mater. Int., 2013, 23, 402–407 CrossRef.
- F. Opoku, K. K. Govender, C. G. C. E. van Sittert and P. P. Govender, New J. Chem., 2017, 41, 11701–11713 RSC.
- C. Bie, H. Yu, B. Cheng, W. Ho, J. Fan and J. Yu, Adv. Mater., 2021, 33, 2003521 CrossRef CAS.
- I. Székely, E.-Z. Kedves, Z. Pap and M. Baia, Catalysts, 2021, 11, 779 CrossRef.
- W. Gao, Y. Wang, M. Zhong, H. Kang, B. Su and Z. Lei, Colloids Surf., A, 2024, 135110 CrossRef CAS.
- G. Iervolino, I. Zammit, V. Vaiano and L. Rizzo, Heterogeneous Photocatalysis: Recent Advances, 2020, 225–264 Search PubMed.
- P. Reunchan, S. Ouyang, N. Umezawa, H. Xu, Y. Zhang and J. Ye, J. Mater. Chem. A, 2013, 1, 4221–4227 RSC.
- C. Parks, A. Koswara, F. DeVilbiss, H.-H. Tung, N. K. Nere, S. Bordawekar, Z. K. Nagy and D. Ramkrishna, Phys. Chem. Chem. Phys., 2017, 19, 5285–5295 RSC.
| This journal is © The Royal Society of Chemistry 2024 |


