 Open Access Article
6-Aminocoumarin-derived Schiff base gelators: aggregation and sensing of CN−, Fe3+, Cu2+ and CO2 under different conditions†
Eshani Paul,
Rameez Raza,
Subrata Ranjan Dhara,
Nabajyoti Baildya and
Kumaresh Ghosh
 *
*
Department of Chemistry, University of Kalyani, Kalyani 741235, India. E-mail: ghosh_k2003@yahoo.co.in; kumareshchem18@klyuniv.ac.in; Fax: +91 3325828282; Tel: +91 3325828750-305
First published on 17th October 2024
Abstract
Herein, we report the synthesis, characterization, supramolecular gelation and multiple applications of 6-aminocoumarin-derived Schiff bases 1 and 2. Both Schiff bases underwent gelation in DMF–H2O (2![[thin space (1/6-em)]](https://www.rsc.org/images/entities/char_2009.gif) :
:![[thin space (1/6-em)]](https://www.rsc.org/images/entities/char_2009.gif) 1, v/v), DMSO–H2O (2
1, v/v), DMSO–H2O (2![[thin space (1/6-em)]](https://www.rsc.org/images/entities/char_2009.gif) :
:![[thin space (1/6-em)]](https://www.rsc.org/images/entities/char_2009.gif) 1, v/v) and dioxane–H2O (2
1, v/v) and dioxane–H2O (2![[thin space (1/6-em)]](https://www.rsc.org/images/entities/char_2009.gif) :
:![[thin space (1/6-em)]](https://www.rsc.org/images/entities/char_2009.gif) 1, v/v) involving weak forces. Furthermore, the gels were stable and exhibited good viscoelastic properties. The storage modulus (G′) of each gel was considerably higher than its loss modulus (G′′). The higher value of the crossover point and lower value of tan
1, v/v) involving weak forces. Furthermore, the gels were stable and exhibited good viscoelastic properties. The storage modulus (G′) of each gel was considerably higher than its loss modulus (G′′). The higher value of the crossover point and lower value of tan![[thin space (1/6-em)]](https://www.rsc.org/images/entities/char_2009.gif) δ for the gel of Schiff base 2 compared to the gel of Schiff base 1 demonstrated the better gelation behaviour of 2 than that of 1 in DMF–H2O (2
δ for the gel of Schiff base 2 compared to the gel of Schiff base 1 demonstrated the better gelation behaviour of 2 than that of 1 in DMF–H2O (2![[thin space (1/6-em)]](https://www.rsc.org/images/entities/char_2009.gif) :
:![[thin space (1/6-em)]](https://www.rsc.org/images/entities/char_2009.gif) 1, v/v). Further, iodo-analogue 2 exhibited cross-linked helical morphology, whereas non-iodo analogue 1 exhibited long chain fibrous morphology, as observed via FESEM. These differences in morphology and viscoelastic behaviors were attributed to the iodo group present in 2, which influenced its aggregation involving halogen bonding. To demonstrate their application, the DMF–H2O (2
1, v/v). Further, iodo-analogue 2 exhibited cross-linked helical morphology, whereas non-iodo analogue 1 exhibited long chain fibrous morphology, as observed via FESEM. These differences in morphology and viscoelastic behaviors were attributed to the iodo group present in 2, which influenced its aggregation involving halogen bonding. To demonstrate their application, the DMF–H2O (2![[thin space (1/6-em)]](https://www.rsc.org/images/entities/char_2009.gif) :
:![[thin space (1/6-em)]](https://www.rsc.org/images/entities/char_2009.gif) 1, v/v) gels of both 1 and 2 recognized CN− over a series of other anions by exhibiting a gel-to-sol phase change. Besides anion sensing, gels 1 and 2 selectively detected Fe3+ and Cu2+ ions over other metal ions via a gel-to-gel colour change. Finally, CN−-treated solutions of 1 and 2 allowed the successful detection of CO2 by the naked eye. Moreover, the detection was possible using a test-kit method.
1, v/v) gels of both 1 and 2 recognized CN− over a series of other anions by exhibiting a gel-to-sol phase change. Besides anion sensing, gels 1 and 2 selectively detected Fe3+ and Cu2+ ions over other metal ions via a gel-to-gel colour change. Finally, CN−-treated solutions of 1 and 2 allowed the successful detection of CO2 by the naked eye. Moreover, the detection was possible using a test-kit method.
Introduction
The design and synthesis of multiple application-based low molecular weight Schiff base gelators and their structural tuning by introducing new functional groups are of contemporary interest in supramolecular chemistry.1 Owing to the dynamic reversibility of imine bonds and their potential for metal coordination, Schiff base gelators represent a particular type of unique and versatile gel-forming assembly building blocks.2 This allows the corresponding gel to be highly responsive to various external triggers, such as pH,3 metal cations,4 and anions.5 Consequently, supramolecular gels constructed from Schiff base compounds show tremendous promise for ion detection,6 catalysis,7 optical emissions,8 etc.Similar to other supramolecular gelators, Schiff base gelators show aggregation via weak interactions such as hydrogen bonding, electrostatic interactions, hydrophobic, and π–π stacking interactions or their combination.9
Among the different types of non-covalent interactions, halogen bonding10 as an equivalent to hydrogen bonding11 often plays a major or minor role during aggregation depending on the position of the halogen group in the structure. Thus, halogen bonding-induced supramolecular assembly has recently gained interest because of its unique features and prospective.12
However, despite the remarkable work on Schiff base gelators of different architectures,13 the use of a coumarin motif in this capacity is less explored. Importantly, coumarin for its optical properties has been widely used for recognition of ions in solution.14 Alternatively, exploitation of this motif in gel-phase sensing of ions is scarce. Especially, the 6-aminocoumarin-based Schiff base and its possible applications are unknown in supramolecular gelation. In a report by M. K. Paul et al., they investigated the liquid crystal properties of some 6-aminocoumarin-derived Schiff bases and examined their zinc-complexing behavior. In addition, they noted their gelation properties on modifying the alkoxy chains of the compounds.15
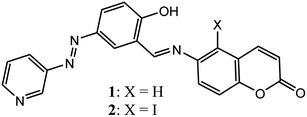
In continuation of our work on the recognition and sensing of ions in solution and gel states, herein we report the synthesis of 6-aminocoumarin-based Schiff bases 1 and 2 (Fig. 1), which undergo gelation in DMF–H2O (2![[thin space (1/6-em)]](https://www.rsc.org/images/entities/char_2009.gif) :
:![[thin space (1/6-em)]](https://www.rsc.org/images/entities/char_2009.gif) 1, v/v), DMSO–H2O (2
1, v/v), DMSO–H2O (2![[thin space (1/6-em)]](https://www.rsc.org/images/entities/char_2009.gif) :
:![[thin space (1/6-em)]](https://www.rsc.org/images/entities/char_2009.gif) 1, v/v) and dioxane–H2O (2
1, v/v) and dioxane–H2O (2![[thin space (1/6-em)]](https://www.rsc.org/images/entities/char_2009.gif) :
:![[thin space (1/6-em)]](https://www.rsc.org/images/entities/char_2009.gif) 1, v/v). Compound 2 was considered in this study to understand the role of halogen bonding in its aggregation. The rheological experiments showed that the viscoelastic characteristics of the gels of 1 and 2 differed significantly. During aggregation, compounds 1 and 2 followed different patterns of molecular packing, as reflected in their FESEM images. These different properties were attributed to the role of iodine in the weak halogen bonding. The gels in DMF
1, v/v). Compound 2 was considered in this study to understand the role of halogen bonding in its aggregation. The rheological experiments showed that the viscoelastic characteristics of the gels of 1 and 2 differed significantly. During aggregation, compounds 1 and 2 followed different patterns of molecular packing, as reflected in their FESEM images. These different properties were attributed to the role of iodine in the weak halogen bonding. The gels in DMF![[thin space (1/6-em)]](https://www.rsc.org/images/entities/char_2009.gif) :
:![[thin space (1/6-em)]](https://www.rsc.org/images/entities/char_2009.gif) H2O (2
H2O (2![[thin space (1/6-em)]](https://www.rsc.org/images/entities/char_2009.gif) :
:![[thin space (1/6-em)]](https://www.rsc.org/images/entities/char_2009.gif) 1, v/v) were stimuli responsive and selective for CN− ions among other anions studied. Besides anion sensing, gels 1 and 2 exhibited selective responses to Fe3+ and Cu2+ ions among other metal ions, resulting in a gel-to-gel colour change. As an extension of their application, CN−-treated DMF–H2O (2
1, v/v) were stimuli responsive and selective for CN− ions among other anions studied. Besides anion sensing, gels 1 and 2 exhibited selective responses to Fe3+ and Cu2+ ions among other metal ions, resulting in a gel-to-gel colour change. As an extension of their application, CN−-treated DMF–H2O (2![[thin space (1/6-em)]](https://www.rsc.org/images/entities/char_2009.gif) :
:![[thin space (1/6-em)]](https://www.rsc.org/images/entities/char_2009.gif) 1, v/v) solutions of 1 and 2 detected CO2 through a colour change. The test-kit detection boosts this investigation. Furthermore, the optical properties of the Schiff bases changed with the pH of the medium.
1, v/v) solutions of 1 and 2 detected CO2 through a colour change. The test-kit detection boosts this investigation. Furthermore, the optical properties of the Schiff bases changed with the pH of the medium.
CN− recognition has attracted attention because of its importance in biology and the environment. It is exceedingly poisonous and detrimental to both human health and the environment.16 Thus, for the gel-phase recognition of this ion, the different interactional properties of CN− include nucleophilic attack on a reactive functional group in a molecule or on a metal centre in a metal–ligand complex, as well as participation in H-bonding, followed by deprotonation.17
Besides CN− sensing, the detection of physiologically and environmentally relevant transition metal ions is a major concern in analytical chemistry.18 Among the different transition metal ions, Cu2+ and Fe3+ are two necessary trace metal ions found in the human body. Their balance in the body is essential.19 A shortage of iron in the body leads to anaemia, liver damage, Alzheimer's and Parkinson's disease, etc.20 Similarly, excessive levels of Cu2+ produce oxidative stress and problems linked to neuro degenerative illnesses such as Alzheimer's, Wilson's, and Menke's disease.21 Thus, a simple and effective method for the detection of Fe3+ and Cu2+ ions, particularly in a sol–gel medium, has attracted attention.
Besides ion sensing, the recognition of CO2 as a neutral molecule has attracted attention given that it plays an important role in human physiology. Also, it has impact on agriculture, food, and chemical industries.22 The selective and quick colorimetric detection of this neutral gaseous molecule by employing an anion-responsive synthetic compound, which has been infrequently reported in the literature, is commendable in recognition chemistry.23
Results and discussion
Synthesis
Compounds 1 and 2 were synthesised according to Scheme 1. 6-Aminocoumarin 3 and 7-iodo-6-aminocoumarin 4, which were prepared from coumarin according to the reported procedures, were reacted with pyridyl-azo salicylaldehyde 5 in dry MeOH at room temperature to give compounds 1 and 2 in reasonable yields, respectively. Both 1 and 2 were characterized by 1H, 13C NMR and mass spectral analyses.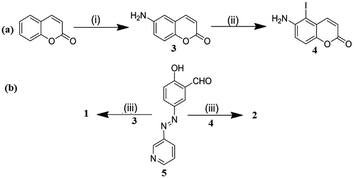 | ||
Scheme 1 (i) (a) HNO3![[thin space (1/6-em)]](https://www.rsc.org/images/entities/char_2009.gif) : :![[thin space (1/6-em)]](https://www.rsc.org/images/entities/char_2009.gif) H2SO4 (1 H2SO4 (1![[thin space (1/6-em)]](https://www.rsc.org/images/entities/char_2009.gif) : :![[thin space (1/6-em)]](https://www.rsc.org/images/entities/char_2009.gif) 3, v/v), stirring, rt, 1 h, (b) Fe-powder, NH4Cl, H2O, reflux, 2–3 h; (ii) NIS (N-iodosuccinimide), dry CH2Cl2, rt, stirring, 12 h; and (iii) MeOH, rt, stirring, 2 h. 3, v/v), stirring, rt, 1 h, (b) Fe-powder, NH4Cl, H2O, reflux, 2–3 h; (ii) NIS (N-iodosuccinimide), dry CH2Cl2, rt, stirring, 12 h; and (iii) MeOH, rt, stirring, 2 h. | ||
Gelation and gel characterization
Although coumarin was employed in the designs due to its excellent optical characteristics, a 3-pyridylazo salicylaldehyde unit was used to aid solvent gelation. Thus, to test the gelation abilities of compounds 1 and 2, various solvents with different polarities were selected. Table S1† summarizes the details of the gel study including the minimum gelation concentration (MGC) and Tg (gel-to-sol transition temperature) values. Both 1 and 2 were gelled in the same solvent combination. Gel formation was not observed in benzenoid or semi-aqueous solvents. However, they were stable and thermo-reversible (Fig. S1†). The gels exhibited different Tg and MGC values (Table S1†). Compound 1 produced a gel at a somewhat lower MGC compared to compound 2 (Table S1†). This emphasized the better gelation propensity of 1 over 2, which was attributed to the size factor or some dipole–dipole interaction of the iodo group in structure 2.However, the effect of the iodo group in gelator 2 with respect to gelator 1 was comprehensible from the viscoelastic properties of the gels prepared in DMF–H2O (2![[thin space (1/6-em)]](https://www.rsc.org/images/entities/char_2009.gif) :
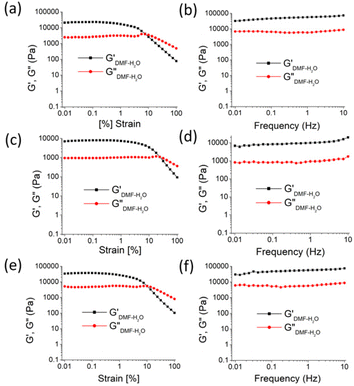
:![[thin space (1/6-em)]](https://www.rsc.org/images/entities/char_2009.gif) 1, v/v). In the frequency sweep experiment, the storage modulus (G′) of the gels was observed to be higher than the loss modulus (G′′), reflecting the true nature of the gels (Fig. 2). Further, the amplitude sweep experiments of the gels in DMF–H2O (2
1, v/v). In the frequency sweep experiment, the storage modulus (G′) of the gels was observed to be higher than the loss modulus (G′′), reflecting the true nature of the gels (Fig. 2). Further, the amplitude sweep experiments of the gels in DMF–H2O (2![[thin space (1/6-em)]](https://www.rsc.org/images/entities/char_2009.gif) :
:![[thin space (1/6-em)]](https://www.rsc.org/images/entities/char_2009.gif) 1, v/v) were performed at a constant frequency of 1 Hz. To compare the viscoelastic properties of the gels of 1 and 2, rheological data were acquired using freshly prepared gels at their minimum gelation concentrations and identical concentrations (6 mg mL−1) (Fig. 2 and Table 1). The analysis revealed that the critical strain of the DMF–H2O (2
1, v/v) were performed at a constant frequency of 1 Hz. To compare the viscoelastic properties of the gels of 1 and 2, rheological data were acquired using freshly prepared gels at their minimum gelation concentrations and identical concentrations (6 mg mL−1) (Fig. 2 and Table 1). The analysis revealed that the critical strain of the DMF–H2O (2![[thin space (1/6-em)]](https://www.rsc.org/images/entities/char_2009.gif) :
:![[thin space (1/6-em)]](https://www.rsc.org/images/entities/char_2009.gif) 1, v/v) gel of 2 was greater than that of the gel of 1. This corroborates that the gel of 2 had higher mechanical strength than that of the gel of 1.
1, v/v) gel of 2 was greater than that of the gel of 1. This corroborates that the gel of 2 had higher mechanical strength than that of the gel of 1.
![[thin space (1/6-em)]](https://www.rsc.org/images/entities/char_2009.gif) :
:![[thin space (1/6-em)]](https://www.rsc.org/images/entities/char_2009.gif) 1, v/v)a
1, v/v)a
| Compound | Critical strain (%) | Crossover (% strain) | (Pa)* | (Pa)* | tan![[thin space (1/6-em)]](https://www.rsc.org/images/entities/char_2009.gif) δ δ |
|---|---|---|---|---|---|
a  and and  values were calculated from frequency sweep data. values were calculated from frequency sweep data. |
|||||
| 1 (5 mg mL−1) | 0.42 | 7.83 | 51![[thin space (1/6-em)]](https://www.rsc.org/images/entities/char_2009.gif) 556 556 |
8030 | 0.155 |
| 2 (6 mg mL−1) | 2.37 | 22.25 | 12![[thin space (1/6-em)]](https://www.rsc.org/images/entities/char_2009.gif) 656 656 |
1559 | 0.12 |
| 1 (6 mg mL−1) | 0.76 | 10.11 | 58![[thin space (1/6-em)]](https://www.rsc.org/images/entities/char_2009.gif) 164 164 |
8143 | 0.14 |
Similar observations were found at the crossover point. The crossover point of the DMF–H2O (2![[thin space (1/6-em)]](https://www.rsc.org/images/entities/char_2009.gif) :
:![[thin space (1/6-em)]](https://www.rsc.org/images/entities/char_2009.gif) 1, v/v) gel of 2 was 3 times higher than that of the gel of 1 in the same solvent. This result indicates that the gel of 2 bears a greater resistance to any change in momentum of a gel medium (Fig. 2 and Table 1). However, in the study, an increase in the gelation concentration increased the crossover point. In this context, the crossover point for the gel of 1 in DMF–H2O (2
1, v/v) gel of 2 was 3 times higher than that of the gel of 1 in the same solvent. This result indicates that the gel of 2 bears a greater resistance to any change in momentum of a gel medium (Fig. 2 and Table 1). However, in the study, an increase in the gelation concentration increased the crossover point. In this context, the crossover point for the gel of 1 in DMF–H2O (2![[thin space (1/6-em)]](https://www.rsc.org/images/entities/char_2009.gif) :
:![[thin space (1/6-em)]](https://www.rsc.org/images/entities/char_2009.gif) 1, v/v) was enhanced when the gelation concentration of 1 changed from 5 mg mL−1 to 6 mg mL−1 (Fig. 2 and Table 1). At the same concentration of gels, the crossover point in the amplitude sweep study for the gel of 2 was still significantly higher than that of the gel of 1. Further, the lower tan
1, v/v) was enhanced when the gelation concentration of 1 changed from 5 mg mL−1 to 6 mg mL−1 (Fig. 2 and Table 1). At the same concentration of gels, the crossover point in the amplitude sweep study for the gel of 2 was still significantly higher than that of the gel of 1. Further, the lower tan![[thin space (1/6-em)]](https://www.rsc.org/images/entities/char_2009.gif) δ of gel of 2 over the gel of 1 demonstrated the better gelation behaviour of 2 in DMF–H2O (2
δ of gel of 2 over the gel of 1 demonstrated the better gelation behaviour of 2 in DMF–H2O (2![[thin space (1/6-em)]](https://www.rsc.org/images/entities/char_2009.gif) :
:![[thin space (1/6-em)]](https://www.rsc.org/images/entities/char_2009.gif) 1, v/v) (Fig. 2 and Table 1). It was further noted that the crossover point and gel strength could be modulated on mixing the gels of 1 and 2. In this event, the gel obtained from the mixing of gelators 1 and 2 in DMF–H2O (2
1, v/v) (Fig. 2 and Table 1). It was further noted that the crossover point and gel strength could be modulated on mixing the gels of 1 and 2. In this event, the gel obtained from the mixing of gelators 1 and 2 in DMF–H2O (2![[thin space (1/6-em)]](https://www.rsc.org/images/entities/char_2009.gif) :
:![[thin space (1/6-em)]](https://www.rsc.org/images/entities/char_2009.gif) 1, v/v) resulted in a crossover point lying between the crossover points of the pristine gels of 1 and 2 (Fig. S2 and Table S2†).
1, v/v) resulted in a crossover point lying between the crossover points of the pristine gels of 1 and 2 (Fig. S2 and Table S2†).
However, the dissimilarity in rheological behaviour between the gels 1 and 2 is attributed to the different packing patterns of the gelators during their aggregation. The iodo group in the backbone of 2 may exhibit halogen bonding during aggregation. To gain further insight into the mode of aggregation and iodo effect, we tried to get the crystal structures of 1 and 2, but we failed. However, the FESEM images of the gels revealed their different morphologies. Although the aggregation of molecules of 1 led to a long chain fibrous morphology, iodo-analogue 2 possessed a cross-linked helical morphology. This is believed to be due to the halogen-bonding role in gelator 2, which influenced its aggregation pattern. The gel prepared from mixing 1 and 2 possessed a highly cross-linked network morphology (Fig. 3e and f). In describing the fibrous morphology of the gels, role of H-bonding and π-stacking interactions during their aggregation cannot be ignored and it is believed that these weak forces introduced stiffness in the gels.
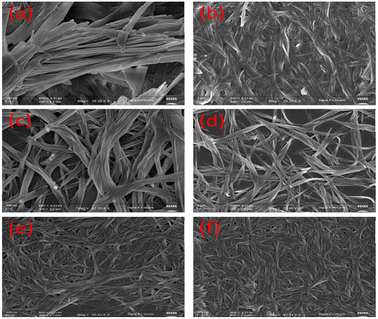 | ||
Fig. 3 FESEM images of the gels of 1 (a and b), 2 (c and d) and mixture of 1 and 2 (e and f) in DMF–H2O (2![[thin space (1/6-em)]](https://www.rsc.org/images/entities/char_2009.gif) : :![[thin space (1/6-em)]](https://www.rsc.org/images/entities/char_2009.gif) 1, v/v) [c = 1.35 × 10⁻² M (for gel of 1) and c = 1.20 × 10⁻² M (for gel of 2)]. 1, v/v) [c = 1.35 × 10⁻² M (for gel of 1) and c = 1.20 × 10⁻² M (for gel of 2)]. | ||
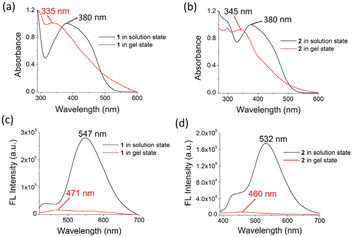
The comparison of the absorption and fluorescence spectra of 1 and 2 in the solution and gel states also supported their aggregation (Fig. 4). In solution, the strong absorption at 380 nm for 1 in DMF–H2O (2![[thin space (1/6-em)]](https://www.rsc.org/images/entities/char_2009.gif) :
:![[thin space (1/6-em)]](https://www.rsc.org/images/entities/char_2009.gif) 1, v/v) was blue-shifted to 335 nm in the gel state, whereas the absorption peak at 380 nm in compound 2 in solution was shifted to 345 nm in the gel state. This blue-shift in the absorption bands indicated H-type aggregation.24 In the fluorescence spectrum, the emission of 1 at 547 nm in DMF–H2O (2
1, v/v) was blue-shifted to 335 nm in the gel state, whereas the absorption peak at 380 nm in compound 2 in solution was shifted to 345 nm in the gel state. This blue-shift in the absorption bands indicated H-type aggregation.24 In the fluorescence spectrum, the emission of 1 at 547 nm in DMF–H2O (2![[thin space (1/6-em)]](https://www.rsc.org/images/entities/char_2009.gif) :
:![[thin space (1/6-em)]](https://www.rsc.org/images/entities/char_2009.gif) 1, v/v) solution moved to 471 nm with a significant reduction in its intensity in the gel state. Similarly, the emission of 2 at 532 nm in DMF–H2O (2
1, v/v) solution moved to 471 nm with a significant reduction in its intensity in the gel state. Similarly, the emission of 2 at 532 nm in DMF–H2O (2![[thin space (1/6-em)]](https://www.rsc.org/images/entities/char_2009.gif) :
:![[thin space (1/6-em)]](https://www.rsc.org/images/entities/char_2009.gif) 1, v/v) shifted to 460 nm in the gel state with a decrease in intensity (Fig. 4). The quenching of emission in both gels corroborated the aggregation-caused quenching event.25
1, v/v) shifted to 460 nm in the gel state with a decrease in intensity (Fig. 4). The quenching of emission in both gels corroborated the aggregation-caused quenching event.25
To understand the role of the functional groups in aggregation, we recorded the FT-IR spectra of the gels but failed to reach a conclusion (Fig. S3 and S4†). In the case of 1, the stretching signals at 1714 cm−1 (lactone carbonyl) and 1623 cm−1 (imine) were difficult to analyze due to the interference from the amide signal of DMF, which was inherently present in the gel (Fig. S3†). This was also the case for the gel of 2 (Fig. S4†). The amide carbonyl of DMF, appearing as broad signal at 1668 cm−1, obscured the stretching of the lactone and imine functionalities of the compounds (Fig. S3 and S4†).
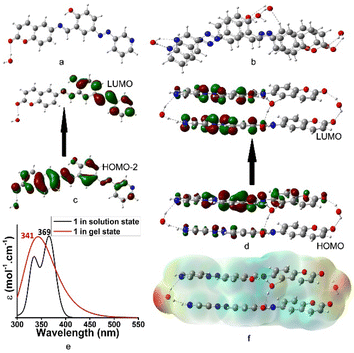
A theoretical study was performed to realize the mode of aggregation and influence of iodine in this event. The aggregation of 1 at the atomistic level was calculated by DFT simulations.26 Fig. 5a and b present the optimized geometries of 1 and its aggregation, respectively. In the process of aggregation, the water molecule plays an important role. Fig. 5c and d present the electronic transitions of 1 in the solution and aggregated states, respectively. Although the electronic transition H-2 → L with λmax at 369 nm (expt. 380 nm) was observed in solution, a blue shifted λmax at 341 nm (expt. 335 nm) for the H → L transition was detected in the aggregated state. In this regard, Fig. 5e represents the UV-vis spectra of 1 in solution and in the aggregated states. Fig. 5f represents the electrostatic potential surface (EPS) of the aggregated form of 1. The active site is shown by red colour.
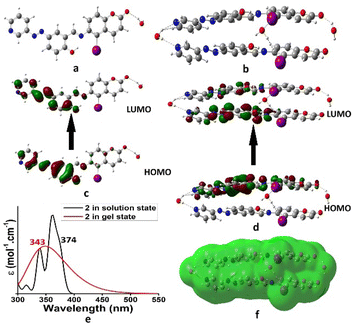
The aggregation pattern of iodo-analogue 2 was very similar to that of 1. Fig. 6a and b represent the optimized geometries of 2 and its aggregated form, respectively. Similar to 1, here water molecules also control the aggregation. The hydrogen-bonded water in the aggregate is further involved in halogen bonding with iodine. This highlighted the different aggregation pattern of 2 from 1. Fig. 6c and d present the electronic transitions of 2 in the solution and aggregated states, respectively. In solution, the H → L electronic transition corresponds to λmax at 374 nm (exp. 380 nm). In the aggregated state, it was blue-shifted to 343 nm (exp. 345 nm). Fig. 6e presents the theoretical UV-vis spectra of 2 in the solution and aggregated states. Fig. 6f presents the electrostatic potential surface (EPS) of the aggregated form of 2. The active site differs from 1 and indicates the different aggregation pattern of 2. Thus, the presence of iodine in 2 has a definite role in the packing of the molecules during their aggregation, resulting in differences in the rheology and morphology between the gels of 2 and 1.
Effect of pH on gels and solutions
The effect of pH on the solution and gel states of compounds 1 and 2 was studied. The solutions and gels were prepared in DMF–H2O (2![[thin space (1/6-em)]](https://www.rsc.org/images/entities/char_2009.gif) :
:![[thin space (1/6-em)]](https://www.rsc.org/images/entities/char_2009.gif) 1, v/v; prepared using HEPES buffer, 10 mM) at different pH values (Fig. S5 and S6,† respectively). Importantly, stable gels were obtained in a wide range of pH 2.6 to pH 8. Above pH 8, the gels were gradually disrupted and became a clear solution at pH 13.8 for 2 although under this condition there was some sticky mass in 1. This dissimilar behaviour was assumed to be due to the different acidic characters of the compounds.
1, v/v; prepared using HEPES buffer, 10 mM) at different pH values (Fig. S5 and S6,† respectively). Importantly, stable gels were obtained in a wide range of pH 2.6 to pH 8. Above pH 8, the gels were gradually disrupted and became a clear solution at pH 13.8 for 2 although under this condition there was some sticky mass in 1. This dissimilar behaviour was assumed to be due to the different acidic characters of the compounds.
In solution, both 1 and 2 showed different behaviours with a change in pH. Compound 2 displayed color above pH 5, whereas compound 1 produced a light brown color at pH 5. This was due to the ionization of phenol to phenoxide at different pH. At basic pH, solutions of 1 and 2 became orange red due to the charge transfer from the phenoxide ion to the pyridine ring. UV-vis spectra were recorded for the solutions of 1 and 2 at different pH values. Although both compounds showed absorption below 350 nm at acidic pH, their absorption appeared above 350 nm at neutral and basic pH (Fig. S7†). Using the absorption data, the pKa values of 1 and 2 were determined to be 5.88 and 6.10, respectively (Fig. S8†).27 The pH study revealed that both compounds can be used for sensing in a wide pH range.
CN− recognition
Owing to the presence of phenolic –OH and imine groups in the compounds, we intended to investigate their anion-responsive behavior. It was thought that compounds 1 and 2 should interact with anions either through H-bonding or deprotonation, followed by H-bonding. The interaction may also occur through a nucleophilic addition to the imine bond. There was also interest in learning if there was anion binding dissimilarity for 2 due to the iodo group in its structure, which caused the microstructure and viscoelastic characteristics of its gel to differ from that of 1. Thus, the DMF–H2O (2![[thin space (1/6-em)]](https://www.rsc.org/images/entities/char_2009.gif) :
:![[thin space (1/6-em)]](https://www.rsc.org/images/entities/char_2009.gif) 1, v/v) gels of 1 and 2 were carefully explored for anion recognition.
1, v/v) gels of 1 and 2 were carefully explored for anion recognition.
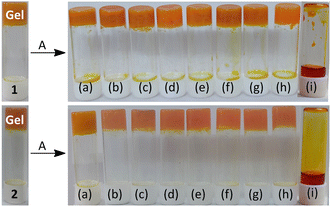
To test the anion-responsive behavior of the gels, either the gels were treated with anions or the formation of the gels was observed in the presence of anions. The gels of 1 and 2 showed different results in the presence of tetrabutylammonium salts of anions such as CN−, F−, AcO−, H2PO4−, Cl−, Br−, I−, NO3− and HSO4− (Fig. 7). Breaking of the gels to a sol only occurred in the presence of CN− ions presumably due to either deprotonation of the phenolic –OH or nucleophilic attack of CN− to imine bond in the structures. Other anions (F−, AcO−, H2PO4−, Cl−, Br−, I−, NO3− and HSO4−) were unable to cause a either color or phase change in the gels. In this case, CN− behaved differently from F− due to the presence of water in the gelling solvent, which hydrated F− more strongly than CN−. Thus, both gels were sensitive and selective to CN− among the different tested anions. To evaluate the sensitivity of the gels to CN−, it was found that the gels started to disintegrate upon the addition of 0.5 equiv. of CN− and became a clear solution in the presence of 1 equiv. of CN−.
However, to check the anion binding in solution, UV-vis and fluorescence titrations of 1 and 2 [c = 2.50 × 10⁻⁵ M] were performed in DMF–H2O (2![[thin space (1/6-em)]](https://www.rsc.org/images/entities/char_2009.gif) :
:![[thin space (1/6-em)]](https://www.rsc.org/images/entities/char_2009.gif) 1, v/v) with the above-mentioned anions (c = 1.0 × 10⁻³ M) (Fig. 8). In DMF–H2O (2
1, v/v) with the above-mentioned anions (c = 1.0 × 10⁻³ M) (Fig. 8). In DMF–H2O (2![[thin space (1/6-em)]](https://www.rsc.org/images/entities/char_2009.gif) :
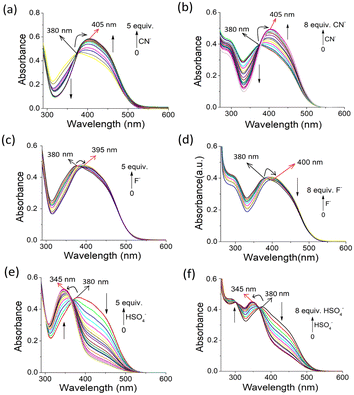
:![[thin space (1/6-em)]](https://www.rsc.org/images/entities/char_2009.gif) 1, v/v), anions such as CN−, F− and HSO4− resulted in noticeable changes in the UV-vis spectra. Other anions such as AcO−, Cl−, Br−, I−, H2PO4− and NO3− were non-interacting under identical conditions. In the spectrum of 1, the absorption band at 380 nm in DMF–H2O (2
1, v/v), anions such as CN−, F− and HSO4− resulted in noticeable changes in the UV-vis spectra. Other anions such as AcO−, Cl−, Br−, I−, H2PO4− and NO3− were non-interacting under identical conditions. In the spectrum of 1, the absorption band at 380 nm in DMF–H2O (2![[thin space (1/6-em)]](https://www.rsc.org/images/entities/char_2009.gif) :
:![[thin space (1/6-em)]](https://www.rsc.org/images/entities/char_2009.gif) 1, v/v) shifted to 405 nm with a gradual increase in intensity during titration with CN− ions, resulting in an isosbestic point at 380 nm (Fig. 8a). The spectral change was constant until the addition of 5 equiv. of CN− ions. A similar change was observed for 2 with CN− ions, where the increase in absorption intensity at 405 nm became saturated on the addition of 8 equiv. of CN− ions (Fig. 8b). The CN−-induced red shift in the absorption peak was due to the deprotonation of the phenolic –OH and subsequent delocalization of the charge on the oxygen atom to the pyridyl and coumarin moieties.
1, v/v) shifted to 405 nm with a gradual increase in intensity during titration with CN− ions, resulting in an isosbestic point at 380 nm (Fig. 8a). The spectral change was constant until the addition of 5 equiv. of CN− ions. A similar change was observed for 2 with CN− ions, where the increase in absorption intensity at 405 nm became saturated on the addition of 8 equiv. of CN− ions (Fig. 8b). The CN−-induced red shift in the absorption peak was due to the deprotonation of the phenolic –OH and subsequent delocalization of the charge on the oxygen atom to the pyridyl and coumarin moieties.
The highly basic F− anion acted weakly on compounds 1 and 2 due to its greater hydration than CN− in aqueous organic solvent (Fig. 8c and d), respectively. However, the HSO4− anion caused a greater change in the absorption spectra during titration. The absorption peak at 375–380 nm for both 1 and 2 shifted to a lower wavelength (345 nm) with an increase in intensity, leading to sharp isosbestic points. These changes in absorption spectra were distinct from other anions.
The interactions of 1 and 2 with CN−, F− and HSO4− were 1![[thin space (1/6-em)]](https://www.rsc.org/images/entities/char_2009.gif) :
:![[thin space (1/6-em)]](https://www.rsc.org/images/entities/char_2009.gif) 1, as confirmed by the Benesi–Hildebrand plots (Fig. S9†).28 The detection limits29 for CN−, F− and HSO4− were in the range of ∼10−4 M for both compounds 1 and 2, which are significant in anion sensing (Fig. S9†). In the case of CN−, the detection limits for 1 and 2 were estimated to be 1.23 × 10⁻⁴ M and 1.98 × 10⁻⁴ M, respectively.
1, as confirmed by the Benesi–Hildebrand plots (Fig. S9†).28 The detection limits29 for CN−, F− and HSO4− were in the range of ∼10−4 M for both compounds 1 and 2, which are significant in anion sensing (Fig. S9†). In the case of CN−, the detection limits for 1 and 2 were estimated to be 1.23 × 10⁻⁴ M and 1.98 × 10⁻⁴ M, respectively.
During their interaction, anion-induced deprotonation was confirmed upon the addition of water to the CN−– and F−-treated solutions of 1 and 2. The addition of water to the CN−– and F−-containing solutions of 1 and 2 caused different changes in their UV-vis spectra. Although in the presence of water the original absorption spectra of 1 and 2 were retrieved from F−-containing solutions with a small decrease in intensity, the CN−-containing solutions under similar conditions behaved differently. The CN−-induced red-shifted absorptions in 1 and 2 decreased considerably without showing their original absorption spectra (Fig. S10†). This different behaviour of CN− was assumed to be due to its participation in deprotonation as well as nucleophilic attack to the imine groups, followed by deprotonation of the phenolic –OH. In the case of HSO4−, the original spectra were not restored, which confirmed its different interactional mode from CN− and F− (Fig. S11†). HSO4− is believed to be involved in H-bonding complexation in the imino-phenol cleft either as HSO4− or SO42− via protonation of the pyridine ring. Fig. 9 represents the different modes of interaction of CN−, F− and HSO4− with compounds 1 and 2. In the fluorescence study, no distinguishable change in the emission spectra of 1 and 2 was observed upon the addition of the anions studied (Fig. S12†).
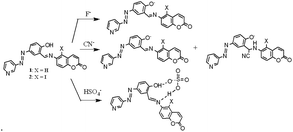 | ||
| Fig. 9 Different modes of interaction of F−, CN− and HSO4− (counter cation: tetrabutylammonium ion) with 1 and 2. | ||
The deprotonation, nucleophilic attack and H-bonding phenomena, as shown in Fig. 9, were finally understood from the 1H NMR study (Fig. S13, S14, S16, S17 and S18†). The signals for phenolic –OH in 1 and 2 were invisible in the presence of CN− ions due to their deprotonation. In addition, attack of CN− to the imine groups in 1 and 2 made the spectra complex to analyse. The appearance of a signal in the range of 5.27–5.86 ppm was ascribed to the CN− attack to the imine groups. The mass spectra of 1 and 2 in the presence of CN− revealed the characteristic peaks at m/z = 396.1163 and 522.0378 for (1 + CN−–H+) and for (2 + CN−–H+), respectively. These results confirmed the formation of CN−-adducts through nucleophilic attack of CN− to the imine bonds (Fig. S19†). The situation was different for the F− ion, where only deprotonation of the phenolic –OH, followed by hydrogen bonding at a low concentration of F− occurred, although the signal at ∼16–17 ppm for HF2− was not found due to significant broadening (Fig. S14†).30
Alternatively, the signals of phenolic –OH for 1 and 2 became broad in the presence of the HSO4− ion due to the H-bonding instead of deprotonation (Fig. S15 and S18†), respectively. The signal for the –OH proton in 2 showed a downfield chemical shift of 0.05 ppm upon interaction with HSO4− (Fig. S18†).
Cu2+ and Fe3+ ion recognition
The metal ion-responsive behaviour of the DMF–H2O (2![[thin space (1/6-em)]](https://www.rsc.org/images/entities/char_2009.gif) :
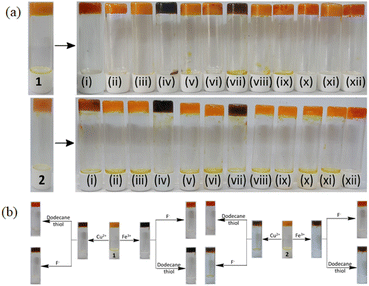
:![[thin space (1/6-em)]](https://www.rsc.org/images/entities/char_2009.gif) 1, v/v) gels of 1 and 2 (prepared at their MGC values) was examined on treatment with 1 equiv. of different metal ions (Fe2+ was used as a sulphate salt and other metal ions as perchlorate salts, c = 0.5 M). The gel states were intact in the presence of all the tested metal ions. After 10–15 min, the colour of the gels changed from orange yellow to blackish brown only in the presence of Fe3+ and Cu2+ ions. Other metal ions, under identical conditions, remained silent (Fig. 10a). In this case, the selective color change of the gels is thought to be caused by the charge delocalization from the phenolate oxygen to the pyridyl azo group of 1 and 2 following complexation with Cu2+ and Fe3+ at the imino-phenol moiety of the gelators. Interestingly, this gel-to-gel color transition started at different lower concentrations of Fe3+ and Cu2+ ions (Fig. S20†). This study indicates the sensitivity of the gels to Fe3+ and Cu2+ ions.
1, v/v) gels of 1 and 2 (prepared at their MGC values) was examined on treatment with 1 equiv. of different metal ions (Fe2+ was used as a sulphate salt and other metal ions as perchlorate salts, c = 0.5 M). The gel states were intact in the presence of all the tested metal ions. After 10–15 min, the colour of the gels changed from orange yellow to blackish brown only in the presence of Fe3+ and Cu2+ ions. Other metal ions, under identical conditions, remained silent (Fig. 10a). In this case, the selective color change of the gels is thought to be caused by the charge delocalization from the phenolate oxygen to the pyridyl azo group of 1 and 2 following complexation with Cu2+ and Fe3+ at the imino-phenol moiety of the gelators. Interestingly, this gel-to-gel color transition started at different lower concentrations of Fe3+ and Cu2+ ions (Fig. S20†). This study indicates the sensitivity of the gels to Fe3+ and Cu2+ ions.
However, the addition of TBAF to the Fe3+-induced gels of 1 and 2 resulted in the complete restoration of their colour (blackish brown to orange yellow). Similarly, on adding dodecanethiol to the Cu2+-induced gels of 1 and 2, the brown gels turned orange yellow. Thus, the use of different chelating species enabled us to discriminate Fe3+ from Cu2+ ions through the gel-to-gel colour change (Fig. 10b). To establish the selective interaction of Fe3+ ions over Fe2+ ions, we added Fe2+ ions to both gels of 1 and 2 and no distinct colour change was observed. When m-CPBA was added to the Fe2+-treated gels of 1 and 2, a blackish brown colour appeared in the same way as Fe3+ ions (Fig. S21 and S22†). However, the addition of m-CPBA to the gels of 1 and 2 did not show any colour change. This study was useful for the distinction of Fe2+ from Fe3+ ions.6e
UV-vis and fluorescence studies were performed to investigate the solution phase interactions of 1 and 2 with the above-mentioned metal ions. In this study, the metal ions were added gradually up to 20 equiv. to solutions of 1 and 2 in DMF–H2O (2![[thin space (1/6-em)]](https://www.rsc.org/images/entities/char_2009.gif) :
:![[thin space (1/6-em)]](https://www.rsc.org/images/entities/char_2009.gif) 1, v/v). Importantly, there were no significant and distinguishable changes in the absorption and emission spectra in DMF–H2O (2
1, v/v). Importantly, there were no significant and distinguishable changes in the absorption and emission spectra in DMF–H2O (2![[thin space (1/6-em)]](https://www.rsc.org/images/entities/char_2009.gif) :
:![[thin space (1/6-em)]](https://www.rsc.org/images/entities/char_2009.gif) 1, v/v) (Fig. S23 and S24†), respectively. In the fluorescence spectra, metal ions quenched the emission, and in the case of 1, its emission was quenched more by Fe3+ ions than the other metal ions. In comparison, this was not observed with compound 2. The Stern–Volmer plots31 in Fig. S25† clearly explain this. Thus, compounds 1 and 2 are suitable to recognize Cu2+ and Fe3+ ions in the gel state rather than in the solution phase. Although there was no selective recognition of metal ions in solution, we performed the Jobs plot32 analysis for Cu2+ and Fe3+ ions to understand their interactional properties with the gelators in the gel state. Both metal ions had 2
1, v/v) (Fig. S23 and S24†), respectively. In the fluorescence spectra, metal ions quenched the emission, and in the case of 1, its emission was quenched more by Fe3+ ions than the other metal ions. In comparison, this was not observed with compound 2. The Stern–Volmer plots31 in Fig. S25† clearly explain this. Thus, compounds 1 and 2 are suitable to recognize Cu2+ and Fe3+ ions in the gel state rather than in the solution phase. Although there was no selective recognition of metal ions in solution, we performed the Jobs plot32 analysis for Cu2+ and Fe3+ ions to understand their interactional properties with the gelators in the gel state. Both metal ions had 2![[thin space (1/6-em)]](https://www.rsc.org/images/entities/char_2009.gif) :
:![[thin space (1/6-em)]](https://www.rsc.org/images/entities/char_2009.gif) 1 (ligand
1 (ligand![[thin space (1/6-em)]](https://www.rsc.org/images/entities/char_2009.gif) :
:![[thin space (1/6-em)]](https://www.rsc.org/images/entities/char_2009.gif) metal ion) stoichiometric interactions with 1 and 2 (Fig. S26†). The binding constant33 values for Cu2+ (compound 1: K11 = 4.25 × 10³ M−1, K21 = 1.89 × 10⁴ M−1; compound 2: K11 = 7.12 × 10³ M−1, K21 = 1.38 × 10³ M−1) and Fe3+ (compound 1: K11 = 1.25 × 10⁵ M−1, K21 = 1.85 × 10⁵ M−1, compound 2: K11 = 3.55 × 10⁴ M−1, K21 = 1.69 × 10⁵ M−1) were observed to be considerable (Fig. S27†).
metal ion) stoichiometric interactions with 1 and 2 (Fig. S26†). The binding constant33 values for Cu2+ (compound 1: K11 = 4.25 × 10³ M−1, K21 = 1.89 × 10⁴ M−1; compound 2: K11 = 7.12 × 10³ M−1, K21 = 1.38 × 10³ M−1) and Fe3+ (compound 1: K11 = 1.25 × 10⁵ M−1, K21 = 1.85 × 10⁵ M−1, compound 2: K11 = 3.55 × 10⁴ M−1, K21 = 1.69 × 10⁵ M−1) were observed to be considerable (Fig. S27†).
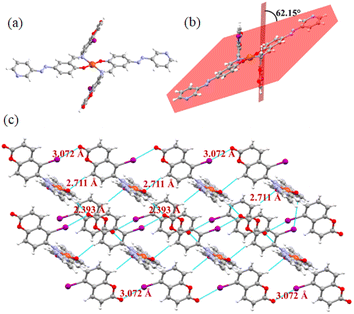
However, to acquire a better understanding of the interactions of the compounds with Cu2+ and Fe3+, we attempted to crystallize compounds 1 and 2 in their presence. We were only successful in isolating crystals of 2 with Cu2+. The single-crystal X-ray analysis revealed that it was crystallized in the triclinic P![[1 with combining macron]](https://www.rsc.org/images/entities/char_0031_0304.gif) space group (Table S3†). Its asymmetric unit contains one copper atom encircled by two molecules involving phenolic –OH and imine nitrogen as the coordinating centres (Fig. 11a). Two coumarins in its crystal are anti-periplanar, showing a dihedral angle of 62.15° with the azo unit (Fig. 11b). In the crystal packing, hydrogen and halogen bonds play important roles. Molecules are connected to each other through these two weak interactions, forming a supramolecular network (Fig. 11c). Despite the presence of a pyridine ring, the halogen bonding involving the pyridine ring nitrogen is absent in the network. The iodine atom is bonded to coumarin via the ester oxygen, showing a distance of 3.07 Å. In addition to this halogen bond, C–H, para to the C–I bond of the coumarin unit of one molecule is selectively involved in H-bonding with the phenol oxygen of other molecule to form the assembly.
space group (Table S3†). Its asymmetric unit contains one copper atom encircled by two molecules involving phenolic –OH and imine nitrogen as the coordinating centres (Fig. 11a). Two coumarins in its crystal are anti-periplanar, showing a dihedral angle of 62.15° with the azo unit (Fig. 11b). In the crystal packing, hydrogen and halogen bonds play important roles. Molecules are connected to each other through these two weak interactions, forming a supramolecular network (Fig. 11c). Despite the presence of a pyridine ring, the halogen bonding involving the pyridine ring nitrogen is absent in the network. The iodine atom is bonded to coumarin via the ester oxygen, showing a distance of 3.07 Å. In addition to this halogen bond, C–H, para to the C–I bond of the coumarin unit of one molecule is selectively involved in H-bonding with the phenol oxygen of other molecule to form the assembly.
To understand the intermolecular interactions and the role of halogen bonding, Hirshfeld surface (HS) analysis was carried out on the Cu2+ complex of 2.34 This was done using one molecular unit. The computed Hirshfeld surfaces (dnorm, shape index, curvedness, and fragment patch) (Fig. S28†) and the fingerprint plots (Fig. S29†) reveal the quantitative and qualitative contributions of the non-covalent interactions present in the crystal system. The red, blue, and white colors in dnorm indicate whether an interatomic distance is shorter, longer, or equal to a van der Waals separation, respectively. Molecular sculpting can be further illuminated chemically useful the curvature parameters such as shape-index and curvedness. The dark-blue boundaries in the shape index (Fig. S28†) emphasize the high degree of curvature and demonstrate the flatness of the surface with “bumps and hollows”, which belong to blue and red, respectively. The curvedness usually indicates large, flat green regions with dark-blue edges surrounding them. The dnorm mapped surface is shown in Fig. S28† with the red patches near the oxygen atoms, indicating the presence of O⋯H/H⋯O interactions. The O⋯H contact between the C–H hydrogen of the aldehyde and carbonyl oxygen atoms is supported by the 2D fingerprint plot (Fig. S29d†) as the major interaction (15.2%). Additionally, the O⋯H/H⋯O hydrogen bonding interactions show a sharp spike at (di = 1.30 Å, de = 0.90 Å) and (di = 0.90 Å, de = 1.30 Å). Also, the red patches near the iodine atom indicate the I⋯O/O⋯I interactions. The I⋯O interaction (3%) was also supported by the 2D fingerprint plot in Fig. S29f† with a sharp spike at (di = 1.80 Å, de = 1.30 Å) and (di = 1.30 Å, de = 1.80 Å). The additional contribution to the HS comes from the C⋯H (22.4%), N⋯H (13.4%) and I⋯H (5.3%) interactions.
CO2 detection
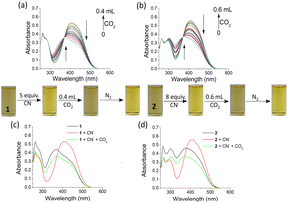
In another study, we used the anion-ensembles of 1 and 2 to sense CO2. In this case, both compounds 1 and 2 were initially treated with the anions, and then CO2 was bubbled in these solutions. The changes were monitored by UV-vis. The absorption band at 405 nm decreased with the appearance of a peak at 375 nm when CO2 was bubbled in solutions of 1 and 2 [c = 2.50 × 10⁻⁵ M] in DMF–H2O (2![[thin space (1/6-em)]](https://www.rsc.org/images/entities/char_2009.gif) :
:![[thin space (1/6-em)]](https://www.rsc.org/images/entities/char_2009.gif) 1, v/v) containing 5 equiv. and 8 equiv. of CN− (used as tetrabutylammonium salt; c = 1.0 × 10⁻³ M), respectively (Fig. S27†). During the interaction, the faint yellow solutions of 1 and 2, which became slightly deep in the presence of CN−, turned into again light yellow on CO2 bubbling. However, when CO2 was removed from these solutions through the bubbling of N2, the solutions became deep yellow in colour. This bubbling of CO2 followed by parching of N2 gas was continued 5 times, which confirmed the reversibility of the interaction of the CN− ensembles of 1 and 2 with CO2 (Fig. 12).
1, v/v) containing 5 equiv. and 8 equiv. of CN− (used as tetrabutylammonium salt; c = 1.0 × 10⁻³ M), respectively (Fig. S27†). During the interaction, the faint yellow solutions of 1 and 2, which became slightly deep in the presence of CN−, turned into again light yellow on CO2 bubbling. However, when CO2 was removed from these solutions through the bubbling of N2, the solutions became deep yellow in colour. This bubbling of CO2 followed by parching of N2 gas was continued 5 times, which confirmed the reversibility of the interaction of the CN− ensembles of 1 and 2 with CO2 (Fig. 12).
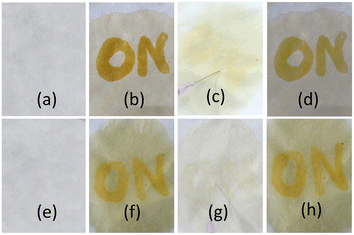
The CN−-induced deprotonated forms of 1 and 2 that coexist with CN−-adducts were reprotonated by HCO3−, formed from the reaction of CO2 with trace level of water and showed a color change (Scheme 2). This is in accordance with the previous observations.23 We successfully developed a paper test-kit for the practical detection of CO2 (Fig. 13). In this method, a letter was written on a paper using a CN− solution, prepared in DMF. Then, it was treated with solutions of 1 and 2 in DMF. The invisible letter became visible, whereas it vanished when CO2 was blown on it. The letter reappeared on keeping the paper strip under N2 flash. This reversible process was repeated several times, indicating the chemical stability of this paper strip under the stimuli of CN− ions, CO2 and N2.
Conclusions
In summary, we synthesized 6-aminocoumarin-based Schiff bases 1 and 2, which formed stable thermo-reversible gels in different organic-aqueous mixture solvents. The gels exhibited good elastic properties. The rheological study revealed that the DMF–H2O (2![[thin space (1/6-em)]](https://www.rsc.org/images/entities/char_2009.gif) :
:![[thin space (1/6-em)]](https://www.rsc.org/images/entities/char_2009.gif) 1, v/v) gel of 2 (iodo-analogue) had a higher resistance value against external forces compared to the gel of 1 (non-iodo analogue). Iodo-analogue 2 showed a cross-linked helical morphology, whereas non-iodo compound 1 showed a long chain fibrous morphology. The gels were stable in a wide pH range (2.6–8). Above pH 8, the gel of 2 started to disintegrate and became a clear solution at pH 13.8, whereas under this condition there was some sticky mass in 1. This difference in 2 from 1 is due to the halogen bonding role of iodine, which was understood from theoretical study. This subtle effect of iodine in aggregation to afford a mechanically strong gel is unknown in 6-aminocoumarin-based structures. Concerning the iodo-effect on the aggregation, only few examples having iodine-containing triazoles are known in the literature.35a,b In the majority of cases, the halogen bonding effect in supramolecular gel formation focused on multi-component systems, where one of them is iodoperfluoroarene.35c
1, v/v) gel of 2 (iodo-analogue) had a higher resistance value against external forces compared to the gel of 1 (non-iodo analogue). Iodo-analogue 2 showed a cross-linked helical morphology, whereas non-iodo compound 1 showed a long chain fibrous morphology. The gels were stable in a wide pH range (2.6–8). Above pH 8, the gel of 2 started to disintegrate and became a clear solution at pH 13.8, whereas under this condition there was some sticky mass in 1. This difference in 2 from 1 is due to the halogen bonding role of iodine, which was understood from theoretical study. This subtle effect of iodine in aggregation to afford a mechanically strong gel is unknown in 6-aminocoumarin-based structures. Concerning the iodo-effect on the aggregation, only few examples having iodine-containing triazoles are known in the literature.35a,b In the majority of cases, the halogen bonding effect in supramolecular gel formation focused on multi-component systems, where one of them is iodoperfluoroarene.35c
To demonstrate their application, gels of 1 and 2, prepared in DMF–H2O (2![[thin space (1/6-em)]](https://www.rsc.org/images/entities/char_2009.gif) :
:![[thin space (1/6-em)]](https://www.rsc.org/images/entities/char_2009.gif) 1, v/v), were anion-responsive, showing a gel-to-sol phase change selectively in the presence of CN−. Compared to the gel state, there was no anion-binding selectivity in solution, although HSO4− showed different UV-vis spectral features compared to F− and CN−. The considerable changes in the absorption spectra of both compounds in the presence of CN− are notable for its distinction from F−.
1, v/v), were anion-responsive, showing a gel-to-sol phase change selectively in the presence of CN−. Compared to the gel state, there was no anion-binding selectivity in solution, although HSO4− showed different UV-vis spectral features compared to F− and CN−. The considerable changes in the absorption spectra of both compounds in the presence of CN− are notable for its distinction from F−.
Besides anion-responsiveness, the gels of 1 and 2 recognized Cu2+ and Fe3+ ions by showing a gel-to-gel colour change, although no distinguishable feature of metal ion recognition was observed in solution. The crystal structure analysis of the copper complex of 2 revealed the impressive binding of Cu2+ and aggregation of the complex involving H-bonding and halogen bonds. For the wide application of 1 and 2, anion-activated solutions of 1 and 2 were explored for the naked-eye detection of CO2. In this context, a test-kit for CO2 sensing was developed. Thus, 6-aminocoumarin-based compounds 1 and 2 serve as excellent gelators, enabling the recognition of CN−, Cu2+ and Fe3+ ions in the gel state and CO2 sensing with good efficiency in solution.
Experimental
Materials and methods
All chemicals and reagents were purchased from Spectrochem, India. The tetrabutylammonium (TBA) salts of the anions were purchased from Sigma-Aldrich. The solvents used in the synthesis were purified, dried and distilled before use. 1H and 13C NMR spectra were recorded using a Bruker 400 MHz instrument. FTIR measurements of the compounds were carried out using a Perkin-Elmer L120-00A spectrometer (νmax in cm−1). Scanning electron microscopy (SEM) images were obtained on an EVO LS-10 ZEISS instrument. Fluorescence and UV-vis studies were performed using a Horiba Fluoromax 4C spectrofluorimeter and Shimadzu UV-2450 spectrophotometer, respectively. Rheological studies were carried out with a Malvern, KINEXUS Pro+ instrument using a parallel plate (8 mm).Synthesis
Compounds 3![[thin space (1/6-em)]](https://www.rsc.org/images/entities/char_2009.gif) 36 and 4
36 and 4![[thin space (1/6-em)]](https://www.rsc.org/images/entities/char_2009.gif) 37 were prepared according to the reported procedures. Pyridyl-azo salicylaldehyde 5 was prepared by us, as reported earlier.38
37 were prepared according to the reported procedures. Pyridyl-azo salicylaldehyde 5 was prepared by us, as reported earlier.38
General procedure for gelation test and SEM imaging
An adequate amount of compounds 1 and 2 was dissolved in the desired solvent (1 mL) by warming, and then a co-solvent was added and cooled to room temperature to form a gel. The gel was primarily confirmed by a vial inversion test. The gel-to-sol transition temperature (Tg) for both 1 and 2 was measured by the dropping ball method. The gel samples for SEM imaging were dried under vacuum, and then coated with a thin layer of gold metal.The anion interaction of the gels was examined either by adding the required amount of anions to the top of the gels or the gels were prepared in the presence of the anions.
Firstly, to confirm the interaction of anions with the gel state, DMF–H2O (2![[thin space (1/6-em)]](https://www.rsc.org/images/entities/char_2009.gif) :
:![[thin space (1/6-em)]](https://www.rsc.org/images/entities/char_2009.gif) 1, v/v) gels of 1 and 2 were prepared at their minimum gelation concentrations. Then, the gels were treated with 1 equivalent of different anions such as CN−, F−, AcO−, H2PO4−, HSO4−, NO3−, Cl−, Br−, and I− [all were used as tetrabutylammonium (TBA) salt]. Alternatively, compounds 1 (5 mg) and 2 (6 mg) were dissolved in DMF (0.66 mL), followed by the addition of 0.34 mL of water containing 1 equivalent of different anions with respect to gelators 1 (c = 1.35 × 10⁻² M) and 2 (c = 1.20 × 10⁻² M). In both cases, the gel was not observed in the CN−-containing vial. Either the gel was disintegrated or not formed on contact with CN−.
1, v/v) gels of 1 and 2 were prepared at their minimum gelation concentrations. Then, the gels were treated with 1 equivalent of different anions such as CN−, F−, AcO−, H2PO4−, HSO4−, NO3−, Cl−, Br−, and I− [all were used as tetrabutylammonium (TBA) salt]. Alternatively, compounds 1 (5 mg) and 2 (6 mg) were dissolved in DMF (0.66 mL), followed by the addition of 0.34 mL of water containing 1 equivalent of different anions with respect to gelators 1 (c = 1.35 × 10⁻² M) and 2 (c = 1.20 × 10⁻² M). In both cases, the gel was not observed in the CN−-containing vial. Either the gel was disintegrated or not formed on contact with CN−.
General procedures for UV-vis and fluorescence titrations
Stock solutions of compounds 1 and 2 were prepared in DMF–H2O (2![[thin space (1/6-em)]](https://www.rsc.org/images/entities/char_2009.gif) :
:![[thin space (1/6-em)]](https://www.rsc.org/images/entities/char_2009.gif) 1, v/v) at the concentration of 2.5 × 10⁻⁵ M. Stock solutions of tetrabutylammonium salts of anions and perchlorate salts of metal ions were prepared in the same solvents at the concentration of 1 × 10⁻³ M. In the experiments, 2 mL of the stock solution of compound was added to a cuvette, and to this solution different anions/metal ions were added individually. Upon the addition of the anions/metal ions, absorption spectra were recorded at room temperature. The same stock solutions were used to perform the fluorescence titration experiments.
1, v/v) at the concentration of 2.5 × 10⁻⁵ M. Stock solutions of tetrabutylammonium salts of anions and perchlorate salts of metal ions were prepared in the same solvents at the concentration of 1 × 10⁻³ M. In the experiments, 2 mL of the stock solution of compound was added to a cuvette, and to this solution different anions/metal ions were added individually. Upon the addition of the anions/metal ions, absorption spectra were recorded at room temperature. The same stock solutions were used to perform the fluorescence titration experiments.
Calculation of detection limit29
The detection limit was calculated using the UV-vis titration data. The absorbance of the compound was measured 5 times, and the standard deviation of the blank measurement was achieved. To obtain the slope, the absorption intensities were plotted with the concentration of anion. The detection limit was calculated using the equation: detection limit = 3σ/k, where σ is the standard deviation of the blank measurement and k is the slope.pKa determination27
The pKa values were determined according to the following equation: pKa = pH + log[(AHB+ − Ax)/(Ax − AB)], where AHB+, Ax and AB represent the absorbance of the absolute acid and base forms, respectively, at the pH chosen. The pH values were recorded using a pH meter. The pKa values were derived from non-linear curve fitting of these data (Origin 6.1).Single-crystal preparation and X-ray diffraction studies
The single crystal of the Cu-complex of 2 was obtained from a CHCl3-petroleum ether (4![[thin space (1/6-em)]](https://www.rsc.org/images/entities/char_2009.gif) :
:![[thin space (1/6-em)]](https://www.rsc.org/images/entities/char_2009.gif) 1, v/v) mixed solvent. To a solution of compound 2 (20 mg, 0.04 mmol) in 10 mL of CHCl3–CH3OH (95
1, v/v) mixed solvent. To a solution of compound 2 (20 mg, 0.04 mmol) in 10 mL of CHCl3–CH3OH (95![[thin space (1/6-em)]](https://www.rsc.org/images/entities/char_2009.gif) :
:![[thin space (1/6-em)]](https://www.rsc.org/images/entities/char_2009.gif) 5 v/v), Cu(ClO4)2 (15 mg, 0.04 mmol) was added. The resulting mixture was stirred for 3 h at room temperature. The precipitate obtained was filtered and dissolved in CHCl3. Then, 2 mL of the resulting solution was added to a narrow-necked glass vial and 500 μL of petroleum ether was added to it. The vial was kept undisturbed. After 10 days, brown crystals were obtained and isolated for data collection.
5 v/v), Cu(ClO4)2 (15 mg, 0.04 mmol) was added. The resulting mixture was stirred for 3 h at room temperature. The precipitate obtained was filtered and dissolved in CHCl3. Then, 2 mL of the resulting solution was added to a narrow-necked glass vial and 500 μL of petroleum ether was added to it. The vial was kept undisturbed. After 10 days, brown crystals were obtained and isolated for data collection.
Crystal data were collected on a Bruker D8 Quest diffractometer configured with a PHOTON 100 detector device, equipped with Mo-Kα (λ = 0.71069) radiation. The data integration and oblique incidence correction were done using the APEX4 software.39 Lorentz and polarization effects were considered for data correction, and empirical absorption corrections were applied using SADABS40 from Bruker. Data collection and data reduction were done using the Bruker Smart Apex and Bruker Saint packages.39 The structure solution was done by direct methods using the SIR-97 (ref. 41) program and refinement was performed by the full-matrix least-squares methods on F2 with SHELX42,43 and Olex 2.44 The difference Fourier map was used to locate the hydrogen atoms. Hydrogen atoms of the complexes were included in idealized positions and refined as riding models. All figures were drawn using the Mercury software.45 The crystallographic data including data collection and structure refinement parameters for the Cu-complex of 2 are given in Table S3† [CCDC number 2361386].
Hirshfeld surface (HS) analysis
The various non-covalent interactions within a crystal system are visually represented and quantified through Hirshfeld surface analysis. The Hirshfeld surface (HS), constructed from the electron distribution analysis around a molecule, visualizes the intermolecular interactions in molecular crystals. The two-dimensional (2D) fingerprint plots are obtained from the HS analysis which identify each type of intermolecular interaction within supramolecular and coordination compounds. The Hirshfeld surfaces and their corresponding 2D fingerprint plots were calculated over the constituent ionic and molecular geometries using the CRYSTAL EXPLORER 17.5 software package.34 The properties such as normalized contact distance, shape index, curvedness, and fragment patch were mapped over the Hirshfeld surface and plotted with the appropriate color scale. The 2D fingerprint plots were presented as de vs. di.Theoretical study
The geometry optimization of compounds 1 and 2 was performed using the Gaussian 09 package26 based on DFT (density functional theory). The B3LYP hybrid functional46 with the 6-31G(d) localized basis function for non-metal (C, N, O, and H) and LANL2DZ basis set with effective core potential was used for iodine. The aggregation processes of 1 and 2 were calculated employing the B3LYP-D3![[thin space (1/6-em)]](https://www.rsc.org/images/entities/char_2009.gif) 47 functional. To understand the explicit solvent effects, water molecules were added to the solution and aggregated forms. To confirm the energy minima of the optimized geometries, frequency calculations were performed. With the optimized geometries, time-dependent density functional theory (TD-DFT) was carried out using the 30 lowest singlet excitations.
47 functional. To understand the explicit solvent effects, water molecules were added to the solution and aggregated forms. To confirm the energy minima of the optimized geometries, frequency calculations were performed. With the optimized geometries, time-dependent density functional theory (TD-DFT) was carried out using the 30 lowest singlet excitations.
Data availability
The data supporting this article have been included as part of the ESI.† Crystallographic data for the Cu2+-complex of compound 2 have been deposited at the CCDC under the number 2361386.Conflicts of interest
There are no conflicts to declare.Acknowledgements
EP thanks UGC, India for providing fellowship. KG thanks SERB, New Delhi, India for financial support [CRG/2021/005928/OC Dated 20.12.2021] in the laboratory. We also thank DST, New Delhi for providing facilities under FIST program (Level-II, SR/FST/CS-II/2019/96).References
- (a) Y. Wang, J. Xiong, F. Peng, Q. Li and M.-H. Zeng, Colloids Surf., A, 2022, 640, 128445 CrossRef CAS; (b) C. Y. Bao, R. Lu, M. Jin, P. C. Xue, C. H. Tan, Y. Y. Zhao and G. F. Liu, Carbohydr. Res., 2004, 339, 1311 CrossRef CAS; (c) I. A. Duceac and S. Coseri, Gels, 2022, 8, 779 CrossRef CAS; (d) S. Ghosh, N. Baildya and K. Ghosh, RSC Sustainability, 2023, 1, 914 RSC.
- (a) M. Xue, Y. Lu, Q. Sun, K. Liu, Z. Liu and P. Sun, Cryst. Growth Des., 2015, 15, 5360 CrossRef CAS; (b) J. Zhang and C.-Y. Su, Coord. Chem. Rev., 2013, 257, 1373 CrossRef CAS.
- (a) H. Qian and I. Aprahamian, Chem. Commun., 2015, 51, 11158 RSC; (b) H. Wu, B. B. Ni, C. Wang, F. Zhai and Y. Ma, Soft Matter, 2012, 8, 5486 RSC.
- (a) J. Xie, C. Chen, X. Ma and J. Wu, Inorg. Chem. Commun., 2016, 65, 41 CrossRef CAS; (b) A. Panja and K. Ghosh, New J. Chem., 2019, 43, 5139 RSC.
- (a) W. Chen, W. Gong, J. Ye, Y. Lin and G. Ning, RSC Adv., 2012, 2, 809 RSC; (b) C. Pati and K. Ghosh, New J. Chem., 2019, 43, 2718 RSC.
- (a) J. Sun, Y. Liu, L. Jin, T. Chen and B. Yin, Chem. Commun., 2016, 52, 768 RSC; (b) X. Cao, A. Gao, J.-T. Hou and T. Yi, Coord. Chem. Rev., 2021, 434, 213792 CrossRef CAS; (c) X. Cao, Y. Li, A. Gao, Y. Yu, Q. Zhou, X. Chang and X. Hei, J. Mater. Chem. C, 2019, 7, 10589 RSC; (d) X. Cao, Y. Li, Y. Yu, S. Fu, A. Gao and X. Chang, Nanoscale, 2019, 11, 10911 RSC; (e) A. Panja and K. Ghosh, Mater. Chem. Front., 2018, 2, 2286 RSC.
- K. Hawkins, A. K. Patterson, P. A. Clarke and D. K. Smith, J. Am. Chem. Soc., 2020, 142, 4379 CrossRef CAS.
- P. Xue, R. Lu, G. Chen, Y. Zhang, H. Nomoto, M. Takafuji and H. Ihara, Chem.–Eur. J., 2007, 13, 8231 CrossRef CAS.
- (a) M. O. Piepenbrock, G. O. Lloyd, N. Clarke and J. W. Steed, Chem. Rev., 2010, 110, 1960 CrossRef CAS; (b) N. M. Sangeetha and U. Maitra, Chem. Soc. Rev., 2005, 34, 821 RSC; (c) M. D. Segarra-Maset, V. J. Nebot, J. F. Miravet and B. Escuder, Chem. Soc. Rev., 2013, 42, 7086 RSC; (d) D. K. Smith, Chem. Soc. Rev., 2009, 38, 684 RSC; (e) L. Zhang, L. Qin, X. Wang, H. Cao and M. Liu, Adv. Mater., 2014, 26, 6959 CrossRef CAS.
- (a) J. Y. C. Lim and P. D. Beer, Chem, 2018, 4, 731 CrossRef CAS; (b) T. Bunchuay, A. Docker, A. J. Martinez-Martinez and P. D. Beer, Angew. Chem., Int. Ed., 2019, 58, 13823 CrossRef CAS; (c) A. Docker, X. Shang, D. Yuan, H. Kuhn, Z. Zhang, J. J. Davis, P. D. Beer and M. J. Langton, Angew. Chem., Int. Ed., 2021, 60, 19442 CrossRef CAS; (d) S. C. Patrick, R. Hein, A. Docker, P. D. Beer and J. J. Davis, Chem.–Eur. J., 2021, 27, 10201 CrossRef CAS.
- (a) Y. J. Wang, X. N. Zhang, Y. Song, Y. Zhao, L. Chen, F. Su, L. Li, Z. L. Wu and Q. Zheng, Chem. Mater., 2019, 31, 1430 CrossRef CAS; (b) S. Chen, K. Zhang, Z. Li, Y. Wu, B. Zhu and J. Zhu, Supramolecular Materials, 2023, 2, 100032 CrossRef; (c) L. Lu, W. Zhou, Z. Chen, Y. Hu, Y. Yang, G. Zhang and Z. Yang, Gels, 2022, 8, 244 CrossRef CAS; (d) S. Bera, S. Basu, B. Jana and P. Dastidar, Angew. Chem., 2023, 62, e202216447 CrossRef CAS.
- (a) Y. C. Tse, A. Docker, Z. Zhang and P. D. Beer, Chem. Commun., 2021, 57, 4950 RSC; (b) M. Kaasik, S. Kaabel, K. Kriis, I. Jarving and T. Kanger, Synthesis, 2019, 51, 2128 CrossRef CAS; (c) A. Docker, C. H. Guthrie, H. Kuhn and P. D. Beer, Angew. Chem., Int. Ed., 2021, 60, 21973 CrossRef CAS; (d) L. E. Bickerton, A. Docker, A. J. Sterling, H. Kuhn, F. Duarte, P. D. Beer and M. J. Langton, Chem.–Eur. J., 2021, 27, 11738 CrossRef CAS.
- (a) Y.-S. Yang, C. Liang, C. Yang, Y.-P. Zhang, B.-X. Wang and J. Liu, Spectrochim. Acta, Part A, 2020, 237, 118391 CrossRef CAS; (b) Y. Wang, X. Hao, L. Liang, L. Gao, X. Ren, Y. Wu and H. Zhao, RSC Adv., 2020, 10, 6109 RSC.
- (a) N. Nuñez-Dallos, C. Cuadrado, J. Hurtado, E. Nagles and O. García-Beltran, Int. J. Electrochem. Sci., 2016, 11, 9855 CrossRef; (b) I. Ketata, L. Mechi, T. Ben Ayed, M. Dusek, V. Petricek and R. Hassen, Open J. Inorg. Chem., 2012, 2, 33 CrossRef; (c) L. Yan, X. Li and J. Li, ChemistrySelect, 2018, 3, 10157 CrossRef CAS; (d) Y. Wang, X. Hao, L. Liang, L. Gao, X. Ren, Y. Wu and H. Zhao, RSC Adv., 2020, 10, 6109 RSC; (e) H. Q. Li, X. Q. Sun, T. Zheng, Z. X. Xu, Y. X. Song and X. H. Gu, Sens. Actuators, B, 2019, 279, 400 CrossRef CAS; (f) Y. Wang, Q. T. Meng, Q. Han, G. J. He, Y. Y. Hu, H. Feng, H. M. Jia, R. Zhang and Z. Q. Zhang, New J. Chem., 2018, 42, 15839 RSC; (g) A. Pandey, S. K. Asthana, A. Prakash, J. K. Roy, I. Tiwaria and K. K. Upadhyay, Dalton Trans., 2019, 48, 2068 RSC; (h) A. Mondal, S. Nag and P. Banerjee, Dalton Trans., 2021, 50, 429 RSC; (i) F. Fu, X. Zhang, S. Zhou, W. Shi, J. Li, J. Yu, Y. Rao, L. Wu and J. Cao, New J. Chem., 2022, 46, 5034 RSC.
- M. K. Paul, Y. D. Singh, A. Dey, S. K. Saha, S. Anwar and A. P. Chattopadhyay, Liq. Cryst., 2016, 43, 343 CAS.
- (a) R. Koenig, Science, 2000, 287, 1737 CrossRef CAS; (b) C. Young, L. Tidwell and C. Anderson, Minerals, Metals, and Materials Society: Warrendale, 2001 Search PubMed; (c) WHO 2003, Cyanogen Chloride in Drinking-Water, Background document for preparation of WHO Guidelines for drinking-water quality, World Health Organization, Geneva, WHO/SDE/WSH/03.04/51 Search PubMed.
- S. Panja, A. Panja and K. Ghosh, Mater. Chem. Front., 2021, 5, 584 RSC and references cited therein..
- (a) J. F. Chen, Q. Lin, H. Yao, Y. M. Zhang and T. B. Wei, Mater. Chem. Front., 2018, 2, 999 RSC; (b) M. Suresh, D. Amilan Jose and A. Das, Org. Lett., 2007, 9, 441 CrossRef CAS; (c) P. Mahato, S. Saha, P. Das, H. Agarwalla and A. Das, RSC Adv., 2014, 4, 36140 RSC.
- K. Młyniec, M. Gaweł, U. Doboszewska, G. Starowicz and G. Nowak, Vitam. Horm., 2017, 103, 295 CrossRef.
- (a) R. R. Crichton, D. T. Dexter and R. J. Ward, Coord. Chem. Rev., 2008, 252, 1189 CrossRef CAS; (b) D. Touati, Arch. Biochem. Biophys., 2000, 373, 1 CrossRef CAS; (c) E. Beutler, V. Felitti, T. Gelbart and N. Ho, Drug Metab. Dispos., 2001, 29, 495 CAS.
- P. C. Bull, G. R. Thomas, J. M. Rommens, J. R. Forbes and D. W. Cox, Nat.Genet., 1993, 5, 327 CrossRef CAS.
- (a) C. Quéré, R. Andrew, P. Friedlingstein, S. Sitch, J. Hauck, J. Pongratz, P. Pickers, J. I. Korsbakken, G. Peters, J. Canadell and A. Arneth, Earth Syst. Sci. Data, 2018, 10, 2141 CrossRef; (b) X. Zhou, S. Lee, Z. Xu and J. Yoon, Chem. Rev., 2015, 115, 7944 CrossRef CAS; (c) P. Puligundla, J. Jung and S. Ko, Food Control, 2012, 25, 328 CrossRef CAS.
- (a) M. Lee, S. Jo, D. Lee, Z. Xu and J. Yoon, Dyes Pigm., 2015, 120, 288 CrossRef CAS; (b) X. Zhang, Y. Song, M. Liu, H. Li, H. Sun, M. Sun and H. Yu, Dyes Pigm., 2019, 160, 799 CrossRef CAS; (c) X. Zhang, H. Mu, H. Li, Y. Zhang, M. An, X. Zhang, J. Yoon and H. Yu, Sens. Actuators, B, 2018, 255, 2764 CrossRef CAS; (d) X. Zhang, H. Li, H. Mu, Y. Liu, Y. Guan, J. Yoon and H. Yu, Dyes Pigm., 2017, 147, 40 CrossRef CAS; (e) C. Pati, R. Raza and K. Ghosh, Spectrochim. Acta, Part A, 2020, 229, 117910 CrossRef CAS; (f) T. Gunnlaugsson, P. E. Kruger, P. Jensen, F. M Pfeffer and G. M. Hussey, Tetrahedron Lett., 2003, 44, 8909e13 Search PubMed; (g) Z. Guo, N. R. Song, J. H. Moon, M. Kim, E. J. Jun, J. Choi, J. Y. Lee, C. W. Bielawski, J. L. Sessler and J. Yoon, J. Am. Chem. Soc., 2012, 134, 17846e9 Search PubMed; (h) R. Raza, A. Panja, N. Baildya and K. Ghosh, New J. Chem., 2023, 47, 11515 RSC.
- A. Sarbu, L. Biniek, J.-M. Guenet, P. J. Mésini and M. Brinkmann, J. Mater. Chem. C, 2015, 3, 1235 RSC.
- Y. Huang, J. Xing, Q. Gong, L. C. Chen, G. Liu, C. Yao, Z. Wang, H. L. Zhang, Z. Chen and Q. Zhang, Nat. Commun., 2019, 10, 1 CrossRef.
- M. J. Frisch, G. Trucks, H. B. Schlegel, G. Scuseria, M. Robb, J. Cheeseman, G. Scalmani, V. Barone, B. Mennucci and G. Petersson, Gaussian 09, Revision D. 1, Gaussian Inc., Wallingford CT, 2009, vol. 27, pp. 34 Search PubMed.
- C. Pati, R. Raza and K. Ghosh, Spectrochim. Acta, Part A, 2020, 229, 117910 CrossRef CAS.
- P. T. Chou, G. R. Wu, C. Y. Wei, C. C. Cheng, C. P. Chang and F. T. Hung, J. Phys. Chem. B, 2000, 104, 7818 CrossRef CAS.
- B. Zhu, X. Zhang, Y. Li, P. Wang, H. Zhang and X. Zhuang, Chem. Commun., 2010, 46, 5710 RSC.
- X. Chen, Y.-C. Liu, J. Bai, H. Fang, F.-Y. Wu and Q. Xiao, Dyes Pigm., 2021, 190, 109347 CrossRef CAS.
- J. R. Lakowicz, Principles of Fluorescence Spectroscopy, Springer, New York, 3rd edn, 2006 Search PubMed.
- P. Job, Ann. Chim., 1928, 9, 113 CAS.
- Binding constant was determined using BindFit v5.0, available from https://app.supramolecular.org/bindfit/. 2023.
- (a) M. A. Spackman and D. Jayatilaka, CrystEngComm, 2009, 11, 19 RSC; (b) M. A. Spackman and J. J. McKinnon, CrystEngComm, 2002, 4, 378 RSC.
- (a) Y. Huang, Y. Zhang, Y. Yuan and W. Cao, Tetrahedron, 2015, 71, 2124 CrossRef CAS; (b) Y. Huang, S. Liu, Z. Xie, Z. Sun, W. Chai and W. Jiang, Front. Chem. Sci. Eng., 2018, 12, 252 CrossRef CAS; (c) J. Zheng, A. Suwardi, C. J. E. Wong, X. J. Loh and Z. Li, Nanoscale Adv., 2021, 3, 6342 RSC.
- S. Roy, T. K. Mondal, P. Mitra, E. L. Torres and C. R. Sinha, Polyhedron, 2011, 30, 913 CrossRef CAS.
- N. C. Ganguly, S. K. Barik and S. Dutta, Synthesis, 2010, 9, 1467 CrossRef.
- S. Ghosh, S. Ghosh, N. Baildya and K. Ghosh, New J. Chem., 2022, 46, 8817 RSC.
- Bruker, APEX4, SAINT and SADABS, BRUKER AXS, Inc., Madison, Wisconsin, USA, 2021 Search PubMed.
- G. M. Sheldrick, Sadabs., Program for Multi-Scan Absorption Correction of Area Detector Data, University of Gottingen, Germany, 2002 Search PubMed.
- A. Altomare, M. C. Burla, M. Camalli, G. L. Cascarano, C. Giacovazzo, A. Guagliardi, A. G. G. Moliterni, G. Polidori and R. Spagna, J. Appl. Crystallogr., 1999, 32, 115 CrossRef CAS.
- G. M. Sheldrick, Crystal Structure Refinement with SHELXL, Acta Crystallogr., Sect. C: Struct. Chem., 2015, C71, 3 Search PubMed.
- International Tables for Crystallography, Vol C, Tables 6.1.1.4, 4.2.6.8, and 4.2.4.2, Kluwer, Boston, 1995.
- O. V. Dolomanov, L. J. Bourhis, R. J. Gildea, J. A. K. Howard and H. Puschmann, J. Appl. Crystallogr., 2009, 42, 339 CrossRef CAS.
- C. F. Macrae, I. Sovago, S. J. Cottrell, P. T. A. Galek, P. McCabe, E. Pidcock, M. Platings, G. P. Shields, J. S. Stevens, M. Towler and P. A. Wood, J. Appl. Crystallogr., 2020, 53, 226 CrossRef CAS.
- X. Qian, Y.-Z. Zhu, J. Song, X.-P. Gao and J.-Y. Zheng, Org. Lett., 2013, 15, 6034 CrossRef CAS.
- P. E. Hartnett, C. M. Mauck, M. A. Harris, R. M. Young, Y. L. Wu, T. J. Marks and M. R. Wasielewski, J. Am. Chem. Soc., 2017, 139, 749 CrossRef CAS.
Footnote |
| † Electronic supplementary information (ESI) available: Gelation results, gel pictures, spectral comparison, Hirshfeld analysis, Benesi–Hildebrand and detection limit, binding constant curves, Jobs plots, Stern–Volmer plots, Crystallographic data, copies of 1H, 13C and HRMS spectra. CCDC 2361386. For ESI and crystallographic data in CIF or other electronic format see DOI: https://doi.org/10.1039/d4ra05503a |
| This journal is © The Royal Society of Chemistry 2024 |

