 Open Access Article
Efficient light-induced reactive oxygen species production from a far-red ER-targeting BODIPY dye†
Shawn Swavey *a,
Arnaud Quentel
 b,
Matthew Grzesiak
 a,
Cate Hawkinsa and
Pierre-Alexandre Vidib
aDepartment of Chemistry, University of Dayton, Dayton, OH 45469, USA. E-mail: sswavey1@udayton.edu; Web: https://www.udayton.edu/directory/artssciences/chemistry/swavey_shawn.php Tel: +1-937-229-3145
bLaboratoire InGenO, Institut de Cancérologie de l'Ouest, Angers, 49055, France
First published on 9th December 2024
Abstract
Generation of reactive oxygen species (ROS) within the ER evokes stress leading to immunogenic cell death. A red light activated BODIPY dye capable of subcellular localization within the ER producing high quantum yields of ROS is reported. The ability of this dye to act as a photodynamic therapy (PDT) agent in breast cancer cells suggests promising organelle-targeted therapeutics.
1. Introduction
Photodynamic therapy (PDT) was first approved for the treatment of bladder cancer in Canada in 1993. PDT is a non-invasive treatment modality which utilizes molecular oxygen, a photosensitizer (PS), and light to generate deleterious reactive oxygen species (ROS) within a specific microenvironment.1,2 The most common route to cellular damage for FDA approved PDT agents involves energy transfer from the excited PS to ground state oxygen to generate singlet oxygen, referred to as a Type II mechanism. In contrast, the Type I mechanism involves electron transfer in which the excited PS can act as a reducing agent generating superoxide, radicals or hydrogen peroxide. The Type I mechanism is less dependent on molecular oxygen making this route a more effective PDT application under hypoxic conditions.The first photosensitizer, Photofrin®, is a hematoporphyrin, a mixture of nearly sixty compounds. Despite difficulties in synthetic reproduction, low molar absorptivity within the PDT window leading to the need for high concentrations, as well as prolonged light sensitivity, Photofrin® is still the most common photosensitizer used in PDT.3,4 Foscan®, meta-tetrahydroxyphenylchlorin, is a second-generation photosensitizer approved in 2001.5 Despite its considerably higher toxicity compared to Photofrin®, Foscan® is extensively used for the treatment of advanced head and neck cancers. Operating by a Type II mechanism, studies have concluded that Foscan® localizes within the endoplasmic reticulum (ER) initiating organelle photodamage and apoptotic events after irradiation.6
The ER is the organelle providing a milieu for assembling and folding of proteins, protein modification as well as protein secretion. A large organelle in the cell, making up over 10% of the cell's volume, the ER is composed of rough and smooth domains. Accumulation of unfolded or misfolded proteins results in ER stress, which can lead to a variety of health conditions including tumorigenesis, neurodegenerative diseases, and diabetes.7–9 As such, the ER is an excellent molecular target for PDT. Excessive ER stress has been linked to immunogenic cancer cell death (ICD) resulting from damage associated molecular patterns (DAMPs).10 ER stress can be triggered by excess ROS; however, given the short half-life of 1O2 (<300 ns) this strategy for cancer therapy requires developing bimodal PS's capable of ER-localization along with light driven 1O2 production.11–15
Boron dipyrromethene (4,4-difluoro-4-bora-3a,4a-diaza-s-indacene) or BODIPY represent a class of fluorophores marked by intense absorption and emission within the visible region of the electromagnetic spectrum with high quantum yields and intrinsic photostability. There are relatively few BODIPY dyes specifically designed to target the ER.16–20 Their emissive properties and low cytotoxicity make them ideal as fluorescent probes for biological systems; however, post-functionalization is often required to ensure specific localization. For example, the commercial ER dyes ER-Tracker™ Green and ER-Tracker™ Red are covalently attached to glibenclamide; a drug used to treat hypoglycemia. These ER dyes require the glibenclamide for binding to sulfonylurea receptors expressed by ER.21 Of course, the amount of ER labelling is dependent on the expression level of these receptors and binding to these receptors may interfere with normal ER function.
First generation BODIPY dyes, while excellent as fluorescent probes for cellular imaging, were not amenable as photosensitizers for phototherapeutic applications. This is due to their inability to access the triplet state preventing the formation of ROS. Population of the triplet excited state has been achieved by addition of heavy atoms such as bromine or iodine atoms into the BODIPY core22–26 or through ancillary metal ion complexes.27–30 This “heavy atom” effect results in enhanced spin orbit coupling increasing the population of the triplet excited state through intersystem crossing consequently leading to increased production of ROS. Although PDT is marketed as a more targeted therapy compared to most chemotherapeutics a concerted effort to develop PDT agents capable of localizing within specific organelles is of considerable interest. Recent advances in BODIPY photosensitizers have resulted in PDT agents capable of localizing within cellular organelles such as the mitochondria and the endoplasmic reticulum.31,32
Our laboratory has recently developed a BODIPY scaffold capable of absorption and emission in the far-red region of the electromagnetic spectrum and preliminary characterization suggests ER localization.33 Utilizing isoquino[5,6-c]pyrrole along with readily available benzaldehyde, the π-extended dipyrrin can be synthesized under mild conditions without the need for oxidizing agents in under 3 min. Reaction with triethylamine and boron trifluoride etherate by standard procedures gives the fluorescent probe BDP-1 (Fig. 1).34
Attempts of iodinating the core of BDP-1 proved impossible; however, a recent study indicated that efficient intersystem crossing to the triplet state can be achieved by incorporating iodine within the meso-substituent of BODIPY's.35 Since we have identified the BODIPY-scaffold leading to ER-localization, we were able to synthesize BDP-1I in good yield by replacing benzaldehyde with commercially available 2-iodobenzaldehyde (Fig. 1). This report describes the spectroscopic properties of BDP-1I and its ability to generate reactive oxygen species (ROS) when irradiated with low energy light. The ability of this new photosensitizer to localize within the ER of several cancer cell lines and ultimately cause cell death upon irradiation is presented.
2. Materials and methods
2.1. Materials
Reagents were purchased from Sigma Aldrich or Thermo Fisher. Solvents were reagent grade and used without further purification. Isoquino[5,6-c]pyrrole was synthesized as previously described.36 BDP-1 was synthesized as previously described.33 Chromatography was performed on a Teledyne CombiflashRf+ equipped with UV detection. High-resolution mass spectroscopy was performed at the Mass Spectrometry and Proteomics facility at the Ohio State University. Elemental analysis was performed at Atlantic Microlabs, Norcross, GA. 1H NMR were recorded on a Bruker 400 MHz NMR spectrophotomer at 298 K. Chemical shifts (δ) are given in ppm relative to CDCl3 (7.26 ppm for 1H).2.2. Methods
1H NMR (400 MHz, CDCl3) δ 9.12 (d, J = 18.1 Hz, 2H), 8.86 (s, 1H), 8.68 (s, 1H), 8.50 (s, 1H), 8.28 (d, J = 7.9 Hz, 1H), 8.02 (t, J = 7.8 Hz, 2H), 7.79 (t, J = 7.4 Hz, 1H), 7.68 (d, J = 7.3 Hz, 1H), 7.58 (dd, J = 18.9, 8.3 Hz, 4H), 7.11 (t, J = 7.5 Hz, 1H), 6.95 (t, J = 7.4 Hz, 1H), 6.82 (d, J = 7.6 Hz, 1H), 6.38 (d, J = 8.9 Hz, 1H), 6.29 (d, J = 8.9 Hz, 1H), 5.14 (s, 2H).
HR-ES-MS: m/z = 812.99781 [M + H]+ (calcd for C36H22N4BF2I2 812.99951).
Elemental analysis. Anal. calc. for C36H21N4BF2I2·H2O: % C = 52.08, % H = 2.79, % N = 6.75; found: % C = 52.02, % H = 2.90, % N = 6.84.
| φs = φr[Arηs2Ds/Asηr2Dr] | (1) |
| ϕΔ (PS) = ϕΔ (R) × m(PS)/m(R) × F(R)/F(PS) | (2) |
| Φprobe = ΦRB (KprobeARB /KRBApro) | (3) |
2.3. Cell studies
![[thin space (1/6-em)]](https://www.rsc.org/images/entities/char_2009.gif) 000 cells per cm2 on glass-bottom 35 mm dishes (MatTek) and cultured for 10 days. MDA-MB-231 cells were seeded in the same dishes or in glass-bottom 96-well plates at a density of 44
000 cells per cm2 on glass-bottom 35 mm dishes (MatTek) and cultured for 10 days. MDA-MB-231 cells were seeded in the same dishes or in glass-bottom 96-well plates at a density of 44![[thin space (1/6-em)]](https://www.rsc.org/images/entities/char_2009.gif) 000 cells per cm2 and cultured for 2 days.
000 cells per cm2 and cultured for 2 days.3. Results and discussion
3.1. Spectroscopy
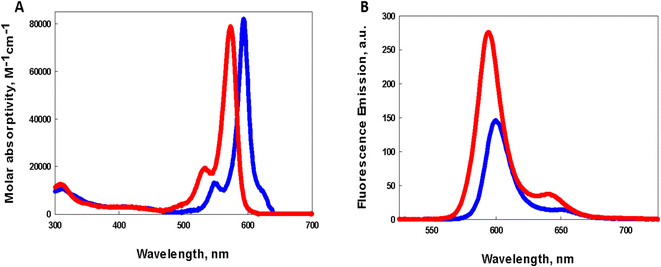
Comparison of the photophysical properties of both photosensitizers in dichloromethane is illustrated in Fig. 2. BDP-1 shows a sharp intense absorption with λmax = 585 nm (Fig. 2A red) while the absorption peak for BDP-1I shows a modest bathochromic shift of 344 cm−1 to a λmax = 597 nm (Fig. 2A, blue). Molar absorptivities of BDP-1 (ref. 33) and BDP-1I at their peak absorptions were determined to be 79![[thin space (1/6-em)]](https://www.rsc.org/images/entities/char_2009.gif) 000 M−1 cm−1 and 83
000 M−1 cm−1 and 83![[thin space (1/6-em)]](https://www.rsc.org/images/entities/char_2009.gif) 000 M−1 cm−1 (ESI Fig. S1†), respectively. Emission spectra resulting from excitation of dichloromethane solutions of BDP-1 and BDP-1I at their absorption maxima is illustrated in Fig. 2B, with red and blue lines, respectively. Emission peaks at 595 nm (BDP-1) and 608 nm (BDP-1I) give rise to Stokes shifts of 287 cm−1 and 273 cm−1 respectively. Luminescence quantum yield of BDP-1 (0.75) is considerably greater than that for BDP-1I (0.38) most likely due to the heavy atom effect allowing for BDP-1I to populate the triplet excited state through enhanced spin–orbit coupling leading to intersystem crossing.
000 M−1 cm−1 (ESI Fig. S1†), respectively. Emission spectra resulting from excitation of dichloromethane solutions of BDP-1 and BDP-1I at their absorption maxima is illustrated in Fig. 2B, with red and blue lines, respectively. Emission peaks at 595 nm (BDP-1) and 608 nm (BDP-1I) give rise to Stokes shifts of 287 cm−1 and 273 cm−1 respectively. Luminescence quantum yield of BDP-1 (0.75) is considerably greater than that for BDP-1I (0.38) most likely due to the heavy atom effect allowing for BDP-1I to populate the triplet excited state through enhanced spin–orbit coupling leading to intersystem crossing.
3.2. ROS generation
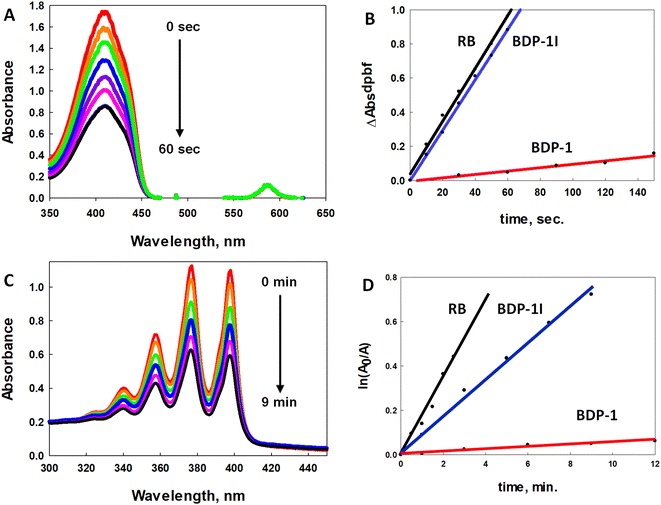
The efficiency of ROS generation was monitored by electronic spectroscopy by observing the decay of the absorption band associated with the 1O2 and O2˙− scavenger (1,3-diphenylisobenzofuran, DPBF) upon irradiation with low energy light.40 Acetonitrile solutions of DPBF and the photosensitizers Rose Bengal (RB), BDP-1, and BDP-1I with a 30-fold excess of scavenger were irradiated with a 100 W mercury-arc lamp equipped with a 550 nm long band-pass filter. Each irradiation experiment was run in triplicate (ESI, Fig. S2–S4†). Fig. 3A illustrates one of the trials with BDP-1I as the photosensitizer. Plots of the change in absorption (ΔAbs) of DPBF versus irradiation time with 1O2 sensitizer RB (black line), BDP-1I (blue line), and BDP-1 (red line) fit to a linear regression are illustrated in Fig. 3B. BDP-1I shows excellent 1O2 quantum yield (ΦΔ) of 0.69(±0.01) comparable to RB, ΦΔ = 0.76 in methanol.41 The non-iodinated BDP-1 showed very little change in the absorption of the DPBF even with extended irradiation times resulting in a low 1O2 quantum yield ΦΔ = 0.063(±0.07). This illustrates the role of the heavy atom effect despite not being attached directly to the BDP core.While DPBF fluorescence quenching is typically associated with 1O2 production (Type II) it is also quenched by O2˙− (Type I); therefore, studies using more specific ROS quenchers were employed to better understand the mechanism of ROS production.42 Specific detection of 1O2 was achieved with the probe 9,10-anthracenediylbis(methylene)dimalonic acid (ABDA); however, longer irradiation times are needed with ABDA versus DPBF due to its much lower 1O2 reactivity.43 Fig. 3C illustrates the effect on the electronic absorption of ABDA as a function of irradiation of a solution of ABDA and BDP-1I. The natural logarithm of the absorbance ratio (A0/A) of ABDA at 377 nm plotted versus irradiation time44 with 1O2 sensitizer RB (black line), BDP-1I (blue line), and BDP-1 (red line) fit to a linear regression are illustrated in Fig. 3D. All of the experiments were run in duplicate (ESI Fig. S5–S7†). The 1O2 quantum yield (ΦΔ) for BDP-1I and BDP-1 were determined to be 0.38 and 0.03, respectively. Notably, the ΦΔ for both BDP dyes were roughly half their values obtained from the DPBF study. To further assess ROS generation, studies using dihydroethidium (DHE), a O2˙− scavenger, were performed. When solutions of DHE and PS are irradiated, O2˙− produced by the PS oxidizes DHE to 2-hydroxy ethidium, generating a broad emission spectrum (590–630 nm) when excited at 500 nm.45 Irradiated acetonitrile solutions of DHE/BDP-1I and DHE/BDP-1 result in broadened emission spectra as a function of irradiation time (ESI Fig. S8 and S9†), indicating that both dyes produce O2˙−.
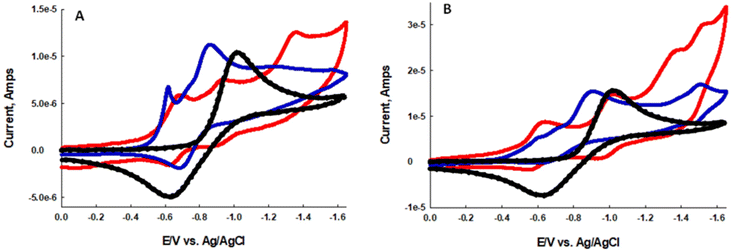
In an effort to better understand why BDP-1I and BDP-1 produce O2˙− by a Type I mechanism we evaluated the electrochemical properties of the dyes in the presence and absence of molecular oxygen. In oxygen saturated dry acetonitrile oxygen is known to undergo a quasi-reversible one-electron reduction to O2˙−. Overlapping reduction potentials of the dyes with the reduction potential of oxygen is an indicator of the ability to produce O2˙− by a Type I mechanism.46–49 Fig. 4A and B illustrate the CV's of BDP-1 and BDP-1I, respectively, in dry acetonitrile in the presence and absence of oxygen. The black dotted CV represents the reduction of oxygen in dry acetonitrile with a glassy carbon working electrode with a peak reduction at −1.02 V vs. Ag/AgCl. Under anaerobic conditions two distinct reduction waves with Epc = −0.69 V and −0.94 V for BDP-1 and Epc = −0.63 V and −1.01 V for BDP-1I, red CV Fig. 4A and B respectively. Solutions of BDP-1 and BDP-1I saturated with air, blue CV Fig. 4A and B respectively, show an intense reduction wave with Epc = −0.88 V vs. Ag/AgCl. Presumably, this new redox wave represents reduction of oxygen to superoxide. The 14 mV anodic shift associated with the reduction of oxygen in the presence of the BDP-dyes indicates a strong overlap of the LUMO orbitals, which should facilitate the photo-injection of an electron from these orbitals into molecular oxygen. While these studies show, BDP-1I is significantly more efficient than BDP-1 at generating ROS it seems clear that both dyes work by both a Type I and Type II mechanism.
3.3. Cell studies
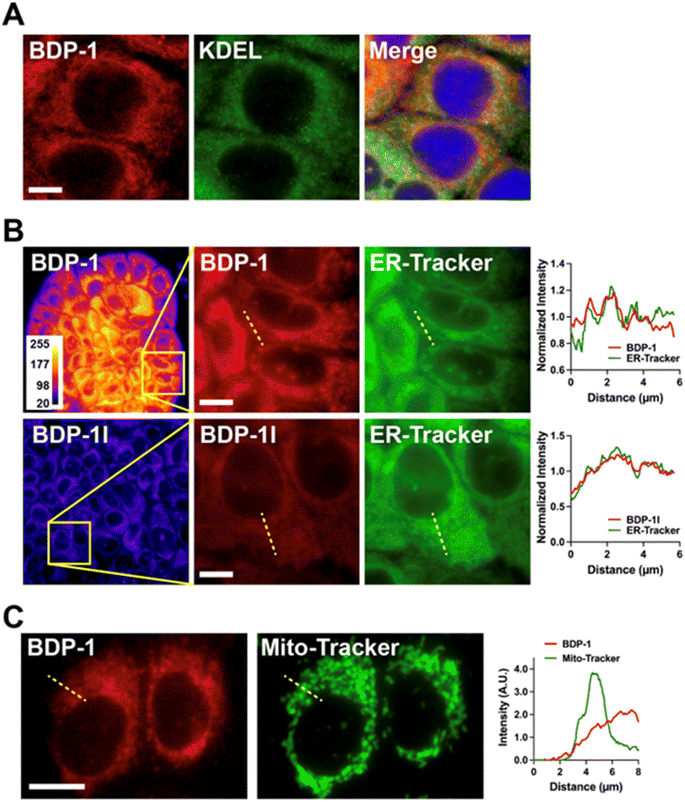
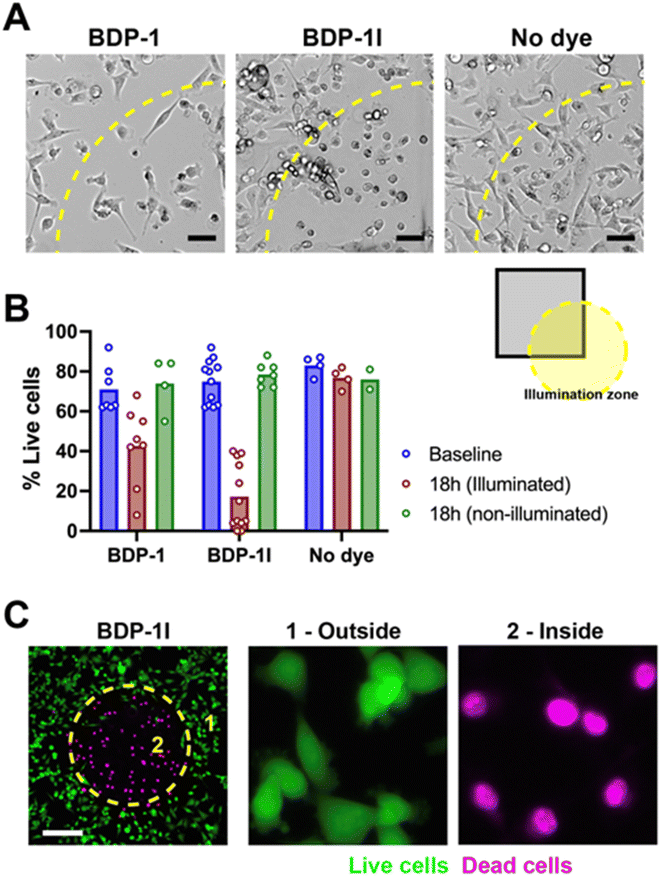
We tested ER localization of BDP-1 by immunostaining cells for the Lys–Asp–Glu–Leu (KDEL) peptide, characteristic of ER-resident proteins (Fig. 5A). BDP-1 signals formed a meshwork of vesicular patterns typical of the ER, with KDEL localized within this meshwork. These results also show that BDP-1 fluorescence is preserved in cells after fixation. BDP-1 fluorescent patterns also overlapped with those from the ER-Tracker dye (Fig. 5B, top) and were retained for at least 24 h in live cells (ESI, Fig. S10†). BPD-1I localization was similar to that of BDP-1, but the iodinated PS produced lower intensity signals, as expected (Fig. 5B, bottom). In contrast, BDP-1 signals poorly overlapped with fluorescence from MitoTracker, a mitochondrial-specific dye (Fig. 5C). Although we do not exclude some localization of BDP-1 and BDP-1I to intracellular vesicles, the results confirm that the PSs primarily localize to the ER.BDP-1 and BDP-1I photosensitizing abilities were evaluated using an aggressive breast cancer cell line (MDA-MB-231). There was no cytotoxicity of the BDP dyes in the absence of illumination (Fig. 6). MDA-MB-231 cells pre-incubated with BDP-1, BDP-1I, or in the absence of dye were irradiated using the ‘Cy3’ illumination setting of the microscope LED system, focalizing the light beam on a defined region of the culture. Bright field images taken 40 h after the PDT treatment showed a clear PS effect for BDP-1I and a more modest effect for BDP-1 in illuminated regions (Fig. 6A and B). Cytototoxicity of the BDP-1I + light combination was confirmed using viability staining (Fig. 6C).
The ‘Cy3’ illumination setting, while convenient to visualize the BDP dye, does not fully cover the absorption spectra of BDP-1 and BDP-1I (Fig. 7A), which may lead to an underestimation of their PS action. We therefore repeated measurements of cancer cell viability, using irradiation wavelengths better overlapping the BDP-1 and BDP-1I absorption spectra (Fig. 7A and B). The results confirm that BDP-1I is more potent than BDP-1 at killing cancer cells. They also show that using a broader range of wavelengths increases the cytotoxic effects of BDP-1 and BDP-1I. For cells pre-incubated with BDP-1I and irradiated with the broader deep red wavelengths, survival in the irradiation zone was <1% (compared to 17% with ‘Cy3’ irradiation). The PS effect was dependent on both the length of irradiation and the concentration of BDP-1 and BDP-1I (Fig. 7C).
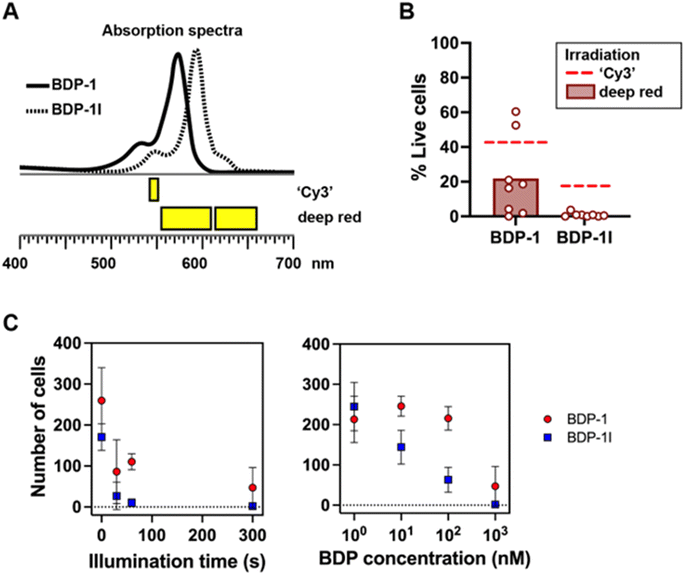 | ||
| Fig. 7 Photosensitization of cancer cells. (A) Irradiation wavelengths with ‘Cy3’ excitation (as used for Fig. 5) and by combining 575 and 630 nm LEDs (deep red). (B) Viability of MDA-MD-231 breast cancer cells incubated with BDP-1 or BDP-1I, after irradiation with deep red light. Dashed lines show average viability values after ‘Cy3’ irradiation for comparison (Fig. 5B). (C) Number of live cells within the illumination zone as a function of the duration of the irradiation (left) and the concentration of the BDP photosensitizers (right). | ||
Phototoxicity of BDP-1I was confirmed in a second breast cancer cell line (HMT3522-T4) (ESI Fig. S11†). Here also, cell death observed in bright field was confirmed with cell viability staining. The BDP-1 and BDP-1I treatments combined with light lead to ∼20% and ∼50% loss of viability, respectively, within 18 h following irradiation. Note that in the BDP treatment conditions, cells were lost in the illumination regions post-illumination, likely due to apoptosis. The apoptotic process is characterized by chromatin marginalization followed by pyknosis (condensation) and Karyorrhexis (fragmentation). These phenotypes are clearly visible in the DAPI stain inside the irradiation zone of cancer cells treated with BDP-1I (ESI Fig. S13D†). In contrast, outside the irradiation zone most cell nuclei had normal interphase morphologies, and many mitotic figures were detected. With a loss of dead cells in irradiated regions, the proportion of cell killing by BDP-1I may have been underestimated.
Cytotoxicity of BDP-1I combined with illumination was also measured in non-cancerous breast epithelial cells (HMT3522-S1) (ESI Fig. S12†). It was therefore not limited to cancer cells, as expected. Toxicity of the PS was strictly restricted to the illuminated zones. In this cell line, the combined cytotoxic effect of BDP-1 and illumination was minimal.
4. Conclusions
Here in we describe a simple two-step synthetic route toward two BDP dyes with the ability to localize within the ER of normal and cancerous breast cells without the need for complex post-functionalization. These BDP dyes showed the ability to generate ROS by both the Type I and Type II mechanism albeit BDP-1I shows considerably greater ROS production. As designed, BDP-1I demonstrated the ability to act as a PDT agent with significant killing of two different breast cancer cell lines. On the other hand, BDP-1 showed a modest ability to generate ROS upon illumination in vitro; however, it demonstrated a considerable ability to kill breast cancer cells.While our target BDP dye, BDP-1I, behaved as an ER-localizing PDT agent, as designed, inclusion of its congener, BDP-1, was primarily for comparison, to illustrate the advantages of the ortho-iodophenyl substituent in generating ROS. In vitro ROS studies proved our hypothesis with BDP-1 generating limited ROS. However, its ability to show significant cell killing in two different breast cancer cell lines was unexpected. Of greater significance was the observation that irradiated non-neoplastic breast epithelial cells in the presence of BDP-1 showed very limited phototoxicity. We believe this unprecedented selective behavior displayed by BDP-1 suggests that malignant and non-malignant breast cells respond differently to low levels of ROS production within the ER. Further studies are currently underway to gain a better understanding of this result.
Data availability
All relevant data generated and analysed during this study, which include experimental, spectroscopic, and cellular studies, are included in this article and its ESI.†Conflicts of interest
The authors declare no conflicts of interest.Notes and references
- D. E. Dolmans, D. Fukumura and R. K. Jain, Nat. Rev. Cancer, 2003, 3, 380–387 CrossRef CAS PubMed.
- S. B. Brown, E. A. Brown and I. Walker, Lancet Oncol., 2004, 5, 497–508 CrossRef CAS PubMed.
- R. Bonnett and M. C. Berenbaum, Adv. Exp. Med. Biol., 1983, 160, 241–250 CrossRef CAS PubMed.
- D. Kessel, Photochem. Photobiol., 1986, 44, 193–196 CrossRef CAS.
- P. Cramers, M. Ruevekamp, H. Oppelaar, O. Dalesio, P. Baas and F. A. Stewart, Br. J. Cancer, 2003, 88, 283–290 CrossRef CAS PubMed.
- M. H. Teiten, L. Bezdetnaya, P. Morliere, R. Santus and F. Guillemin, Br. J. Cancer, 2003, 88, 146–152 CrossRef.
- M. Schroder and R. J. Kaufman, Mutat. Res., 2005, 569, 29–63 CrossRef.
- A. S. Lee and L. M. Hendershot, Cancer Biol. Ther., 2006, 7, 721–722 CrossRef PubMed.
- Y. Zhoua, Z. Liua, G. Qiao, B. Tanga and P. Li, Chin. Chem. Lett., 2021, 32, 3641–3645 CrossRef.
- G. P. Collett, C. W. Redman, I. L. Sargent and M. Vatish, Oncotarget, 2018, 9, 6707–6717 CrossRef PubMed.
- A. Ajoolabady, C. Lebeaupin, N. N. Randal, J. Kaufman and J. Ren, Med. Res. Rev., 2022, 43, 5–30 CrossRef.
- X. Lou, D. Gao, L. Yang, Y. Wang and Y. Hou, J. Transl. Med., 2023, 21, 1–13 CrossRef CAS PubMed.
- H. Yoshida, FEBS J., 2007, 274, 630 CrossRef CAS PubMed.
- K. Xue, P. Wei, W. Qi, L. Jia, L. Tong and Z. Qi, Dyes Pigm., 2023, 219, 111652 CAS.
- X. Li, N. Kwon, T. Guo, Z. Liu and J. Yoon, Angew. Chem., Int. Ed., 2018, 57, 11522–11531 CAS.
- Y. He, J. Shin, W. Gong, P. Das, J. Qu, Z. Yang, W. Liu, C. Kang, J. Qu and J. Kim, Chem. Commun., 2019, 55, 2453–2456 CAS.
- H. Lee, Z. Yang, Y. Wi, T. W. Kim, P. Verwilst, Y. H. Lee, G. Han, C. Kang and J. Kim, Bioconjugate Chem., 2015, 26, 2474–2480 CAS.
- F. Jong, J. Pokorny, B. Manshian, B. Daelemans, J. Vandaele, J. B. Startek, S. Soenen, M. Van der Auweraer, W. Dehaen, S. Rocha and G. Silveira-Dorta, Dyes Pigm., 2020, 176, 108200 Search PubMed.
- D. Singh, D. Rajput and S. Kanvah, Chem. Commun., 2022, 58, 2413–2429 RSC.
- A. Fujisawa, T. Tamura, Y. Yasueda, K. Kuwata and I. Hamachi, J. Am. Chem. Soc., 2018, 140, 17060–17070 CrossRef CAS.
- A. Hambrock, C. Loffler-Walz and U. Quast, Br. J. Pharmacol., 2002, 136, 995–1004 CrossRef CAS.
- T. Yogo, Y. Urano, Y. Ishitsuka, F. Maniwa and T. Nagano, J. Am. Chem. Soc., 2005, 127, 12162–12163 CrossRef CAS.
- A. Turksoy, D. Yildiz and E. U. Akkaya, Coord. Chem. Rev., 2019, 379, 47–64 CrossRef CAS.
- A. Kamkaew, S. H. Lim, H. B. Lee, L. V. Kiew, L. Y. Chung and K. Burgess, Chem. Soc. Rev., 2013, 42, 77–88 RSC.
- I. W. Badon, J.-P. Jee, T. P. Vales, C. Kim, S. Lee, J. Yang, S. K. Yang and H.-J. Kim, Pharmaceutics, 2023, 15, 1512–1527 CrossRef CAS PubMed.
- J. Zou, Z. Yin, K. Ding, Q. Tang, J. Li, W. Si, J. Shao, Q. Zhang, W. Huang and X. Dong, ACS Appl. Mater. Interfaces, 2017, 9, 32475–32481 CrossRef CAS PubMed.
- D. Wang, N. S. D. Solomon, I. Pernik, B. A. Messerle and S. T. Keaveny, Aust. J. Chem., 2020, 73, 979–986 CAS.
- M. Ucuncu, E. Karakus, E. K. Demirci, M. Sayar, S. Dartar and M. Emrullahoglu, Org. Lett., 2017, 19, 2522–2525 CrossRef CAS PubMed.
- J. Sun, F. Zhong, X. Yi and J. Zhao, Inorg. Chem., 2013, 52, 6299–6310 CrossRef CAS PubMed.
- W. Wu, J. Sun, X. Cui and J. Zhao, J. Mater. Chem. C, 2013, 1, 4577–4589 RSC.
- E. R. H. Walter, R. K.-K. Leung, L. C.-C. Lee, K. K.-K. Lo and N. J. Long, J. Mater. Chem. B, 2024, 12, 10409 RSC.
- Z. Kang, W. Bu, X. Guo, L. Wang, Q. Wu, J. Cao, H. Wang, C. Yu, J. Gao, E. Hao and L. Jiao, Inorg. Chem., 2024, 63, 3402–3410 CrossRef CAS.
- S. Swavey, D. Heidary, E. Boyd and J. Erb, Eur. J. Org Chem., 2023, e202300777 CrossRef CAS.
- T. Yogo, Y. Urano, Y. Ishitsuka, F. Maniwa and T. Nagano, J. Am. Chem. Soc., 2005, 127, 12162–12163 CrossRef CAS PubMed.
- E. Bassan, Y. Dai, D. Fazzi, A. Gualandi, P. G. Cozzi, F. Negri and P. Ceroni, Photochem. Photobiol. Sci., 2022, 21, 777–786 CAS.
- T. D. Lash and B. Gandhi, J. Org. Chem., 2000, 65, 8020–8026 CrossRef CAS PubMed.
- M. Ucuncu, E. Karakus, E. K. Demirci, M. Sayar, S. Dartar and M. Emrullahoglu, Org. Lett., 2017, 65, 8020–8026 Search PubMed.
- A. P. Thomas, P. S. S. Babu, S. A. Nair, S. Ramakrishnan, D. Ramaiah, T. K. Chandrashekar, A. Srinivasan and M. R. Pilai, J. Med. Chem., 2012, 55, 5110–5120 CAS.
- Y. Gao, X. Wang, X. He, Z. He, X. Yang, S. Tian, F. Meng, D. Ding, L. Luo and B. Z. Tang, Adv. Funct. Mater., 2019, 29, 1902673 CrossRef.
- T. Ohyashiki, M. Nunomura and T. Katoh, Biochim. Biophys. Acta, Rev. Biomembr., 1999, I421, 131–139 CrossRef PubMed.
- F. Wilkinson, W. Phillip and A. B. Ross, J. Phys. Chem., 1993, 22, 113–218 CAS.
- M. Garcia-Diaz, Y.-Y. Huang and M. R. Hamblin, Methods, 2016, 109, 158–166 CrossRef CAS.
- T. Entrada, S. Waldron and M. Volk, J. Photochem. Photobiol., B, 2020, 204, 111787 CrossRef.
- Y. Gao, X. Wang, X. He, X. Yang, S. Tian, F. Meng, D. Ding, L. Luo and B. Z. Tang, Adv. Funct. Mater., 2019, 29, 1902673 CrossRef.
- H. Zhao, X. Kalivendi, H. Zhang, J. Joseph, K. Nithipatikom, J. V. Vivar and B. Kalyanaraman, Free Radical Biol. Med., 2003, 34, 1359–1368 CrossRef CAS.
- K.-X. Teng, W.-K. Chen, L.-Y. Niu, W.-H. Fang, G. Cui and Q. Z. Yang, Angew. Chem., Int. Ed., 2021, 60, 19912–19920 CrossRef CAS PubMed.
- Z. Zhuang, J. Dai, M. Yu, J. Li, P. Shen, R. Hu, X. Lou, Z. Zhao and B. Z. Tang, Chem. Sci., 2020, 11, 3405–3417 RSC.
- H. Huang, S. Banerjee, K. Qiu, P. Zhang, O. Blacque, T. Malcomson, M. J. Paterson, G. J. Clarkson, M. Staniforth, V. G. Stavros, G. Gasser, H. Chao and P. J. Sadler, Nat. Chem., 2019, 11, 1041–1048 CrossRef CAS PubMed.
- J. Davila and A. Harriman, Photochem. Photobiol., 1989, 50, 29–35 CrossRef CAS PubMed.
Footnote |
| † Electronic supplementary information (ESI) available. See DOI: https://doi.org/10.1039/d4ra05603e |
| This journal is © The Royal Society of Chemistry 2024 |


