 Open Access Article
Eco-synthesis of green silver nanoparticles using natural extracts and its application as co-catalyst in photocatalytic hydrogen production†
Phuong N. Nguyen *ab,
Thao Quynh Ngan Tranc,
Khoa Hai Led,
Diem T. Khongc,
Hoai Phuong Phame,
Quang V. Dang
 fg,
Quang-Hieu Tran
 h,
Tuan M. Nguyen
 *ib and
Nam Nguyen Dang
 jk
jk
aInstitute of Applied Materials Science, Vietnam Academy of Science and Technology (VAST), 29TL Street, Ward Thanh Loc, District 12, Ho Chi Minh City, Vietnam. E-mail: nguyenngocphuong@iams.vast.vn
bGraduate University of Science and Technology, Vietnam Academy of Science and Technology, 18 Hoang Quoc Viet Street, Cau Giay, Ha Noi, Vietnam
cIndustrial University of Ho Chi Minh City, No. 12 Nguyen Van Bao, Ward 4, Go Vap District, Ho Chi Minh City, Vietnam
dInsitute for Tropical Technology, Vietnam Academy of Science and Technology (VAST), 18 Hoang Quoc Viet, Cau Giay, HaNoi, Vietnam
eNTT Hi-Tech Institute, Nguyen Tat Thanh University, 298-300A Nguyen Tat Thanh Street, Ward 13, District 4, Ho Chi Minh City 70000, Vietnam
fFaculty of Materials Science and Technology, University of Science, 227 Nguyen Van Cu Str., Dist. 5, Ho Chi Minh City, Vietnam
gVietnam National University, Ho Chi Minh (VNU-HCM), Linh Trung Ward, Thu Duc District, Ho Chi Minh City 70000, Vietnam
hBasic Sciences Department-Saigon Technology University, 180 Cao Lo, Ward 4, District 8, Ho Chi Minh City 700000, Vietnam
iNational Institute of Applied Mechanics and Informatics, Vietnam Academy of Science and Technology (VAST), 291 Dien Bien Phu Street, Ward 7, District 3, Ho Chi Minh City 70000, Vietnam. E-mail: nguyenmanhtuan@iams.vast.vn
jFuture Materials & Devices Lab., Institute of Fundamental and Applied Sciences, Duy Tan University, Ho Chi Minh City 70000, Vietnam
kThe Faculty of Environmental and Chemical Engineering, Duy Tan University, Danang 50000, Vietnam
First published on 30th September 2024
Abstract
Green silver nanoparticles (AgNPs) were synthesized using natural extracts as reducing agents and were firstly applied as co-catalysts in low-intensity-visible-light driven photocatalytic hydrogen production (PH2P), which a solution for green energy sources and independence from fossil fuels. The as-prepared AgNPs possessed size in a few tens nanometers and exhibited surface plasmon resonance (SPR) effects in the 310–560 nm region. Depositing AgNPs on g-C3N4 nanosheets broadened the visible absorption range, reduced electron–hole recombination, and increased electronic communication at the interface. g-C3N4/Ag demonstrated high PH2P efficiency, stability over three consecutive cycles, and a rapidly rising photocurrent under low-intensity visible light irradiation, although these features were not observed in g-C3N4 alone. The H2 evolution of g-C3N4/Ag_CC (CC: Cinnamomum camphora), g-C3N4/Ag_GT (GT: green tea), and g-C3N4/Ag_PP (PP: pomelo peels) reached 252.6, 125.3 and 92.0 μmol g−1 at 180 min at the first cycle, respectively. Among them, g-C3N4/Ag_CC showed the highest photocatalytic activity, which may be attributed to the superior morphology, optical properties of AgNPs_CC, and efficient electron transfer from g-C3N4 to AgNPs_CC. The SPR effect and Schottky barriers formed at the interface could contribute to enhancing the overall efficiency of the heterojunction photocatalysts. The results highlighted a crucial advancement toward H2 production under low-intensity visible-light irradiation.
1 Introduction
In recent years, scientists have focused on minimizing or eliminating the use and generation of hazardous substances during the synthetic process of novel materials. Green synthesis of nanoparticles using plant extracts has attracted significant attention due to its environmentally friendly, cost-effective, simple, and scalable. The eco-synthesis of metal nanoparticles such as silver,1,2 gold,3 and platinum nanoparticles4,5 have been widely studied owing to their remarkable properties and promising applications. AgNPs exhibit highly efficient antibacterial, antioxidant activities and they are more effective SPR than other nanoparticles.6 Additionally, AgNPs are widely applied as a co-catalysts for photocatalytic wastewater treatment,7 PH2P,8 sensors and devices,9 surface-enhanced Raman scattering,10 anticancer treatments,11 and antimicrobial agents.12 Many plant extracts and natural resources have shown great potential for AgNP synthesis such as Rosa santana petals,13 Moringa oleifera seed,14 Chara algae,15 and honey.16 In plant extracts, biomolecules such as alkaloids, glycosides, flavonoids, saponins, carbohydrates, phenolic compounds and tannins act as reducing, capping, and stabilizing agents to prevent the nanoparticles from aggregation.2 The particle size of AgNPs synthesized by plant extracts varies from a few tens to a hundred nanometers. Previous studies have reported that AgNPs reduced by CC leaf, GT leaf, and PP extracts exhibit high stability and are effective in antibacterial, antimicrobial, and antifungal activities.17–19 However, the use of these extract-reduced AgNPs as co-catalysts for PH2P have not been reported yet. Cinnamomum camphora, green tea, and pomelo trees are popular trees that are grown in tropical areas and are easily found in Vietnam. The AgNPs were proven to be an efficient co-catalyst for PH2P due to their SPR properties, which assisted the migration of photo-induced electrons to the AgNPs and reduced the recombination of photo-generated electron–hole pairs.20,21PH2P by water splitting is a promising approach for generating green hydrogen, a clean, and sustainable alternative to fossil fuels. This technology can address both the environmental crisis and the growing energy consumption.22,23 Semiconductor photocatalysis which converts solar energy into green hydrogen, has been increasingly investigated as one of the most promising areas of science and technology.24 Graphitic carbon nitride (g-C3N4) is known as metal-free, carbon-related photocatalyst and n-type semiconductor.25,26 It has been applied in hydrogen evolution,27–29 photocatalytic CO2 reduction30–32 and organics degradation,33 because of its abundance and the appropriate band gap of 2.7 eV (vs. NHE, pH = 7).30 A significant challenge associated with g-C3N4 is its relatively low efficiency, and high recombination rate of photogenerated hole–electron pairs. Plasmonic nanoparticles (NPs) featuring SPR are ideal co-catalytic candidates to enhance charge separation and transfer. Localized SPR benefits to extend the absorption range and facilitates the excitation of active charge carriers.8 Integrating plasmonic NPs (such as AgNPs) into semiconductor-based photocatalysts like g-C3N4 offers great potential in photocatalysis. The integration facilitates the formation of a Schottky junction, which supports charge separate and transfer. Additionally, the localized SPR of AgNPs contributes to light-absorption extension, and accelerates separation of photogenerated charge carriers at the junction interface. Decorating g-C3N4 surface with AgNPs addresses the limitation of g-C3N4 and improves photocatalytic performance. This enhancement has been reported in applications such as photocatalytic organic-pollutant treatment,34–36 photocatalytic NOx removal,37 and photocatalytic H2 evolution.38 However, conventional chemically synthesized AgNPs can harm the environment, and the application of AgNPs has largely been limited to antibacterial and antioxidant activities. Therefore, heterojunction photocatalyst g-C3N4/AgNPs using natural-extract-reduced AgNPs offers a environmentally friendly solution and develops green hydrogen technologies.
In this study, green AgNPs were synthesized using plant extracts (CC leaf, GT leaf, and PP) and utilized as co-catalysts in heterojunction photocatalysts g-C3N4/Ag for hydrogen production via water splitting. Both AgNPs and g-C3N4/Ag were extensively characterized. The PH2P performance and stability of g-C3N4/Ag were evaluated under low-intensity-visible-light irradiation for the first time. This study is crucial for understanding the photocatalytic activity of g-C3N4/Ag under various irradiation conditions and highlights a pathway for further research in green synthesis methods using eco-friendly resources.
2 Experimental section
Materials
Silver nitrate (AgNO3), melamine (C3H6N6), and sodium hydroxide (NaOH) were acquired from Sigma-Aldrich. Methanol (CH3OH), and triethanolamine (TEOA: (HOCH2CH2)3N) were gotten from Merck. Cinnamomum camphora leaves were collected from Cinnamomum camphora trees lived in the Southeast area of Vietnam, was identified by Southern Institute of Ecology (Institute of Applied Materials Science). Green tea leaves and pomelo peels were purchased from a local market in Ho Chi Minh City, Vietnam.Synthesis of materials
The g-C3N4 nanosheets were synthesized as previous reported.20,21 Melamine (5 g) was placed into a porcelain crucible with a cover and heated to 650 °C with a ramping rate 2 °C min−1, and calcinated at 650 °C for 4 h. After being cooled to room temperature, g-C3N4 bulk was obtained. Next, the mixture of g-C3N4 bulk (0.25 g) and methanol (40 mL) was ultrasonicated for 3 h. Then, the mixture was centrifuged for 5 min (6000 rpm), and washed three times with DI water. The as-prepared powder was dried at 50 °C for 12 h, and then calcinated at 350 °C for 2 h (ramping rate 2 °C min−1). The obtained sample was labeled as g-C3N4 nanosheets.
The as-prepared g-C3N4 nanosheets were surface-treated with a NaOH solution (0.1 M) for 10 min, then ultrasonically cleaned with DI water and centrifugated for 30 min (at 6000 rpm). Depositing AgNPs on g-C3N4 nanosheets was environmentally friendly by using water as a reaction medium. The treated g-C3N4 (100 mg) was added to 20 mL distilled water, then the suspension was ultrasonicated for 1 h, followed by gradually dropping 10 mL AgNPs solution (0.927 mM) to the suspension and stirred for 1 h in the dark. The g-C3N4/Ag was obtained after centrifugation and dried overnight at 50 °C, denoted as g-C3N4/Ag_CC, g-C3N4/Ag_GT, and g-C3N4/Ag_PP corresponding to AgNPs_CC, AgNPs_GT, AgNPs_PP were used, respectively.
Characterization
X-ray powder diffraction patterns (XRD, D8 Advance XRD with Cu Kα radiation, λ = 0.15418 nm) was used to identify the crystalline structure of materials. The optical properties were characterized by Fourier transform infrared spectroscopy (FTIR, PerkinElmer MIR/NIR Frontier), ultraviolet-visible (UV-vis, UV-1800, Shimadzu), and ultraviolet-visible diffuse reflectance spectroscopy (UV-vis DRS, UV-2600, Shimadzu), photoluminescence (PL) spectroscopy (Cary Eclipse Fluorescence Spectrophotometer, Varian, USA). The morphology and elemental composition of the materials were analyzed using scanning electron microscope (SEM) images, energy dispersion spectroscopy (EDS) mapping (SEM – Hitachi SM-4800), and transmission electron microscope images (TEM-HRTEM, Tecnai G2 F20 S-Twin). Dynamic light scattering (DLS) was used to determine the size of AgNPs using SZ-100 (Horiba). Specific surface areas of g-C3N4 and g-C3N4/Ag were measured by Brunauer–Emmett–Teller (BET, Quantachrome Nova 4000e, USA).Photocurrent experiments
Transient photocurrent response measurements were performed using a Potentiostat Biologic VSP-300 with a three-electrode system, comprising a working electrode, a nickel mesh counter electrode, and an Ag/AgCl reference electrode in a 0.5 M Na2SO4 electrolyte. The working electrode was prepared by coating the samples (g-C3N4, g-C3N4/Ag_CC, g-C3N4/Ag_GT, and g-C3N4/Ag_PP) on fluorine-doped tin oxide (FTO) glass (2.5 × 2.5 cm), as previously reported.31 The transient photocurrent response was recorded under the applied bias 0.35 V with irradiation from a visible light (15 W light bulk, center wavelength λ = 408 nm, and light intensity at a distance of 5 cm is 210 W m−2, see Fig. S1†) with light chopping every 30 s.Hydrogen evolution measurement
Hydrogen evolution experiments were conducted in a photocatalytic test chamber, which was equipped with a visible-light systems (15 W light bulb, Fig. S1†), mirrors, and a magnetic stirrer. The produced H2 was analyzed by gas chromatography (GC Clarus 680-PerkinElmer), equipped with a thermal conductivity detector (TCD), a molecular sieve column (L × I.D.: 30 m × 0.32 mm), and Ar as the carrier gas. The reaction solution consisted of 1 mg photocatalyst, 3 mL DI water, and 0.5 mL TEOA as a sacrificial electron donor. The solution was placed in a 10 mL transparent vial and irradiated with a visible-light bulb inside the photocatalytic test chamber.3 Results and discussion
Crystal structure, optical properties and morphology of AgNPs
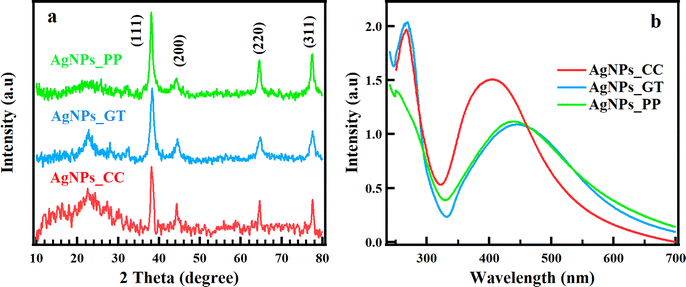
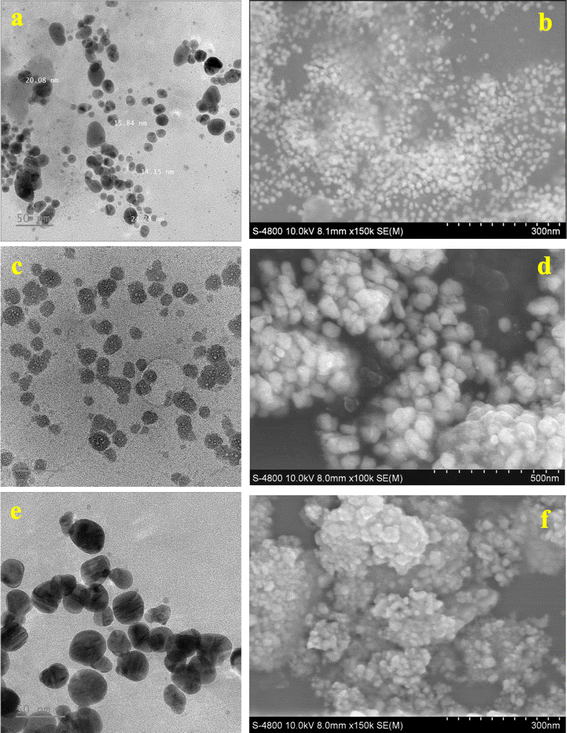
Fig. 1a presents the XRD patterns, which reveal the crystallinity and structure of AgNPs_CC, AgNPs_GT, AgNPs_PP. Four distinct diffraction peaks were observed at 2θ values of 38.2°, 44.3°, 64.7°, and 77.5°, corresponding to the (111), (200), (220), and (311) crystal planes of the face-centered cubic structure of Ag, respectively. These peaks aligned with the database of the Joint Committee on Powder Diffraction Standards (JCPDS file no. 89.3722) for silver. The peak at 38.2° was the most intense, indicating the predominant growth of AgNPs along the (111) orientation. The intense peaks in the XRD patterns confirmed the fine-crystalline structure of synthesized AgNPs_CC, AgNPs_GT, AgNPs_PP. Additionally, the peak at 22.6° could be attributed to bio-inorganic compounds and residual protein molecules from the reaction.2,39,40 The average crystallite size of AgNPs_CC, AgNPs_GT, AgNPs_PP were calculated to be 17.26, 10.43, 11.40 nm, respectively, using Scherrer's equation, as shown in Table S1.†AgNPs_CC, AgNPs_GT, and AgNPs_PP were reduced using extracts at pH = 8, which was optimal for bio-reducing, resulting in AgNPs with the high stability, rapid reaction, and pronounced SPR.2,40,41 An 1 mM AgNO3 concentration was determined to be the optimal for the synthesis and rapid formation of AgNPs, because of the greater availability of functional groups in the leaf extracts.2,40,41 For those reasons, the optimum condition for synthesizing plant-extract-AgNPs was at a pH of 8 and a 1 mM aqueous solution AgNO3. UV-vis spectra were used to observe the SPR effect, which confirmed the formation of AgNPs_CC, AgNPs_GT, and AgNPs_PP, as shown in Fig. 1b. The UV-vis spectra displayed two absorption bands that located in the range of 310–560 nm related to the SPR effect. The SPR of AgNPs_CC was confirmed by the broad intense absorption band, centered 410 nm with Full Width at Half Maximum (FWHM) of 110 nm. Meanwhile, the SPR of AgNPs_GT and AgNPs_PP were corresponded to the broad absorption bands, centered at 440 and 450 nm with FWHM of 170 nm, respectively. The wavelength at the maximum absorption (λmax) and FWHM of the SPR band can be associated with the mean size and size distribution of the NPs, respectively.42 When the particle size increases, the absorption band undergoes red-shift, and the sharpening of FWHM indicates the uniform particle size distribution. AgNPs_CC possessed the smallest particle size and the most homogenous size distribution compared to AgNPs_GT, and AgNPs_PP because of the lowest wavelength and smallest FWHM. The mean size of AgNPs_CC, AgNPs_GT, and AgNPs_PP were confirmed by DLS measurement (see ESI, Fig. S2 and Table S1†), which showed the particle size of 29.8, 91.8, and 90.1 nm, respectively. TEM and SEM images were used to determine the morphological characterizations of AgNPs_CC, AgNPs_GT, and AgNPs_PP (Fig. 2). The mean sizes of AgNPs_CC, AgNPs_GT, and AgNPs_PP were identified as 5–35, 10–65, 10–45 nm, respectively (Table S1†). The effect of the biomolecules covering the AgNPs surface and the Brownian motion could explain the difference in the average particle size obtained from XRD, TEM, SEM, and DLS (because DLS measured the average hydrated particle size, and XRD and SEM measured particle size in powder).43 UV-vis and DLS measurements were consistent with TEM and SEM images and the results suggested CC extract was the best-reducing agent.
J. Huang et al. used CC extract to reduce AgNPs, achieving the particle sizes ranging from 55 to 80 nm with narrow size distribution when using 0.5 g biomass and 1 mM aqueous solution AgNO3 at 30 °C.40 W. Li et al. also reported AgNPs reduced by CC leaf extract and evaluated their antimicrobial proficiency. The obtained AgNPs were uniformly dispersed, exhibiting ellipsoidal shapes, with the average particle size of 19.57 nm as determined by TEM and 47.92 nm by DLS.44 The AgNPs_CC synthesized in this study exhibited better characteristics than those reported in the two previous studies, particularly in terms of average particle size, shape, and size distribution. The particle size of AgNPs_GT were consistent with the findings of M. A. T. Safa and H. A. Widatalla, although AgNPs_GT synthesized in this work demonstrated less clustering compared to their AgNPs.17,39 Clustering was observed in reduced AgNPs reduced using PP extract, as reported by V. T. Nguyen.19
FTIR analysis was carried out to identify the functional groups present on the surface of AgNPs and extract solutions. Fig. 3 displays FTIR spectra of AgNPs_CC, AgNPs_GT, AgNPs_PP, and the corresponding leaf extracts in the range of 400–4000 cm−1. The FTIR spectrum of AgNPs_CC showed the vibrational bands at 3287, 2926, 2854, 1650, 1474, 1258, 1140, 1059, and 815 cm−1. The vibrational band at 3287 cm−1 could be assigned to the stretching vibration of the amino group (–NH2) and hydroxyl group (–OH) of alcohol in polyphenols. The bands at 2926 and 2854 cm−1 contributed to the stretching vibration of the methylene group (–CH2–) and O–H stretching in carboxylic acids. The bands at 1650, 1474, and 1258 cm−1 were associated with the stretch vibration of C![[double bond, length as m-dash]](https://www.rsc.org/images/entities/char_e001.gif) C, the symmetric and asymmetric stretching vibrations of nitro (–NO2) and carboxylate (–COO–), respectively. The band at 1140 cm−1 could be corresponded to the –C–O groups of the polyols such as flavones, terpenoids and polysaccharides in the biomass. The band at 1059 and 815 cm−1 was related to the stretching vibration of C–O and the vibration of N–H group, respectively. The extract exhibited two distinct bands at 3492 and 634 cm−1. The functional groups present in the AgNPs and the extract were similar; however, the intensity of the functional groups in the AgNPs was lower compared to the extract. This suggested that the AgNPs were capped by the component of the extract through functional groups such as –C–O–C–, –C–O–, –C
C, the symmetric and asymmetric stretching vibrations of nitro (–NO2) and carboxylate (–COO–), respectively. The band at 1140 cm−1 could be corresponded to the –C–O groups of the polyols such as flavones, terpenoids and polysaccharides in the biomass. The band at 1059 and 815 cm−1 was related to the stretching vibration of C–O and the vibration of N–H group, respectively. The extract exhibited two distinct bands at 3492 and 634 cm−1. The functional groups present in the AgNPs and the extract were similar; however, the intensity of the functional groups in the AgNPs was lower compared to the extract. This suggested that the AgNPs were capped by the component of the extract through functional groups such as –C–O–C–, –C–O–, –C![[double bond, length as m-dash]](https://www.rsc.org/images/entities/char_e001.gif) C– and –C
C– and –C![[double bond, length as m-dash]](https://www.rsc.org/images/entities/char_e001.gif) O. The functional groups that likely contributed to the reduction of Ag+ in the extract include –NH2, –OH, and C–C, commonly found in proteins and enols. –OH, –CO, and –CH groups (saturated alcohols, ethers and alkanes) were involved in the stabilization of AgNPs.40,44
O. The functional groups that likely contributed to the reduction of Ag+ in the extract include –NH2, –OH, and C–C, commonly found in proteins and enols. –OH, –CO, and –CH groups (saturated alcohols, ethers and alkanes) were involved in the stabilization of AgNPs.40,44
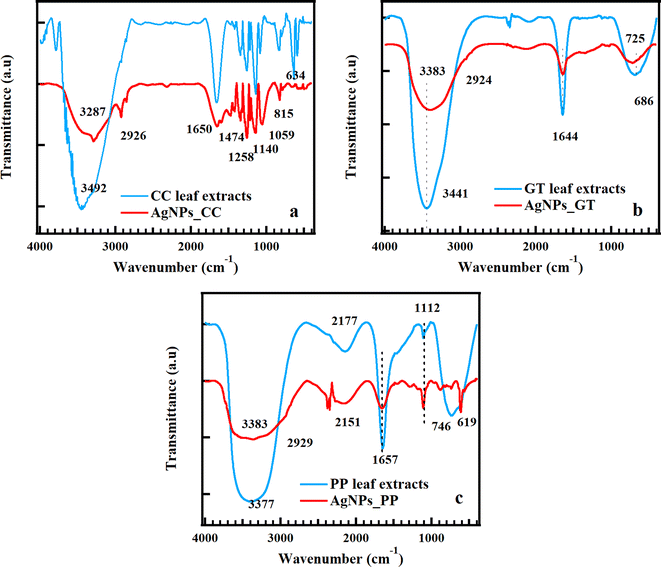 | ||
| Fig. 3 FTIR spectra of CC leaf extract and AgNPs_CC (a), GT leaf extract and AgNPs_GT (b), PP leaf extract and AgNPs_PP (c). | ||
Fig. 3b shows the FTIR spectrum of AgNPs_GT, which displays four vibrational bands at 3383, 2924, 1644, and 725 cm−1. The broad band at 3383 cm−1 corresponded to O–H stretching of alcohol in polyphenols, N–H stretching in amines. The bands at 2924, 1644, and 725 cm−1 were attributed to a band of C–H stretching in alkanes, a C![[double bond, length as m-dash]](https://www.rsc.org/images/entities/char_e001.gif) C aromatic group, and C–H bending, respectively. The FTIR spectrum of GT leaf extract depicted three sharp vibrational bands at 3441, 1644, and 686 cm−1, which were consistent with the O–H stretching in polyphenols and N–H stretching in amines, C
C aromatic group, and C–H bending, respectively. The FTIR spectrum of GT leaf extract depicted three sharp vibrational bands at 3441, 1644, and 686 cm−1, which were consistent with the O–H stretching in polyphenols and N–H stretching in amines, C![[double bond, length as m-dash]](https://www.rsc.org/images/entities/char_e001.gif) C aromatic group, and C–H bending. Extract-encapsulated AgNPs_GT manifested by the same functional groups found in AgNPs_GT and the extract, and the vibrational bands shifted and narrowed. Flavonoids and epigallocatechin (containing hydroxyl (HO) group) in GT were the components that reduced nanoparticles, a powerful antioxidant, and a strong reducing agent for AgNPs synthesis, respectively.45 The FTIR spectrum of PP extract showed five vibrational bands at 3377, 2177, 1657, 1112, and 746 cm−1 (Fig. 3c), which corresponded to O–H and N–H stretching, NCO stretching, the C
C aromatic group, and C–H bending. Extract-encapsulated AgNPs_GT manifested by the same functional groups found in AgNPs_GT and the extract, and the vibrational bands shifted and narrowed. Flavonoids and epigallocatechin (containing hydroxyl (HO) group) in GT were the components that reduced nanoparticles, a powerful antioxidant, and a strong reducing agent for AgNPs synthesis, respectively.45 The FTIR spectrum of PP extract showed five vibrational bands at 3377, 2177, 1657, 1112, and 746 cm−1 (Fig. 3c), which corresponded to O–H and N–H stretching, NCO stretching, the C![[double bond, length as m-dash]](https://www.rsc.org/images/entities/char_e001.gif) C aromatic group, and C–H bending, respectively. The FTIR spectrum of AgNPs_PP presented the same trend with that of PP leaf extract including five bands at 3383, 2151, 1657, 1112, and 619 cm−1, exception of the bands at 2929 cm−1 (C–H stretching in alkanes). The shift and decrease in intensity of vibrational bands in the FTIR spectrum of AgNPs_PP indicated that the extract encapsulated and stabilized AgNPs_PP.
C aromatic group, and C–H bending, respectively. The FTIR spectrum of AgNPs_PP presented the same trend with that of PP leaf extract including five bands at 3383, 2151, 1657, 1112, and 619 cm−1, exception of the bands at 2929 cm−1 (C–H stretching in alkanes). The shift and decrease in intensity of vibrational bands in the FTIR spectrum of AgNPs_PP indicated that the extract encapsulated and stabilized AgNPs_PP.
Crystal structure, optical properties, morphology, and BET specific surface area of g-C3N4/Ag
Fig. 4 presents XRD patterns, FTIR spectra, UV-vis DRS spectra, Tauc plot, and PL spectra of g-C3N4, g-C3N4/Ag_CC, g-C3N4/Ag_GT, g-C3N4/Ag_PP. The XRD pattern of g-C3N4 nanosheet showed the primary diffraction peaks at 12.98° and 27.97°, which were characterized by (100) and (002) crystal planes of graphite phase carbon nitride. The intense peak at 27.97° related to the stacked-layer structure of polymeric or graphitic sheets and characteristic aromatic rings.46 The peak at 13.1° indicated the tri-s-triazine (stable structure) structure of g-C3N4 nanosheet. The XRD patterns of g-C3N4/Ag_CC, g-C3N4/Ag_GT, g-C3N4/Ag_PP showed the peaks at 27.72, 27.80, 27.82°, respectively, which demonstrated the structure of g-C3N4. These peaks shifted to the lower diffraction angle and became broader compared to the peak at 27.97° of g-C3N4, indicating the larger stacking distance between layers.46 This phenomenon could be explained by depositing AgNPs on g-C3N4 layers. The peak around 13° was not observe in the XRD patterns of g-C3N4/Ag_CC, g-C3N4/Ag_GT, g-C3N4/Ag_PP, that could be because of the relative intensity of peaks around 13° and 28°. The diffraction peak of AgNPs at 38.2° observed in the XRD patterns of g-C3N4/Ag_CC, g-C3N4/Ag_PP, and C3N4/Ag_GT indicated the AgNPs successful deposition of AgNPs on the surface of g-C3N4.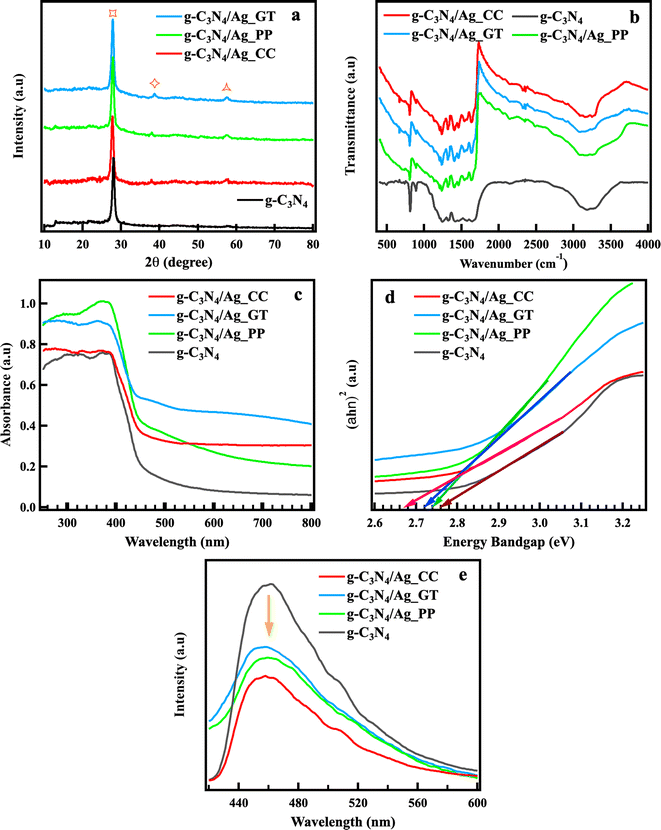 | ||
| Fig. 4 XRD patterns (a), FTIR spectra (b), UV-vis DRS spectra (c), Tauc plot (d), PL spectra (e) of g-C3N4, g-C3N4/Ag_CC, g-C3N4/Ag_GT, g-C3N4/Ag_PP. | ||
Fig. 4 presents FTIR spectra of g-C3N4, g-C3N4/Ag_CC, g-C3N4/Ag_GT, g-C3N4/Ag_PP. FTIR spectra showed similar fashioned including two intense and broad absorption bands from 3000 to 3500 cm−1, 1200 to 1650 cm−1, and the sharp absorption peaks at 810 and 890 cm−1, which related to the stretching modes of the N–H vibration, C–N stretching vibration tri-s-triazine heterocycle, and 1,3,5-substituted triazine cycle structure, respectively. The IR vibrational bands of AgNPs were not observed in FTIR spectra of heterojunction photocatalysts, indicating that depositing AgNPs on the surface of g-C3N4 did not affect the structure of g-C3N4. The absorption edge of heterojunction photocatalysts increased comparing to that of g-C3N4, as shown in Fig. 4c. The corresponding band gaps of g-C3N4, g-C3N4/Ag_CC, g-C3N4/Ag_GT, and g-C3N4/Ag_PP were identified as 2.70, 2.73, 2.72, and 2.77 eV, respectively (Fig. 4d, calculating based on the Kubelka–Munk function). Depositing AgNPs co-catalyst on g-C3N4 extended the absorption region and improved the quantum efficiency, prompting increasing photocatalytic efficiency. Fig. 4e depicts PL spectra of materials, which possess strong luminescence emission in the range of 420–550 nm. The emission intensity of heterojunction photocatalysts were lower than that of g-C3N4, indicating electron–hole recombination decreased in the present of AgNPs. g-C3N4/Ag_CC has the lowest emission intensity, which evidenced the lowest photoinduced electron–hole recombination. The specific surface area, pore volume, and pore diameter of g-C3N4 and g-C3N4/Ag_CC are presented in Table 1. The surface area of 20.435 and 26.943 m2 g−1 were determined for g-C3N4 nanosheet and g-C3N4/Ag_CC, respectively. The increased surface area of g-C3N4/Ag_CC was because of the protonation with the dispersion of g-C3N4 nanosheet. The pore volume and pore diameter increased from 0.13 to 0.16 cm3 g−1 and 1.72 to 1.84 nm, respectively, which could be interpreted by the enhanced microporous structure via ultrasonication and the insert of AgNPs into g-C3N4 layers, resulting in highly porous.
| Sample | SBET (m2 g−1) | Vpore (cm3 g−1) | dpore (nm) |
|---|---|---|---|
| g-C3N4 nanosheet | 20.435 | 0.13 | 1.72 |
| g-C3N4/Ag_CC | 26.943 | 0.16 | 1.84 |
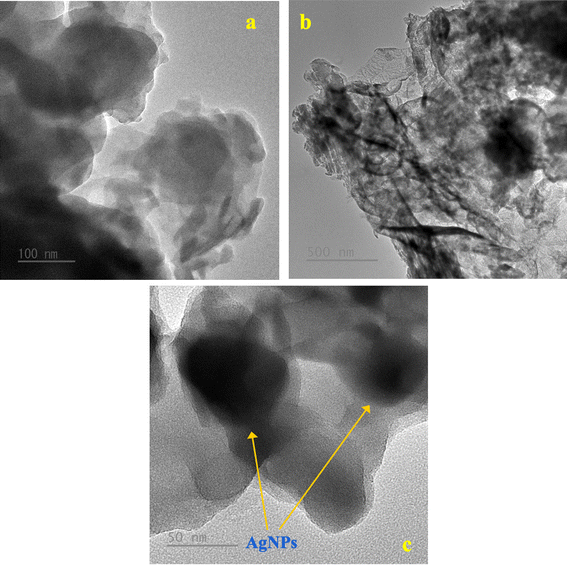
The morphological characterizations of g-C3N4 nanosheet, g-C3N4/Ag_CC, g-C3N4/Ag_GT, g-C3N4/Ag_PP are shown in Fig. 5. The SEM image of g-C3N4 nanosheet displays fine-organized stacking layers (Fig. 5a). Depositing AgNPs on g-C3N4, sheet-like morphology layers of g-C3N4 was observed with bright-dots AgNPs dispersed on the surface of g-C3N4 (Fig. 5b–e). The energy dispersive X-ray spectrum (EDS) confirmed the presence of carbon (C), nitrogen (N), and Ag elements in g-C3N4/Ag_CC (Fig. 5f). The elemental mapping image of g-C3N4/Ag_CC showed the content of AgNPs_CC as 0.44% (derived from the use of 1 wt% AgNPs in the synthesis of g-C3N4/Ag_CC). The elemental mapping displays three components, indicating g-C3N4/Ag_CC formed without impurities and AgNPs_CC successfully adsorbed onto the g-C3N4 surface. The TEM images confirmed the sheet-layer structure of g-C3N4 nanosheet and the distribution and presence of AgNPs_CC on g-C3N4/Ag_CC (Fig. 6). The particle size of AgNPs_CC ranged of 30–40 nm, which was consistent with the results obtained from XRD patterns, TEM, SEM images, and DLS analysis of AgNPs_CC.
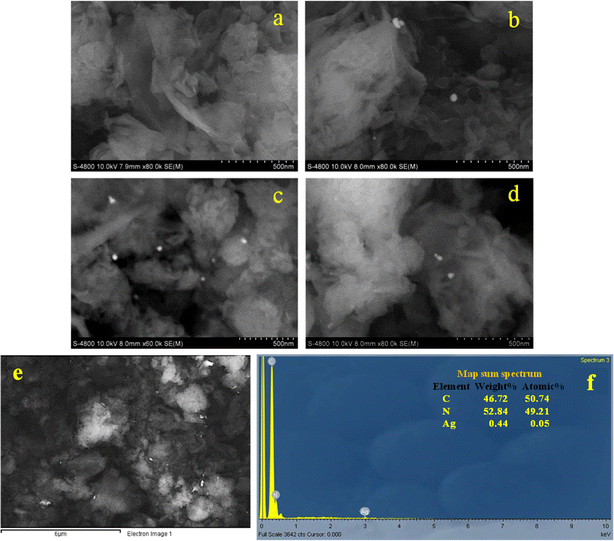 | ||
| Fig. 5 SEM images of g-C3N4 (a), g-C3N4/Ag_CC (b), g-C3N4/Ag_GT (c), and g-C3N4/Ag_PP (d), EDX analysis of g-C3N4/Ag_CC (e and f). | ||
Photocatalytic H2 production and stability
The PH2P by water splitting was carried out under low-intensity visible light, using TEOA as the electron donor (Fig. 7a). The photocatalytic stability was evaluated by performing the PH2P of the same material over three consecutive cycles. After each cycle, the reaction solution was centrifuged and filtrated, followed by washing the precipitation with methanol and drying at 60 °C for 24 h. The collected precipitation was re-used for photocatalytic stability testing. In this study, PH2P of g-C3N4 was not observed, meanwhile H2 generation by bare g-C3N4 nanosheet and g-C3N4 bulk reached 4 μmol h−1 and 14.5 μmol g−1 h−1 as reported by X. Wang and T. Ren et al., respectively, and others.20,28,38,47 In those reported, PH2P of g-C3N4 was tested at the standard condition of AM 1.5 G, at an intensity of 100 mW cm−2. In contrast, in this study, the photocatalytic activities were conducted under low-intensity visible light that might account for the non-photocatalytic activity of g-C3N4. g-C3N4/Ag_CC showed the highest PH2P activity in three cycles. In the first cycle, H2 evolution of g-C3N4/Ag_CC, g-C3N4/Ag_GT and g-C3N4/Ag_PP reached 252.6, 125.3 and 92.0 μmol g−1 at 180 min, respectively. In the second and third cycles, the H2 evolution of g-C3N4/Ag_CC, g-C3N4/Ag_GT, and g-C3N4/Ag_PP slightly decreased from 233.0 to 199.1, 120.8 to 109.7, and 90.6 to 85.4 μmol g−1, respectively. The H2 evolution of three materials remained in good yield over three cycles. The slight decrease of H2 evolution can likely be explained by the loss of catalyst during the collection and washing steps between each cycle. Depositing AgNPs as co-catalyst on the surface of g-C3N4 improved the photocatalytic activity even though g-C3N4 did not show its PH2P activity. AgNPs contributed to extending the visible absorption range, reducing the recombination of electron–hole pairs, increasing photogenerated electrons transfer from g-C3N4, and reinforcing its energy by SPR, thereby enhancing H2 evolution. Additionally, AgNPs have been reported to catalyze H2 production.20 g-C3N4/Ag_CC displayed the highest PH2P due to the smaller average particle size, uniform size distribution and dispersion of AgNPs_CC comparing to AgNPs_GT and AgNPs_PP. To gain insight into the highest P2PH performance of g-C3N4/Ag_CC, the transient photocurrent was presented, as shown in Fig. 7b. Upon light irradiation, the current response of g-C3N4 was undetermined, which proved the charge separation upon the irradiation was inefficient resulting in no photocatalytic activity observed. g-C3N4/Ag_CC, g-C3N4/Ag_GT, g-C3N4/Ag_PP showed a large photocurrent approximately 1.9, 1.3, and 1.0 μA cm−2, respectively. These currents were fast rising, which manifested the efficient charge separation and electron transfer from CB of g-C3N4 to AgNPs. The current intensity remained their values during three cycles, proving the stability of the photocatalysts. As expected, depositing AgNPs on g-C3N4 enhanced electronic communication and reduced the recombination of photo-induced carriers.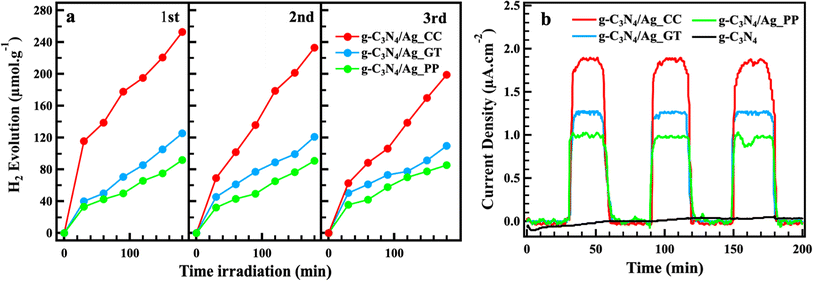 | ||
| Fig. 7 Photocatalytic hydrogen production in three consecutive cycles (a), transient photocurrent (b) of g-C3N4/Ag_CC, g-C3N4/Ag_GT, g-C3N4/Ag_PP, and g-C3N4 under visible-light irradiation. | ||
Proposal photocatalytic mechanism
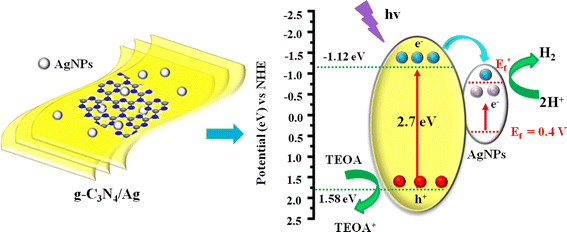
The proposal mechanism depicted by the electron transfer process offers an insight into the PH2P of g-C3N4/Ag system (Fig. 8). g-C3N4 nanosheet is an n-type semiconductor with a redox potential of conductor band and valence band located at −1.12 and 1.34 eV (vs. NHE, pH = 7),30 respectively. Depositing AgNPs on the surface of g-C3N4, AgNPs with the Fermi level at +0.4 eV vs. NHE,48 which matched the energy level of g-C3N4, resulting in the formation of Schottky barrier at the interface. When g-C3N4/Ag was irradiated, the SPR effect of Ag enhanced visible-light absorption and the local electromagnetic field, which accelerated both the generation and the transfer rate of photoinduced electrons. The photoinduced electrons of g-C3N4 transferred and accumulated on AgNPs, creating a Schottky barrier that effectively suppressed the recombination of the photoinduced electron–hole pairs. Ultimately, the accumulated electrons on the AgNPs participate in the reduction of water to generate hydrogen, while the holes in the valence band of g-C3N4 are scavenged by TEOA.4 Conclusion
AgNPs were successfully reduced by natural extracts, possessing great optical properties, an ideal particle size, a crystallized structures, and high effectiveness as co-catalysts in g-C3N4/Ag photocatalytic system. Depositing AgNPs on g-C3N4 broadened the visible absorption range, improved the quantum efficiency and interfacial electron transfer, and reduced electron–hole recombination, resulting in boosting the overall photocatalytic efficiency of g-C3N4/Ag_CC, g-C3N4/Ag_GT, and g-C3N4/Ag_PP. All the heterojunction photocatalysts exhibited great PH2P efficiency under low-intensity visible light irradiation. g-C3N4/Ag_CC showed the highest activity over the three cycles of PH2P measurement, due to the smaller size, more uniformly size distribution, and dispersion of AgNPs_CC compared to AgNPs_GT and AgNPs_PP. In the first cycle, H2 evolution of g-C3N4/Ag_CC, g-C3N4/Ag_GT, and g-C3N4/Ag_PP reached 252.6, 125.3 and 92.0 μmol g−1 at 180 min, respectively. The photocatalytic retained their stability over three cycles, with a slight decrease in H2 evolution while maintaining PH2P performance. The enhanced photocatalytic efficiency of the g-C3N4/Ag system can be attributed to the combined effects of SPR and Schottky barriers, which improved quantum efficiency, increased electron–hole generation in g-C3N4, facilitated charge transfer, and minimized charge recombination. This study provides an insight into green chemistry and represents a crucial step toward H2 production under low-intensity visible-light irradiation.Data availability
The data supporting this article have been included as part of the ESI.†Conflicts of interest
The authors declare no conflict of interest.Acknowledgements
The authors acknowledge Vietnam Academy of Science and Technology (VAST) for financial support of the project named NVCC14.01/24-25.References
- O. Erdogan, M. Abbak, G. M. Demirbolat, F. Birtekocak, M. Aksel, S. Pasa and O. Cevik, PLoS One, 2019, 14, 1–15 CrossRef PubMed.
- R. S. Priya, D. Geetha and P. S. Ramesh, Ecotoxicol. Environ. Saf., 2016, 134, 308–318 CrossRef CAS PubMed.
- N. Muniyappan, M. Pandeeswaran and A. Amalraj, Environ. Chem. Ecotoxicol., 2021, 3, 117–124 CrossRef CAS.
- U. Malode, Y. S. Patil, Y. N. Selokar, P. R. Yadav, R. P. Bhagat, V. M. Nikose, R. U. Thakare and S. Nimbarte, Bull. Natl. Res. Cent., 2023, 47, 130 CrossRef.
- S. A. Fahmy, E. Preis, U. Bakowsky and H. M. E. S. Azzazy, Molecules, 2020, 25, 1–17 Search PubMed.
- U. Kreibig and M. Vollmer, Optical properties of metal cluster, Springer, 1995, vol. 1–656, p. 13 Search PubMed.
- H. A. Elbadawy, A. F. Elhusseiny, S. M. Hussein and W. A. Sadik, Sci. Rep., 2023, 13, 1–13 CrossRef PubMed.
- Y. Liu, C. H. Liu, T. Debnath, Y. Wang, D. Pohl, L. V. Besteiro, D. M. Meira, S. Huang, F. Yang, B. Rellinghaus, M. Chaker, D. F. Perepichka and D. Ma, Nat. Commun., 2023, 14, 1–12 CAS.
- T. M. Dinh, H. Q. Huynh, T. M. N. Mai, H. S. Truong, H. N. Luong, N. P. Nguyen, C. K. Tran, B. T. Phan and V. Q. Dang, Semicond. Sci. Technol., 2021, 36, 045009 CrossRef CAS.
- H. N. Luong, N. M. Nguyen, L. N. T. Nguyen, C. K. Tran, T. T. Nguyen, L. T. Duy, N. P. Nguyen, T. M. H. Huynh, T. T. Tran, B. T. Phan, T. V. T. Thi and V. Q. Dang, Sens. Actuators, A, 2022, 346, 113816 CrossRef CAS.
- N. S. Alharbi and N. S. Alsubhi, J. Radiat. Res. Appl. Sci., 2022, 15, 335–345 CAS.
- S. Ahmed, M. Ahmad, B. L. Swami and S. Ikram, J. Adv. Res., 2016, 7, 17–28 CrossRef CAS PubMed.
- I. Jahan, F. Erci and I. Isildak, Anal. Lett., 2019, 52, 1860–1873 CrossRef CAS.
- H. M. Mehwish, M. S. R. Rajoka, Y. Xiong, H. Cai, R. M. Aadil, Q. Mahmood, Z. He and Q. Zhu, J. Environ. Chem. Eng., 2021, 9, 105290 CrossRef CAS.
- K. T. Hassan, I. J. Ibraheem, O. M. Hassan, A. S. Obaid, H. H. Ali, T. A. Salih and M. S. Kadhim, J. Environ. Chem. Eng., 2021, 9, 105359 CrossRef CAS.
- G. B. Strapasson, E. d. C. Flach, M. Assis, S. A. Corrêa, E. Longo, G. Machado, J. F. L. Santos and D. E. Weibel, ChemPhysChem, 2023, 24, e202300002 CrossRef CAS PubMed.
- H. A. Widatalla, L. F. Yassin, A. A. Alrasheid, S. A. Rahman Ahmed, M. O. Widdatallah, S. H. Eltilib and A. A. Mohamed, Nanoscale Adv., 2022, 4, 911–915 RSC.
- C. Wei, H. Li, G. Cui, C. Ma, R. Deng, Z. Zou and Z. Liu, Arabian J. Chem., 2022, 15, 104225 CrossRef CAS.
- V. T. Nguyen, J. Chem., 2020, 2020, 9 Search PubMed.
- J. Qin, J. Huo, P. Zhang, J. Zeng, T. Wang and H. Zeng, Nanoscale, 2016, 8, 2249–2259 RSC.
- I. Majeed, U. Manzoor, F. K. Kanodarwala, M. A. Nadeem, M. A. Nadeem, E. Hussain, H. Ali, A. Badshah and J. A. Stride, Catal. Sci. Technol., 2018, 8, 1183–1193 RSC.
- Q. Hassan, S. Algburi, A. Z. Sameen, H. M. Salman and M. Jaszczur, Int. J. Hydrogen Energy, 2024, 50, 310–333 CrossRef CAS.
- K. Nie, X. Qu, D. Gao, B. Li, Y. Yuan, Q. Liu, X. Li, S. Chong and Z. Liu, ACS Appl. Mater. Interfaces, 2022, 14, 19847–19856 CrossRef CAS PubMed.
- S. Nandy, T. Hisatomi, T. Takata, T. Setoyama and K. Domen, J. Mater. Chem. A, 2023, 11, 20470–20479 RSC.
- J. Liu, T. Zhang, Z. Wang, G. Dawson and W. Chen, J. Mater. Chem., 2011, 21, 14398–14401 RSC.
- A. Alaghmandfard and K. Ghandi, Nanomaterials, 2022, 12, 294 CrossRef CAS PubMed.
- W. Dai, R. Wang, Z. Chen, S. Deng, C. Huang, W. Luo and H. Chen, J. Mater. Chem. A, 2023, 11, 7584–7595 RSC.
- X. Wang, K. Maeda, A. Thomas, K. Takanabe, G. Xin, J. M. Carlsson, K. Domen and M. Antonietti, Nat. Mater., 2009, 8, 76–80 CrossRef CAS PubMed.
- B. Rhimi, C. Wang and D. W. Bahnemann, JPhys Energy, 2020, 2, 042003 CrossRef CAS.
- A. V. Tran, T. T. Tran, Q. N. T. Tran, T. N. Manh, V. B. Bui, P. N. Nguyen and N. N. Dang, Mater. Lett., 2023, 349, 134769 CrossRef.
- P. N. Nguyen, T. T. Tran, Q. A. T. Nguyen, Y. Kawazoe, S. V. P. Vattikuti, L. V. Le, V. Q. Bui, T. M. Nguyen and N. N. Dang, J. Mater. Chem. A, 2023, 11, 17145–17158 RSC.
- S. Lu, Y. Zhang, M. F. Mady, W. M. Tucho, F. Lou and Z. Yu, Ind. Eng. Chem. Res., 2022, 61, 10400–10408 CrossRef CAS.
- J. Wen, L. Zhou, Q. Tang, X. Xiao and S. Sun, Ecotoxicol. Environ. Saf., 2023, 262, 115133 CrossRef CAS PubMed.
- R. Liu, W. Yang, G. He, W. Zheng, M. Li, W. Tao and M. Tian, ACS Omega, 2020, 5, 19615–19624 CrossRef CAS PubMed.
- K. Qi, Y. Li, Y. Xie, S. Y. Liu, K. Zheng, Z. Chen and R. Wang, Front. Chem., 2019, 7, 1–9 CrossRef PubMed.
- W. Zhang, L. Zhou and H. Deng, J. Mol. Catal. A: Chem., 2016, 423, 270–276 CrossRef CAS.
- Y. Sun, T. Xiong, Z. Ni, J. Liu, F. Dong, W. Zhang and W. K. Ho, Appl. Surf. Sci., 2015, 358, 356–362 CrossRef CAS.
- T. Ren, Y. Dang, Y. Xiao, Q. Hu, D. Deng, J. Chen and P. He, Inorg. Chem. Commun., 2021, 123, 108367 CrossRef CAS.
- M. A. T. Safa and H. Koohestani, Results Eng., 2024, 21, 101808 CrossRef.
- J. Huang, Q. Li, D. Sun, Y. Lu, Y. Su, X. Yang, H. Wang, Y. Wang, W. Shao, N. He, J. Hong and C. Chen, Nanotechnology, 2007, 18, 105104 CrossRef.
- M. M. H. Khalil, E. H. Ismail, K. Z. El-Baghdady and D. Mohamed, Arabian J. Chem., 2014, 7, 1131–1139 CrossRef CAS.
- D. D. Evanoff and G. Chumanov, ChemPhysChem, 2005, 6, 1221–1231 CrossRef CAS PubMed.
- X. F. Zhang, Z. G. Liu, W. Shen and S. Gurunathan, Int. J. Mol. Sci., 2016, 17, 1534 CrossRef PubMed.
- W. Li, F. Qu, Y. Chen, Y. Sun, J. Zhang, G. Xie, Q. You and H. Xu, Biochem. Eng. J., 2021, 172, 108050 CrossRef CAS.
- M. H. Al Rashid, A. Kundu, V. Mandal, P. Wangchuk and S. C. Mandal, in Herbal Medicine in India, Springer Singapore, Singapore, 2020, pp. 119–142 Search PubMed.
- H. Zhang and A. Yu, J. Phys. Chem. C, 2014, 118, 11628–11635 CrossRef CAS.
- X. Zhang, Q. Wu, Z. Du, Y. Zheng and Q. Li, Fullerenes, Nanotubes Carbon Nanostruct., 2018, 26, 688–695 CrossRef CAS.
- Y. Yang, Y. Guo, F. Liu, X. Yuan, Y. Guo, S. Zhang, W. Guo and M. Huo, Appl. Catal., B, 2013, 142–143, 828–837 CrossRef CAS.
Footnote |
| † Electronic supplementary information (ESI) available. See DOI: https://doi.org/10.1039/d4ra05675b |
| This journal is © The Royal Society of Chemistry 2024 |

