 Open Access Article
Investigation of the linear and nonlinear optical properties in the crystalline phase of a pyrimidine derivative—a potential nonlinear optical material: analysis of its structure, reactivity, and docking studies†
Krishna Murthy Potla *a,
Yahya I Asirib,
Nannapaneni Usha Ranic,
Francisco A. P. Osóriode,
Clodoaldo Valverde
 *fg,
Murugesan Rajah,
Sanja J. Armaković
 i and
Stevan Armaković
 j
j
aDepartment of Chemistry, Velagapudi Ramakrishna Siddhartha Engineering College (Deemed to be University), Kanuru, 520 007, Vijayawada, Andhra Pradesh, India. E-mail: krishnamurthypotla@gmail.com
bDepartment of Pharmacology, College of Pharmacy, King Khalid University, Abha 61421, Asir Province, Saudi Arabia
cDepartment of Freshman Engineering, P. V. P. Siddhartha Institute of Technology, Vijayawada, 520 007, India
dInstituto de Física, Universidade Federal de Goiás, 74.690-900, Goiânia, GO, Brazil
ePontifícia Universidade Católica de Goiás, 74605-100, Goiânia, GO, Brazil
fLaboratório de Modelagem Molecular Aplicada e Simulação (LaMMAS), Campus de Ciências Exatas e Tecnológicas, Universidade Estadual de Goiás, 75001-970, Anápolis, GO, Brazil. E-mail: phdcv10@gmail.com
gUniversidade Paulista, 74845-090, Goiânia, GO, Brazil
hDepartment of Physics, Govt. Thirumagal Mills College, Gudiyatham, Vellore, 632602, Tamil Nadu, India
iUniversity of Novi Sad, Department of Chemistry, Biochemistry and Environmental Protection, 21000 Novi Sad, Serbia
jUniversity of Novi Sad, Department of Physics, 21000 Novi Sad, Serbia
First published on 26th November 2024
Abstract
This study investigates the nonlinear optical (NLO) properties of a newly synthesized pyrimidine derivative, N-(4-(4-fluorophenyl)-6-isopropyl-5-(methoxymethyl)pyrimidin-2-yl)-N-methylmethanesulfonamide (PMMS), with potential applications in advanced optical devices. The structure of PMMS was confirmed by single-crystal X-ray diffraction (SCXRD), and its geometry was optimized using density functional theory (DFT) at the B3LYP/6-311++G(d,p) level. Key intermolecular interactions were analyzed using Hirshfeld surface analysis and 2D-fingerprint plots. Nonlinear optical properties, such as polarizability and hyperpolarizability, were investigated using an iterative electrostatic embedding method, showing significant enhancement in NLO behavior in the crystalline environment. PMMS exhibited a third-order nonlinear susceptibility (χ3) superior to known chalcone derivatives, highlighting its potential for optical and photonic applications. Additionally, molecular docking studies revealed the potential of PMMS as a strong acetylcholinesterase (AChE) inhibitor, suggesting its possible therapeutic applications in treating neurodegenerative diseases, such as Alzheimer's. This study provides foundational insights into the NLO properties and bioactivity of PMMS, positioning it as a promising material for future optical technologies and pharmaceutical developments.
1. Introduction
Pyrimidine cores have π-deficient and electron-withdrawing nature as well as aromatic and coplanar characteristics, which make them ideal for creating push–pull molecules that influence luminescence properties and aid in designing new NLO materials.1 Our interest in studying the nonlinear optical (NLO) properties of our newly synthesized pyrimidine-based molecule was sparked by a comprehensive review by Fecková et al.,2 who extensively explored a diverse range of NLO chromophores built on a pyrimidine framework. NLO materials have a wide range of applications in optical data processing, storage, sensors, optoelectronics, semiconductors, photonic devices, and superconductors.3–6 Pyrimidine's ability to protonate, form hydrogen bonds, and chelate nitrogen atoms is significant, allowing for the formation of supramolecular assemblies and sensors. Additionally, pyrimidine serves as a valuable building block for synthesizing liquid crystals,7,8 offering optical and thermal advantages that could lead to innovative applications. These molecules have optoelectronic characteristics that play a role in light-triggered hydrogen evolution, offering potential as a renewable, carbon-neutral energy source.9 The precise adjustment of pyrimidine-based molecules has been harnessed in developing covalent organic frameworks (COFs), valued for their crystalline structure, porosity, and adjustability. Pyrimidine ring compounds, such as cytosine, thymine, and uracil, are commonly found in nature and have various pharmacological activities, including antiplasmodial,10 antimicrobial,11 antitubercular,12 anticancer,13 antiinflammatory,14 anti-HIV,15 antiviral,16 antihypertensive,17 anticonvulsant,18 and anti-Alzheimer's19 activities.Advancements in computational resources in materials science have significantly improved the prediction of new materials before experimental synthesis, narrowing down the selection of materials for practical applications. Computational analysis based on quantum mechanical calculations has become crucial in the development of new materials, especially in industries such as pharmaceuticals and materials.20–24
The nonlinear optical and biological activity studies of pyrimidine-based molecules are driven by their potential applications in various medicines and scientific and technological fields. The synthesis of new pyrimidine molecules offers an opportunity to explore and utilize their properties. This research investigates the nonlinear optical properties and biological activity of a newly synthesized pyrimidine molecule to contribute to the existing knowledge in this area. In continuation of our research endeavors25,26 on the nonlinear optical properties and pharmacochemical investigation of pyrimidine derivatives, we present a detailed study of a new compound, N-[4-(4-fluorophenyl)-6-(propan-2-yl)-5-(methoxymethyl)pyrimidin-2-yl]-N-methylmethanesulfonamide (PMMS). Experimental and computational tools were employed for this comprehensive study, and the findings of this investigation are discussed in this study.
2. General remarks
Chemicals were procured from commercial sources and used as received without further purification. The synthesis was performed under inert atmosphere conditions. The Fourier-transform infrared spectrum was recorded using a PerkinElmer Spectrum 1 FT-IR Spectrometer in the form of a KBr disc in the range of 4000–450 cm−1, with 1.0 cm−1 spectral resolution (Fig. S1†). The Fourier-transform Raman spectrum was recorded using a Bruker RFS 27: Standalone FT-Raman Spectrometer in the range of 50–4000 cm−1, with 2.0 cm−1 spectral resolution and an Nd:YAG 1064 nm laser source (Fig. S2†).2.1. Synthesis of N-(4-(4-fluorophenyl)-6-isopropyl-5-(methoxymethyl)pyrimidin-2-yl)-N-methylmethanesulfonamide (PMMS)
In a 100 mL round bottom flask, 0.5 g (1.2 mmol) of N-(5-(bromomethyl)-4-(4-fluorophenyl)-6-isopropylpyrimidin-2-yl)-N-methylmethanesulfonamide was dissolved in 15 mL of THF and cooled to 0 °C. Sodium methoxide (0.097 g, 1.80 mmol) was added at the same temperature. The reaction was then allowed to reach room temperature and stirred for 2 hours. After the reaction was complete, the reaction mixture was diluted with water and extracted with ethyl acetate (3 × 10 mL). The organic layers were combined and evaporated under vacuum to yield N-(4-(4-fluorophenyl)-6-isopropyl-5-(methoxymethyl)pyrimidin-2-yl)-N-methylmethanesulfonamide as an off-white solid (0.65 g, yield: 85%). Block-shaped crystals of N-(4-(4-fluorophenyl)-6-isopropyl-5-(methoxymethyl)pyrimidin-2-yl)-N-methylmethanesulfonamide (PMMS) were obtained through slow evaporation at ambient temperature in ethyl acetate solvent (Scheme 1). | ||
| Scheme 1 Synthesis of N-(4-(4-(fluorophenyl)-6-isopropyl-5-(methoxymethyl)pyrimidin-2-yl)-N-methylmethanesulfonamide (PMMS). | ||
2.2. X-ray crystallography details
A colorless, block-shaped single crystal of the title compound, with dimensions 0.31 mm × 0.25 mm × 0.15 mm, was selected and mounted on a Bruker APEX-II CCD diffractometer with monochromatic MoKα radiation (λ = 0.71073 Å) at 296(2) K. The data were processed with SAINT and absorption was corrected using SADABS.27 The structure was solved by applying the direct method with the program SHELXL28 and was refined by full-matrix least-squares techniques on F2 using anisotropic displacement parameters for all non-hydrogen atoms. The carbon-bound hydrogen atoms were positioned with idealized geometry using a riding model with C–H = 0.93 Å (for Caryl–H) and 0.96 Å (for Cmethyl–H). H atoms were refined with isotropic displacement parameters (set to 1.2–1.5 times the Ueq of the parent atom).2.3. Computational details
DFT computations were conducted using Gaussian 16 (ref. 29) with a B3LYP/6-311G++(d,p) basis set, and the results were visualized using GaussView 6.0.30 Molecular electrostatic potential (MEP) and average local ionization energy (ALIE) calculations were also performed using the same method. The wave functions with topology maps (ELF, LOL, and RDG) were analyzed using the Multiwfn program.31 AutoDock32 was used for docking analysis. MD simulations were carried out on a system consisting of one PMMS molecule surrounded by approximately 2000 water molecules in a cubic-shaped MD system. The simulations utilized the OPLS4 force field33 with a simulation time of 20 ns in the NPT ensemble of particles, and the cut-off radius was set to 9 Å. All DFT calculations were performed with the Jaguar program,34 while MD simulations were conducted with the Desmond program.35–38 Molecular visualization was performed using the Maestro program.39 Jaguar, Desmond, and Maestro were part of the Schrödinger Materials Science Suite 2024-1.2.4. Linear and nonlinear optical calculations of PMMS
The PMMS crystal was simulated through an iterative electrostatic method (IEM) where the crystalline environment polarization field on the asymmetric unit is considered by replacing the surrounding charges with punctual charges. The MIE is developed as follows: first, we calculate the partial charges of the asymmetric unit by adjusting the molecular electrostatic potential carried out using the CHELPG scheme, considering the charge distribution in a vacuum. Then, the crystal is built by replicating (packing) the unit cells of the compound around the asymmetric unit using the Mercury software to construct a bulk, with 11 × 11 × 11 unit cells; each has 8 asymmetric units with 47 atoms each, totalizing 500![[thin space (1/6-em)]](https://www.rsc.org/images/entities/char_2009.gif) 456 atoms (Fig. 1(a)). The asymmetric unit is then removed from the centre of the bulk, and the atoms of the molecules surrounding it are exchanged by the partial charges calculated in the previous step. Then, we calculate the dipole moment and a new set of partial charges. In the next step, this new set of partial charges is used to replace all the atoms of the molecules that surround the asymmetric unit. Again, we calculate the dipole moment and a new set of partial charges that feed the next step, and the process continues until the convergence of the dipole moment. Fig. 1(b) shows the dipole moment
456 atoms (Fig. 1(a)). The asymmetric unit is then removed from the centre of the bulk, and the atoms of the molecules surrounding it are exchanged by the partial charges calculated in the previous step. Then, we calculate the dipole moment and a new set of partial charges. In the next step, this new set of partial charges is used to replace all the atoms of the molecules that surround the asymmetric unit. Again, we calculate the dipole moment and a new set of partial charges that feed the next step, and the process continues until the convergence of the dipole moment. Fig. 1(b) shows the dipole moment  as a function of the iterative steps. The µ-values go from 5.95 D (isolated molecule) to 7.33 D, representing an increase of ∼23% due to the crystalline environment polarization.
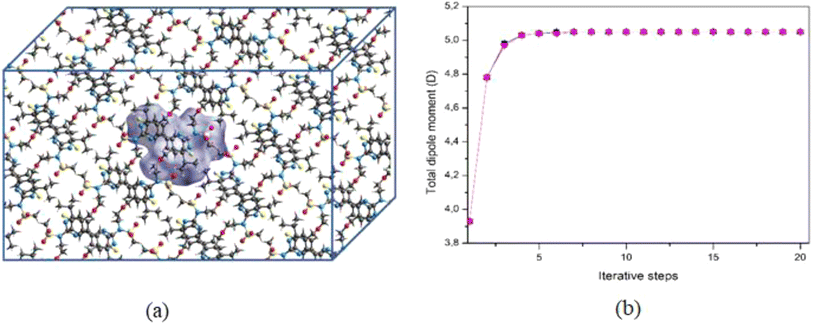 | ||
| Fig. 1 (a) Schematic representation of the bulk highlighting the symmetric unit (in green) in the center. (b) Convergence of the dipole moment as a function of the iterative steps. | ||
The linear optical parameters, as the average linear polarizability (α(−ω;ω)) and the refractive index (n(ω)), were calculated through the following expressions:
 | (1) |
 | (2) |
The dynamic average second hyperpolarizability and the intensity-dependent refractive index (IDRI) second hyperpolarizability are given by
 | (4) |
| 〈γ(−ω;ω,ω,−ω)〉 ≅ 2〈γ(−ω;ω,0,0)〉 − 〈γ(0;0,0,0)〉. | (5) |
The third-order nonlinear susceptibility can be written in the following form:
 | (6) |
3. Results and discussion
3.1. Crystal structure description
Molecules are crystallized in the orthorhombic space group (Pbca) with one molecule (Z′ = 1) in the asymmetric unit and 8 molecules in the unit cell. The ORTEP diagram of the compound is shown in Fig. 2, and the crystallographic data and refinement parameters are summarized in Table 1. Molecule packing grows via CH⋯O weak intermolecular interactions along the a-axis (Fig. 3(a)). Two molecules are further connected via a dimer, which is also connected by CH⋯O weak intermolecular interactions along the b-axis (Fig. 3(b)).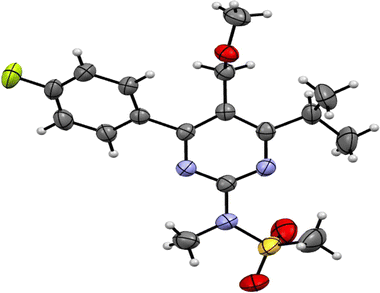 | ||
| Fig. 2 ORTEP view of N-(4-(4-fluorophenyl)-6-isopropyl-5-(methoxymethyl)pyrimidin-2-yl)-N-methylmethanesulfonamide (PMMS) with thermal ellipsoids drawn at 50% probability. | ||
| CCDC deposit | 1897523 |
| Empirical formula | C17O3FSN3H22 |
| Formula weight | 367.44 |
| Temperature/K | 296.15 |
| Crystal system | Orthorhombic |
| Space group | Pbca |
| a/Å | 7.7519(10) |
| b/Å | 17.548(2) |
| c/Å | 26.884(4) |
| α/° | 90.00 |
| β/° | 90.00 |
| γ/° | 90.00 |
| Volume/Å3 | 3657.0(8) |
| Z | 8 |
| ρcalc (g cm−3) | 1.335 |
| µ/mm−1 | 0.208 |
| F(000) | 1552.0 |
| Crystal size/mm3 | 0.31 × 0.25 × 0.15 |
| Radiation | MoKα (λ = 0.71073) |
| 2Θ range for data collection/° | 5.94 to 55 |
| Index ranges | −9 ≤ h ≤ 9, −16 ≤ k ≤ 22, −34 ≤ l ≤ 27 |
| Reflections collected | 16![[thin space (1/6-em)]](https://www.rsc.org/images/entities/char_2009.gif) 693 693 |
| Independent reflections | 4175 [Rint = 0.0575, Rsigma = 0.0566] |
| Data/restraints/parameters | 4175/0/231 |
| Goodness-of-fit on F2 | 1.020 |
| Final R indexes [I ≥ 2σ(I)] | R1 = 0.0535, wR2 = 0.1329 |
| Final R indexes [all data] | R1 = 0.1112, wR2 = 0.167 |
| Largest diff. peak/hole/e Å−3 | 0.21/−0.33 |
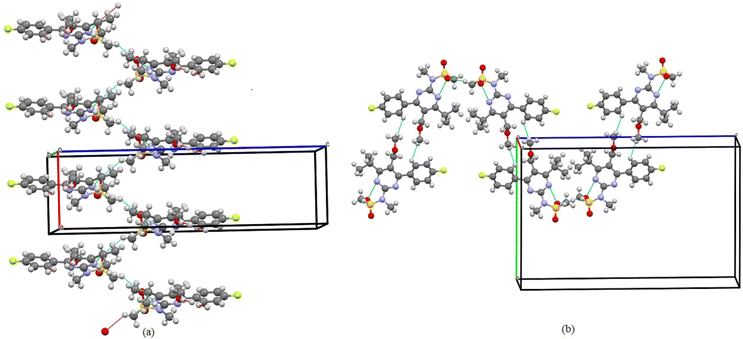 | ||
| Fig. 3 (a) One-dimensional ribbon-like architecture formed along the a-axis observed in the PMMS crystal when viewed down the a-axis. (b) Intermolecular interactions are shown as thin blue lines. | ||
3.2. Hirshfeld surfaces analysis
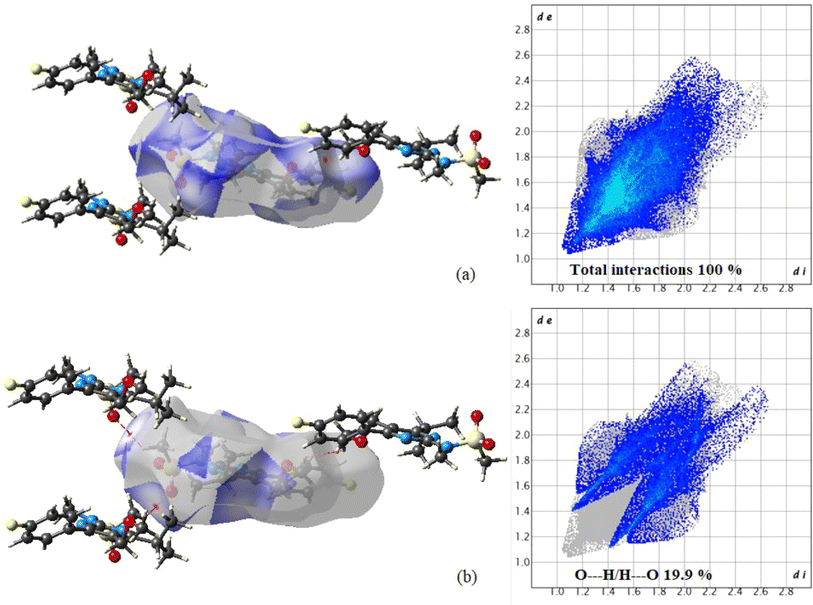
The CrystalExplorer 17 tool40 is used to create 3D-Hirshfeld surfaces and 2D-fingerprint plots. The Hirshfeld surfaces for the title compound are depicted in Fig. S3,† showcasing surfaces mapped over dnorm (i), shape index (ii), curvedness (iii), and fragment patch (iv) with ranges of −0.0446 to 1.5862 Å, −1.00 to 1.00 Å, −4.00 to 0.400 Å, and 0.00 to 13.00 Å, respectively. In Fig. 4, the light bright red spots represent the intermolecular interaction centers C17–H17⋯O2 and C12–H12⋯H6 labeled as “a” and “b”, respectively. The relative contribution of various interactions on the Hirshfeld surface was analyzed through fingerprint analysis of the title compound. The fingerprint analysis reveals that O⋯H contacts contribute approximately 19.9% of the total Hirshfeld surface area (Fig. 4), manifesting as two distinct spikes of similar length. The upper spikes correspond to donor spikes (the hydrogen atom of the methyl group interacting with the oxygen atom of the SO2 group), while the lower spikes correspond to acceptor spikes (the oxygen atom of the SO2 group interacting with the hydrogen atom of the methyl group). The remaining contribution primarily stems from H⋯H (52.4%), H⋯C (7.5%), H⋯F (10.5%), and C⋯C (4.8%) interactions.3.3. Optimization of geometry
The DFT/B3LYP/6-311++G(d,p) method is used to optimize the geometry of the PMMS molecule in isolated gas-phase molecules (Fig. S4†). Initial coordinates are taken from the X-ray structure without constraints. Compared to the experimental values, the estimated geometrical parameters are slightly higher. This discrepancy may be attributed to the fact that the computed values are obtained for single molecules in the gas phase, while the experimental results are based on molecules in the solid state. Table S1† presents selected geometric characteristics, such as bond length (Å), bond angle (°), and torsion angle (°), for comparison with the experimental data. The comparison investigation demonstrates good agreement between the experimental and computational parameters (ESI data†).3.4. FMO analysis
The HOMO and LUMO orbitals of the PMMS molecule represent their electron-donating and electron-accepting capacities, respectively. These frontier molecular orbitals play a crucial role in predicting the molecule's reactivity, stability, charge transfer, and bioactivity. The spatial distribution of the HOMO (MO: 97, −6.8093 eV) and LUMO (MO: 98, −1.8438 eV) orbitals is shown in Fig. S5,† revealing charge transfer between the N-methylmethanesulfonamide group and the fluorophenyl ring through the pyrimidine ring. The global chemical descriptors of the molecule include ionization potential (I) = 6.8093 eV, electron affinity (A) = 1.8438 eV, electronegativity (χ) = 4.3265 eV, global hardness (η) = 2.4827 eV, chemical softness (ν) = 0.4027 eV, chemical potential (µ) = −4.3265 eV, electrophilicity index (ω) = 3.7698 eV, electron donating capability (ω−) = 6.2434 eV, electron accepting capability (ω+) = 1.9147 eV, and maximal charge acceptance (ΔNmax) = −1.7426 eV.41 The molecule's electrophilicity index (ω) value of 3.7698 eV suggests its good affinity for binding to biomolecules, making it a soft molecule.423.5. Local reactive properties
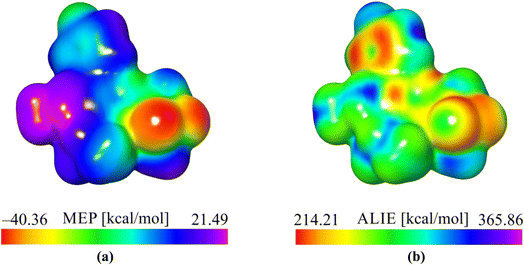
According to the obtained values of MEP quantum molecular descriptors, it can be observed that the oxygen atoms O1 and O2 are recognized as the most important centers of interaction based on electrostatic interaction. The lowest MEP values in these areas were calculated to be around −40 kcal mol−1, indicating that this part of a molecule was susceptible to reactions with positively charged molecular moieties based on electrostatic interactions. Alternatively, hydrogen atoms belonging to the methyl group (C12, H12A, H12B and H12C) are characterized by the highest MEP values of around 21 kcal mol−1, indicating that this part of the molecule is prone to interactions with negatively charged moieties based on electrostatic interactions. Additionally, the ALIE descriptor recognizes the oxygen atoms mentioned above and the vicinity of the benzene ring as targets potentially susceptible to electrophilic attacks because they are characterized by the lowest ALIE values. However, the lowest ALIE values are significantly higher than 200 kcal mol−1, indicating no specific sensitivity toward electrophilic attacks.
The values of the calculated condensed (fr+, fr−, f0r) Fukui function were determined for various parameters, namely electrophilic, nucleophilic and radical attacks, employing the same level of computation46 for the title compound. The condensed or atomic Fukui functions on the rth atom site in the neutral (N), cation and anion for the header species were calculated using the following equations: fr− = [qr(N) − qr(N − 1)] for electrophilic attack, fr+ = [qr(N + 1) − qr(N)] for nucleophilic attack and f0r = [qr(N + 1) − qr(N − 1)]/2 for radical attack. It has been suggested that a dual descriptor (Δf(r)) can differentiate between sites that exhibit electrophilic and nucleophilic behavior at a specific location with the appropriate sign. Hence, the overall formula for obtaining a dual descriptor may be found by comparing the nucleophilic and electrophilic Fukui functions, and when the site indicates a Lewis acid (electrophilic attack, fr−) in the system at point r, Δf(r) < 0. Otherwise, the site ideally symbolizes sites for Lewis base (nucleophilic attack, fr+).48
The Fukui function was successfully performed in the current study using Natural Population Analysis (NPA). In this work, the dual descriptor where Δf(r) < 0 for the most electronegative oxygen atoms (O1 and O2) (as the most preferable sites) in the header composite and where Δf(r) is greater than zero, in accordance with the electron density encompassing the hydrogen atoms of the methyl groups to which they are attached, implies the most nucleophilic attack in the system.
3.6. ELF and LOL analysis
The Electron Localization Function (ELF) and Localized Orbital Locator (LOL) are analytical tools used to study covalent bonding. They identify areas in a molecule where the likelihood of locating a pair of electrons is high.49,50 Fig. S6 and S7† show the ELF and LOL representations for the molecule, respectively. The covalent areas have a high LOL value, indicated by the red zone. The regions of electron depletion within the valence shell and inner shell are represented by blue circles within the nucleus. The core areas exhibit circular localization domains with high electron localization values (around 1), while the chemical bonds C13–H13 and hydrogen atoms are characterized by irregular localization domains (orange) with smaller electron localization values (ranging from 0.8 to 0.9). Both bonds possess a covalent nature and have a high degree of electron localization, which is characteristic of shared electron (covalent) bonding. According to the ELF mapping, the areas near C4, C5, C8, and O1 have lower values, suggesting a lower degree of electron delocalization. However, the regions surrounding the hydrogen atoms exhibit higher values, indicating the presence of localized electrons involved in bonding and non-bonding interactions. A significant ELF or LOL value in a specific area suggests a strong concentration of electrons due to the presence of a covalent bond, a lone pair of electrons, or a nuclear shell in that area. Furthermore, it is evident from the LOL value (Fig. S7†) that the red color extends into the interstitial area between the barrier atoms.3.7. NCI (RDG) analysis
In addition to the currently used IRI method, the renowned topological technique known as the reduced density gradient methodology provides techniques for detecting and displaying non-covalent (NCI) interactions.51 The use of it52 allows for the demonstration and analysis of several noncovalent interactions, including hydrogen bonds, steric conflicts, and interactions caused by van der Waals.53 Analyzing electron intensity and its corresponding derivatives is used to identify noncovalent connections and determine the specific locations where such interactions occur. This study facilitates the visual representation of these connections.54 The occurrence of red flashes in the central area of the RDG iso surface indicates the presence of steric dislike. The RDG scatter curve at 0.010 and 0.05 a. u. exhibits pronounced red surges, which further highlight the repellent effect. It is worth noting that steric effects from the ring system were identified. The strong hydrogen bonds C–H⋯O, which have more powerful favorable interactions, are depicted as blue color patches. The RDG image exhibits significant correlations in the negative range of −0.025 to −0.05 a. u. Additionally, the presence of reddish mixed green flakes indicates the presence of weak non-covalent interactions, which are observed in the 0.01 to −0.02 atomic unit region of the RDG map (Fig. 6).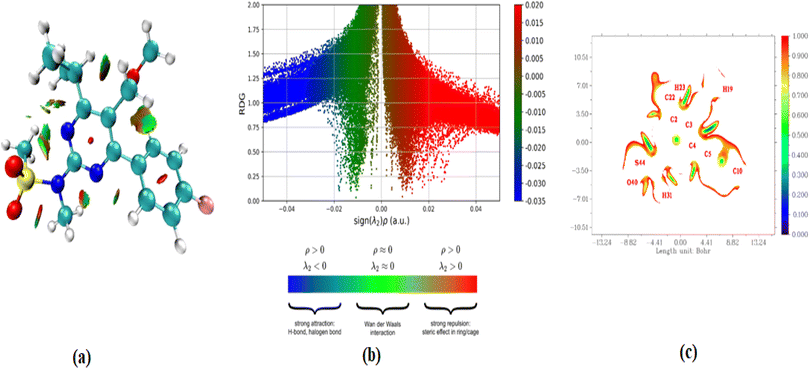 | ||
| Fig. 6 (a–c) RDG plots versus the product of electron density (ρ) the sign of λ2 for gas and solvents; 2D scatter isosurface density and gradient plots illustrating the non-bonded interactions. | ||
3.8. Sensitivity towards autoxidation
The stability of active components is of particular importance when developing new pharmaceutical formulations because they are expected to spend a certain amount of time available on shelves. However, the degradation of active components in pharmaceutical formulations may lead to the formation of genotoxic impurities, with the autoxidation mechanism being one of the main causes.55,56 The susceptibility to this mechanism is a significant challenge from an experimental standpoint because it is tedious and time-consuming. Fortunately, the computational approach can help in these situations because calculations based on the DFT approach can predict the sensitivity of a molecule to this mechanism. Thus, by calculating the bond dissociation energy (H-BDE) values for all bonds between the molecule and its hydrogen atoms,56–58 it is possible to gain insight into the extent to which some molecules might be sensitive to autoxidation. Molecular sites for which H-BDE is in the range between 70 kcal mol−1 to 85 kcal mol−1 are considered important because they indicate sensitivity towards autoxidation, with a range from 85 kcal mol−1 to 90 kcal mol−1 also considered important in this context, but caution must be taken when drawing conclusions.57,58 In the figure (Fig. S8†), we present the H-BDE values for the PMMS molecule.According to the results, there are no values in the range between 70 and 85 kcal mol−1. The two lowest H-BDE values are close to 90 kcal mol−1, and they are located for the hydrogen atoms H11A and H11B. In addition to H-BDE for hydrogen atom H13, for which the calculated H-BDE was 92.27 kcal mol−1, all other H-BDE values are higher than 100 kcal mol−1, indicating that the PMMS molecule is expected to be stable toward the autoxidation mechanism. From the aspect of stability, the obtained results imply that PMMS may be a promising candidate for applications requiring resistance to oxidative degradation, enhancing its potential utility in various chemical and pharmaceutical formulations.
3.9. MD simulations – interactions with water and solubility parameter
To investigate how the PMMS molecule interacts with water, we conducted MD simulations. This process involved surrounding a single PMMS molecule with approximately 2000 water molecules. After obtaining the simulation trajectories, we calculated the radial distribution functions (RDFs) for each atom in the PMMS molecule to identify atoms with pronounced peaks in their RDFs, indicating a close spatial relationship with the other atoms. The RDFs were determined based on the distances between the atoms under observation and the oxygen atoms in the surrounding water molecules. Because the PMMS molecule consists of 47 atoms, we generated 47 distinct RDFs. Among these, four RDFs stood out, showing significant interactions with water molecules, as illustrated in Fig. S9.†The four representative RDFs in Fig. S9† reveal that oxygen atoms O2 and O3 exhibit the strongest interactions with surrounding water molecules, with oxygen O2 having a higher g(r) value than O3. However, the distances at which these RDF peaks occur are around 3 Å, indicating weaker interactions. There were no RDFs for hydrogen atoms with g(r) peaks at distances of approximately 2 Å, suggesting strong interactions with water. Apart from oxygen atoms, nitrogen atom N2 also displayed a relatively sharp g(r) peak at a distance of around 3 Å. The highest g(r) value was calculated for carbon atom C12, but it is unlikely to form significantly strong interactions with water molecules as the peak was at a distance close to 4 Å.
3.10. NLO properties of PMMS
The electronic density of the system, denoted as  , is expressed through a Taylor series expansion relative to the externally applied electric field F. This formalism provides a systematic approach to elucidating the intricate effects that different regions of the molecule have on its overall behavior under external perturbations. By expanding the electronic density in terms of the applied electric field, the method captures the fine details of molecular interactions, offering key insights into the factors governing hyperpolarizability.
Moreover, this framework enhances our ability to pinpoint the molecular contributions that drive NLO responses, which are crucial for applications in fields such as photonics and optoelectronics. The use of a Taylor series expansion in this context allows for the decomposition of electronic density fluctuations, facilitating the identification of the most influential regions within the molecular structure that contribute to the nonlinear optical effects. This nuanced understanding is essential for both theoretical studies and the development of materials with optimized NLO properties.
The electronic density,  , in response to the applied electric field F can be expanded using a Taylor series as follows:
 | (7) |
Based on the previously mentioned equation and the expansion of the dipole moment as a function of the powers of F, a component of the second hyperpolarizability can be expressed as follows:
 | (8) |
The second hyperpolarizability density is defined as follows:
 | (9) |
Using the finite difference method, the second hyperpolarizability density can be precisely calculated by analyzing the electron densities generated under different externally applied electric fields:
 | (10) |
 represents the electron density at a specific spatial point
  when subjected to a low-intensity electric field FZ. The parameter was calculated using the 6-311++G(d,p) basis set. A step size of 0.003 atomic units (a. u.) was chosen for FZ, supported by previous studies that confirm that this value provides adequate precision for such calculations.59 This is further validated by the final two rows in Table 2, where the second hyperpolarizability component γzzzz obtained by integrating the second hyperpolarizability density with FZ of 0.003 a. u. closely matches derived through the Coupled-Perturbed Kohn–Sham (CPKS) method. Table 2 lists the second hyperpolarizability (γzzzz) in atomic units for different atoms within the structures, providing essential insights into the nonlinear optical (NLO) properties of these systems. Table 2 presents the second hyperpolarizability values in the zzzz-direction, measured in atomic units, for different atoms within the PMMS structure.
| Atoms | γzzzz (a. u.) | Atoms | γzzzz (a. u.) | Atoms | γzzzz (a. u.) |
|---|---|---|---|---|---|
| 1(C) | 683.01 | 17(H) | 285.76 | 33(H) | 667.40 |
| 2(C) | 1245.98 | 18(C) | 74.90 | 34(H) | 4116.26 |
| 3(C) | 2924.67 | 19(H) | 192.29 | 35(H) | 1322.62 |
| 4(C) | 4688.47 | 20(H) | 225.74 | 36(C) | 2520.41 |
| 5(C) | 2609.76 | 21(H) | 163.05 | 37(H) | 545.71 |
| 6(C) | 1104.17 | 22(C) | 511.09 | 38(H) | 8262.57 |
| 7(H) | 237.01 | 23(H) | 1366.72 | 39(H) | 1504.94 |
| 8(C) | 3454.05 | 24(C) | 3040.65 | 40(O) | 3723.52 |
| 9(H) | 2001.22 | 25(H) | 2051.09 | 41(O) | 3373.35 |
| 10(C) | 8786.23 | 26(H) | 7586.45 | 42(O) | 216.70 |
| 11(C) | 2847.26 | 27(H) | 922.91 | 43(F) | 18![[thin space (1/6-em)]](https://www.rsc.org/images/entities/char_2009.gif) 582.71 582.71 |
| 12(H) | 2480.43 | 28(C) | 15.43 | 44(S) | 1328.50 |
| 13(C) | 1715.74 | 29(H) | 172.31 | 45(N) | 11![[thin space (1/6-em)]](https://www.rsc.org/images/entities/char_2009.gif) 488.89 488.89 |
| 14(H) | 549.74 | 30(H) | 150.52 | 46(N) | 3119.96 |
| 15(C) | 277.23 | 31(H) | 185.16 | 47(N) | −712.13 |
| 16(H) | 102.79 | 32(C) | 1918.40 | ||
∑γzzzz = 114![[thin space (1/6-em)]](https://www.rsc.org/images/entities/char_2009.gif) 631 631 |
|||||
γCPKSzzzz = 113![[thin space (1/6-em)]](https://www.rsc.org/images/entities/char_2009.gif) 086 086 |
|||||
| Δ% = 1.37 | |||||
The data presented in Table 2 provide a detailed breakdown of the second hyperpolarizability component (γzzzz) for various atoms within an isolated PMMS molecule, expressed in atomic units (a. u.). This table highlights the individual atomic contributions to the overall nonlinear optical (NLO) response of the molecule, which is a critical parameter for understanding its behavior in applied fields.
From Table 2, it is clear that the values of γzzzz vary significantly across different atoms, with certain atoms contributing far more prominently to the molecule's hyperpolarizability than others. For instance, fluorine (F) at position 43 exhibits an exceptionally high value of γzzzz (18![[thin space (1/6-em)]](https://www.rsc.org/images/entities/char_2009.gif) 582.71 a. u.), which indicates a strong local contribution to the molecule's overall second-order NLO properties. Similarly, nitrogen (N) atoms at positions 45 and 46 also show substantial contributions, with values of 11
582.71 a. u.), which indicates a strong local contribution to the molecule's overall second-order NLO properties. Similarly, nitrogen (N) atoms at positions 45 and 46 also show substantial contributions, with values of 11![[thin space (1/6-em)]](https://www.rsc.org/images/entities/char_2009.gif) 488.89 a. u. and 3119.96 a. u., respectively. These high values suggest that these atoms play a pivotal role in the NLO behavior of the PMMS molecule potentially due to their electronic environments or bonding characteristics.
488.89 a. u. and 3119.96 a. u., respectively. These high values suggest that these atoms play a pivotal role in the NLO behavior of the PMMS molecule potentially due to their electronic environments or bonding characteristics.
In contrast, some carbon (C) and hydrogen (H) atoms contribute much smaller values. For example, the carbon atom at position 28 contributes only 15.43 a. u., and hydrogen atoms at positions 16 and 30 contribute 102.79 a. u. and 150.52 a. u., respectively. This variation reflects the diverse electronic interactions within different regions of the molecule, where some atoms exhibit stronger polarizability in response to the applied electric field than others.
The sum of all individual atomic contributions yields a total γzzzz of 114![[thin space (1/6-em)]](https://www.rsc.org/images/entities/char_2009.gif) 631 a. u., which is very close to the value obtained using the Coupled-Perturbed Kohn–Sham (CPKS) method, calculated at 113
631 a. u., which is very close to the value obtained using the Coupled-Perturbed Kohn–Sham (CPKS) method, calculated at 113![[thin space (1/6-em)]](https://www.rsc.org/images/entities/char_2009.gif) 086 a. u. The percentage difference between these two values is 1.37%, indicating excellent agreement between the finite difference approach and the CPKS method. This small deviation underscores the reliability of the finite difference method in capturing the key aspects of the second hyperpolarizability for complex molecular structures, such as PMMS.
086 a. u. The percentage difference between these two values is 1.37%, indicating excellent agreement between the finite difference approach and the CPKS method. This small deviation underscores the reliability of the finite difference method in capturing the key aspects of the second hyperpolarizability for complex molecular structures, such as PMMS.
In addition, Table 2 provides a granular view of the atomic contributions to the second hyperpolarizability of the PMMS molecule. The variations in γzzzz values among atoms highlight the importance of specific atomic environments in determining the molecule's overall NLO properties. The close agreement between the sum of individual contributions and the CPKS calculation further validates the accuracy of the analysis, offering valuable insights for future material design and NLO applications.
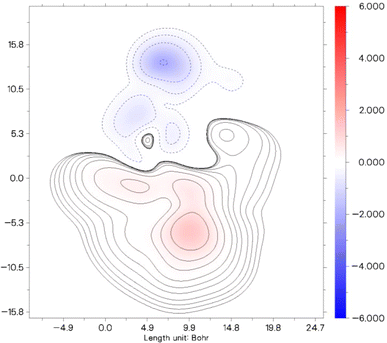
The contour plot displayed illustrates the distribution of the second hyperpolarizability component, γzzzz within a specified molecular system. In this plot, different colors and contour lines indicate varying levels of the second hyperpolarizability density across the molecule, measured in Bohr units.
In Fig. 7, the color gradient from red to blue signifies a range from positive to negative contributions to the γzzzz value. The areas marked in red represent regions of the molecule where the electron density contributes positively to the overall second hyperpolarizability, suggesting stronger NLO (nonlinear optical) effects. Conversely, the blue regions denote negative contributions, where the electron density diminishes the molecule's overall NLO response. This detailed visualization enables a clearer understanding of how different parts of the molecule contribute distinctly to its nonlinear optical characteristics. Particularly, areas of intense red or deep blue are critical, as these signify regions have a significant impact either by augmenting or reducing the molecule's capacity for nonlinear optical behavior. Such insights are essential for tailoring molecular structures for specific NLO applications, as they allow researchers to pinpoint which parts of a molecule to modify to enhance or diminish desired properties.
| ω (a. u.) | 〈α(−ω;ω)〉 isolated | (10−24 esu) embedded | 〈γ(−ω;ω,0,0)〉 isolated | (10−36 esu) embedded | 〈γ(−ω;ω,ω,−ω)〉 isolated | (10−36 esu) embedded |
|---|---|---|---|---|---|---|
| 0.00 | 33.99 | 33.89 | 26.56 | 25.67 | 26.56 | 24.77 |
| 0.02 | 34.13 | 34.02 | 27.17 | 26.24 | 27.78 | 25.93 |
| 0.04 | 34.42 | 34.31 | 28.62 | 27.62 | 30.69 | 28.67 |
| 0.07 | 35.27 | 35.15 | 33.31 | 32.01 | 40.07 | 37.48 |
| 0.09 | 35.88 | 35.75 | 37.18 | 35.62 | 47.80 | 44.69 |
| 0.14 | 40.63 | 40.38 | 92.30 | 85.50 | 158.04 | 144.46 |
| 0.16 | 46.31 | 45.77 | 277.27 | 241.60 | 527.98 | 456.64 |
| 0.19 | 49.19 | 43.17 | 213.53 | −342.86 | 400.51 | −712.27 |
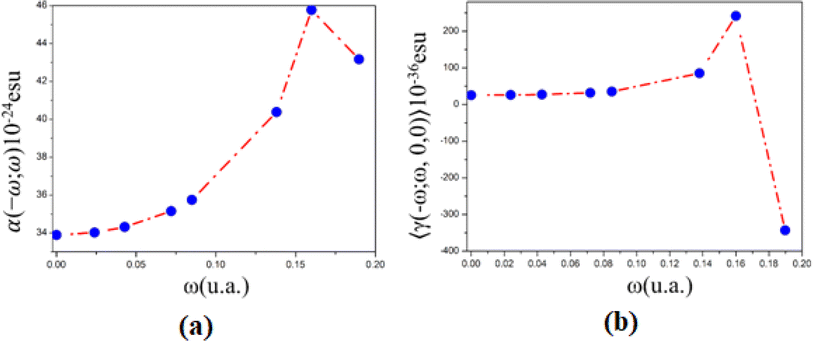 | ||
| Fig. 8 (a) Linear polarizability and (b) second hyperpolarizability as a function of electric field frequencies. | ||
Additionally, the PMMS's linear refractive index, obtained from the linear polarizability, increases monotonically from 1.53 (static value) to 1.57 (532 nm), and at UV region with wavelength between 325 nm and 240 nm, n(ω)-values increase from 1.66 (0.14 a. u.) to 1.78 (0.16 a. u) and decreases to 1.72 (0.19 a. u.).
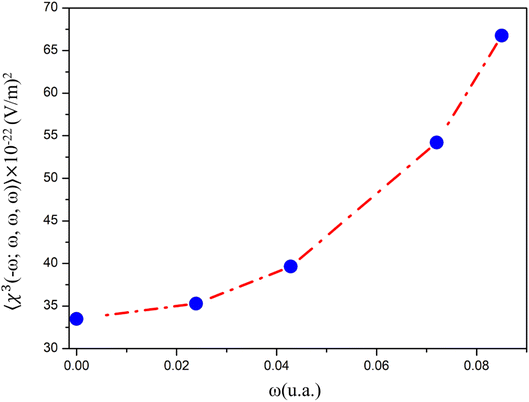
The dynamic third-order nonlinear susceptibility as a function of the electric field frequencies at the non-resonant region (0.0 a. u. < ω < 0.085 a. u.) is shown in Fig. 9. The χ(3)(−ω;ω,ω,−ω)-values show an increase of 100% from the static value, 33.49 × 10⁻²² esu, to 66.75 × 10⁻²² esu (λ = 532 nm). These values are greater than those observed experimentally for chalcone derivatives,63–66 as shown in Table 4, highlighting the potential for the application of PMMS as an optical material.
| Crystals | |
|---|---|
| N-(4-(4-Fluorophenyl)-6-isopropyl-5-(methoxymethyl)pyrimidin-2-yl)-N-methylmethanesulfonamide (PMMS) (present work) | 66.75 |
| 1-(5-Chlorothiophen-2-yl)-3-(2,3-dichlorophenyl)prop-2-en-1-one (CTDMP)63 | 16.21 |
| 2-(4-Methylphenoxy)-N-[(1E)-(4-nitrophenyl)methylene]acetohydrazide (4MNA)64 | 10.24 |
| 1-(4-Aminophenyl)-3-(3,4,5-trimethoxyphenyl)prop-2-en-1-one (APTP)65 | 8.70 |
| (2E)-3-[4-(Methylsulfanyl)phenyl]-1-(4-nitrophenyl)prop-2-en-1-one (4N4MSP)66 | 2.37 |
| (2E)-1-(4-Bromophenyl)-3-[4-methylsulfanyl)phenyl]prop-2-en-1-one (4Br4MSP)66 | 2.30 |
| (2E)-1-(3-Bromophenyl)-3-[4 (methylsulfanyl) phenyl]prop-2-en-1-one (3Br4MSP)66 | 1.99 |
The theoretical predictions, at PCM/DFT/CAM-B3LYP/6-311++G(d,p) level, for the maximum absorption peak positions are 217.53 nm, 218.40 nm and 217.48 nm, see Fig. S10(b),† resulting in relative errors of 8.33%, 13.06% and 9.46%, respectively. These results for the UV-absorption maximum peak position reinforce the fact that the functional and basis set, CAM-B3LYP/6-311++G(d,p), are appropriate for the calculation of the nonlinear optical properties of PMMS.
Furthermore, the dynamic behavior of the nonlinear optical parameters discussed earlier, in the frequency range of 0.14 a. u. < ω < 0.19 a. u. (325 nm < λ < 240 nm), is consistent with the experimental UV-absorption spectra, which exhibit two prominent peaks at frequencies around 0.19 a. u and 0.16 a. u.
3.11. Molecular docking studies-in silico approach
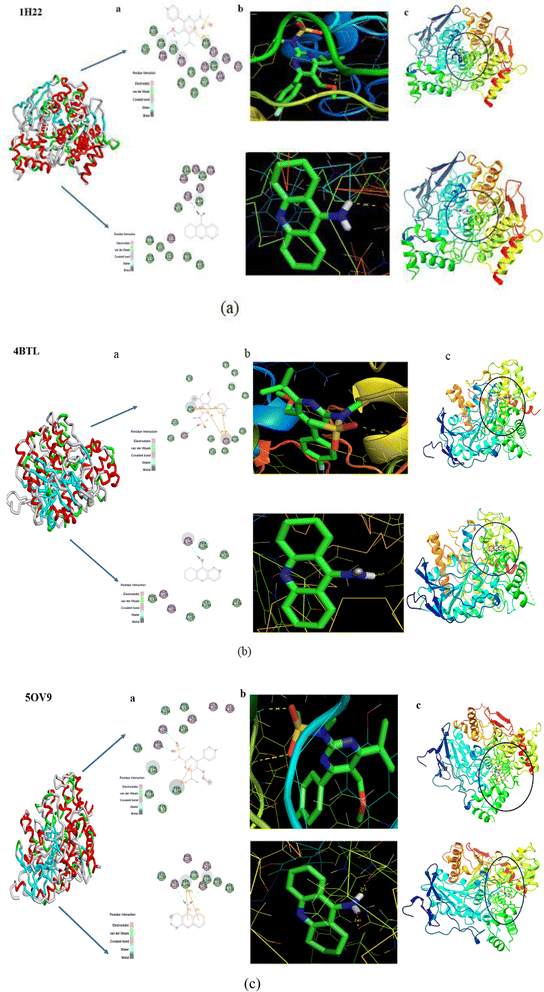
One beneficial approach for predicting the best possible binding interactions between a ligand (header composite) and targets (enzyme/protein) is molecular docking, a simulated method. It has been reported that acetylcholinesterase (AChE) inhibitors improve the amount of acetylcholine in the brain. Additionally, acetylcholinesterase (AChE) inhibitors show potential in successful treatment methods for neurotransmitter disorders.67,68 By inhibiting breakdown, AChE inhibitors increase the quantity of ACh and may improve brain cell activity. Molecular docking studies investigate the binding interactions between AChE inhibitors (proteins) and header composites (ligands) in this regard.The ligand PMMS was chosen to be docked onto protein-targeted receptors that are AChE inhibitors, including 1H22, 4BTL, and 5OV9. The software interface program envisioning the ligand–protein binding energy interactions is AutodockTools.69 After docking the header compound PMMS in the target receptors with docked pose configurations, a minimal binding energy value was found. Table 5 lists the values of the inhibition constant Ki (µm), bond distance, and binding energies (kcal mol−1).
| Target protein | Ligand | Binding energy (kcal mol−1) | Bonded residues | Bond distance (Å) | Estimated inhibition constant Ki (µm) |
|---|---|---|---|---|---|
| a Tacrine was used as a standard inhibitor for AChE inhibitor. | |||||
| 1H22 | PMMS | −7.45 | [TYR 121] H⋯O | 2.2 | 3.47 |
| Tacrinea | −6.38 | N–H⋯O [GLU199] | 2.2 | 20.94 | |
| 4BTL | PMMS | −6.33 | O⋯H–N [SER 293] | 2.2 | 22.76 |
| Tacrinea | −6.11 | N–H⋯O [TYR 341] | 2.2 | 33.09 | |
| 5OV9 | PMMS | −6.18 | [PHE 295] N–H⋯O | 2.1 | 29.37 |
| [ARG 296] N–H⋯O | 2.4 | ||||
| Tacrinea | −6.02 | N–H⋯O [ARG 296] | 2.1 | 38.95 | |
| N–H⋯O [SER293] | 2.0 | ||||
Modern drug discovery relies substantially on minimal binding energy predictions. As per the findings, the ligand PMMS had a strong binding affinity with values ranging from −6.18 to −7.45 (kcal mol−1) when compared to Tacrine (AChE inhibitors),70 as illustrated in Fig. 10. Fig. 10(a–c) illustrates the 2D diagram, that is the 3D structure along with the docked interaction representations. The more potent and larger the compound's ability is to inhibit the activity of those inhibitors, the lower the value of the inhibition constant Ki. The docked composite with the lowest binding energy (best cluster rank in the docking process) is known to have donor–acceptor interactions, which enhance the targeted compound's bioactivity.
It is obvious from Fig. 10 that the oxygen atoms in the header ligand PMMS and the protein receptors form the docking interactions indicated in the yellow dotted lines. Consequently, PMMS confirms a strong binding affinity for the intended receptors and may be used as a powerful potent candidate to treat Alzheimer's disease, a neurodegenerative disease.
4. Conclusion
In summary, we report the synthesis of a novel potential nonlinear optical material, N-(4-(4-fluorophenyl)-6-isopropyl-5-(methoxymethyl)pyrimidin-2-yl)-N-methylmethanesulfonamide (PMMS). Its solid state was corroborated by the SCXRD study. Computational tools were employed to investigate the reactivity, nonlinear optical properties, and in silico docking studies of the PMMS compound. Two oxygen atoms, O1 and O2, were recognized as local reactivity centers by applying the MEP quantum-molecular descriptor because the lowest MEP values were calculated precisely for these two atoms. Moreover, hydrogen atoms of the methyl group were characterized by the highest MEP values but with half the magnitude than those of the mentioned oxygen atoms, indicating that this molecular site is a weaker reactive center in terms of electrostatic interactions. ALIE values also recognized the mentioned oxygen atoms owing to their lowest ALIE values, which are not low enough to exert significant sensitivity toward electrophilic attacks. Although the H-BDE descriptor identified some H-BDE values close to 90 kcal mol−1, they are higher than that threshold, indicating the stability of this molecule to the autoxidation mechanism and consequently suggesting enough stability for the safe shelf life of pharmaceutical formulation based on this molecule. MD simulations and calculations of RDF indicated that the oxygen atom O2 could form the strongest interactions with water molecules because this RDF was characterized by the highest g(r) value among RDFs at the shortest distances.In conclusion, this study demonstrates the significant impact of the crystalline environment on the optical properties of PMMS crystals. The iterative electrostatic method (IEM) used to simulate the PMMS crystal highlights the increase in dipole moment due to the polarization field, with a notable rise from 5.95 D (isolated molecule) to 7.33 D, representing an approximate 23% increase. The linear optical parameters, including the average linear polarizability and the refractive index, exhibited a monotonically increasing behaviour with electric field frequencies up to 0.085 a. u. and showed resonant behaviour in the UV region, indicating potential applications in UV absorption. Similarly, the nonlinear optical parameters, such as the second hyperpolarizability and the third-order nonlinear susceptibility, demonstrated substantial enhancements, particularly in the non-resonant frequency region, where the third-order nonlinear susceptibility increased by 100%. These findings underscore the potential of PMMS as a promising optical material, with superior nonlinear optical properties compared to other organic crystals studied. The UV-absorption spectra further corroborate the dynamic behaviour of the optical parameters, reinforcing the suitability of PMMS for applications in optical and photonic devices. This study lays a foundational understanding for the future research and development of PMMS-based materials in advanced optical technologies.
PMMS has a high binding affinity for the intended receptors (1H22, 4BTL, and 5OV9), making it a promising candidate for treating Alzheimer's and other neurodegenerative diseases.
Data availability
Data can be available upon request from the authors.Conflicts of interest
The authors declare that they have no known competing financial interest or personal relationships that could have appeared to influence the work reported in this paper.Acknowledgements
The authors extend their appreciation to the Deanship of Scientific Research at King Khalid University for funding this work through a Large Group Research Project under grant number RGP1/301/45. The authors also extend their appreciation to J. N. Cheerlin Mishma for her assistance with topology analysis.References
- S. Achelle and N. Ple, Pyrimidine Ring as Building Block for the Synthesis of Functionalized π-Conjugated Materials, Curr. Org. Synth., 2012, 9(2), 163–187, DOI:10.2174/157017912799829067.
- M. Fecková, P. le Poul, F. Bureš, F. Robin-le Guen and S. Achelle, Nonlinear Optical Properties of Pyrimidine Chromophores, Dyes Pigm., 2020, 182, 108659, DOI:10.1016/j.dyepig.2020.108659.
- M. Shakir, B. K. Singh, B. Kumar and G. Bhagavannarayana, Ferroelectricity in Glycine Picrate: An Astonishing Observation in a Centrosymmetric Crystal, Appl. Phys. Lett., 2009, 95(25), 252902, DOI:10.1063/1.3275714.
- B. G. Penn, B. H. Cardelino, C. E. Moore, A. W. Shields and D. O. Frazier, Growth of Bulk Single Crystals of Organic Materials for Nonlinear Optical Devices: An Overview, Prog. Cryst. Growth Char. Mater., 1991, 22(1–2), 19–51, DOI:10.1016/0960-8974(91)90024-7.
- C. Hadad, S. Achelle, I. López-Solera, J. C. García-Martínez and J. Rodríguez-López, Metal Cation Complexation Studies of 4-Arylvinyl-2,6-Di(Pyridin-2-Yl)Pyrimidines: Effect on the Optical Properties, Dyes Pigm., 2013, 97(1), 230–237, DOI:10.1016/j.dyepig.2012.12.023.
- M. Shakir, G. Bhagavannarayana, B. Singh and B. Kumar, Organic Ferroelectrics: A Big Surprise, NPG Asia Mater., 2010 DOI:10.1038/asiamat.2010.48.
- V. P. Petrov, Pyrimidine as a Structural Fragment in Calamitic Liquid Crystals, Mol. Cryst. Liq. Cryst., 2006, 457, 121 CrossRef CAS.
- Y.-C. Lin, C. K. Lai, Y.-C. Chang and K.-T. Liu, Formation of hexagonal columnar phases by heterocyclic pyrimidine derivatives, Liq. Cryst., 2002, 29, 237 CrossRef CAS.
- V. S. Vyas, F. Haase, L. Stegbauer, G. Savasci, F. Podjaski, C. Ochsenfeld and B. V. Lotsch, A Tunable Azine Covalent Organic Framework Platform for Visible Light-Induced Hydrogen Generation, Nat. Commun., 2015, 6(1), 8508, DOI:10.1038/ncomms9508.
- K. Singh and T. Kaur, Pyrimidine-Based Antimalarials: Design Strategies and Antiplasmodial Effects, Med. Chem. Commun., 2016, 7(5), 749–768, 10.1039/C6MD00084C.
- J. Cieplik, M. Stolarczyk, J. Pluta, O. Gubrynowicz, I. Bryndal, T. Lis and M. Mikulewicz, Synthesis and antibacterial properties of pyrimidine derivatives, Acta Pol. Pharm., 2011, 68(1), 57–65 CAS.
- J. D. Bhatt, C. J. Chudasama and K. D. Patel, Pyrazole Clubbed Triazolo[1,5-a]Pyrimidine Hybrids as an Anti-Tubercular Agents: Synthesis, in Vitro Screening and Molecular Docking Study, Bioorg. Med. Chem., 2015, 23(24), 7711–7716, DOI:10.1016/j.bmc.2015.11.018.
- T. Gregorić, M. Sedić, P. Grbčić, A. Tomljenović Paravić, S. Kraljević Pavelić, M. Cetina, R. Vianello and S. Raić-Malić, Novel Pyrimidine-2,4-Dione-1,2,3-Triazole and Furo[2,3-d]Pyrimidine-2-One-1,2,3-Triazole Hybrids as Potential Anti-Cancer Agents: Synthesis, Computational and X-Ray Analysis and Biological Evaluation, Eur. J. Med. Chem., 2017, 125, 1247–1267, DOI:10.1016/j.ejmech.2016.11.028.
- E. P. d. S. Falcao, S. J. de Melo, R. M. Srivastava, M. T. J. d. A. Catanho and S. C. Do Nascimento, SynthesisandAntiinflammatoryActivity of 4-Amino-2-Aryl-5-Cyano-6-{3- and 4-(N-Phthalimidophenyl)} Pyrimidines, Eur. J. Med. Chem., 2006, 41(2), 276–282, DOI:10.1016/j.ejmech.2005.09.009.
- J. Boyer, E. Arnoult, M. Médebielle, J. Guillemont, J. Unge and D. Jochmans, Difluoromethylbenzoxazole Pyrimidine Thioether Derivatives: A Novel Class of Potent Non-Nucleoside HIV-1 Reverse Transcriptase Inhibitors, J. Med. Chem., 2011, 54(23), 7974–7985, DOI:10.1021/jm200766b.
- W. A. El-Sayed, A. E. Rashad, S. M. Awad and M. M. Ali, Synthesis and In Vitro Antitumor Activity of New Substituted Thiopyrimidine Acyclic Nucleosides and Their ThioglycosideAnalogs, Nucleosides, Nucleotides Nucleic Acids, 2009, 28(4), 261–274, DOI:10.1080/15257770902946165.
- O. Alam, S. A. Khan, N. Siddiqui, W. Ahsan, S. P. Verma and S. J. Gilani, Antihypertensive Activity of Newer 1,4-Dihydro-5-Pyrimidine Carboxamides: Synthesis and Pharmacological Evaluation, Eur. J. Med. Chem., 2010, 45(11), 5113–5119, DOI:10.1016/j.ejmech.2010.08.022.
- O. Alam, P. Mullick, S. P. Verma, S. J. Gilani, S. A. Khan, N. Siddiqui and W. Ahsan, Synthesis, Anticonvulsant and Toxicity Screening of Newer Pyrimidine Semicarbazone Derivatives, Eur. J. Med. Chem., 2010, 45(6), 2467–2472, DOI:10.1016/j.ejmech.2010.02.031.
- S. Pant, K. Ranjith Kumar, P. Rana, T. Anthwal, S. M. Ali, M. Gupta, M. Chauhan and S. Nain, Novel Substituted Pyrimidine Derivatives as Potential Anti-Alzheimer’s Agents: Synthesis, Biological, and Molecular Docking Studies, ACS Chem. Neurosci., 2024, 15(4), 783–797, DOI:10.1021/acschemneuro.3c00662.
- M. Vraneš, S. Armaković, A. Tot, S. Papović, N. Zec, S. Armaković, N. Banić, B. Abramović and S. Gadžurić, Structuring of water in the new generation ionic liquid-Comparative experimental and theoretical study, J. Chem. Thermodyn., 2016, 93, 164–171, DOI:10.1016/j.jct.2015.10.001.
- D. R. Evans, H. S. Kwak, D. J. Giesen, A. Goldberg, M. D. Halls and M. Oh-e, Estimation of charge carrier mobility in amorphous organic materials using percolation corrected random-walk model, Org. Electron., 2016, 29, 50–56, DOI:10.1016/j.orgel.2015.11.021.
- S. Armaković, S. J. Armaković and S. Koziel, Optoelectronic properties of curved carbon systems, Carbon, 2017, 111, 371–379, DOI:10.1016/j.carbon.2016.10.022.
- S. Armaković, S. J. Armaković, S. Pelemiš and D. Mirjanić, Influence of sumanene modifications with boron and nitrogen atoms to its hydrogen adsorption properties, Phys. Chem. Chem. Phys., 2016, 18(4), 2859–2870, 10.1039/C5CP04497A.
- N. Nayak, K. S. Prasad, R. R. Pillai, S. Armakovic and S. J. Armakovic, Remarkable Colorimetric Sensing Behavior of Pyrazole-based Chemosensor Towards Cu(II) Ion Detection: Synthesis, Characterization and Theoretical Investigations, RSC Adv., 2018, 8, 18023–18029, 10.1039/C8RA02905A.
- P. Krishna Murthy, N. Poojith, J. T. Sasi Mohan, F. A. P. Osório, C. Valverde, V. Suneetha, P. A. Suchetan, S. J. Armaković, S. Armaković and Y. Sheena Mary, Multifaceted Study of a Y-Shaped Pyrimidine Compound: Assessing Structural Properties, Docking Interactions, and Third-Order Nonlinear Optics, ACS Omega, 2024, 9(7), 7424–7438, DOI:10.1021/acsomega.3c04380.
- P. Krishna Murthy, C. Valverde, V. Suneetha, S. Armakovc, S. J. Armakov, N. Usha Rani and N. Venkatasubba Naidu, An analysis of structural and spectroscopic signatures, the reactivity study of synthetized 4,6-dichloro-2-(methylsulfonyl)pyrimidine: A potential third-order nonlinear optical material, J. Mol. Struct., 2019, 1186, 263–275, DOI:10.1016/j.molstruc.2019.03.021.
- Bruker APEX2, SADABS, SAINT-Plus and XPREP, Bruker AXS Inc., Madison, Wisconsin, USA, 2009 Search PubMed.
- G. M. Sheldrick, A short history of SHELX, Acta Crystallogr., Sect. A: Found. Crystallogr., 2008, 64, 112–122, DOI:10.1107/S0108767307043930.
- M. J. Frisch, G. W. Trucks, H. B. Schlegel, G. E. Scuseria, M. A. Robb, J. R. Cheeseman, G. Scalmani, V. Barone, B. Mennucci and G. A. Petersson, et al., Gaussian 16, Revision C.01, Gaussian, Inc., Wallingford CT, 2016 Search PubMed.
- R. Dennington, T. A. Keith and J. M. Millam, Semichem Inc., GaussView, Version 6, Shawnee Mission, KS, 2016 Search PubMed.
- T. Lu and F. Chen, Multiwfn: A multifunctional wavefunction analyzer, J. Comput. Chem., 2012, 33, 580–592, DOI:10.1002/jcc.22885.
- G. M. Morris, R. Huey, W. Lindstrom, M. F. Sanner, R. K. Belew, D. S. Goodsell and A. J. Olson, Autodock4 and AutoDockTools4: automated docking with selective receptor flexibility, J. Comput. Chem., 2009, 30, 2785–2791, DOI:10.1002/jcc.21256.
- Lu. Chao, Wu. Chuanjie, G. Delaram, C. Wei, W. Lingle, D. Wolfgang, A. R. Gregory, K. D. Markus, R. Ellery, D. V. B. Christopher, A. Robert, A. F. Richard and D. H. Edward, OPLS4: Improving Force Field Accuracy on Challenging Regimes of Chemical Space, J. Chem. Theory Comput., 2021, 17(7), 4291–4300, DOI:10.1021/acs.jctc.1c00302.
- A. D. Bochevarov, E. Harder, T. F. Hughes, J. R. Greenwood, D. A. Braden, D. M. Philipp, D. Rinaldo, M. D. Halls, J. Zhang and R. A. Friesner, Jaguar: A High performance Quantum Chemistry Software Program with Strengths in Life and Materials Sciences, Int. J. Quantum Chem., 2013, 113(18), 2110–2142, DOI:10.1002/qua.24481.
- D. Shivakumar, J. Williams, Y. Wu, W. Damm, J. Shelley and W. Sherman, Prediction of Absolute Solvation Free Energies Using Molecular Dynamics Free Energy Perturbation and the OPLS Force Field, J. Chem. Theory Comput., 2010, 6(5), 1509–1519, DOI:10.1021/ct900587b.
- Z. Guo, U. Mohanty, J. Noehre, T. K. Sawyer, W. Sherman and G. Krilov, Probing Theα-Helical Structural Stability of Stapled P53 Peptides: Molecular Dynamics Simulations and Analysis, Chem. Biol. Drug Des., 2010, 75(4), 348–359, DOI:10.1111/j.1747-0285.2010.00951.x.
- K. J. Bowers, F. D. Sacerdoti, J. K. Salmon, Y. Shan, D. E. Shaw, E. Chow, H. Xu, R. O. Dror, M. P. Eastwood, B. A. Gregersen, J. L. Klepeis, I. Kolossvary, and M. A. Moraes, Molecular Dynamics–Scalable Algorithms for Molecular Dynamics Simulations on Commodity Clusters, in Proceedings of the 2006 ACM/IEEE Conference on Supercomputing – SC '06, ACM Press, New York, New York, USA, 2006, p. 84, DOI:10.1145/1188455.1188544.
- Desmond Molecular Dynamics System, Schrödinger, LLC, New York, NY, 2021 Search PubMed.
- Maestro, Release 2017–4, Schrödinger, LLC, New York, NY, 2017 Search PubMed.
- P. R. Spackman, M. J. Turner, J. J. McKinnon, S. K. Wolff, D. J. Grimwood, D. Jayatilaka and M. A. Spackman, CrystalExplorer : A Program for Hirshfeld Surface Analysis, Visualization and Quantitative Analysis of Molecular Crystals, J. Appl. Crystallogr., 2021, 54(3), 1006–1011, DOI:10.1107/S1600576721002910.
- R. J. Parr, L. V. Szentpaly and S. Liu, Electrophilicity index, J. Am. Chem. Soc., 1999, 121, 1922–1924, DOI:10.1021/ja983494x.
- S. Selvakumari, P. Krishna Murthy, D. Shanthi, I. Ahmad and S. Muthu, Solvent effect on molecular, electronic parameters, topological analysis and Fukui function evaluation with biological studies of imidazo [1, 2-a] pyridine-8-carboxylic acid, J. Mol. Liq., 2023, 382, 121863, DOI:10.1016/j.molliq.2023.121863.
- P. Politzer, P. R. Laurence and K. Jayasuriya, Molecular Electrostatic Potentials: An Effective Tool for the Elucidation of Biochemical Phenomena, Environ. Health Perspect., 1985, 61, 191–202, DOI:10.1289/ehp.8561191.
- P. Politzer and J. S. Murray, The Fundamental Nature and Role of the Electrostatic Potential in Atoms and Molecules, Theor. Chem. Acc., 2002, 108(3), 134–142, DOI:10.1007/s00214-002-0363-9.
- P. Politzer, J. S. Murray and F. A. Bulat, Average Local Ionization Energy: A Review, J. Mol. Model., 2010, 16(11), 1731–1742, DOI:10.1007/s00894-010-0709-5.
- R. G. Parr, and W. Yang, Functional Theory of Atoms and Molecules, Oxford University Press, New York, 1989 Search PubMed.
- R. G. Parr and W. Yang, Density Functional Approach to the Frontier-Electron Theory of Chemical Reactivity, J. Am. Chem. Soc., 1984, 106, 4049–4050 CrossRef CAS.
- C. Lee, W. Yang and R. G. Parr, J. Mol. Struct., 1988, 163, 305–313 CrossRef.
- J. C. Mishma, V. B. Jothy, S. Muthu and A. Irfan, Bonding nature, nucleophilic reactivity and electron excitation of NLO active 2, 6 dichloroindophenol sodium salt (polar and non polar solvents) with topology analysis-bacterial pathogens study, J. Mol. Liq., 2022, 367, 120533 CrossRef.
- S. Rekha, S. Tamilselvan, V. Vetrivelan, J. C. Mishma, S. Kadaikunnan, G. Abbas and S. Muthu, Effect of different solvents, molecular level vibrational energies, electronic, electrostatic, donar-acceptor and pharmaceutical studies on 3-methoxy phenyl acetonitrile-anti depressant agent, J. Mol. Liq., 2023, 386, 122308 CrossRef CAS.
- J. C. Mishma, V. B. Jothy, B. Narayana, S. N. Kodlady, N. S. Alharbi, G. Abbas and S. Muthu, Synthesis, DFT, solvent effect and biological attributes of NLO active 4-bromo-2-((2-(2, 4-Dinitrophenyl) hydrazono) methyl) phenol-Potent drug anti-brain cancer, J. Mol. Struct., 2023, 1289, 135839 CrossRef.
- N. Mani, D. Nicksonsebastin, M. Prasath, J. C. Mishma, S. Kadaikunnan, G. Abbas and S. Muthu, Potential energy surface, effect of solvents in molecular level, experimental spectra (FTIR, Raman, UV–visible & NMR), electronic, and dynamics simulation of isobavachalcone–Anti tuberculosis agent, J. Mol. Liq., 2023, 392, 123465 CrossRef CAS.
- J. C. Mishma, V. B. Jothy, A. Irfan, B. Narayana, S. N. Kodlady and S. Muthu, Solvent potential effects (topological aspects, electron excitation), spectral characterization and biological attributes of NLO active 1-(2, 4-dinitrophenyl)-2-((E)-3-phenylallylidene) hydrazine: Multiple anti tuberculosis agent, J. Mol. Liq., 2023, 376, 121439 CrossRef CAS.
- J. S. Al-Otaibi, Y. S. Mary, Y. S. Mary, J. C. Mishma and A. Manikandan, Investigation of the adsorption and sensor properties of resorcinol (RSL) on X9N9 (X= Al, B, Ga, In) nanorings by DFT and QTAIM analysis with solvent effects, J. Mol. Liq., 2024, 398, 124285 CrossRef CAS.
- S. P. Raillard, J. Bercu, S. W. Baertschi and C. M. Riley, Prediction of drug degradation pathways leading to structural alerts for potential genotoxic impurities, Org. Process Res. Dev., 2010, 14, 1015–1020 CrossRef CAS.
- P. Lienard, J. Gavartin, G. Boccardi and M. Meunier, Predicting drug substances autoxidation, Pharm. Res., 2015, 32, 300–310 CrossRef CAS PubMed.
- G. Gryn’ova, J. L. Hodgson and M. L. Coote, Revising the mechanism of polymer autooxidation, Org. Biomol. Chem., 2011, 9, 480–490 RSC.
- J. S. Wright, H. Shadnia and L. L. Chepelev, Stability of carbon‐centered radicals: Effect of functional groups on the energetics of addition of molecular oxygen, J. Comput. Chem., 2009, 30, 1016–1026 CrossRef CAS PubMed.
- Z. Lin, T. Lu and X. Ding, A theoretical investigation on doping superalkali for triggeringconsiderablenonlinearopticalproperties of Si 12 C 12 nanostructure, J. Comput. Chem., 2017, 38(18), 1574–1582, DOI:10.1002/jcc.24796.
- Z. Liu and T. Lu, ControllablePhotophysical and NonlinearProperties in Conformation Isomerization of Macrocyclic [32]Octaphyrin(1.0.1.0.1.0.1.0) InvolvingHückel and Möbius Topologies, J. Phys. Chem. C, 2020, 124(1), 845–853, DOI:10.1021/acs.jpcc.9b0903.
- Z. Liu and T. Lu, Optical Properties of Novel ConjugatedNanohoops:Revealing the Effects of Topology and Size, J. Phys. Chem. C, 2020, 124(13), 7353–7360, DOI:10.1021/acs.jpcc.9b11170.
- Z. Liu, T. Lu and Q. Chen, An sp-hybridized all-carboatomic ring, cyclo[18]carbon: Electronic structure, electronicspectrum, and opticalnonlinearity, Carbon, 2020, 165, 461–467, DOI:10.1016/j.carbon.2020.05.023.
- A. N. Prabhu, V. Upadhyaya, A. Jayarama and K. Subrahmanya Bhat, Synthesis, growth and characterization of p conjugated organic nonlinear optical chalcone derivative, Mater. Chem. Phys., 2013, 138, 179–185, DOI:10.1016/j.matchemphys.2012.11.041.
- K. Naseema, K. Sujith, K. B. Manjunatha, B. Kalluraya, G. Umesh and V. Rao, Synthesis, Characterization and Studies on the Nonlinear Optical Parameters of Hydrazones, Opt. Laser Technol., 2010, 42(5), 741–748, DOI:10.1016/j.optlastec.2009.11.019.
- H. J. Ravindra, K. Chandrashekaran, W. T. A. Harrison and S. M. Dharmaprakash, Structure and NLO property relationship in a novel chalcone co-crystal, Appl. Phys. B, 2009, 94, 503–511, DOI:10.1007/s00340-008-3248-3.
- E. D. D'Silva, G. K. Podagatlapalli, S. Venugopal Rao and S. M. Dharmaprakash, Study on Third-Order Nonlinear OpticalProperties of 4-Methylsulfanyl Chalcone Derivatives Using PicosecondPulses, Mater. Res. Bull., 2012, 47, 3552–3557, DOI:10.1016/j.materresbull.2012.06.063.
- I. Gulcin, M. Abbasova and P. Taslimi, Synthesis and biological evaluation of aminomethyl and alkoxymethyl derivatives as carbonic anhydrase, acetylcholinesterase and butyrylcholinesterase inhibitors, J. Enzyme Inhib. Med. Chem., 2017, 32, 1174–1182, DOI:10.1080/14756366.2017.1368019.
- H. Lu, J. W. Wu and H. L. Liu, The discovery of potential acetylcholinesterase inhibitors: A combination of pharmacophore modeling, virtual screening, and molecular docking studies, J. Biomed. Sci., 2011, 8, 18, DOI:10.1186/1423-0127-18-8.
- G. M. Morris, D. S. Goodsell, R. S. Halliday, R. Huey, W. E. Hart, R. K. Belew and A. J. Olson, Automated docking using a lamarckian genetic algorithm and empirical binding free energy function, J. Comput. Chem., 1998, 19, 1639–1662 CrossRef CAS.
- D. Alonso, I. Dorronsoro, L. Rubio, P. Munoz, E. G. Palomero and M. D. Monte, Donepezil-tacrine hybrid related derivatives as new dual binding site inhibitors of AChE, Bioorg. Med. Chem., 2005, 13, 6588–6589, DOI:10.1016/j.bmc.2005.09.029.
Footnote |
| † Electronic supplementary information (ESI) available. CCDC 1897523. For ESI and crystallographic data in CIF or other electronic format see DOI: https://doi.org/10.1039/d4ra05681g |
| This journal is © The Royal Society of Chemistry 2024 |

