 Open Access Article
Donor engineering to regulate fluorescence of a symmetrical structure based on a fluorene bridge for white light emission†
Xiaoling Xieab,
Jingjing Liub,
Haocheng Zhaoc,
Lei Yanb,
Yuling Wu *b,
Yanqin Miao
 *b and
Hua Wang
 b
b
aShanxi University of Electronic Science and Technology, Linfen 041000, China
bCollege of Materials Science and Engineering, Taiyuan University of Technology, Taiyuan 030024, China. E-mail: wuyuling@tyut.edu.cn; miaoyanqin@tyut.edu.cn
cDepartment of Mechanical and Electrical Engineering, Shanxi Institute of Energy, Jinzhong 030600, China
First published on 28th October 2024
Abstract
A white organic light-emitting device (WOLED) obtained using blue and yellow complementary colors possesses extremely high optical efficiency. We designed and prepared a completely symmetric D-π-D type efficient blue light small molecule FFA based on octylfluorene as a π bridge, where the undoped device showed efficient blue organic light-emitting device (OLED) performance with a maximum emission wavelength of 428 nm, Commission Internationale de l’Eclairage (CIE) coordinates of (0.17, 0.11) and one of the narrowest full width at half maximum (FWHM) of 35 nm. To improve the matching measure of complementary color materials for achieving white light emission, a yellow light small molecule FCzA was prepared by adjusting the conjugation degree of peripheral electron-donating groups based on the same fluorene-based π bridge with FFA. Undoped devices based on FCzA demonstrated an electroluminescence (EL) emission peak at 576 nm with CIE coordinates of (0.43, 0.49) and a relatively wide FWHM of 130 nm. Ultimately, the white OLED device was modulated with CIE coordinates located at (0.33, 0.38) via proportional regulation with a mixture of FFA and FCzA in a ratio of 10![[thin space (1/6-em)]](https://www.rsc.org/images/entities/char_2009.gif) :
:![[thin space (1/6-em)]](https://www.rsc.org/images/entities/char_2009.gif) 3 as the light-emitting layer.
3 as the light-emitting layer.
1 Introduction
An organic light-emitting diode (OLED) is the most ideal display technology with the following advantages: self-luminosity, more ideal light quality, flexibility, foldability, and portability.1,2 A white OLED (WOLED) can also produce highly efficient saturated white light, low driving voltage, high color saturation, strong environmental adaptability and other characteristics as a member of the OLED family with the advantages of OLEDs, which make it have unique advantages in full color displays and solid state lighting.3–5 WOLEDs are gradually approaching the requirements for white light in the market with continuous deepening research conducted on them, thus becoming a highly respected new green and environmentally friendly flat light source. Further research on novel WOLED materials and devices is imperative as the demand for display technology products and lighting equipment continues to increase.A light-emitting material as a light-emitting layer affects the performance and light color of OLED devices.6–8 In the field of full-color OLED displays, efficient red, green and blue primary color-emitting materials play irreplaceable roles.9–12 According to the principle of colorimetry, white light can be achieved by combining two complementary lights, and it has been proved that the optical efficiency of white light radiation obtained by blue and yellow complementary colors is greatly improved compared with that obtained by any other combination.13–15 Therefore, combining highly efficient blue and yellow light-emitting materials results in optimal white light efficiency.16–19
A fluorene-based moiety, as an efficient blue fluorescent material, has the advantages of strong planar conjugation, high rigidity, strong structural modifiability, high fluorescence quantum efficiency, and good thermal stability, facilitating energy transfer and auxiliary luminescence, and can effectively improve the performance of the device.20–22 Hu et al.23 designed an efficient blue small molecule TFPBI based on a fluorene bridge, and the undoped device based on TFPBI showed efficient dark blue OLED performance with a maximum external quantum efficiency (EQE) of 5.74% and Commission Internationale de l’Eclairage (CIE) coordinates of (0.15, 0.05), with a narrow full width at half maximum (FWHM) of 58 nm. Therefore, fluorene-based small molecules contribute to the preparation of highly efficient and stable OLEDs.24,25
In this paper, we designed and prepared two completely symmetric D-π-D type efficient blue light small molecule FFA and yellow light small molecule FCzA as complementary colors by adjusting the conjugation degree of peripheral electron-donating groups with the same fluorene-based π bridge. The electron cloud of the molecules in the distribution is made more concentrated by replacing the donors with different electron-donating abilities, which is conducive to electron leaps, and the luminescence spectral spreading is reduced. Undoped OLEDs based on FFA as the light-emitting layer show the best performance with a maximum emission wavelength of 428 nm, CIE coordinates of (0.17, 0.11) and the narrowest FWHM of 35 nm. Accordingly, the undoped devices based on FCzA demonstrate an EL emission peak at 576 nm with CIE coordinates of (0.43, 0.49) and a relatively wide FWHM of 130 nm. Ultimately, white OLED devices are modulated with CIE coordinates located at (0.33, 0.38) by proportional regulation based on a mixture of FFA and FCzA at a ratio of 10![[thin space (1/6-em)]](https://www.rsc.org/images/entities/char_2009.gif) :
:![[thin space (1/6-em)]](https://www.rsc.org/images/entities/char_2009.gif) 3 as the light-emitting layer.
3 as the light-emitting layer.
2 Results and discussion
2.1 Material synthesis
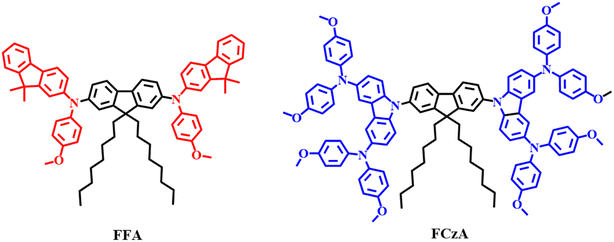
The synthetic routes of intermediates and designed molecules FFA and FCzA are shown in Schemes S1 and S2 (ESI).† The target products FFA and FCzA (Fig. 1) were then synthesized by Buchwald–Hartwig reaction using 9,9-dioctylfluorene as a π-bridge and peripheral groups with varying degrees of conjugation as donors. Both molecules were synthesized by applying a simple process with more than 70% yields, which has the advantage of being low cost and easy to synthesize. The structures and purities of the intermediates and target products were confirmed by 1H NMR and 13C NMR (see ESI†).2.2 Thermal stability
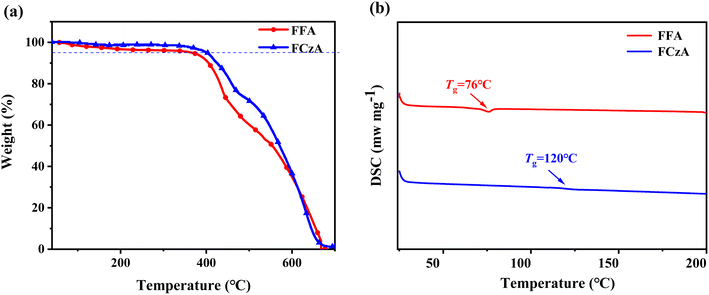
The TGA and DSC analyses shown in Fig. 2 revealed that both target products FFA and FCzA possess more desirable thermal stability with decomposition temperatures (Td, weight loss of 5%) of 403 and 413 °C and glass transition temperatures (Tg) of 76 and 120 °C, respectively, which could facilitate the preparation of electroluminescent devices and maintain long-term stability in operation. Additionally, the Td of FCzA exceeds 10 °C compared to FFA, which may be due to the increase in the conjugation strength of the peripheral to enhance molecular rigidity.2.3 Theoretical calculations
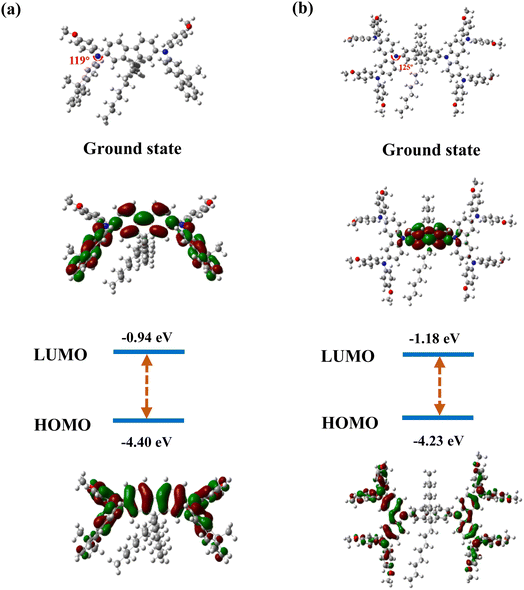
To investigate the molecular structure and the distribution of frontier orbital electrons for FFA and FCzA, the theoretical calculation was carried out at the CAM-B3LYP/6-31G(d,p) level by density-functional theory (DFT) using the Gaussian 09 program and time-dependent density functional theory (TD-DFT) using the Multiwfn 3.8 program. Both molecules are completely symmetrical D-π-D spatial structures with the dihedral angles between the peripheral donor and the octylfluorene π-bridge of 119° and 125°. The increase in the conjugation degree of the donor for FCzA conductively enhances the spatial torsion to avoid the intermolecular π–π stacking (Fig. 3).26 Furthermore, the introduction of different donor groups has a more pronounced effect on the energy level distribution of the molecule and the degree of overlap of the frontal orbitals. For FFA, the highest occupied molecular orbitals (HOMO) are mainly located on the aniline and π-bridges with a small portion extending to the methylfluorene, while the lowest unoccupied molecular orbitals (LUMO) are primarily distributed on the π-bridges and methylfluorene. It can be clearly observed that the overlap region is significantly larger, predicting a higher extent of localized π-conjugation of the molecule, which is more favorable for the concentration of electronic transitions and reduces the spectrum broadening.27,28 However, in the case of FCzA, HOMO is mainly completely distributed on the donor moiety on both sides, but LUMO is almost exclusively distributed on the fluorene moiety in π-bridge completely separating from HOMO. This is mainly due to the enhanced electron-donating ability of the donor of FCzA, which coincides with the HOMO–LUMO gap of 3.05 eV, being lower than that of FFA (3.46 eV).2.4 Photophysical properties
As shown in Fig. 4 and Table 1, the UV-vis and PL spectra of FFA and FCzA were tested to investigate their photophysical properties. When they were in a neat thin film, both materials in a dilute tetrahydrofuran (THF) solution all revealed the two distinct absorption peaks. The absorption peaks located at 346 and 302 nm are caused by the n–π* leaps of the n and π electrons of the N atoms, respectively, while the maximum absorption peaks at 398 and 366 nm originate from the intramolecular charge transfer. The PL spectra of FFA and FCzA exhibit blue emission located at 422 and 449 nm, respectively. Among them, FCzA is red-shifted by 27 nm compared to FFA, which is mainly attributed to the enhanced conjugation of the peripheral electron-donating groups. Furthermore, FFA shows LE-featured fine vibration structures and narrower FWHM (32 nm), indicating that the stronger luminous stability guaranteed by a higher LE state ratio depended on the rigidity of the donor to reduce the geometrical configuration change and reduced Stokes shift. Hence, FFA shows higher photoluminescence quantum yields (PLQY) (66.2) than FCzA (16.7) in the THF solution. Accordingly, FCzA exhibits a wider FWHM (48 nm) and lower PLQY on account of the enhanced CT state ratio by introducing the higher electron-donating capacity groups. The photophysical properties of FFA and FCzA in thin film states were sequentially explored. The UV-vis and PL spectra shown in Fig. 4b all appear slightly red-shifted compared to those in the dilute solution state, which is due to the enhanced interactions between the molecules in the aggregated state.29 The PL spectra of FFA and FCzA still appear as blue emissions located at 448 and 458 nm after redshift, respectively, and the vibration structures are similar to those in the solution.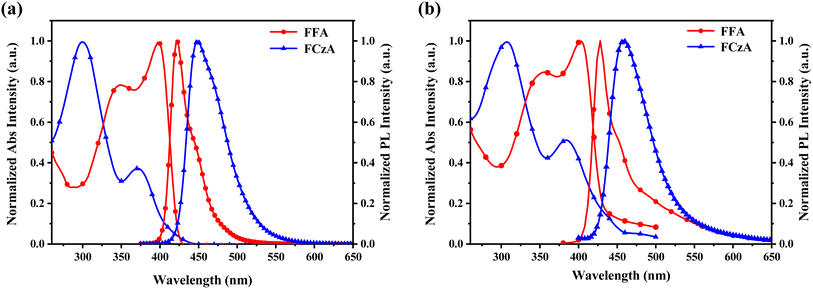 | ||
| Fig. 4 (a) UV-vis spectra and PL spectra in THF (10−5 M), and (b) UV-vis spectra and PL spectra of FFA and FCzA in the film state. | ||
| Td/Tg [°C] | λabs,sol. [nm] | λpl,sol. [nm] | λabs,film [nm] | λpl,film [nm] | Eg [eV] | ΦPL, sol. [%] | ΦPL, film [%] | HOMO/LUMO [eV] | |
|---|---|---|---|---|---|---|---|---|---|
| FFA | 403/76 | 346, 398 | 422 | 355, 403 | 428 | 2.90 | 66.2 | 3.92 | −5.02/−2.12 |
| FCzA | 413/120 | 300, 372 | 449 | 307, 384 | 458 | 2.85 | 16.7 | 0.28 | −5.16/−2.31 |
To investigate the excited state properties of the synthesized products, the solvatochromic characteristic in PL spectra was carried out in various polarity solvents (Table S2, ESI†). The PL emission spectra of FFA and FCzA exhibit correspondingly and progressively red-shifted of 14 and 27 nm, respectively, when the ten typical solvents changed from the low-polarity hexane (f = 0.0012) to the high-polarity acetonitrile (f = 0.305), suggesting that intramolecular charge transfer occurred in excited states.30,31 Among them, the redshift range of FFA with the narrowest emission spectrum is smaller than that of FCzA, indicating that FFA is dominated by the LE state character than FCzA. However, for FCzA, the fully segregated HOMO/LUMO distribution may lead to increasing the intramolecular charge transfer (ICT) process between the π-bridges and peripheral donor groups and widening FWHMs of 130 nm, which is much greater than that of FFA (35 nm). It is noteworthy that the above phenomenon is consistent with DFT calculations and both materials also show blue emission in highly polar solvents.
The Lippert–Mataga formula32 (eqn (1)) is used to calculate the excited state dipole moments (μe) to investigate the relationship between the Stokes shift and the solvent polarity f(ε, n) of FFA and FCzA in a low versus high polarity solvent:
 | (1) |
The linear fit of the Stokes shift expressed in Fig. 5c for FFA to the solution polarity f(ε, n) shows a straight line with increasing slopes. The dipole moment (μe) of 13.1 D indicates that the Stokes displacement of FFA is less affected by the solvent polarity, whose excited state is dominated by the LE state component, resulting in a narrower emission spectrum.33
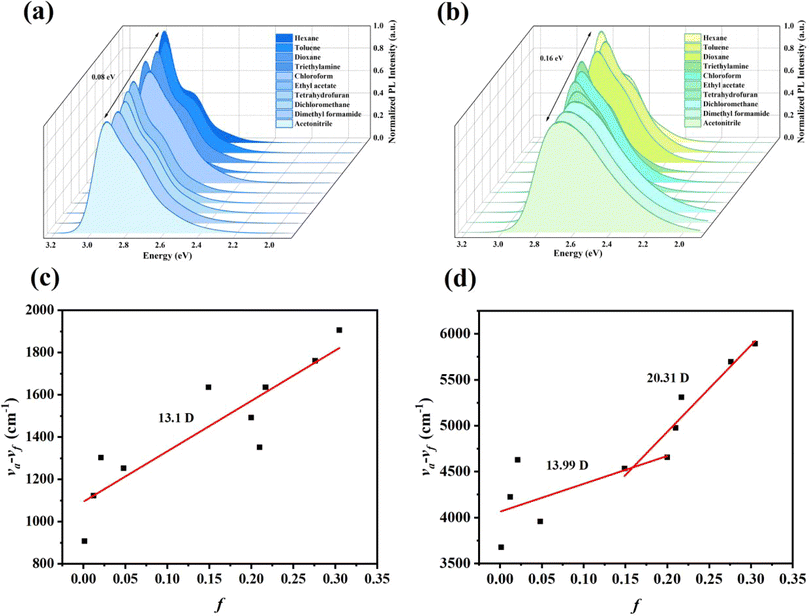 | ||
| Fig. 5 PL spectra of FFA and (a) FCzA (b) in different polar solvents; Stokes shift-solvent polarity diagrams of FFA (c) and FCzA (d). | ||
Fig. 5d plots the Stokes displacement and f(ε, n) for FCzA using linear fitting to obtain two straight lines with different slopes. The change in Stokes displacement with the solvent polarity is small in the low polarity solvent with the dipole moment (μe) of 13.99 D. In the high-polarity solvent, FCzA exhibits a higher slope of fitted lines with the dipole moment (μe) calculated to be 20.31 D. The different linearity of Stokes shifts with solvent polarity demonstrates that FCzA possesses the characteristics of both LE and CT states in the lowest singlet excited state, with the LE component dominating in the low-polarity solvents and the CT component dominating in the high-polarity solvents. Moreover, the transient state fluorescence spectra of FFA and FCzA in the neat film (Fig. 6a and b) exhibit double-exponential decays with fitted lifetimes of 0.40/2.26 and 0.88/3.38 ns, respectively, indicating that the two excited states are generated by radiative transition.34 The nanosecond short lifetimes with the proportions of double exponential life are used to speculate that the excited state of both molecules is dominated by the LE state accompanied by a small ratio of the CT state. Meanwhile, the low-temperature phosphorescence spectra of FFA and FCzA in toluene solution shown in Fig. 6c and d were tested to verify the structure–property relationship by calculating the singlet–triplet energy gaps (ΔEST) of 0.36 and 0.27 eV with the room-temperature fluorescence spectra, respectively, which λf and λp were the wavelengths corresponding to the initial line of the short wave segment of fluorescence and phosphorescence and the intersection with the X-axis, respectively.35 The ΔEST around 0.30 eV confirms our previous speculation of the simultaneous existence of the LE and CT states:36,37
 | (2) |
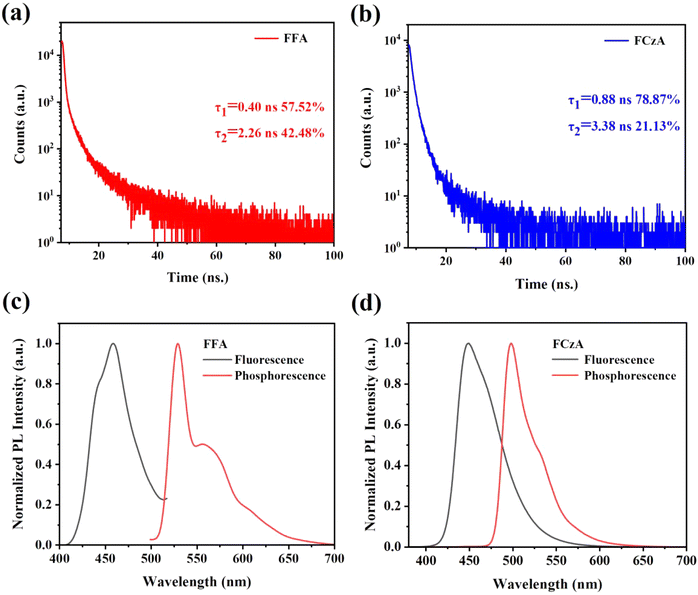 | ||
| Fig. 6 Transient PL decay curves for FFA (a) and FCzA (b) in the film state; room temperature (300 K) PL and phosphorescence (77 K) spectra of FFA (c) and FCzA (d). | ||
2.5 Calculation of excited state simulations
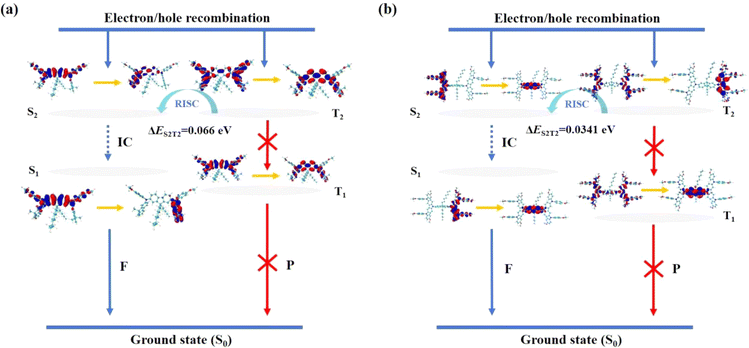
To further characterize the electronic transitions, the singlet and triplet states of FFA and FCzA were analyzed by natural transition orbital (NTO) analysis. NTOs provide the minimum representation of electronic transitions using an NTO pair consisting of two different electronic states: electron- and hole-orbital. In the S1 state of FFA (Fig. 7a), the holes are distributed on the peripheral groups and the central π-bridge, and the electrons are mainly distributed on the peripheral dimethylfluorene, with a partial overlap between the electrons and holes, indicating that the localized excited (LE) state is dominant, accompanied by a weaker charge transfer (CT) state. For FCzA (Fig. 7b), the holes are mainly distributed on the peripheral donor groups and the electrons are distributed on the intermediate π-bridges, which is a completely separated state and exhibits the characteristics of the CT state. For the T1 and T2 states of both materials, the distributions of holes and electrons on the donor and π-bridges show both overlap and separation, demonstrating that the two excited states exist simultaneously with the hybridization of LE and CT states in molecular skeletons.382.6 Electrochemical properties and energy levels
The cyclic voltammetry (CV) curves of FFA and FCzA were obtained using an electrochemical workstation under a nitrogen atmosphere, as shown in Fig. S10,† and the corresponding data are summarized in Table 2. The HOMO energy levels of FFA and FCzA are calculated to be −5.02 and −5.16 eV from the initial oxidation potentials, respectively, while the optical energy gaps (Eg) are calculated to be 3.0 and 3.0 eV based on the starting positions of the absorption peaks in the absorption spectra of the compounds in combination with eqn (1), respectively (ESI†). The corresponding LUMO energy levels are determined to be −2.02 and −2.16 eV by HOMO energy levels and optical band gap Eg of FFA and FCzA, respectively. Because the π-bridges of these molecules are the same, and the donor groups are different, the HOMO and LUMO energy levels of FCzA are deeper than those of FFA, which is easier to match with other transporting layers adjacent to it.2.7 Electroluminescent properties
To explore the EL performance of FFA and FCzA, we designed and prepared non-doped blue light OLED devices with a structure for ITO/MoO3 (3 nm)/NPB (40 nm)/TCTA (10 nm)/FFA (device I) or FCzA (device II) (20 nm)/TPBi (45 nm)/LiF (1 nm)/AL (120 nm), in which MoO3 was used as the hole-injection layer (HIL), N,N′-bis(naphthalen-1-yl)-N,N′-bis(phenyl)benzidine (NPB) acted as the hole-transporting layer (HTL), 4,4′,4′′-tris(N-carbazolyl)-triphenylamine (TCTA) employed as the electron-blocking layer, (EBL) 1,3,5-tris(N-phenylbenzimidazol-2-yl)benzene (TPBi) served as the electron-transporting layer (ETL) and hole-blocking layer (HBL), and LiF conducted as the electron-injection layer (EIL) (Fig. 8a).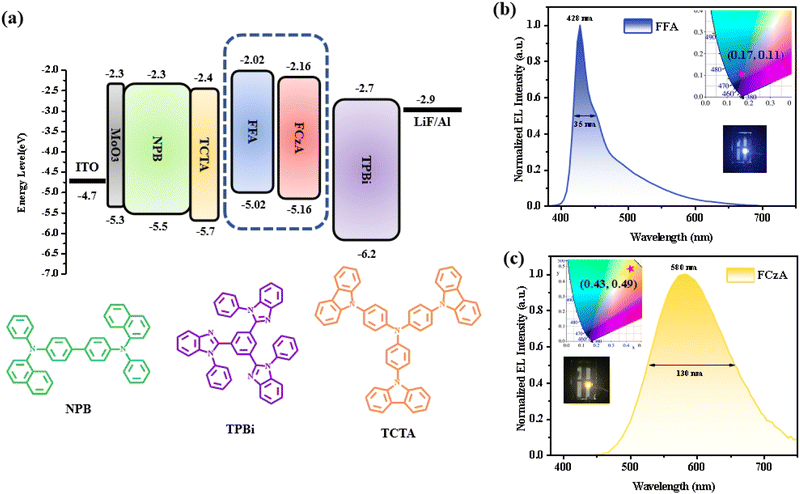 | ||
| Fig. 8 Device energy level structure (a) and EL spectra of FFA (b) and FCzA (c) with CIE coordinates. | ||
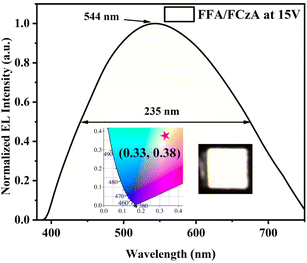
As shown in Fig. 8b, the device based on FFA demonstrates the deep-blue light emission with CIE located at (0.17, 0.11) accompanied by excellent spectral stability for EL spectra at 421 nm under different driving voltages (Fig. S11†), which is very close to the standard blue coordinates of NTSC (0.14, 0.08). Most importantly, the EL spectra of the FFA-based devices have a very narrow FWHM value of only 35 nm, which corresponds to the excellent color saturation of some light-emitting quantum dots.39,40 Meanwhile, the FCzA-based device (Fig. 8c) achieves the yellow light emission with EL spectra at 576 nm, FWHM of 130 nm and the CIE coordinates located at (0.43, 0.49), which is attributed to the enhanced conjugation of the peripheral groups, resulting in spectral red-shift. Furthermore, the FWHM of the EL spectra in an FCzA-based device can reach 130 nm, which could form a very good complementary color with FFA. The intersection between the PL spectra of FFA and absorption spectra of FCzA in dilute solutions and thin films (Fig. 4) also satisfies this condition. Hence, white light emission is achieved with CIE coordinates located at (0.33, 0.38) by mixing FFA and FCzA in a certain ratio with 10![[thin space (1/6-em)]](https://www.rsc.org/images/entities/char_2009.gif) :
:![[thin space (1/6-em)]](https://www.rsc.org/images/entities/char_2009.gif) 3 as the light-emitting layer, as shown in Fig. 9.
3 as the light-emitting layer, as shown in Fig. 9.
The current density–voltage–luminance (J–V–L), current efficiency–luminance–power efficiency (CE–L–PE), and external quantum efficiency–luminance (EQE–L) curves of the FFA- and FCzA-based OLED devices are shown in Fig. S12.† The turn-on voltage (Von) of FFA-based device I at 4.0 V is significantly lower than that of FCzA-based device II at 4.9 V.
3 Conclusions
We designed and synthesized two small molecules (FFA and FCzA) with different luminescence colors by changing the conjugation degree of the donor N-(4-methoxyphenyl)-9,9-dimethyl-9H-fluoren-2-amine and N3,N3,N6,N6-tetrakis(4-methoxyphenyl)-9H-carbazole-3,6-diamine, both of which are based on symmetric D-π-D with 9,9-dioctylfluorene as a π-bridge and exhibit blue light emission in both solution and film states. FFA and FCzA achieved stable blue and yellow light emissions with CIE coordinates located at (0.17, 0.11) and (0.43, 0.49), respectively, which conforms to the principle of complementary color to achieve the near-white light emission with CIE coordinates located at (0.33, 0.38) at a ratio of 10![[thin space (1/6-em)]](https://www.rsc.org/images/entities/char_2009.gif) :
:![[thin space (1/6-em)]](https://www.rsc.org/images/entities/char_2009.gif) 3.
3.
Data availability
Data are available upon request from the authors. The data that support the findings of this study are available from the corresponding author, Yuling Wu, upon reasonable request.Conflicts of interest
There are no conflicts to declare.Acknowledgements
This work was financial supported by the National Natural Science Foundation of China (6207031407, 62074109), the Joint Funds of the National NSFC (U21A20492), Shanxi Province Natural Science Foundation (202103021224076, 202203021211284), Science and Technology Innovation Talent Team Project of Shanxi Province (202204051001013).References
- C. Adachi, M. A. Baldo, M. E. Thompson and S. R. Forrest, J. Appl. Phys., 2001, 90, 5048–5051 CrossRef CAS.
- S. R. Forrest, D. D. C. Bradley and M. E. Thompson, Adv. Mater., 2003, 15, 1043–1048 CrossRef CAS.
- S. Gong, N. Sun, J. Luo, C. Zhong, D. Ma, J. Qin and C. Yang, Adv. Funct. Mater., 2014, 24, 5710–5718 CrossRef CAS.
- W. Song, I. Lee and J. Y. Lee, Adv. Mater., 2015, 27, 4358–4363 CrossRef CAS PubMed.
- J. Xie, J. Yao, Y. Dai, Q. Sun, D. Yang, X. Qiao and D. Ma, J. Mater. Chem. C, 2022, 10, 8349–8355 RSC.
- J.-X. Chen, W.-W. Tao, Y.-F. Xiao, K. Wang, M. Zhang, X.-C. Fan, W.-C. Chen, J. Yu, S. Li, F.-X. Geng, X.-H. Zhang and C.-S. Lee, ACS Appl. Mater. Interfaces, 2019, 11, 29086–29093 CrossRef CAS PubMed.
- H. Cho, H.-N. Lee, Y.-C. Jeong, Y. M. Park, K.-T. Kang and K. H. Cho, ACS Appl. Mater. Interfaces, 2020, 12, 45064–45072 CrossRef CAS PubMed.
- Q. Lu, J. Wang, Y. Miao, Y. Guo, G. Wang, J. Dong, M. Zhao and H. Wang, Chem. Eng. J., 2022, 450, 138439 CrossRef CAS.
- N. Aizawa, Y.-J. Pu, H. Sasabe and J. Kido, Org. Electron., 2012, 13, 2235–2242 CrossRef CAS.
- R. Braveenth, H. Lee, S. Kim, K. Raagulan, S. Kim, J. H. Kwon and K. Y. Chai, J. Mater. Chem. C, 2019, 7, 7672–7680 RSC.
- Y. Xia, Z. Liu, J. Li, C. Fan, G. Li, B. Zhao, Y. Wu, H. Wang and K. Guo, Org. Electron., 2020, 85, 105826 CrossRef CAS.
- Y.-L. Zhang, Q. Ran, Q. Wang, Y. Liu, C. Hänisch, S. Reineke, J. Fan and L.-S. Liao, Adv. Mater., 2019, 31, 1902368 CrossRef CAS PubMed.
- V. Anand, R. Mishra and Y. Barot, Dyes Pigm., 2021, 191, 109390 CrossRef CAS.
- Z. Ma, X. Ji, M. Wang, X. Chen, D. Wu, X. Li, C. Shan and Z. Shi, Nano Sel., 2022, 3, 280–297 CrossRef CAS.
- J. Saghaei, M. Koodalingam, P. L. Burn, A. Pivrikas and P. E. Shaw, Org. Electron., 2022, 100, 106389 CrossRef CAS.
- R. Dong, D. Liu, J. Li, M. Ma, Y. Mei, D. Li and J. Jiang, Mater. Chem. Front., 2022, 6, 40–51 RSC.
- W.-Y. Hung, L.-C. Chi, W.-J. Chen, Y.-M. Chen, S.-H. Chou and K.-T. Wong, J. Mater. Chem., 2010, 20, 10113–10119 RSC.
- C.-J. Zheng, J. Wang, J. Ye, M.-F. Lo, X.-K. Liu, M.-K. Fung, X.-H. Zhang and C.-S. Lee, Adv. Mater., 2013, 25, 2205–2211 CrossRef CAS PubMed.
- X. Zhu, Y. Li, Z. Wu, C. Lin, D. Ma, Z. Zhao and B. Z. Tang, J. Mater. Chem. C, 2021, 9, 5198–5205 RSC.
- T. Liu, G. Xie, C. Zhong, S. Gong and C. Yang, Adv. Funct. Mater., 2018, 28, 1706088 CrossRef.
- T. Liu, L. Zhu, C. Zhong, G. Xie, S. Gong, J. Fang, D. Ma and C. Yang, Adv. Funct. Mater., 2017, 27, 1606384 CrossRef.
- Y. Seo, I. Na, Y. Kim, H. Chae, K. Oh, J. Yang, S. Yoon and M.-K. Joo, Org. Electron., 2021, 91, 106067 CrossRef CAS.
- X. Qiu, S. Ying, C. Wang, M. Hanif, Y. Xu, Y. Li, R. Zhao, D. Hu, D. Ma and Y. Ma, J. Mater. Chem. C, 2019, 7, 592–600 RSC.
- S. H. Lee, T. Nakamura and T. Tsutsui, Org. Lett., 2001, 3, 2005–2007 CrossRef CAS PubMed.
- Z. Peng, S. Tao, X. Zhang, J. Tang, C. S. Lee and S.-T. Lee, J. Phys. Chem. C, 2008, 112, 2165–2169 CrossRef CAS.
- R. Wang, T. Li, C. Liu, M. Xie, H. Zhou, Q. Sun, B. Yang, S.-T. Zhang, S. Xue and W. Yang, Adv. Funct. Mater., 2022, 32, 2201143 CrossRef CAS.
- H. Jiang, P. Tao and W.-Y. Wong, ACS Mater. Lett., 2023, 5, 822–845 CrossRef CAS.
- J. Y. Kim, D. Yokoyama and C. Adachi, J. Phys. Chem. C, 2012, 116, 8699–8706 CrossRef CAS.
- J. Jin, C. Duan, H. Jiang, P. Tao, H. Xu and W.-Y. Wong, Angew. Chem., Int. Ed., 2023, 62, e202218947 CrossRef CAS PubMed.
- P. Tao, Z. Lv, F.-Q. Zhao, X.-K. Zheng, H. Jiang, W. Li, Y. Deng, S. Liu, G. Xie, W.-Y. Wong and Q. Zhao, lnorg. Chem., 2023, 62, 1202–1209 CrossRef CAS PubMed.
- M. Li, Y. Liu, R. Duan, X. Wei, Y. Yi, Y. Wang and C.-F. Chen, Angew. Chem., Int. Ed., 2017, 56, 8818–8822 CrossRef CAS PubMed.
- S. Sasaki, G. P. C. Drummen and G.-i. Konishi, J. Mater. Chem. C, 2016, 4, 2731–2743 RSC.
- A. Li, Z. Ma, J. Wu, P. Li, H. Wang, Y. Geng, S. Xu, B. Yang, H. Zhang, H. Cui and W. Xu, Adv. Opt. Mater., 2018, 6, 1700647 CrossRef.
- R. H. Young, C. W. Tang and A. P. Marchetti, Appl. Phys. Lett., 2002, 80, 874–876 CrossRef CAS.
- K. Shizu, J. Lee, H. Tanaka, H. Nomura, T. Yasuda, H. Kaji and C. Adachi, Pure Appl. Chem., 2015, 87, 627–638 CrossRef CAS.
- S. Hirata, Y. Sakai, K. Masui, H. Tanaka, S. Y. Lee, H. Nomura, N. Nakamura, M. Yasumatsu, H. Nakanotani, Q. Zhang, K. Shizu, H. Miyazaki and C. Adachi, Nat. Mater., 2015, 14, 330–336 CrossRef CAS PubMed.
- Q. Zhang, D. Tsang, H. Kuwabara, Y. Hatae, B. Li, T. Takahashi, S. Y. Lee, T. Yasuda and C. Adachi, Adv. Mater., 2015, 27, 2096–2100 CrossRef CAS PubMed.
- P. Tao, X. Lü, G. Zhou and W.-Y. Wong, Acc. Mater. Res., 2022, 3, 830–842 CrossRef CAS.
- D. Zhang, L. Duan, C. Li, Y. Li, H. Li, D. Zhang and Y. Qiu, Adv. Mater., 2014, 26, 5050–5055 CrossRef CAS PubMed.
- D. Zhang, L. Duan, Y. Zhang, M. Cai, D. Zhang and Y. Qiu, Light: Sci. Appl., 2015, 4, e232 CrossRef CAS.
Footnote |
| † Electronic supplementary information (ESI) available. See DOI: https://doi.org/10.1039/d4ra05803h |
| This journal is © The Royal Society of Chemistry 2024 |

