 Open Access Article
Design and performance optimization of a lattice-based radial flow field in proton exchange membrane fuel cells
Minggang Zheng *a,
Han Liang
 a,
Wenxie Bua,
Xing Luoa,
Xiaoxu Hua and
Zhihu Zhang
 b
b
aSchool of Mechanical Engineering, Shandong Jianzhu University, 1000 Fengming Road, Jinan, 250101, Shandong, China. E-mail: why1318@sdjzu.edu.cn
bSchool of Mechanical Engineering, Tianjin University, Tianjin 300350, China
First published on 15th October 2024
Abstract
The design of the flow field structure in Proton Exchange Membrane Fuel Cells (PEMFCs) plays a pivotal role in determining their electrochemical performance. This study presents a lattice-based radial flow field configuration designed to improve PEMFC efficiency. The difference between the flow field and the traditional flow field is that the flow field is segmented by a small cylindrical rib instead of a longer rib. The research employs COMSOL Multiphysics simulation software to establish the model of the operating conditions of PEMFCs, focusing on analyzing how the number of rib branches and the minimum rib radius influence the oxygen distribution, water distribution, and pressure drop in the system. The results demonstrate that varying the number of rib branches and the minimum radius of the cylindrical ribs has a pronounced impact on the PEMFC's performance. Furthermore, a comparative analysis of multiple design configurations reveals the optimal operating parameters. Specifically, within a quarter of the computational domain, the configuration featuring a minimum rib radius of 0.135 cm and six rib branches delivers the best electrochemical performance.
1 Introduction
In recent years, Proton Exchange Membrane Fuel Cells (PEMFCs) have emerged as a prominent technology in the energy sector because of their efficient energy conversion and storage capabilities.1,2 PEMFCs are also noted for their clean energy characteristics. They primarily produce only water and a small amount of heat as byproducts, unlike traditional internal combustion engines, which emit substantial amounts of harmful gases and particulate matter. This positions PEMFCs as a crucial option within clean energy technologies.3–5PEMFCs are composed of two major components: the bipolar plates (BPPs) and the Membrane Electrode Assembly (MEA). The MEA itself consists of Gas Diffusion Layers (GDLs), Catalytic Layers (CLs), and the Proton Exchange Membrane (PEM).6,7
BPPs are crucial components of PEMFCs, responsible for separating the oxidant and fuel gases, releasing reaction products and heat, conducting current between cells, and providing structural support throughout the fuel cell module.8,9 The design of the flow field on the plates significantly impacts the performance of PEMFCs; optimizing the flow field structure can enhance cell performance, operational efficiency, and stability, and facilitate gas transport within the MEA.10
Recent studies have explored the mass transport and electrochemical performance of traditional flow field designs such as parallel, serpentine, and interdigitated, revealing their significant impact on PEMFC output.11,12 Researchers have investigated optimizing the geometric or cross-sectional shapes of traditional flow fields. For instance, Chowdhury et al.13 examined the effects of different flow fields and rib widths on PEMFC performance, finding that the optimal electrochemical performance occurs when the rib-to-flow field width ratio is 1, while 1![[thin space (1/6-em)]](https://www.rsc.org/images/entities/char_2009.gif) :
:![[thin space (1/6-em)]](https://www.rsc.org/images/entities/char_2009.gif) 2 ratio offers better mechanical stability and lower voltage loss. Lan et al.14 utilized surrogate models to optimize flow field geometries, resulting in structures with increased power and current densities. These optimized flow fields showed 10.54% increase in current density compared to traditional designs.
2 ratio offers better mechanical stability and lower voltage loss. Lan et al.14 utilized surrogate models to optimize flow field geometries, resulting in structures with increased power and current densities. These optimized flow fields showed 10.54% increase in current density compared to traditional designs.
Recent advancements in radial flow field designs have led to significant achievements, with studies showing that adding obstacles within the flow field enhances oxygen convection and gas diffusion, thereby improving output characteristics and water management.15–17 Friess et al.18 first proposed a multi-flow field radial flow field model with flow control rings, demonstrating that it operates with half the pressure drop of a serpentine flow field while achieving higher current density and better water removal and mass transfer performance. Razmara et al.19 employed topological optimization to develop a novel radial flow field, greatly enhancing energy utilization efficiency. Kim et al.20 developed a two-phase flow model for the three-dimensional complex flow fields of PEMFCs. Their study found that the Forchheimer inertial effects enhanced the removal of liquid water from the flow field and increased the additional flow resistance around the baffles, thereby improving the interface and mass transfer of the liquid water. Therefore, compared to PEMFCs with conventional flow fields, PEMFCs with complex flow field structures are expected to achieve substantial improvements in high current density cell performance and operational stability.
Li et al.21 introduced a radial spiral groove flow field, comparing its electrochemical performance, cathode water concentration distribution, and pressure drop to traditional flow fields. This design improved average water concentration, reduced pressure drop, and enhanced drainage performance, mitigating water flooding risks.
The rationality of flow field structure is crucial for improving the performance of proton exchange membrane fuel cells (PEMFCs). The most common method to evaluate PEMFC performance is through polarization curves.
Shen et al.22 conducted numerical and experimental verification using a single PEMFC with different flow patterns. The results were compared with a conventional single serpentine flow field, revealing that as the number of blockages increases, the average synergistic angle between gas velocity and cathode concentration gradient decreases, while the effective mass transfer coefficient increases, leading to improved PEMFC performance.
This study introduces a novel lattice-style radial flow field with cylindrical ribs, which divide the flow field into progressively expanding flow zones. The key variables of rib size, quantity, and branch curvature are analyzed using COMSOL Multiphysics simulation software,23 providing cost-effective experimental data aligned with actual results closely.24 The study concludes with a variable analysis of the PEMFC cathode side output, identifying optimal values for the key variables within the flow field.25
2 Numerical mode
2.1 Model description
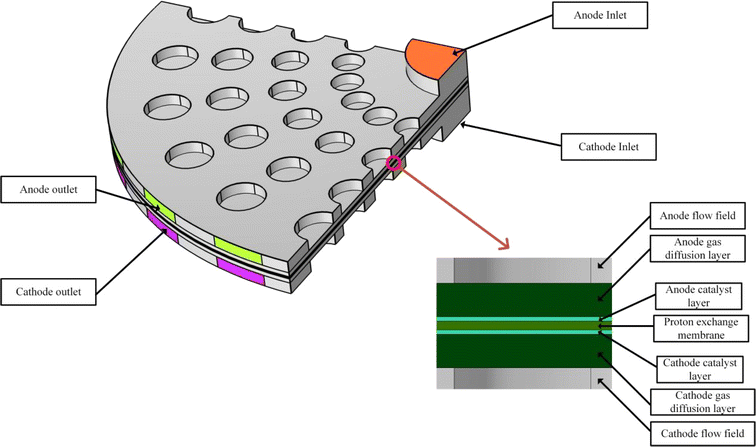
Fig. 1 presents a three-dimensional geometric model of the lattice-type radial flow field. The model consists of seven key components: cathode and anode flow fields, cathode and anode gas diffusion layers (GDLs), cathode and anode catalyst layers, and the proton exchange membrane (PEM). The gas inlets for both the anode and cathode are positioned at the center of the bipolar plate. The gas outlets are positioned at the outer edges of the rib plates, with each outlet located at the center of two adjacent rib plates, creating a one-to-two correspondence. Variations in the distance and number of rib plate branches can influence the size and distribution of gas outlets. The flow field on the bipolar plate is segmented into four identical sectoral flow regions. Each sector features five gas outlets and six cylindrical ribs, which gradually increase in radius from the center to the edge. The minimum rib radius of the innermost cylindrical ribs is 0.135 cm, with an increment of 0.02 cm. The minimum rib radius and the number of rib branches are crucial factors influencing the performance of the structure. Table 1 lists the main geometric parameters used in the model.26| Parameter | Value | Unit |
|---|---|---|
| Flow field length | 3 | cm |
| Flow field width | 0.1 | cm |
| Flow field depth | 0.1 | cm |
| Thickness of gas diffusion layer (GDL) | 3.8 × 10⁻² | cm |
| Thickness of catalyst layer (CL) | 5 × 10⁻³ | cm |
| Thickness of membrane | 1 × 10⁻² | cm |
| Rib height | 0.001 | cm |
| Minimum rib radius | 0.135 | cm |
| Number of rib plate branches | 6 | |
| Incremental rib radius | 2 × 10⁻² | cm |
| The distance between individual ribs | cm | |
| Entry radius | 0.1 | cm |
| The straight length of the export | 0.47 | cm |
| Height of export | 0.1 | cm |
2.2 Model assumptions
The assumptions for the model are as follows:27,28 (1) the PEMFC operates under steady-state conditions; (2) the gases within the PEMFC are treated as incompressible ideal gases; (3) the airflow within the flow field is considered to be laminar; (4) gravity effects are neglected within the flow field; (5) the operating temperature of the PEMFC is 180 °C.2.3 Governing equations
The three-dimensional simulation model of the proton exchange membrane fuel cell (PEMFC) incorporates five conservation laws: the mass conservation equation, momentum conservation equation, energy conservation equation, species conservation equation, and current conservation equation.29,30 These conservation laws are expressed by the following formulas.
 | (1) |
In this formula, ρ represents the fluid density (kg m−3); α represents the porosity in porous media. In the anode and cathode flow α = 0.1. In the anode and cathode diffusion layers, α = 0.4. In the anode and cathode catalytic layers, α = 0.4.  represents the fluid velocity vector (m); Sn represents the source term (kg (m−3 s−1)) of the mass.
Sn refers to the formula for the three-phase reaction zone in the catalytic layer:
 | (2) |
 | (3) |
In both of the forms described above, MH2 represents the molar mass fraction of H2, MH2O represents the molar mass fraction of the water, MO2 represents the molar mass fraction of O2; F represents the Faraday constant, in which the value is 96![[thin space (1/6-em)]](https://www.rsc.org/images/entities/char_2009.gif) 485 (C mol−1); i represents the current density at the current operating voltage (A m−3); Sna and Snc represent the formula for the anode and cathode respectively.
485 (C mol−1); i represents the current density at the current operating voltage (A m−3); Sna and Snc represent the formula for the anode and cathode respectively.
 | (4) |
In this formula, p represents the pressure of the fluid in the working state (Pa); μ represents the dynamic viscosity coefficient of the gas participating in the reaction (Pa s); Sz represents the source term of momentum, in the anode and cathode flow, Sz = 0. Because in the catalytic layer and the gas diffusion layer, the fluid speed is low, and the direction distribution is more accordant, so the influence of the viscous force and inertial force can be ignored on the fluid component.
According to Darcy's law, the equation can be further simplified and can be expressed in the following form:  , where KP represents the gas permeability of the porous media domain (m2).
 | (5) |
In this formula, cp represents the constant pressure specific heat (J (kg−1 K−1)); T represents the working temperature (K); keff represents the effective thermal conductivity (W (m−1 K−1)); SB represents the energy source term.
Considering the resistance, chemical reaction, phase transition, and overpotential generated during PEMFC operation, the source term can be expressed as:
| SB = I2Rohm + βṁH2O, ghrxn + rwhL + ja,cδ | (6) |
In this formula, I represents the current density (A m−2); Rohm is the ohmic resistivity (Ω m), β is the effective ratio of fuel chemical energy and heat energy; ṁH2O represents the gaseous water generation rate (kg s−1); hrxn represents the reaction enthalpy change (kJ mol−1); rw represents the rate of aqueous phase change (mol s−1); hL is for the phase transition enthalpy (kJ mol−1); ja,c represents the exchange current density between the anode and the cathode (A m−3); δ is the sum of the activation overpotential and the overconcentration (V).
 | (7) |
In this formula, cr represents the component concentration of each gas; Dreff represents the diffusion coefficient of each gas component (m2 s−1); Sr represents the source terms of each gas component (kg (m−3 s−1)); subscript r represents different gas components.
| ∇(keffa∇φa) + Sφa = 0 | (8) |
| ∇(keffb∇φb) + Sφb = 0 | (9) |
In this formula, keff represents the electrical conductivity (S m−1); φ represents the electric potential (V); subscript a represents the solid state; subscript b represents the membrane state; Sφa represents the source term of the electron current (A); the Sφb represents the source term of the proton current (A).
2.4 Boundary conditions
For the inlet boundary, Table 2 provides the mole fractions of each component and the inlet velocity, while pressure is applied at the outlet.10 Additionally, symmetric boundary conditions are set on both sides of the GDL and CL.31| Parameter | Value | Unit |
|---|---|---|
| Electrical conductivity of the membrane | 9.825 | S m−1 |
| Electrical conductivity of GDLs | 222 | S m−1 |
| Anode inlet velocity | 2.5 | m s−1 |
| Cathode inlet velocity | 2.5 | m s−1 |
| Permeability of porous electrode | 2.36 × 10⁻¹² | m2 |
| Permeability of CL | 2.36 × 10⁻¹² | m2 |
| Permeability of GDLs | 1.18 × 10⁻¹¹ | m2 |
| Reference exchange current density of cathode | 0.001 | A m−2 |
| Reference exchange current density of anode | 100 | A m−2 |
| Working current used for gas flow calculation | 14.13 | |
| Reference pressure | 1.01 × 10⁵ | Pa |
| Fuel cell temperature | 453.15 | |
| Cell voltage | 0.95 | |
| Anode stoichiometry | 1.2 | |
| Cathode stoichiometry | 2 | |
| Inlet H2O mass fraction | 0.023 | |
| Inlet H2 mass fraction | 0.734 | |
| Inlet O2 mass fraction | 0.228 | |
| Porosity of GDLs | 0.4 | |
| Gas pore volume fraction of catalyst layer | 0.3 | |
| Volume fraction of electrolyte in catalyst layer | 0.3 |
2.5 Model validation
![[thin space (1/6-em)]](https://www.rsc.org/images/entities/char_2009.gif) 811, 187
811, 187![[thin space (1/6-em)]](https://www.rsc.org/images/entities/char_2009.gif) 185, 407
185, 407![[thin space (1/6-em)]](https://www.rsc.org/images/entities/char_2009.gif) 158, and 708
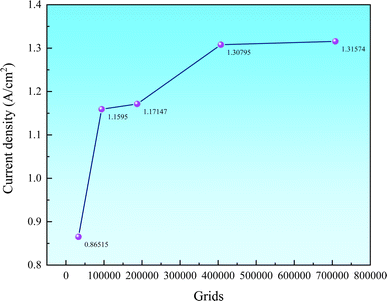
158, and 708![[thin space (1/6-em)]](https://www.rsc.org/images/entities/char_2009.gif) 146 elements—are tested at an output voltage of 0.4 V. The physical model features six rib branches, with a minimum rib radius of 0.135 cm in these simulations.
146 elements—are tested at an output voltage of 0.4 V. The physical model features six rib branches, with a minimum rib radius of 0.135 cm in these simulations.Fig. 2 proves the current density for the five models at 0.4 V. If the deviation in current density between models with varying mesh resolutions is below 1%, the impact of mesh resolution on the computation is negligible. The Fig. 2 shows that when the mesh count is 407![[thin space (1/6-em)]](https://www.rsc.org/images/entities/char_2009.gif) 158 or higher, the variation in current density is less than 0.6%. Considering the balance between computational time and accuracy, the model with 407
158 or higher, the variation in current density is less than 0.6%. Considering the balance between computational time and accuracy, the model with 407![[thin space (1/6-em)]](https://www.rsc.org/images/entities/char_2009.gif) 158 mesh elements was chosen as the final computational scheme.
158 mesh elements was chosen as the final computational scheme.
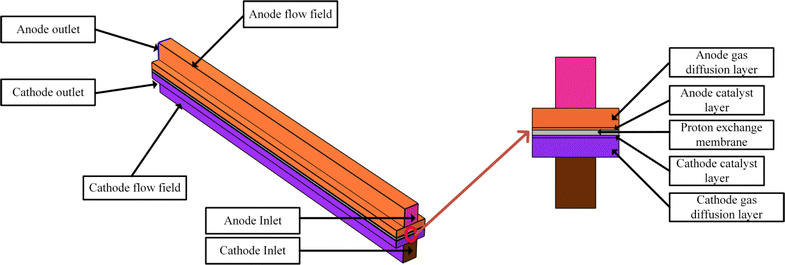
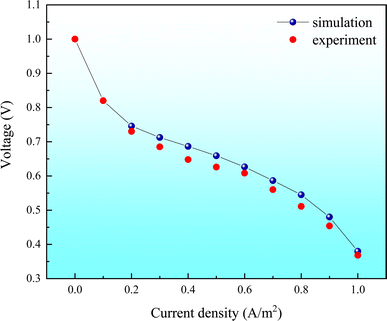
Fig. 4 compares the polarization curves from our simulations with those obtained experimentally. The figure shows that the simulated polarization curves align closely with experimental results, indicating the accuracy of the simulation under similar conditions. As only the flow field structure will be modified in subsequent simulations of the lattice-style radial flow field, while all other parameters remain unchanged, the parameters used for the straight flow field are applicable to the lattice-style radial flow field model.
3 Results and discussion
3.1 Impact of rib branch count on PEMFC performance
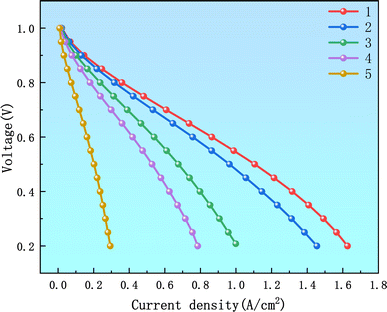
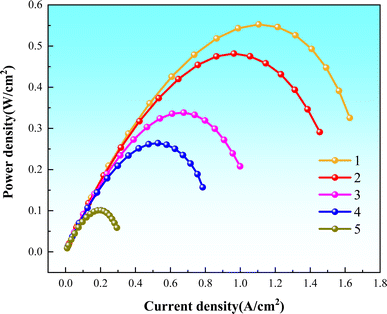
In this comparison, the variable is the number of rib branches. The minimum rib radius is fixed at 0.135 cm, and the increment in rib radius is kept constant at 0.02 cm. Case 1 has 6 rib branches, Case 2 has 5 rib branches, Case 3 has 4 rib branches, Case 4 has 3 rib branches, and Case 5 has 2 rib branches. Table 3 shows the specific parameter settings for five different schemes.| Case number | Number of rib branches | Minimum rib radius | Number of gas outlets |
|---|---|---|---|
| Case 1 | 6 | 0.135 cm | 5 |
| Case 2 | 5 | 0.135 cm | 4 |
| Case 3 | 4 | 0.135 cm | 3 |
| Case 4 | 3 | 0.135 cm | 2 |
| Case 5 | 2 | 0.135 cm | 1 |
The research indicates that increasing the number of rib branches optimizes reactant distribution at the electrodes by enhancing flow characteristics. Optimizing the radial flow field shape improves gas flow paths, reduces dead zones, and mitigates flow short-circuiting, thereby enhancing mass transfer. This, in turn, increases electrode utilization, promotes more reactions, and elevates the output current density, ultimately boosting PEMFC performance.
The results suggest that more number of rib branches promotes flow characteristics, leading to a more uniform transport of gases across the electrode surface and reducing the loss of concentration polarization. The effectiveness of the mechanism is reflected in the significantly improved availability of reactants at the electrode interface, which enhances the electrochemical reaction rates.
As shown in Fig. 5, Case 1 has a higher current density under the same voltage than the other four cases. Increasing the number of rib branches effectively promotes the uniform distribution of reactants across the electrode surface, significantly reducing the occurrences of non-uniform reactions.
Fig. 6 presents the power density curves for the five different rib configurations. It is apparent that increasing the number of rib branches enhances the power density of PEMFCs, attributable to a marked improvement in gas diffusion efficiency and the availability of reactants.
By increasing the number of rib branches, not only is the mass transfer efficiency of the reactants enhanced, but the internal water management of PEMFCs is also improved, preventing performance losses due to flooding.
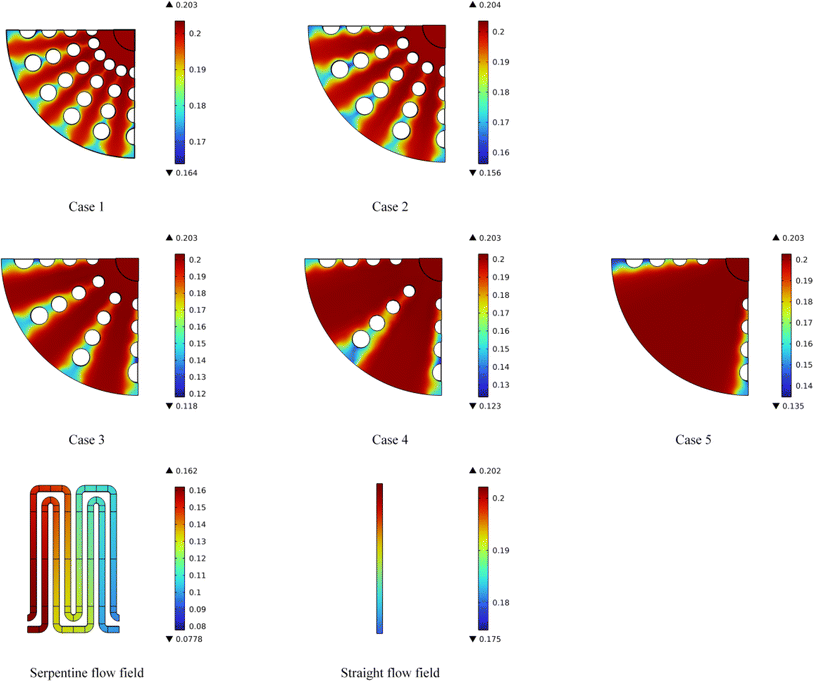 | ||
| Fig. 7 The oxygen distribution in the flow field cross-section for Case 1 to Case 5 and two types of conventional flow fields. | ||
The straight and serpentine flow fields exhibit high oxygen concentrations at the inlet, but experience significant depletion by the midpoint, potentially resulting in insufficient reactant supply.
In contrast, the lattice-style radial flow field maintains a higher average oxygen concentration compared to the straight flow field and serpentine flow fields. There is no significant reduction in oxygen concentration in the flow regions between each pair of rib plates.
Comparing the five cases of radial flow fields, the result reveals that Case 1 shows the most uniform oxygen distribution. Case 1 displays the best gas uniformity; even in the areas adjacent to the gas outlet, where the oxygen concentration is lowest, there is no excessively strong reduction in oxygen levels. The minimum mole fraction of oxygen in this region is 0.164, which is higher than that in the other four lattice-based radial flow fields. In contrast, the other four cases show significant oxygen depletion in the regions adjacent to the gas outlets and rib plates. Under the condition of multiple outlets, the gas flow velocity will be distributed more evenly, avoiding regions of excessively high or low velocities. The multiple rib branch design promotes cross-regional gas flow interactions, ensuring accordant gas distribution across the electrode surface and enhancing reaction efficiency.
The streamlined design of cylindrical ribs can reduce the frictional resistance during flow. Compared to other rib shapes (such as square ribs), cylindrical ribs generate less resistance in the flow and can guide oxygen to flow along the rib surfaces, thereby reducing the formation of low-pressure zones and stagnant regions. This characteristic is crucial for improving flow efficiency and reducing flow resistance.
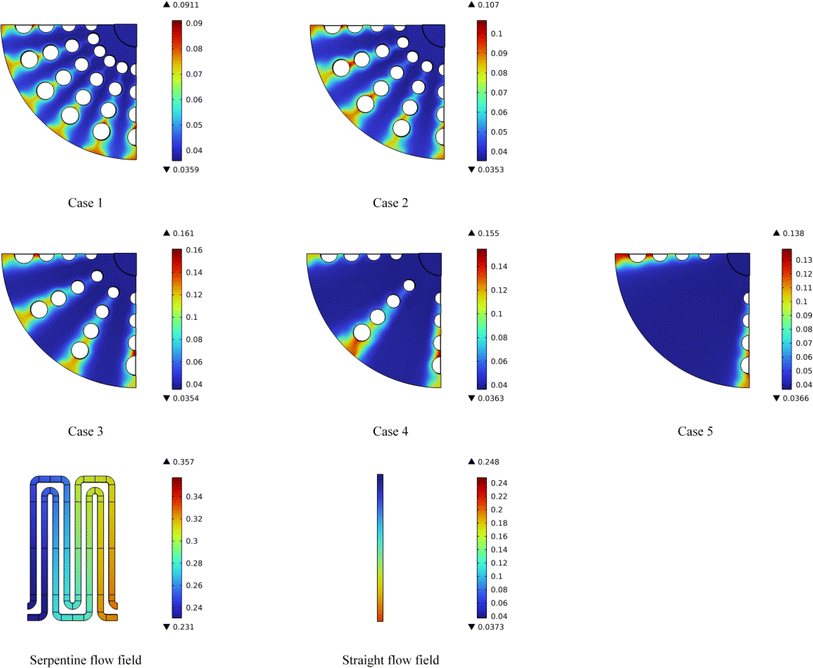 | ||
| Fig. 8 The water distribution in the flow field cross-section for Case 1 to Case 5 and two types of conventional flow fields. | ||
The results indicate a significantly lower water mole fraction, suggesting a more uniform water distribution. This implies that the flow field design has optimised fluid transport and distribution, which is essential for efficient PEMFC operation.
Among the cases studied, Case 1 demonstrated the most efficient water removal performance compared to the other cases. It can be observed that Case 1 shows the most uniform distribution of water concentration and the difference between the maximum and minimum molar fraction of water is only 0.0552, demonstrating that the proposed flow field significantly reduces localized water accumulation, which can lead to flooding and hinder gas diffusion in the cathode flow field. In contrast, the differences in mole fractions from Case 2 to Case 5 are 0.0717, 0.1256, 0.1187, and 0.1014, respectively. The analysis reveals that the maximum mole fraction of water concentration in the five cases with a lattice-type radial flow field is significantly lower than in traditional serpentine and straight flow fields.
The highest water concentration in Case 1 is 0.0911, whereas the maximum value in the serpentine flow field reaches 0.357—a difference of 75.7%. Similarly, the maximum value in the straight flow field is 0.248, resulting in a difference of 63.2%. Fig. 8 shows that both the serpentine and straight flow fields demonstrate a significant increase in water concentration at the gas outlet compared to the inlet, particularly the straight flow field has a more evident phenomenon. The result indicates that the serpentine and straight flow fields are less effective at removing water, especially near the outlet where water accumulation can obstruct gas flow and reduce reaction efficiency.
Incorporating fluid mechanics theory provides further insights into why the lattice-type radial flow field outperforms the serpentine and straight flow fields in water removal. First, the lattice-type radial flow field is segmented by multiple cylindrical ribs, forming several evenly distributed radial flow fields. This design minimizes the transport distance of the fluid within the flow field, allowing water and gas to reach the outlet via the shortest path, thereby reducing water's residence time in the flow field. This optimized flow path minimizes regions of local stagnation, thereby improving water drainage and mitigating the risk of flooding, which is critical for maintaining gas diffusion and overall fuel cell performance.
From the perspective of gas–liquid interaction, the multi-cylindrical rib structure of the lattice-type flow field not only increases the surface area for gas–liquid contact but also enhances the mixing between the two phases. This design reduces fluid separation and reattachment phenomena, improving gas mass transfer efficiency and ensuring a more complete exchange between oxygen and water. In contrast, the serpentine flow field, with its complex turns and longer flow paths, tends to generate low-pressure zones and vortices at bends and corners. These unstable flow conditions lead to water retention, hinder oxygen transport, and ultimately diminish the overall drainage performance and reaction efficiency of the system.
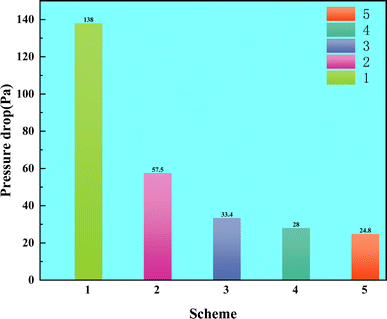
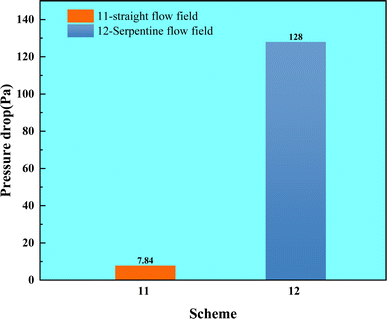
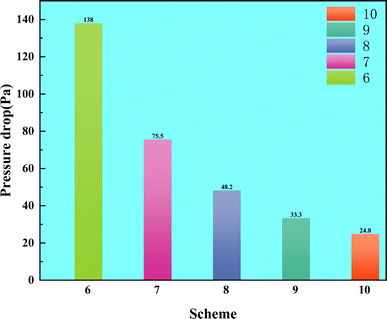
Comparing Fig. 9 and 10, the result reveals that the pressure drops from Case 2 to 5 are significantly lower than those of the serpentine flow field. Notably, the maximum pressure drop for Case 2 is only 57.5 Pa, representing a 55.09% improvement in pressure drop performance relative to the serpentine flow field. This can be attributed to the following three reasons:
(1) In the lattice-based radial flow field, gas enters from the center and exits at the periphery, resulting in shorter flow paths compared to the serpentine flow field. The proposed flow field causes the gas to reach the reaction area more directly, whereas the serpentine flow field causes the gas to pass through curved flow fields, leading to increase flow resistance and pressure drop.
(2) The design of curved flow fields in the serpentine flow field complicates the gas flow, which increases resistance and induces vortex effects. The flow field can lead to gas accumulation and uneven flow rates in certain areas, thereby elevating the pressure drop. In contrast, the lattice-based radial flow field features more linear flow paths, resulting in fewer changes in gas flow direction and reduced kinetic energy losses.
(3) The pressure gradient distribution in the lattice-based radial flow field is more uniform. In the serpentine flow field, the winding nature of the gas flow typically results in a large pressure gradient between the gas inlet and outlet, which further exacerbates pressure drop. Conversely, the lattice-based radial flow field employs cylindrical rib plates to segment the flow field, ensuring shorter gas pathways while promoting uniform distribution of gas within the flow field, which leads to a smaller pressure difference between the gas inlet and outlet, resulting in a lower pressure drop.
3.2 Impact of minimum rib radius on PEMFC performance
In this comparison, the variable is the minimum rib radius, with the rib radius increment set to 0.02 cm and the number of rib branches maintained at 6. Case 10 has a minimum rib radius of 0.05 cm, Case 9 has 0.075 cm, Case 8 has 0.1 cm, Case 7 has 0.125 cm, and Case 6 has 0.135 cm.Table 4 shows the specific parameter settings for five different schemes.| Case number | Number of rib branches | Minimum rib radius | Number of gas outlets |
|---|---|---|---|
| Case 6 | 6 | 0.135 cm | 5 |
| Case 7 | 6 | 0.125 cm | 5 |
| Case 8 | 6 | 0.100 cm | 5 |
| Case 9 | 6 | 0.075 cm | 5 |
| Case 10 | 6 | 0.050 cm | 5 |
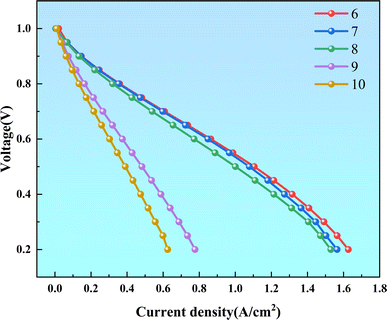
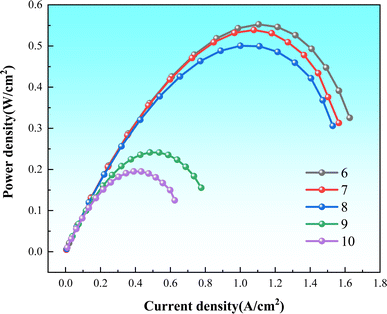
In the current density range of 0.5 to 1.2 A m−2, Case 8 exhibits lower current density compared to Case 6 and Case 7 at the same voltage. However, the polarization curves of Case 6 and Case 7 almost overlap within this range. The main difference between Case 6 and Case 7 appears in the current density range of 1.2 to 1.7 A m−2, where Case 6 demonstrates better electrochemical performance.
From the research results, it can be analyzed that Case 6 and Case 7 exhibit similar flow distribution and reactant transport efficiency. Therefore, their polarization curves are very similar. In the lattice-based radial flow field, larger cylindrical ribs concentrate fluid flow more effectively on the electrode surface, enhancing local reactant concentration and improving electrochemical reaction rates. Additionally, larger cylindrical ribs help reduce flow resistance, thereby enhancing overall mass transfer efficiency. However, the designs of Case 8, Case 9, and Case 10 may introduce dead zones or insufficient mixing in local flow areas, leading to lower current densities. This indicates that smaller cylindrical ribs in the lattice radial flow field are not conducive to electrochemical reactions.
In summary, although the performance of the lattice radial flow field improves with increasing minimum rib radius, this trend eventually levels off. At a minimum rib radius of 0.135 cm, PEMFCs exhibit optimal electrochemical performance (Fig. 12).
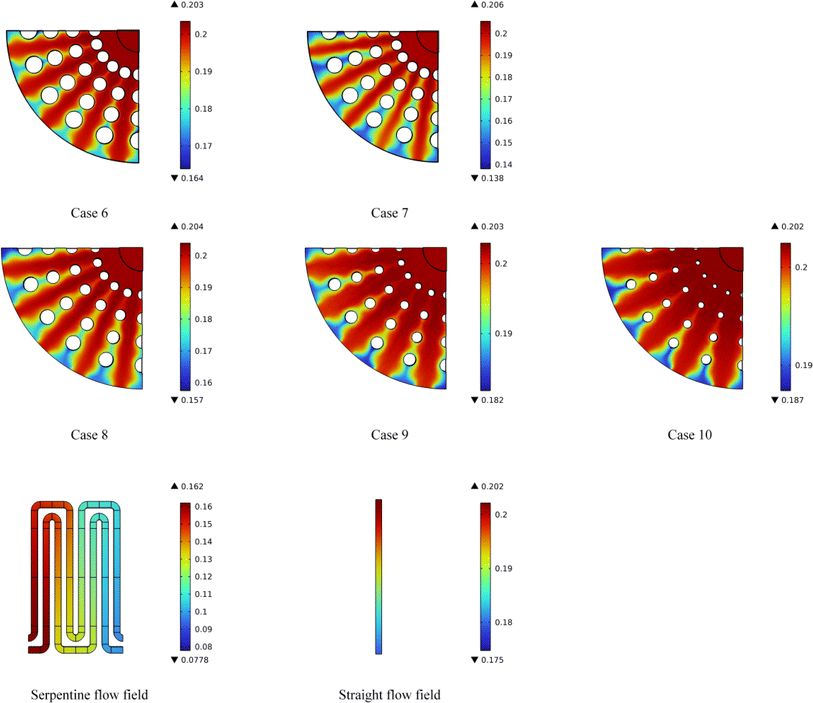 | ||
| Fig. 13 The oxygen distribution in the flow field cross-section for Case 6 to Case 10 and two types of conventional flow fields. | ||
Case 6 not only ensures a sufficient oxygen supply but also achieves a more uniform oxygen distribution within the flow field compared to the serpentine and straight flow fields.
In contrast, both serpentine and straight flow fields experience significant oxygen depletion by the midpoint of the flow path, potentially leading to gas supply deficiencies in the latter stages.
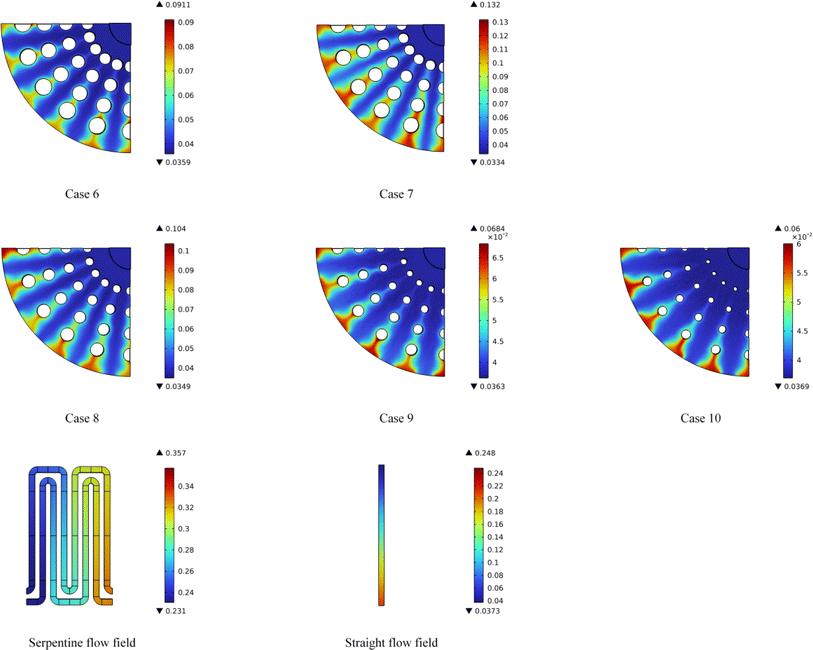 | ||
| Fig. 14 The water distribution in the flow field cross-section for Case 6 to Case 10 and two types of conventional flow fields. | ||
Although changing the minimum radius of the ribs does not have an significant impact on the moisture distribution in the flow field as altering the number of rib branches, our research results still indicate that larger cylindrical ribs can promote a more uniform distribution of the fluid and reduce moisture accumulation between regions. In contrast, smaller cylindrical ribs may be too small in volume to effectively guide the flow of the fluid, potentially resulting higher moisture concentration within the flow field in localized areas.
4 Conclusion
This study utilizes COMSOL Multiphysics simulation software to develop a lattice-based radial flow field for PEMFCs. Varying the number of rib branches and minimum rib radius reveals that increasing both parameters significantly enhances PEMFC performance. However, this improvement is not indefinite; optimal performance is achieved when there are six rib branches and the minimum rib radius is 0.135 cm.The lattice-based radial flow field shows significantly higher oxygen concentration compared to the straight and serpentine flow fields. The oxygen distribution is uniformly symmetrical, maintaining consistent levels throughout the flow field, resulting in a more favourable current density distribution. Additionally, the water concentration in the lattice-based radial flow field is lower than in the straight and serpentine flow fields. The water distribution is very uniform, with increased concentrations only observed at the outlet edges of single flowfields and in areas adjacent to individual ribs. In terms of pressure drop, the lattice-based radial flow field shows a slightly higher drop than the serpentine flow field. However, it still experiences a significantly higher pressure drop compared to the straight flow field due to its flow structure. Although the design of this flow field will slightly increase the pressure drop, the result is an increase in current density, a more uniform distribution of oxygen and water concentration, which undoubtedly greatly improves the electrochemical performance of PEMFC as a whole. In conclusion, the lattice-based radial flow field demonstrates superior electrochemical performance compared to traditional straight and serpentine flow fields. It also offers enhanced water removal, and effectively reducing the risk of flooding during PEMFC operation.
Data availability
Data sharing not applicable to this article as no datasets were generated or analysed during the current study.Conflicts of interest
There are no conflicts to declare.Acknowledgements
This study was funded by Shandong Province Undergraduate Teaching Reform Research Project (M2020202) and Task Book for Shandong Province Science and Technology based Small and Medium sized Enterprises Innovation Capability Enhancement Project (2022TSGC2138).References
- K. S. Choi, H. M. Kim and S. M. Moon, Int. J. Hydrogen Energy, 2011, 36, 1613–1627 CrossRef CAS.
- B. Z. Fang, L. Daniel, A. Bonakdarpour, R. Govindarajan, J. Sharman and D. P. Wilkinson, Small, 2021, 17, 2102288 CrossRef CAS PubMed.
- X. Gao, J. Y. Chen, R. J. Xu, Z. Zheng, X. T. Zeng, X. D. Chen and L. F. Cui, Int. J. Hydrogen Energy, 2024, 50, 711–743 CrossRef CAS.
- J. H. Kim, B. Z. Fang, M. Kim and J.-S. Yu, Catal. Today, 2009, 146(1–2), 25–30 CrossRef CAS.
- R. J. Kee, M. E. Coltrin and P. Glarborg, Chemically Reacting Flow: Theory and Practice, John Wiley & Sons, New York, 2005 Search PubMed.
- Q. S. Liu, F. C. Lan, J. Q. Chen, C. J. Zeng and J. F. Wang, J. Power Sources, 2022, 517, 230723 CrossRef CAS.
- K. Lim, C. Kim, R. Park, A. Alam and H. Ju, Chem. Eng. J., 2023, 475, 146147 CrossRef CAS.
- L. J. Chen, Z. C. Wang, C. F. Sun, H. Zhu, Y. Z. Xia, G. L. Hu and B. Z. Fang, Micromachines, 2023, 14, 1224 CrossRef PubMed.
- Z. F. Xia, H. C. Chen, T. Zhang and P. C. Pei, Int. J. Hydrogen Energy, 2022, 47, 13076–13086 CrossRef CAS.
- X. Chen, Z. K. Yu and X. D. Wang, J. Energy Eng., 2021, 147, 04020080 CrossRef.
- J. Wang and H. Wang, Fuel Cells, 2012, 12, 989–1003 CrossRef CAS.
- L. L. Zhang and Z. H. Shi, Alexandria Eng. J., 2021, 60, 421–433 CrossRef.
- M. Z. Chowdhury, O. Genc and S. Toros, Int. J. Hydrogen Energy, 2018, 43, 10798–10809 CrossRef CAS.
- H. B. Lan, L. L. Yang, F. J. Zheng, C. Y. Zong, S. Wu and X. G. Song, Int. J. Hydrogen Energy, 2020, 45, 12501–12513 CrossRef CAS.
- S. Abdulla and V. S. Patnaikuni, Int. J. Hydrogen Energy, 2020, 45, 25970–25984 CrossRef CAS.
- B. Binyamin and O. Lim, Int. J. Hydrogen Energy, 2023, 50, 470–491 CrossRef.
- H. Heidary, M. J. Kermani and B. Dabir, Energy Convers. Manage., 2016, 124, 51–60 CrossRef CAS.
- B. R. Friess and M. Hoorfar, Int. J. Hydrogen Energy, 2012, 37, 7719–7729 CrossRef CAS.
- F. Razmara, L. F. N. Sá, D. S. Prado, T. Lopes, J. R. Meneghini and E. C. N. Silva, Struct. Multidiscip. Optim., 2024, 67, 68 CrossRef.
- J. Y. Kim, G. Luo and C.-Y. Wang, J. Power Sources, 2017, 365, 419–429 CrossRef CAS.
- L. Wang, A. Husar, T. Zhou and H. Liu, Int. J. Hydrogen Energy, 2003, 28, 1263–1272 CrossRef CAS.
- J. Shen, Z. K. Tu and S. H. Chan, Appl. Therm. Eng., 2019, 149, 1408–1418 CrossRef CAS.
- Comsol multiphysics, v. 5.3a, comsol ab, stockholm, sweden, 2017, https://www.comsol.com/ Search PubMed.
- M. Z. Chowdhury, O. Genc and S. Toros, Int. J. Hydrogen Energy, 2018, 43, 10798–10809 CrossRef CAS.
- B. Sezgin, D. G. Caglayan, Y. Devrim, T. Steenberg and I. Eroglu, Int. J. Hydrogen Energy, 2016, 41, 10001–10009 CrossRef CAS.
- Y. Li, G. Lu and Y. Li, J. Eng. Thermophys., 2020, 41, 2900–2907 CAS.
- H. Caliskan, I. Dincer and A. Hepbasli, Appl. Therm. Eng., 2013, 61, 784–798 CrossRef.
- F. Y. Yan, J. Yao and X. J. Pei, Int. J. Electrochem., 2022, 17(7), 220721 CrossRef CAS.
- Q. Z. Xie and M. G. Zheng, Processes, 2021, 9, 1526 CrossRef CAS.
- L. Wang, A. Husar, T. Zhou and H. Liu, Int. J. Hydrogen Energy, 2003, 28, 1263–1272 CrossRef CAS.
- L. H. Ye, X. Cheng, Y. F. Shi, Z. K. Li, C. L. Ke, Z. He and A. P. Shi, AIP Adv., 2024, 14, 015003 CrossRef CAS.
- E. U. Ubong, Z. Shi and X. Wang, J. Electrochem. Soc., 2009, 156, 1276–1282 CrossRef.
| This journal is © The Royal Society of Chemistry 2024 |

