 Open Access Article
Magnetic self-doped TiO2−x/Fe3O4@g-C solar-driven photocatalytic composite for water decontamination†
Nesma A. Abdel-Hady a,
Mohamed I. Badawya,
Mohamed S. Attia
 b and
Tarek A. Gad-Allah
 *a
*a
aWater Pollution Research Department, National Research Centre, 33 El Buhouth St., Dokki, 12622 Giza, Egypt. E-mail: tareqabdelshafy@yahoo.ca; ta.gad-allah@nrc.sci.eg; Tel: +20-33371479
bChemistry Department, Faculty of Science, Ain Shams University, Abbassia, 11566 Cairo, Egypt
First published on 23rd October 2024
Abstract
Declining water resources and their contamination with chemicals risk the aquatic environment. Therefore, this work was devoted to designing a magnetically recyclable photocatalyst suitable for water treatment, namely, a TiO2−x/Fe3O4@g-C composite. Different preparation conditions were investigated together with the corresponding characteristics. The pure defective anatase TiO2−x phase of low band gap energy was detected through XRD and DRS analyses. Low charge recombination after the formation of defects was confirmed. The performances of the prepared photocatalysts in phenol degradation under solar light were evaluated, revealing the superior efficiency of TiO2−x prepared hydrothermally at 200 °C/24 h relative to intact TiO2. This best sample was incorporated with Fe3O4@g-C to facilitate its recovery and reuse. This successful combination was confirmed using XRD, Raman and XPS tools. TiO2−x/Fe3O4@g-C 2![[thin space (1/6-em)]](https://www.rsc.org/images/entities/char_2009.gif) :
:![[thin space (1/6-em)]](https://www.rsc.org/images/entities/char_2009.gif) 1 formulation was found to be the most photoactive and could be reused up to five times without significant loss in its efficiency. Therefore, the precisely developed magnetic photocatalyst is promising for application in the water-treatment process.
1 formulation was found to be the most photoactive and could be reused up to five times without significant loss in its efficiency. Therefore, the precisely developed magnetic photocatalyst is promising for application in the water-treatment process.
1. Introduction
To date, many photocatalysts have been investigated for the degradation of different pollutants.1 Among them, TiO2, which was first discovered by Fujishima and Honda,2 has attracted most of the attention owing to its excellent electronic and optical properties, electrochemical corrosion resistance, nontoxicity, good stability, low cost and abundant availability. However, the wide band-gap of TiO2 (Eg ≈ 3.2 eV) limits its photo-response to UV-light only, which comprises only 5% of the solar energy.3 Numerous efforts have been devoted to improving visible light activation, including incorporating quantum dots or co-catalysts, metal deposition and doping of metals/nonmetals, and heterojunction formation with another semiconductor with an unequal band structure.4,5,6Another strategy is self-doping, which can tune the electronic structures and extend the photo-response range, thereby enhancing the photocatalytic activity of semiconductors without introducing any foreign elements.7 The improved visible light harvesting of TiO2−x stems from the distortion of TiO2 crystals via oxygen vacancies (OVs) or Ti3+, which in turn causes the formation of new energy levels within the band gap.8 For instance, self-doped TiO2−x was prepared through the introduction of OVs in the lattice structure, leading to a narrower band-gap and enhanced visible light absorption.8,9 TiO2−x has been applied in water treatment under solar light. For instance, the TiO2−x/rGO nanocomposite has been implemented in the degradation of BPA and phenol, resulting in more than 90% removal efficiency.10 Furthermore, Wu and his co-workers11 used Ti3+ self-doped TiO2 nanoparticles as a photoanode for MB degradation and water splitting. The Ti3+ self-doped TiO2 nanoparticles showed intensive light absorption, fast photogenerated carrier transport and low recombination rate, thereby exhibiting improved photocatalytic (PC) and photoelectrocatalytic (PEC) activities of the final products compared with those of pure TiO2.
Generally, heterogeneous photocatalysts are practically applied either in an immobilized or slurry form. The immobilized form has a smaller surface area, but it is easy to be separated from water. In contrast, slurry photocatalysts have a higher surface area than immobilized ones, but they are difficult to be recovered from water. To overcome this paradox, magnetic nanoparticles can be incorporated into the powdered photocatalyst to provide an easy way to separate the photocatalyst from water using an external magnetic field without affecting the total surface area significantly.
Various methods have been employed for the synthesis of magnetic nanoparticles (MNPs) of various compositions and phases with distinct magnetic properties. Optimal performance is achieved when the MNPs have high saturation magnetization (Ms) and stable magnetic and surface properties. Normally, MNPs possessing the strongest magnetic properties could be achieved using metals (Fe, Ms ∼ 221 emu g−1)12 or metal alloys (CoFe or CoNiFe, Ms ∼ 245 emu g−1).13 Unfortunately, naked metal NPs have high chemical activity and are easily oxidized upon contact with air, generally leading to a loss of magnetism. This has promoted the widespread use of MNPs, such as iron(III) oxide (Fe2O3 and Fe3O4, Ms ∼ bulk 92 emu g−1).13 The magnetic characteristics of Fe3O4 nanoparticles enable their effortless recovery from water or wastewater using low magnetic fields or handheld magnets. This renders it a cost-effective and practical technique for treatment purposes owing to its benefits such as soft ferromagnetism, half-metallicity, minimal toxicity, and biocompatibility.14
However, high concentrations of ferrite lead to a considerable reduction in the semiconductor photocatalyst's efficiency. This is because spinel ferrites in this case act as recombination centres rather than trapping centres for electron/hole (e−/h+) pairs. To overcome this problem, the prepared Fe3O4 was covered by a barrier layer such as carbon (C) in different forms. For instance, rGO–TiO2@Fe3O4 was used for the degradation of chlorophenol under visible light with efficacy equal to 94%;15 TiO2/Fe3O4/graphene oxide was investigated for the removal of methylene blue (MB) under UV light (82%) and visible light (76%);16 on the other hand, Hatefi, Younesi et al. applied Fe3O4/TiO2 with graphene quantum dots for the removal of MB under low-pressure mercury-vapor lamp and could achieve 86% removal efficiency.
An interesting type form of carbon is the glassy form. Glassy carbon (g-C) has high thermal resistance, extreme chemical stability, low density and great hardness compared with other carbons, which also exhibit excellent biological compatibility and high electrical conductivity.17 The latter feature is expected to help in preventing the recombination of charge carriers, which would lead to better photocatalytic activity. Therefore, it is interesting to explore using glassy carbon as the barrier layer between self-doped TiO2 and Fe3O4.
To the best of our knowledge, the TiO2−x/Fe3O4@g-C superparamagnetic photocatalytic composite has not yet been prepared. Therefore, we devote this work to optimizing the degree of defects of TiO2−x by adjusting the hydrothermal conditions used for obtaining TiO2−x, thus optimizing the ratio between Fe3O4@g-C and TiO2−x to finally have the most active and easiest magnetically separable composite. The optimization process was based on the efficiency of phenol degradation as a model organic pollutant. According to the collected results, the designed composite is very efficient under solar irradiation and can be recovered and reused successfully several times without a noticeable drop in its activity.
2. Experimental methods
2.1 Preparation of the pristine and defective TiO2−x/Fe3O4@g-C composite
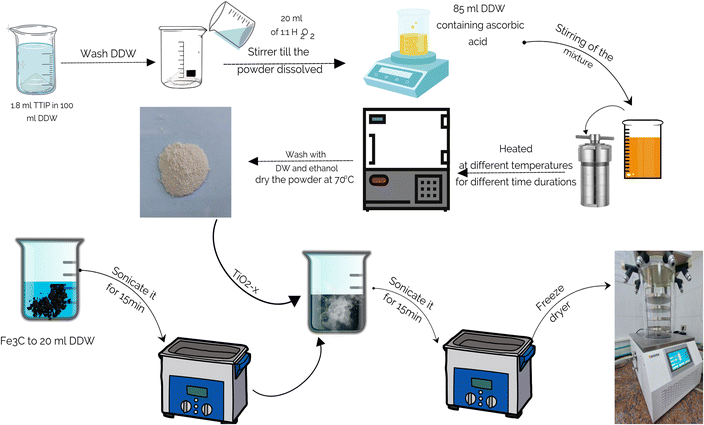
Firstly, pristine and defective TiO2 were prepared. In typical procedure, 1.8 mL of titanium(IV) isopropoxide (TTIP, ACROS ORGANICS Co.) was added to 100 mL double distilled water (DDW) under slow stirring by a glass rod until the complete hydrolysis of TTIP. Then, the formed precipitate was washed with DDW. Subsequently, the precipitate was dissolved in 20 mL of 15% H2O2 aqueous solution (El-Nasr Pharmaceutical Chemical Co.). Afterward, 85 mL DDW containing 1.82 g of L-ascorbic acid (Alpha Chemika Co.) was added to prevent the formation of a dense gel. The final mixture was transferred to a 150 mL Teflon-lined autoclave and heated for different times and temperatures. The formed precipitate was collected by centrifugation at 10![[thin space (1/6-em)]](https://www.rsc.org/images/entities/char_2009.gif) 000 rpm for 10 min with consecutive washings by DDW and ethanol. Finally, the powder was dried at 70 °C for 6 h under vacuum.
000 rpm for 10 min with consecutive washings by DDW and ethanol. Finally, the powder was dried at 70 °C for 6 h under vacuum.
Fe3O4@g-C superparamagnetic nanoparticles were prepared as follows. Anhydrous Fe3Cl and hexamethylenetetramine (HMTA) were dissolved in a solution of ethylene glycol and distilled water (DW) of equal volumes. The resulting solution was heated in a Teflon-lined autoclave at 110 °C for 6 h. After washing the precipitate with DW and ethanol, it was dried at 70 °C for 12 h in a vacuum oven. Then, the ground powder was calcinated at 650 °C for 1.5 h in Ar atmosphere.
Finally, the TiO2−x/Fe3O4@g-C composites of different formulations were synthesized by suspending a definite amount of Fe3O4@g-C in 20 mL DDW for 15 min using an ultrasonic bath. After that, a certain amount of TiO2−x was added to the Fe3O4@g-C suspension. The whole mixture was agitated in an ultrasonic bath for another 15 min. The well-dispersed mixture was frozen for one day, followed by freeze drying. The detailed procedure is schematically shown in Fig. 1.
2.2 Characterization of the prepared materials
Crystalline phases in the prepared materials were identified using X-ray diffraction (XRD) patterns, which were collected using an PANalytical X'Pert Pro diffractometer (the Netherlands) with CuKα source (λ = 1.5406 Å). The crystallized phases were identified by comparing the collected patterns with standard ASTM cards. The magnetization hysteresis loop was measured by a Riken Denshi BH-55 vibrating sample magnetometer (VSM) at room temperature. The band-gap was calculated from the UV-vis diffuse reflectance spectra (DRS) measured using a JASCO V730 spectrophotometer (Japan) equipped with diffuse reflectance accessories. Raman spectra were obtained using a Witec Alpha300 R confocal Raman microscope with 532 nm excitation wavelength at a power of 1 mW. The defects were identified using a BRUKER EMX EPR Spectrometer. The morphology was examined under a high-resolution transmission electron microscope (HR-TEM, JEOL TEM-2100, Japan). The recombination of electron and hole was identified using a spectrofluorometer (Edinburgh Instruments, FS5). X-ray photoelectron spectra (XPS) were collected using a Surface Science instrument X-probe, X-ray000 400 μm – FG ON.2.3 Evaluation of the photocatalytic performance
The photocatalytic activities of the prepared materials were evaluated using phenol as a model organic pollutant under solar light in a batch system. A solar simulator (UVA CUBE 400, Dr Hönle AG UV Technology, Germany) equipped with a halogenide high-pressure lamp (model: SOL 500) was used for the photocatalytic experiments. This lamp emits radiation that simulates natural sunlight (1000 W m−2) in a downward direction. 100 mL of phenol solution was mixed with an appropriate amount of the photocatalyst and irradiated using the solar simulator. At certain times, the samples were collected, filtered, and stored for analysis. An analogous procedure was applied for the reusability test, but the experiment was conducted for 7 h to ensure cleaning of the photocatalyst surface. Later, the photocatalyst was collected using an external magnetic field. The collected powder was washed with DW and ethanol before using in the next experiment.Phenol concentrations were analysed using a high-performance liquid chromatograph (HPLC, Agilent 1260, USA) based on the following conditions: 60![[thin space (1/6-em)]](https://www.rsc.org/images/entities/char_2009.gif) :
:![[thin space (1/6-em)]](https://www.rsc.org/images/entities/char_2009.gif) 40 water and acetonitrile as isocratic eluent, 25 °C column temperature, and detection at 280 nm wavelength.
40 water and acetonitrile as isocratic eluent, 25 °C column temperature, and detection at 280 nm wavelength.
3. Results and discussion
3.1 Optimization of the pure photocatalyst
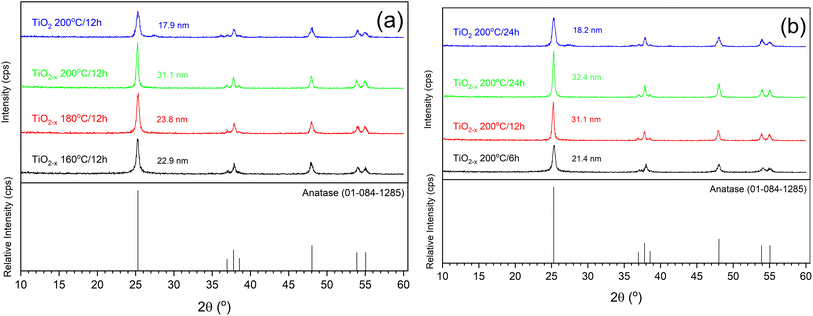 | ||
| Fig. 2 XRD patterns of pure and defective TiO2 samples prepared at different (a) temperatures and (b) times. | ||
The UV-vis diffuse reflectance (DRS) technique was used to evaluate the optical properties of the prepared samples. The absorption coefficients were calculated from the DRS spectra using the Kubelka–Munk equation,21 α = K/S = (1 − R)2/2R, where K is the absorption coefficient, S is the scattering coefficient, and R is the reflectance obtained from DRS. The calculated spectra are shown in Fig. 3a and b. Increasing the hydrothermal reaction time caused an increase in the absorptivity of the prepared samples either in UV or visible light range, which may be due to either the enhanced crystallinity of the samples, as previously observed by the XRD results, or the formation of more defects. Unfortunately, it was difficult to segregate the effects of grain size and self-doping under the studied conditions. The same obstacles were previously reported.22 However, comparing the TiO2 and TiO2−x prepared under the same conditions (i.e., 200 °C/12 h) revealed that TiO2−x exhibited better absorption in the visible light range, which can be due to the presence of defects that form a shallow donor level below the conduction band, thus narrowing the band gap.22 This level originates from the Ti dangling bonds associated with the shortage of oxygen atoms.23 Since TiO2−x (200 °C) displayed the best absorption in both UV and visible light ranges, it was used to assess the variation in DRS with the hydrothermal time at this temperature, as shown in Fig. 3b. It is evident that the absorption of TiO2−x samples slightly decreases with increasing time of hydrothermal treatment; nevertheless, all TiO2−x still possess better absorption in the visible light region than the TiO2 sample. The Tauc plots presented in Fig. 3c and d support the shrinkage in the band-gap when using ascorbic acid under the investigated conditions. However, the calculated band-gaps do not follow the same order observed in the absorption spectra. This might be due to the incorrectness of the band-gap calculation using Tauc plots in the case of doped semiconductors, as previously reported.21 To sum up, temperature plays a major role in governing the optical properties of the defective TiO2−x rather than the time of the hydrothermal process.
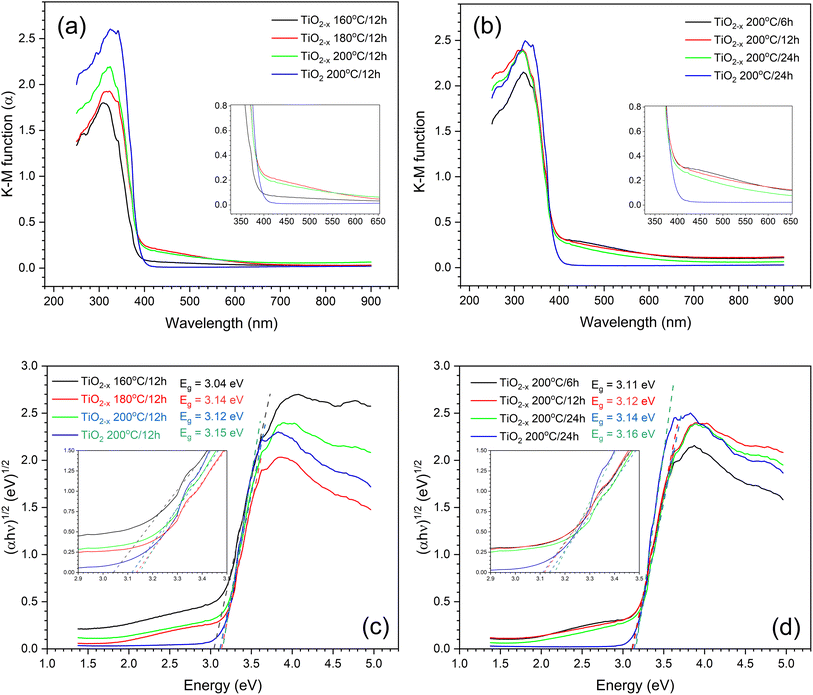 | ||
| Fig. 3 (a and b) Transformations of the UV-vis DRS spectra, and (c and d) Tauc plot of TiO2 prepared under different hydrothermal conditions. | ||
PL spectra were measured to assess the recombination of the photogenerated electron–hole pairs. A lower fluorescence intensity implies the limited recombination of electrons and holes, which is beneficial to the photocatalytic performance because of the high number of free charges available for the photocatalytic reaction.24 Fig. S1† shows the recorded PL spectra of TiO2 and TiO2−x prepared under different hydrothermal conditions. Samples prepared using ascorbic acid (i.e., TiO2−x) at any of the studied hydrothermal temperatures showed quenched PL intensities, as illustrated in Fig. S1a.† Specifically, TiO2−x 200 °C/12 h showed the lowest PL intensity, indicating that this sample possesses the lowest charge recombination and possibly the best photocatalytic performance. The study of the effect of hydrothermal time, presented in Fig. S1b,† shows that short hydrothermal time led to low PL intensity, while a longer time (i.e., 24 h) resulted in a slightly higher PL intensity. However, it should be mentioned that the pristine TiO2, prepared in the absence of ascorbic acid, still possesses the highest PL intensity, indicating the formation of new sublevels in the samples prepared using ascorbic acid due to the formed defects. Therefore, it can be deduced that although ascorbic acid enhanced the growth of TiO2 crystals, according to the XRD results, it caused a deformation of the formed crystals, as evidenced by the low PL intensities of the samples prepared in the presence of ascorbic acid.
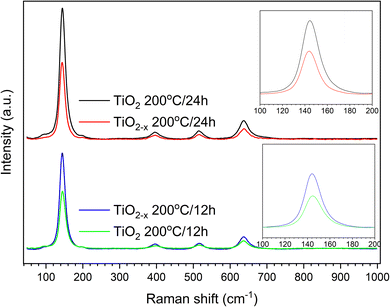
Another important analytical tool to determine the crystalline phases and any defects in them is Raman spectroscopy. As shown in Fig. 4, similar peaks appearing at 144 cm−1, 396 cm−1, 516 cm−1 and 636 cm−1 were observed in all the samples. These peaks can be assigned specifically to the Eg, B1g, A1g, and Eg vibrational modes in the anatase TiO2 crystal, as reported out by Wang et al.,25 indicating the good purity of the prepared samples. This is consistent with the XRD results shown above. A deep investigation of the Raman spectra of the TiO2−x samples indicated a lower peak intensity with a small shift toward a lower wavenumber relative to the pristine TiO2 sample that was hydrothermally treated for 24 h (insets of Fig. 4). This refers to the presence of surface disorder, as reported by Gu, Pan et al.,26 enclosing localized defects that originated from the formation of Ti3+ (ref. 27) or oxygen vacancies (i.e., Ti–Ov–Ti bonds).28 On the contrary, the peaks of pristine TiO2 prepared in 12 h appeared at almost the same position as those of the corresponding defected sample TiO2−x but with higher intensities. This shows that ascorbic acid enhanced the crystallization in a shorter time of hydrothermal treatment rather than the formation of defects in the growing crystals. This speculation is also supported by the measured crystallite sizes shown in Fig. 2 (i.e., 31.1 nm and 17.9 nm for TiO2−x 200 °C/12 h and TiO2 200 °C/12 h, respectively). Therefore, it can be deduced that the role of ascorbic acid varies according to the hydrothermal time; it mainly supports the crystal growth during a short hydrothermal time, then deforms the formed crystals on increasing the hydrothermal time.
In order to support the previous speculation, the morphology of TiO2 200 °C/12 h, TiO2 200 °C/24 h, TiO2−x 200 °C/12 h and TiO2−x 200 °C/24 h was imaged under TEM, as shown in Fig. 5. Generally, all samples are composed of nanoparticles (i.e., particle size < 100 nm). For short hydrothermal time, TiO2 200 °C/12 h shows mostly ∼22 nm cuboid particles, as depicted in Fig. 5a. However, the TEM image for TiO2−x 200 °C/12 h in Fig. 5b illustrated that adding ascorbic acid deformed the crystals during their growth, leading to the formation of irregular nanoparticles. Furthermore, ascorbic acid increased the particle size to ∼35 nm, which is nearly 1.6 times that of the pristine TiO2 200 °C/12 h sample. The TiO2 200 °C/24 h sample prepared at a longer hydrothermal time (24 h) constitutes a well-defined cuboid of 22 nm size, which is nearly the same as TiO2 200 °C/12 h (Fig. 5c). This observation is in line with the XRD analyses shown in Fig. 2. The TEM image of the TiO2−x 200 °C/24 h sample in Fig. 5d also shows a larger deformed nanoparticle, with an average size of ∼44 nm, than its control sample (i.e., TiO2 200 °C/24 h) and the defected sample prepared at a shorter hydrothermal time (i.e., TiO2−x 200 °C/12 h). The increase in the particle size may be due to the ascorbic acid effect and elongated hydrothermal time. It is worth mentioning that the measured particle sizes are consistent with the sizes calculated from the XRD patterns.
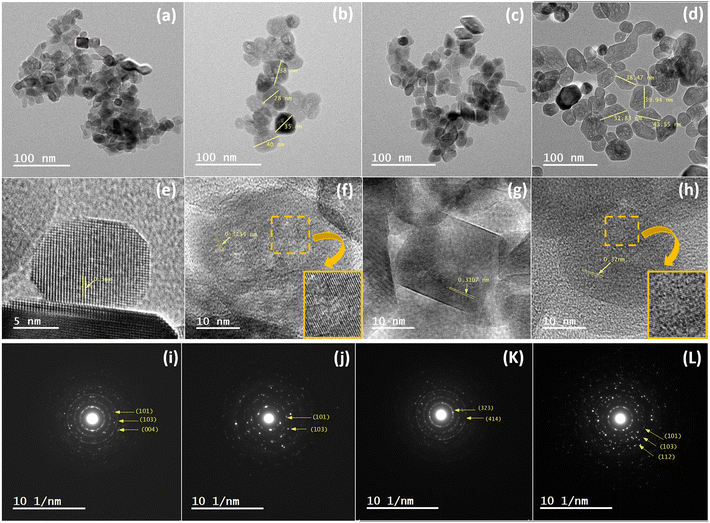 | ||
| Fig. 5 TEM images of TiO2 and TiO2−x samples: (a, e and i) TiO2 200 °C/12 h, (b, f and j) TiO2−x 200 °C/12 h, (c, g and k) TiO2 200 °C/24 h and (d, h and l) TiO2−x 200 °C/24 h. | ||
Fig. 5e–h shows the lattice spacing of TiO2 200 °C/12 h, TiO2−x 200 °C/12 h, TiO2 200 °C/24 h, and TiO2−x 200 °C/24 h samples with values of 0.3, 0.315, 0.3107 and 0.32 nm, respectively, corresponding to the interplanar crystal spacing of the (101) plane. Generally, the selected area electron diffractions of the whole samples show strong dotted-rings diffraction pattern, referring to the polycrystalline nature of these samples. The identified planes from the SAED pattern were (101), (103) and (004) in case of TiO2 200 °C/12 h, (101) and (103) in case of TiO2−x 200 °C/12 h, (101) and (112) in case of TiO2 200 °C/24 h, and (101), (103) and (112) in case of TiO2−x 200 °C/24 h. All of these planes are characteristic for the anatase crystals, indicating the high purity of the prepared samples.
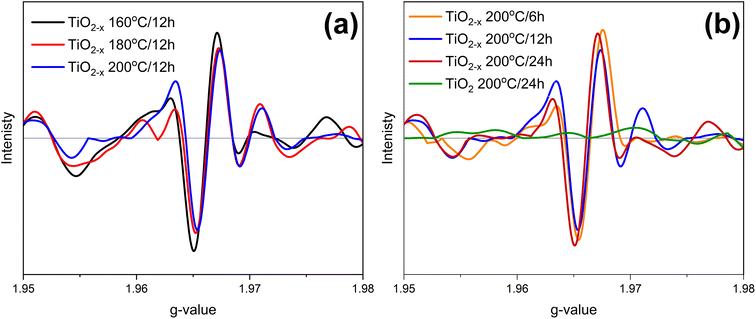
EPR spectroscopy was used to identify the defect type, i.e., Ti3+ or oxygen vacancies, in the prepared samples. The collected EPR spectra are elucidated in Fig. 6. TiO2 200 °C/24 h shows an insignificant EPR signal due to the diamagnetic nature of TiO2. On the other hand, all the prepared samples exhibited a strong signal at g ∼1.966, revealing the presence of Ti3+, as previously reported by Zhang et al.29 However, it was difficult to determine which sample has more defects because the differences in the signal intensities are insignificant. Therefore, it can be concluded that Ti3+ is the major defect caused by ascorbic acid. This result is consistent with the previously reported research.30
XPS technique was used to shed light on the components, chemical states of the elements, and nature of the defects in the prepared materials. The high-resolution XPS spectra of the detected elements are presented in Fig. 7. According to the full-scan data presented in Fig. 7a, three elements, namely, carbon, oxygen, and titanium, could be recognized in the spectra of all the samples. The peak of carbon (i.e., C 1s) at 284.6 eV is probably due to the contamination by atmospheric carbon during sample preparation.31
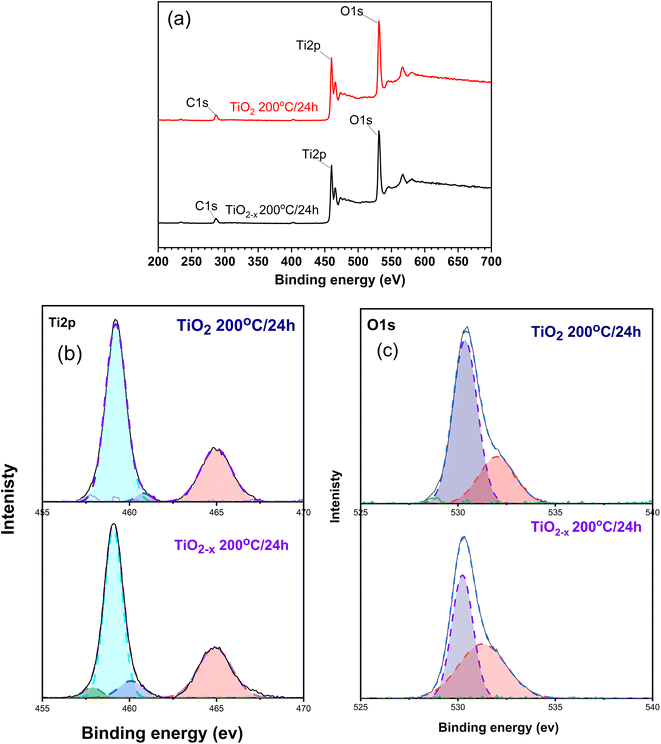 | ||
| Fig. 7 XPS spectra of the prepared samples; (a) full scan and (b and c) deconvoluted spectra of Ti and O elements. | ||
Fig. 7b displays the Ti 2p peaks of the intact and defective TiO2 prepared at 200 °C for 24 h under the hydrothermal conditions. The intact sample (i.e., TiO2) showed two peaks at 459.19 and 464.89 eV corresponding to the Ti4+ 2p3/2 and Ti4+ 2p1/2 states, respectively.32 These peaks were shifted to lower binding energies in the defective sample (TiO2−x), i.e., 459.09 and 464.74 eV, respectively. This suggests the formation of Ti3+ defects in this sample. Deconvoluting the two major peaks revealed the presence of a peak at 460.8 eV corresponding to Ti3+ in Ti2O3. This indicates that both TiO2 and Ti2O3 are formed in the prepared samples but with different intensities; in TiO2−x 200 °C/24 h, the peak intensity is more than TiO2 200 °C/24 h by 4 times, indicating the presence of more defects. Deconvoluting the peak at 459.09 eV in case of the TiO2−x 200 °C/24 h sample showed a new peak at 457.7 eV, which confirms the formation of Ti3+.33
The high resolution XPS spectrum of O 1s in Fig. 7c depicts two peaks centred at 530.36 and 531.2 eV for the TiO2 200 °C/24 h sample. These peaks are representative for the Ti–O–Ti and surface –OH species, respectively, as previously reported.34 On the other hand, the shift of the peak at 530.2 eV in TiO2−x 200 °C/24 h originates from the formation of the oxygen vacancy near the Ti3+, according to ref. 32. Furthermore, the increase in the peak at 531.2 eV indicates the formation of oxygen vacancy, as mentioned by ref. 35.
3.2 Optimization of the magnetic composite
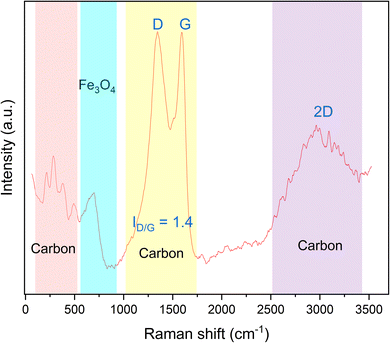
Although XRD analysis suggested the formation of the Fe3O4 phase, it is possible to have maghemite (Fe2O3) also in our sample since the two phases, i.e., Fe3O4 and Fe2O3, possess superimposed XRD peaks. Raman spectroscopy has been widely used to differentiate the iron oxides, especially magnetite and maghemite. The representative Raman spectrum of the synthesized magnetic material is presented in Fig. 9. The broadband at 688 cm−1 can be assigned to the A1g transition of magnetite.37 According to Chen et al.,38 the two strong peaks at 1345 cm−1 and 1593 cm−1 refer to the D and G modes of graphitic carbon, respectively, and the ratio between the area under the peak of those peaks (i.e., ID/G) is used as a measurement of the relative degree of disorder in the carbonaceous materials. ID/G was found to be 1.4, which is higher than unity, indicating the presence of a substantial graphitization degree and a high sp2 content in the formed carbon.17,39 Moreover, there are low frequency bands in the range of 200–500 cm−1, which correspond to P1, P2, P3 and P4, whose peaks appear in case of glassy carbon, as mentioned by Jurkiewicz and co-workers.17 Additionally, there is an overtone broad peak at 2500–3450 cm−1. The deconvolution of this peak showed two bands at approximately 2670 cm−1 and 3000 cm−1 corresponding to the 2D bands in glassy carbon.40 To sum up, the magnetic component prepared in this study consists of Fe3O4 with glassy carbon.
The morphology of the pure magnetic component and the prepared composites were visualized in the TEM images depicted in Fig. 10. From Fig. 10a, it can be seen that the magnetic component is composed of irregular nanoparticles with an average size of ∼13.5 nm, covered with a glassy carbon sheet. The lattice spacing of the observed nanoparticles is 1.859 nm, which is corresponding to the interplanar crystal spacing of the (331) plane of Fe3O4. These observations demonstrate that the prepared magnetic component is Fe3O4@g-C. The inset selected area electron diffraction (SAED) image shows blurry dotted rings, indicating the polycrystalline nature of this samples. The successful formation of the TiO2−x/Fe3O4@g-C composite was confirmed according to the images in Fig. 10b and c. In these images, both Fe3O4@g-C and TiO2−x crystals could be clearly recognized, and their abundance is relatively consistent with the added amounts. Furthermore, the inset images of SAED in Fig. 10b and c belonging to the TiO2−x crystals showed very strong diffraction patterns due to the good crystallinity of TiO2−x, unlike the vague SAED of Fe3O4@g-C. This disparity arises from the carbon cover on Fe3O4, whereas the TiO2−x crystals are naked.
 | ||
Fig. 10 TEM images of (a) Fe3O4@g-C and (b) TiO2−x/Fe3O4@g-C 200 °C/24 h 1![[thin space (1/6-em)]](https://www.rsc.org/images/entities/char_2009.gif) : :![[thin space (1/6-em)]](https://www.rsc.org/images/entities/char_2009.gif) 1 and (c) TiO2−x/Fe3O4@g-C 200 °C/24 h 4 1 and (c) TiO2−x/Fe3O4@g-C 200 °C/24 h 4![[thin space (1/6-em)]](https://www.rsc.org/images/entities/char_2009.gif) : :![[thin space (1/6-em)]](https://www.rsc.org/images/entities/char_2009.gif) 1. 1. | ||
The magnetic properties of the prepared materials were assessed using VSM analysis, as shown in Fig. 11. The Fe3O4@g-C sample showed the desired superparamagnetic behaviour, i.e., of 55 emu g−1 magnetization saturation (Ms) with low coercivity (Hc) and retentivity (Mr) (Fig. 11a). As expected, the sample with more Fe3O4@g-C content showed high saturation magnetization (Ms), whereas the samples containing more TiO2−x content showed low saturation magnetization (Ms). However, all the samples possess superparamagnetic behaviour, enabling fast magnetization under the effect of an external magnetic field and good dispersion in its absence.
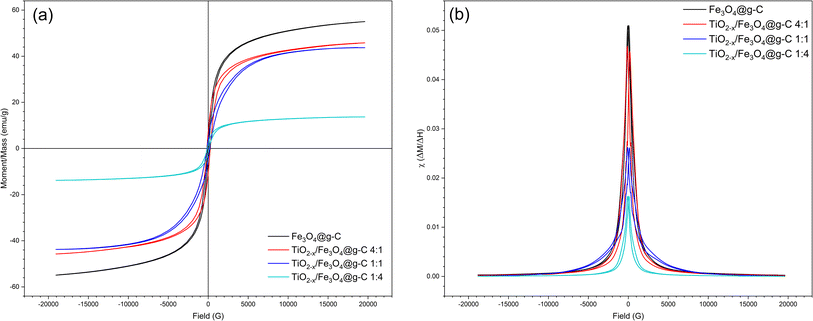 | ||
| Fig. 11 (a) VSM hysteresis loops and (b) magnetic susceptibility of the pure Fe3O4@g-C and TiO2−x/Fe3O4@g-C composite of different ratios. | ||
Another evidence of the good magnetic behaviours of the prepared samples were deduced from their magnetic susceptibility (χ), as shown in Fig. 11b, since χ is a measure of the response of a material to an applied magnetic field. The calculated χ values for the prepared samples fall within the range >10−2 to ∼105, which is characteristic of superparamagnetic materials, as reported by Frenea-Robin and Marchalot (2022).41 As shown in Fig. 11b, the TiO2−x/Fe3O4@g-C 4![[thin space (1/6-em)]](https://www.rsc.org/images/entities/char_2009.gif) :
:![[thin space (1/6-em)]](https://www.rsc.org/images/entities/char_2009.gif) 1 sample exhibited χ close to that of Fe3O4@g-C due to the high content of Fe3O4 in this sample. Though the higher TiO2−x content (four times) decreases the χ value because of the increasing amount of non-magnetic component in the composite, this sample exhibits good susceptibility to an external magnetic field. To sum up, the prepared composites showed excellent magnetic properties, qualifying their application as magnetically recoverable photocatalysts.
1 sample exhibited χ close to that of Fe3O4@g-C due to the high content of Fe3O4 in this sample. Though the higher TiO2−x content (four times) decreases the χ value because of the increasing amount of non-magnetic component in the composite, this sample exhibits good susceptibility to an external magnetic field. To sum up, the prepared composites showed excellent magnetic properties, qualifying their application as magnetically recoverable photocatalysts.
The chemical composition and binding energies of the TiO2−x/Fe3O4@g-C composite was examined by XPS. Full scan revealed the presence of Fe, O, Ti and C elements in this sample, as evidenced by the appearance of peaks at 713.26, 531.83, 460.09 and 286.5 eV corresponding to the Fe 2p, O 1s, Ti 2p, and C 1s energy states, respectively, as shown in Fig. 12a.
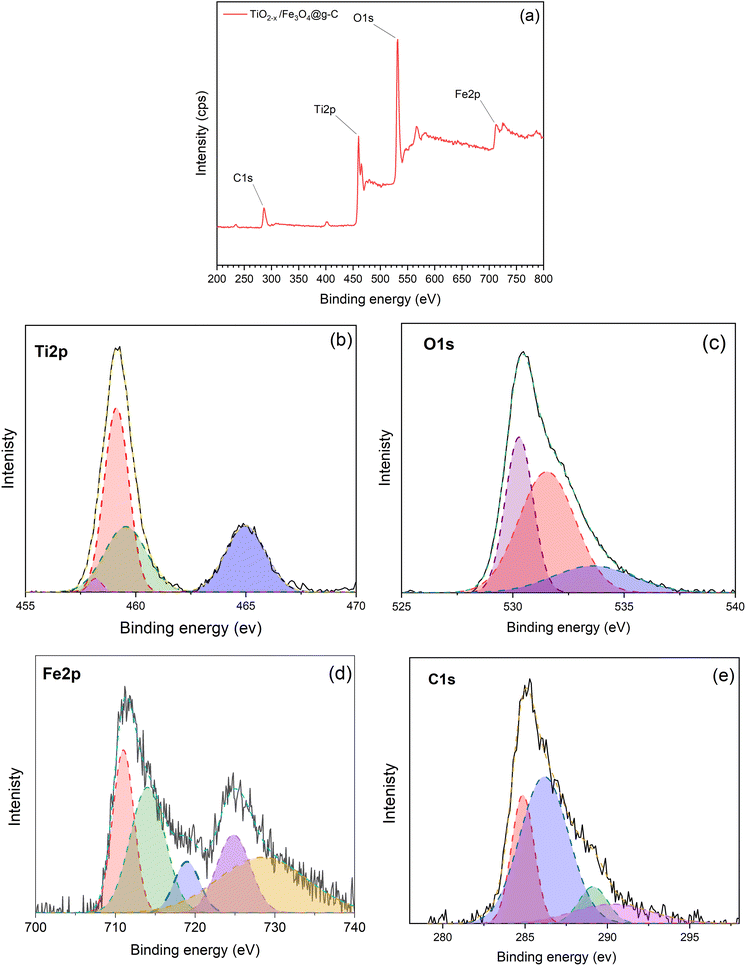 | ||
Fig. 12 XPS spectra of the TiO2−x/Fe3O4@g-C 1![[thin space (1/6-em)]](https://www.rsc.org/images/entities/char_2009.gif) : :![[thin space (1/6-em)]](https://www.rsc.org/images/entities/char_2009.gif) 1 composite; (a) full scan spectrum, (b) Ti 2p, (c) O 1s, (d) Fe 2p and (e) C 1s spectra. 1 composite; (a) full scan spectrum, (b) Ti 2p, (c) O 1s, (d) Fe 2p and (e) C 1s spectra. | ||
In the Ti 2p spectra illustrated in Fig. 12b, the sample revealed two peaks of Ti4+ 2p3/2 and Ti4+ 2p1/2 at 459.22 and 464.81 eV, respectively. As discussed above in the corresponding pure TiO2−x sample, the Ti 2p peaks shifted to a lower binding energy relative to the pristine TiO2, demonstrating the formation of Ti3+ ions. The deconvolution of the peak at 459.22 eV demonstrated a peak at 457.7 eV, which further confirms the presence of the Ti3+ defect. The peak at 460 eV is also an indication of Ti3+. The increase in this peak intensity compared to TiO2−x is attributed to the formation of new bonds between Fe–O–Ti and Ti–O–C.32 Thereby, the method used for synthesising the magnetic composite, i.e., Fe3O4@g-C/TiO2−x, did not affect the defect in the TiO2 crystals, and it is expected not to affect the photocatalytic activity.
The O 1s spectrum in Fig. 12c resulted in three peaks: the broad band centred at 530.28 eV that can be assigned to Ti–O, Fe–O and Fe–O–Ti bonds,42 the peak at 533.29 eV can be attributed to the surface C–O bond,43 and the peak at 531 eV is due to the formation of Fe–O–C.43 The formation of Fe–O–C bonds is evidence of the strong binding between Fe3O4@g-C and TiO2−x in the composite, which guarantee the stability of the composite during the treatment and reuse processes.
Fig. 12d depicts the characteristic peaks of Fe 2p at 711.03 and 724.13 eV, which can be assigned to the spin–orbit peaks of Fe 2p3/2 and Fe 2p1/2, which is in good agreement with the previously published literature.42 Two satellite signals of the Fe 2p3/2 and Fe 2p1/2 peaks were observed at the same time, which can be attributed to the oxidation states of Fe3+ and Fe2+ in Fe3O4 nanoparticles.44
The high-resolution C 1s spectrum in Fig. 12e was deconvoluted into four peaks. The peaks at 284.8 and 286.1 eV can be ascribed to C![[double bond, length as m-dash]](https://www.rsc.org/images/entities/char_e001.gif) C and C–C, respectively, which is an indication of the graphitic structure of glassy carbon, and the peak at 290 eV is ascribed to the presence of the carboxylate carbon.39 There is another peak at 289.1 eV, which is due to the formation of the Ti–O–C bond.45 The formation of the Ti–O–C bond is another evidence of the strong linkage inside the composite TiO2−x/Fe3O4@g-C.
C and C–C, respectively, which is an indication of the graphitic structure of glassy carbon, and the peak at 290 eV is ascribed to the presence of the carboxylate carbon.39 There is another peak at 289.1 eV, which is due to the formation of the Ti–O–C bond.45 The formation of the Ti–O–C bond is another evidence of the strong linkage inside the composite TiO2−x/Fe3O4@g-C.
3.3 Performance of TiO2−x/Fe3O4@g-C
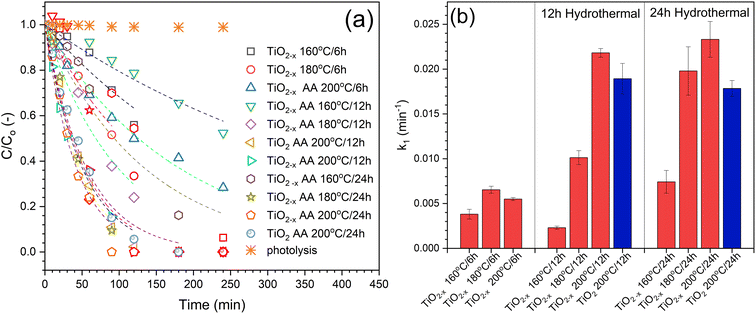
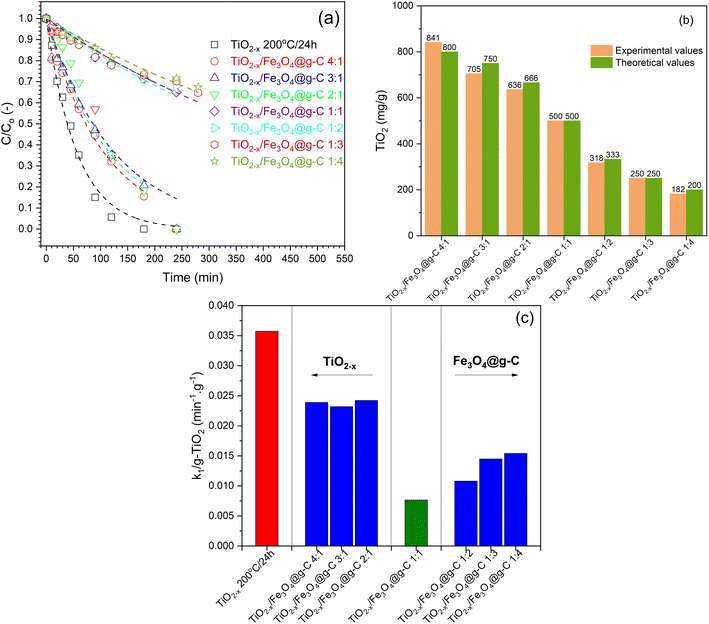
The different composite formulations were investigated for the photocatalytic degradation of phenol in order to determine the best formulation. The time-dependent photocatalytic data is illustrated in Fig. 13a. Generally, the photocatalytic processes using the prepared samples followed the first-order kinetics. However, these observations are not accurate because the prepared composites contain different amounts of the photoactive component, i.e., TiO2−x. Therefore, the TiO2−x content in each composite sample was determined using the ICP technique (Fig. 13c) in order to calculate the activity precisely. There was no significant difference between the experimental and calculated values of the TiO2−x amount, indicating the efficiency of the method used to obtain the TiO2−x![[thin space (1/6-em)]](https://www.rsc.org/images/entities/char_2009.gif) :
:![[thin space (1/6-em)]](https://www.rsc.org/images/entities/char_2009.gif) Fe3O4@g-C composite. After correcting the obtained k1 values based on the TiO2−x amount in each sample, the calculated first-order rate constants (k1) are compared in Fig. 13c to compare the activities of the prepared samples. It has been realized that the higher ratio of TiO2−x led to better activity, which is more logical due to the addition of more photoactive sites to the system. In addition, the higher ratio of TiO2−x allowed the contact of TiO2−x with the glassy carbon in Fe3O4@g-C, which is responsible for the efficient separation of the photo-generated charges in TiO2−x, as previously reported.17 On the contrary, increasing the TiO2−x
Fe3O4@g-C composite. After correcting the obtained k1 values based on the TiO2−x amount in each sample, the calculated first-order rate constants (k1) are compared in Fig. 13c to compare the activities of the prepared samples. It has been realized that the higher ratio of TiO2−x led to better activity, which is more logical due to the addition of more photoactive sites to the system. In addition, the higher ratio of TiO2−x allowed the contact of TiO2−x with the glassy carbon in Fe3O4@g-C, which is responsible for the efficient separation of the photo-generated charges in TiO2−x, as previously reported.17 On the contrary, increasing the TiO2−x![[thin space (1/6-em)]](https://www.rsc.org/images/entities/char_2009.gif) :
:![[thin space (1/6-em)]](https://www.rsc.org/images/entities/char_2009.gif) Fe3O4@g-C more than 1
Fe3O4@g-C more than 1![[thin space (1/6-em)]](https://www.rsc.org/images/entities/char_2009.gif) :
:![[thin space (1/6-em)]](https://www.rsc.org/images/entities/char_2009.gif) 1 did not enhance the photocatalytic process because the excess Fe3O4@g-C will not be in contact with TiO2−x. Therefore, the TiO2−x
1 did not enhance the photocatalytic process because the excess Fe3O4@g-C will not be in contact with TiO2−x. Therefore, the TiO2−x![[thin space (1/6-em)]](https://www.rsc.org/images/entities/char_2009.gif) :
:![[thin space (1/6-em)]](https://www.rsc.org/images/entities/char_2009.gif) Fe3O4@g-C composites of 1
Fe3O4@g-C composites of 1![[thin space (1/6-em)]](https://www.rsc.org/images/entities/char_2009.gif) :
:![[thin space (1/6-em)]](https://www.rsc.org/images/entities/char_2009.gif) 2 and 4
2 and 4![[thin space (1/6-em)]](https://www.rsc.org/images/entities/char_2009.gif) :
:![[thin space (1/6-em)]](https://www.rsc.org/images/entities/char_2009.gif) 1 ratios are the formulations that result in the best photocatalytic activity.
1 ratios are the formulations that result in the best photocatalytic activity.
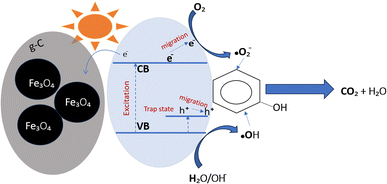
Phenol photodegradation using TiO2−x/Fe3O4@g-C as the catalyst is schematically illustrated in Fig. 14. The characterization results above revealed the formation of defects in the catalyst due to the increase in the hydrothermal condition. As a result, the trap state energy levels are formed within the band-gap of TiO2−x. The presence of the defects is known to strengthen the absorption in both UV and visible light regions. In addition, Ti3+ can act also as hole traps to suppress the recombination with the electron. In addition, the presence of glassy carbon helps in decreasing the charge carriers recombination,17 leading to overall improved photocatalytic activity towards the phenol degradation.46 On the other hand, the applicability of the Langmuir–Hinshelwood (L–H) model to the photodegradation results (see Fig. S3†) suggests the adsorption of phenol on the photocatalyst surface before being decomposed photocatalytically. Finally, the formed radicals react with the adsorbed phenol on the surface and degrade it.
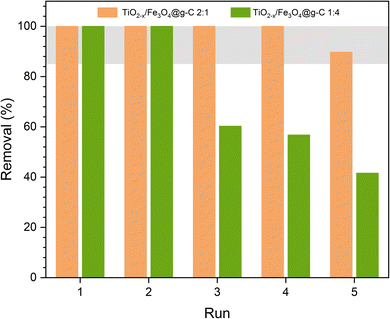
The ultimate goal of synthesizing a magnetically recoverable photocatalyst is to reuse it several times. Thus, the two best formulations were used in photocatalytic phenol removal several times. The photocatalysts were recovered magnetically and then introduced in the next experiment. Fig. 15 shows the variation in the phenol removal efficiency from one experiment to another. The efficiency decreased after the second experiment when using the TiO2−x![[thin space (1/6-em)]](https://www.rsc.org/images/entities/char_2009.gif) :
:![[thin space (1/6-em)]](https://www.rsc.org/images/entities/char_2009.gif) Fe3O4@g-C 1
Fe3O4@g-C 1![[thin space (1/6-em)]](https://www.rsc.org/images/entities/char_2009.gif) :
:![[thin space (1/6-em)]](https://www.rsc.org/images/entities/char_2009.gif) 4 composite. According to Fig. 13a, the rate of phenol degradation in this case is low, leading to the incomplete degradation of phenol within 4 h. In order to ensure that phenol was completely degraded, the reusability test was extended to 7 h. Although this duration was efficient for complete phenol degradation, it caused an accumulation of the formed by-product on the catalyst surface even after washing the catalyst with DW and ethanol. Overall, the removal percentage decreased from one run to the next. On the contrary, the TiO2−x
4 composite. According to Fig. 13a, the rate of phenol degradation in this case is low, leading to the incomplete degradation of phenol within 4 h. In order to ensure that phenol was completely degraded, the reusability test was extended to 7 h. Although this duration was efficient for complete phenol degradation, it caused an accumulation of the formed by-product on the catalyst surface even after washing the catalyst with DW and ethanol. Overall, the removal percentage decreased from one run to the next. On the contrary, the TiO2−x![[thin space (1/6-em)]](https://www.rsc.org/images/entities/char_2009.gif) :
:![[thin space (1/6-em)]](https://www.rsc.org/images/entities/char_2009.gif) Fe3O4@g-C 2
Fe3O4@g-C 2![[thin space (1/6-em)]](https://www.rsc.org/images/entities/char_2009.gif) :
:![[thin space (1/6-em)]](https://www.rsc.org/images/entities/char_2009.gif) 1 composite showed an excellent stable performance, revealing the stability of the composite. As its rate of degradation was high according to Fig. 13a, it caused the complete degradation of phenol in 4 h, making 7 h enough to degrade all the by-products and clean the catalyst surface.
1 composite showed an excellent stable performance, revealing the stability of the composite. As its rate of degradation was high according to Fig. 13a, it caused the complete degradation of phenol in 4 h, making 7 h enough to degrade all the by-products and clean the catalyst surface.
4. Conclusion
Defective TiO2−x was successfully prepared under different temperature and time conditions following a hydrothermal method. The formation of the anatase phase was demonstrated in the prepared samples. The formation of the defects was also confirmed. TiO2−x 200 °C/12 h and TiO2−x 200 °C/24 h samples showed a significant degree of defects; however, in case of TiO2−x 200 °C/12 h, the formation of massive defects negatively affects its performance. On the other hand, TiO2−x 200 °C/24 h showed the better removal of phenol. This could be attributed to the formation of defects and enhanced crystal growth that occurred on increasing the hydrothermal time. The defective composite TiO2−x/Fe3O4@g-C 200 °C/24 h was successfully prepared. The formation of chemical bonding between the two components was revealed by XPS analysis. Setting the ratio between Fe3O4@g-C and TiO2−x at 1![[thin space (1/6-em)]](https://www.rsc.org/images/entities/char_2009.gif) :
:![[thin space (1/6-em)]](https://www.rsc.org/images/entities/char_2009.gif) 2 and 4
2 and 4![[thin space (1/6-em)]](https://www.rsc.org/images/entities/char_2009.gif) :
:![[thin space (1/6-em)]](https://www.rsc.org/images/entities/char_2009.gif) 1 resulted in the best photocatalytic performance. However, the reusability test shows more degradation stability of the 1
1 resulted in the best photocatalytic performance. However, the reusability test shows more degradation stability of the 1![[thin space (1/6-em)]](https://www.rsc.org/images/entities/char_2009.gif) :
:![[thin space (1/6-em)]](https://www.rsc.org/images/entities/char_2009.gif) 2 ratio even after 5 runs.
2 ratio even after 5 runs.
Data availability
All data generated or analysed during this study are included in this article.Conflicts of interest
There are no conflicts to declare.Acknowledgements
This paper is based upon work supported by Science, Technology & Innovation Funding Authority (STDF) under grant number 37078.References
- (a) J. Zhang, F. Chen and B. He, Photocatalysis, Springer, 2018, DOI:10.1007/978-981-13-2113-9; (b) D. V. Bavykin, J. M. Friedrich and F. C. Walsh, Protonated Titanates and TiO2 Nanostructured Materials: Synthesis, Properties, and Applications, Adv. Mater., 18(21), 2807–2824 CrossRef CAS.
- A. Fujishima and K. Honda, Electrochemical evidence for the mechanism of the primary stage of photosynthesis, Bull. Chem. Soc. Jpn., 1971, 44(4), 1148–1150 CrossRef CAS.
- T. Rajaraman, S. P. Parikh and V. G. Gandhi, Black TiO2: A review of its properties and conflicting trends, Chem. Eng. J., 2020, 389, 123918 CrossRef CAS.
- S. Mereym, S. Nasreen, M. Siddique and R. Khan, An overview of the reaction conditions for an efficient photoconversion of CO2, Rev. Chem. Eng., 2017, 34, 409–425 CrossRef.
- S. C. Ameta and R. Ameta, Advanced Oxidation Processes for Wastewater Treatment: Emerging Green Chemical Technology, Academic Press, 2018 Search PubMed.
- J. Low, J. Yu, M. Jaroniec, S. Wageh and A. A. Al-Ghamdi, Heterojunction photocatalysts, Adv. Mater., 2017, 29(20), 1601694 CrossRef PubMed.
- X. Ding, W. Ho, J. Shang and L. Zhang, Self doping promoted photocatalytic removal of no under visible light with bi2moo6: Indispensable role of superoxide ions, Appl. Catal., B, 2016, 182, 316–325 CrossRef CAS.
- S. Na, S. Seo and H. Lee, Recent Developments of Advanced Ti3+-Self-Doped TiO2 for Efficient Visible-Light-Driven Photocatalysis, Catalysts, 2020, 10(6), 679 CrossRef CAS.
- S. Bai, N. Zhang, C. Gao and Y. Xiong, Defect engineering in photocatalytic materials, Nano Energy, 2018, 53, 296–336 CrossRef CAS.
- L. Yang, L. Xu, X. Bai and P. Jin, Enhanced visible-light activation of persulfate by Ti3+ self-doped TiO2/graphene nanocomposite for the rapid and efficient degradation of micropollutants in water, J. Hazard. Mater., 2019, 365, 107–117 CrossRef CAS PubMed.
- C. Wu, Z. Gao, S. Gao, Q. Wang, H. Xu and Z. Wang, et al., Ti3+ self-doped TiO2 photoelectrodes for photoelectrochemical water splitting and photoelectrocatalytic pollutant degradation, J. Energy Chem., 2016, 25(4), 726–733 CrossRef.
- H. Danan, A. Herr and A. Meyer, New determinations of the saturation magnetization of nickel and iron, J. Appl. Phys., 1968, 39(2), 669–670 CrossRef CAS.
- X. Wang, P. Zhang, W. Wang, X. Lei, B. Zou and H. Yang, Synthesis, structure and magnetic properties of graphite carbon encapsulated Fe 3 C nanoparticles for applications as adsorbents, RSC Adv., 2015, 5(35), 27857–27861 RSC.
- M. D. Nguyen, H.-V. Tran, S. Xu and T. R. Lee, Fe3O4 nanoparticles: structures, synthesis, magnetic properties, surface functionalization, and emerging applications, Appl. Sci., 2021, 11(23), 11301 CrossRef CAS PubMed.
- S. Rajendran, A. Blanco, L. Gnanasekaran, A. A. Jalil, W.-H. Chen and F. Gracia, Harvesting visible light for enhanced catalytic degradation of wastewater using TiO2@Fe3O4 embedded on two dimensional reduced graphene oxide nanosheets, Chemosphere, 2023, 345, 140418 CrossRef CAS PubMed.
- M. Nadimi, A. Ziarati Saravani, M. A. Aroon and A. Ebrahimian Pirbazari, Photodegradation of methylene blue by a ternary magnetic TiO2/Fe3O4/graphene oxide nanocomposite under visible light, Mater. Chem. Phys., 2019, 225, 464–474 CrossRef CAS.
- K. Jurkiewicz, M. Pawlyta, D. Zygadło, D. Chrobak, S. Duber and R. Wrzalik, et al., Evolution of glassy carbon under heat treatment: correlation structure–mechanical properties, J. Mater. Sci., 2018, 53(5), 3509–3523 CrossRef CAS.
- V. Uvarov and I. Popov, Metrological characterization of X-ray diffraction methods at different acquisition geometries for determination of crystallite size in nano-scale materials, Mater. Charact., 2013, 85, 111–123 CrossRef CAS.
- M. F. B. M. Na'aim, R. M. B. Ramli and N. A. B. M. Zabidi, Synthesis of ascorbic acid enhanced TiO2 photocatalyst: its characterization and catalytic activity in CO2 photoreduction, Metall. Mater. Eng., 2018, 24(1), 1–16 CrossRef PubMed.
- E. H. Mert, Y. Yalçın, M. Kılıç, N. San and Z. Çınar, Surface modification of TiO2 with ascorbic acid for heterogeneous photocatalysis: theory and experiment, J. Adv. Oxid. Technol., 2008, 11(2), 199–207 CAS.
- P. Makuła, M. Pacia and W. Macyk, How To Correctly Determine the Band Gap Energy of Modified Semiconductor Photocatalysts Based on UV–Vis Spectra, J. Phys. Chem. Lett., 2018, 9(23), 6814–6817 CrossRef PubMed.
- D. Li, H. Song, X. Meng, T. Shen, J. Sun and W. Han, et al., Effects of Particle Size on the Structure and Photocatalytic Performance by Alkali-Treated TiO2, Nanomaterials, 2020, 10(3), 546 CrossRef CAS PubMed.
- M. Wajid Shah, Y. Zhu, X. Fan, J. Zhao, Y. Li and S. Asim, et al., Facile synthesis of defective TiO2− x nanocrystals with high surface area and tailoring bandgap for visible-light photocatalysis, Sci. Rep., 2015, 5(1), 1–8 CrossRef PubMed.
- L. Han, B. Su, G. Liu, Z. Ma and X. An, Synthesis of oxygen vacancy-rich black TiO2 nanoparticles and the visible light photocatalytic performance, Mol. Catal., 2018, 456, 96–101 CrossRef CAS.
- T. Wang, W. Li, D. Xu, X. Wu, L. Cao and J. Meng, A novel and facile synthesis of black TiO2 with improved visible-light photocatalytic H2 generation: Impact of surface modification with CTAB on morphology, structure and property, Appl. Surf. Sci., 2017, 426, 325–332 CrossRef CAS.
- M. Gu, L. Pan, B. Tay and C. Q. Sun, Atomistic origin and temperature dependence of Raman optical redshift in nanostructures: a broken bond rule, J. Raman Spectrosc., 2007, 38(6), 780–788 CrossRef CAS.
- Z. Liang, J. Li, N. Lei, L. Guo and Q. Song, Construction of Ti 3+ self-doped TiO 2/BCN heterojunction with enhanced photoelectrochemical performance for water splitting, J. Mater. Sci.: Mater. Electron., 2019, 30, 2006–2015 CrossRef CAS.
- F. Meng, S. Zhang, X. Li, Y. Zeng and Q. Zhong, CrOx assembled at the oxygen vacancies on black-TiO2 for NO oxidation, Mol. Catal., 2019, 473, 110393 CrossRef CAS.
- D. Zhang, X. Ma, H. Zhang, Y. Liao and Q. Xiang, Enhanced photocatalytic hydrogen evolution activity of carbon and nitrogen self-doped TiO2 hollow sphere with the creation of oxygen vacancy and Ti3+, Mater. Today Energy, 2018, 10, 132–140 CrossRef.
- P. Wen, Y. Zhang, G. Xu, D. Ma, P. Qiu and X. Zhao, Ti3+ self-doped TiO2 as a photocatalyst for cyclohexane oxidation under visible light irradiation, Journal of Materiomics, 2019, 5(4), 696–701 CrossRef.
- D. Xue, J. Luo, Z. Li, Y. Yin and J. Shen, Enhanced photoelectrochemical properties from Mo-doped TiO2 nanotube arrays film, Coatings, 2020, 10(1), 75 CrossRef CAS.
- T. A. Gad-Allah, R. Zhang, Y. Wang and Y. Zhou, Facile one-pot synthesis of defective (001)-TiO2− x/h-BN photocatalyst for environmental applications, J. Alloys Compd., 2023, 954, 170187 CrossRef CAS.
- M. Stefan, O. Pana, C. Leostean, C. Bele, D. Silipas and M. Senila, et al., Synthesis and characterization of Fe3O4–TiO2 core-shell nanoparticles, J. Appl. Phys., 2014, 116(11), 114312 CrossRef.
- J. Huo, Y. Hu, H. Jiang and C. Li, In situ surface hydrogenation synthesis of Ti 3+ self-doped TiO 2 with enhanced visible light photoactivity, Nanoscale, 2014, 6(15), 9078–9084 RSC.
- Z. Cai, Y. Bi, E. Hu, W. Liu, N. Dwarica and Y. Tian, et al., Single-crystalline ultrathin Co3O4 nanosheets with massive vacancy defects for enhanced electrocatalysis, Adv. Energy Mater., 2018, 8(3), 1701694 CrossRef.
- C. Jin, B. Liu, Z. Lei and J. Sun, Structure and photoluminescence of the TiO 2 films grown by atomic layer deposition using tetrakis-dimethylamino titanium and ozone, Nanoscale Res. Lett., 2015, 10, 1–9 CrossRef CAS PubMed.
- M. S. Abdel-Wahed, A. S. El-Kalliny, F. A. Shehata, A. M. Abd El-Aty and T. A. Gad-Allah, One-pot green synthesis of magnetic adsorbent via Anabaena sphaerica and its performance towards Remazol Red dye removal from aqueous media, Chem. Eng. Sci., 2023, 118939 CrossRef CAS.
- J. Chen, J. Li, D. Xiong, Y. He, Y. Ji and Y. Qin, Preparation and tribological behavior of Ni-graphene composite coating under room temperature, Appl. Surf. Sci., 2016, 361, 49–56 CrossRef CAS.
- E. Castagnola, S. Thongpang, M. Hirabayashi, G. Nava, S. Nimbalkar and T. Nguyen, et al., Glassy carbon microelectrode arrays enable voltage-peak separated simultaneous detection of dopamine and serotonin using fast scan cyclic voltammetry, Analyst, 2021, 146(12), 3955–3970 RSC.
- U. Szeluga, S. Pusz, B. Kumanek, K. Olszowska, S. Czajkowska and J. Myalski, et al., Influence of unique structure of glassy carbon on morphology and properties of its epoxy-based binary composites and hybrid composites with carbon nanotubes, Compos. Sci. Technol., 2016, 134, 72–80 CrossRef CAS.
- M. Frenea-Robin and J. Marchalot, Basic principles and recent advances in magnetic cell separation, Magnetochemistry, 2022, 8(1), 11 CrossRef CAS.
- J. López, A. Rey, E. Viñuelas-Zahinos and P. M. Álvarez, Preparation of a new green magnetic Fe3O4 @TiO2-P25 photocatalyst for solar advanced oxidation processes in water, J. Environ. Chem. Eng., 2023, 11(3), 109999 CrossRef.
- C. Fu, G. Zhao, H. Zhang and S. Li, A facile route to controllable synthesis of Fe3O4/graphene composites and their application in lithium-ion batteries, Int. J. Electrochem. Sci., 2014, 9(1), 46–60 CrossRef.
- H. Wang, X. Xu and A. Neville, In situ synthesis of nanostructured Fe 3 O 4@ TiO 2 composite grown on activated carbon cloth as a binder-free electrode for high performance supercapacitors, RSC Adv., 2021, 11(38), 23541–23549 RSC.
- U. Naknikham, G. Magnacca, A. Qiao, P. K. Kristensen, V. Boffa and Y. Yue, Phenol abatement by titanium dioxide photocatalysts: effect of the graphene oxide loading, Nanomaterials, 2019, 9(7), 947 CrossRef CAS PubMed.
- G. K. Q. Ganharul, A. Tofanello, A. Bonadio, A. L. M. Freitas, M. T. Escote and A. S. Polo, et al., Disclosing the hidden presence of Ti3+ ions in different TiO2 crystal structures synthesized at low temperature and photocatalytic evaluation by methylene blue photobleaching, J. Mater. Res., 2021, 36(16), 3353–3365 CrossRef CAS.
Footnote |
| † Electronic supplementary information (ESI) available. See DOI: https://doi.org/10.1039/d4ra05990e |
| This journal is © The Royal Society of Chemistry 2024 |

