 Open Access Article
Synthesis of a nitrogen-rich dendrimer grafted on magnetic nanoparticles for efficient removal of Pb(II) and Cd(II) ions
Maziar Mirzaa,
Mohammad Ali Bodaghifard *bc and
Fatemeh Darvish*a
aDepartment of Organic Chemistry, Faculty of Chemistry, K. N. Toosi University of Technology, Tehran 15418-49611, Iran. E-mail: Darvish@kntu.ac.ir
bDepartment of Chemistry, Faculty of Science, Arak University, Arak 38481-77584, Iran
cInstitute of Nanosciences and Nanotechnology, Arak University, Arak 38481-77584, Iran. E-mail: mbodaghi2007@yahoo.com; m-bodaghifard@araku.ac.ir
First published on 15th October 2024
Abstract
Rapid industrialization, urbanization, and human activities in catchments have presented a significant global challenge in removing heavy metal contaminants from wastewater. Here, a study was conducted to synthesize a nano-magnetic dendrimer based on a trimesoyl core that can be easily separated from the environment using an external magnet (Fe3O4@NR-TMD-G1, Fe3O4@NR-TMD-G2). The synthesized structure was characterized using various conventional techniques such as Fourier transform infrared spectroscopy (FT-IR), scanning electron microscopy (SEM), powder X-ray diffraction (XRD), energy dispersive X-ray analysis (EDX), thermogravimetric analysis (TGA), vibrating sample magnetometry (VSM), and Brunauer–Emmett–Teller surface area analysis (BET). The prepared adsorbent showed good binding ability and excellent adsorption efficiency toward Pb(II) and Cd(II) metal ions from aqueous media (98.5%, 93.6%). The effect of different conditions including pH, adsorbate concentration, adsorbent dosage, isotherm, kinetics, and adsorption mechanism was considered. The highest adsorption efficiency was achieved at 25 °C and pH 4 using 0.08 g of Fe3O4@NR-TMD-G1, within 25 minutes for Pb(II) and 120 minutes for Cd(II), respectively. Batch adsorption experiments revealed that Fe3O4@NR-TMD-G1 was more effective in removing Pb(II) and Cd(II) compared to Fe3O4@NR-TMD-G2, with maximum capacities of 130.2 mg g−1 and 57 mg g−1, respectively. The adsorption process followed the Langmuir isotherm with a high correlation coefficient (R2 = 0.9952, 0.9817) and non-linear pseudo-second-order kinetic model. Density functional theory (DFT) analysis indicated that the adsorbent transferred electrons to Pb(II) and Cd(II), forming stable chelates on the nanostructure surface. The heavy metal ions could be adsorbed by coordination to the heteroatoms of the nanostructure and also by electrostatic interactions. The recycled hybrid nanomaterial was dried and applied to different adsorption–desorption tests and the desorption efficiency was found to be 98%. So, the newly synthesized dendritic magnetic nanostructure demonstrated significant potential in efficient removal of metal ions from water and wastewater, highlighting its importance in addressing the global challenge of heavy metal contamination.
1. Introduction
The continuous contamination of the water environment is a pressing issue, exacerbated by the rapid growth of the global population and the increasing intensity of human activities such as urbanization and industrialization.1 In recent decades, heavy metals such as chromium (Cr), cadmium (Cd), lead (Pb), nickel (Ni), mercury (Hg), and arsenic (As) have emerged as significant contributors to environmental degradation on a global scale due to their non-biodegradable nature.2 These toxic elements possess chemical stability and resistance to decomposition, allowing them to persistently accumulate in the environment and in living organisms. These ions have high solubility in aqueous media and could be easily absorbed and accumulated in the body, resulting in severe impacts to the health of humans and animals. Lead (Pb) in water sources has been linked to a range of health issues, particularly in children. Pb ions cause irreversible damage to the kidneys, bones, liver, and brain functions.3 Cadmium is a known nephrotoxic element that can cause damage to the kidneys and compromise the immune system, leading to a range of health issues including psychological disorders, nervous system dysfunction, skeletal deformities, and renal failure.4 Lead (Pb) is commonly used in the production of batteries, alloys, and pigments, which makes it a frequent contaminant in areas polluted by heavy metals. Lead (Pb) and cadmium (Cd) are especially abundant in these locations, presenting a substantial threat to both human health and the environment.5The commonly used techniques for removing the toxic metal ions from water and wastewater include coagulation, membrane exchange, ion exchange,6 electrochemical separation,7 catalytic reduction,8–11 and adsorption.12–16 These methods are widely used in various industries to effectively eliminate heavy metals from wastewater and other sources.
The adsorption technique remains an attractive, robust, and low-cost procedure for eliminating heavy metal ions. This method is preferred over other techniques due to its numerous advantages, including low cost, high efficiency, and ease of separation. A variety of adsorbents have been utilized for wastewater remediation, such as activated carbon,12 chitosan,13 biochar,14 zeolites,15 polymers,16 carbon nanotubes,17 metal–organic frameworks (MOF),18 natural minerals,19 and industrial by-products.19 Adsorbents made from natural sources such as tree bark, coconut husks, rice husks, potato peels, and sawdust have gained interest from scientists for environmental remediation due to their economic advantages.20 Alkaline earth metal oxides including surfactant-capped silver-doped calcium oxide facilitate the adsorption of lithium,21 magnesium–aluminium layered double hydroxides (Mg–Al-LDH) was utilized in adsorption of the dye reactive green 5 (RG5).22 Vachellia Nilotic sawdust was used for the effective adsorption of phosphorus from the aqueous solution.23 The use of nano-adsorbents in the treatment of heavy metal contaminants has yielded promising results due to their distinctive characteristics. These include a larger surface area, greater thermal stability, good reusability, smaller size, higher efficiency in regeneration, and magnetic properties.24 Magnetic Fe3O4-based adsorbents have gained global interest for their convenient separation feature.25 However, pure Fe3O4 particles exhibit poor stability, low surface viscosity, and high agglomeration, restricting their effectiveness in heavy metal pollution remediation.26 To address these limitations, Fe3O4 particles are commonly coated with a shell such as silica, carbon, graphene oxide, and polymers to improve their stability.27 This coating process enhances the overall performance and durability of the adsorbents, making them more efficient in removing heavy metals from contaminated environments. SiO2-coated Fe3O4 is widely used due to its high chemical stability and impressive surface modification capabilities.28
Dendrimers possess reactive terminal functional groups, a branched and regular three-dimensional framework, and interior cavities that can be accessed by targeted molecules. As a result, dendrimers have found applications in a wide range of fields including biomedicine, environmental science, nanotechnology, supramolecular chemistry, contaminant removal, chemical sensors, catalysis, and drug delivery.29 In comparison to polymers, dendrimers as highly branched and nano-sized macromolecules exhibit unique physical and chemical properties due to their uniform shape, consistent size distribution, high flexibility, and multifunctional nature. Also, dendrimers possess numerous potential binding sites for active species, making them highly effective for the adsorption process.30 Developing strategies to control the arrangement of functional groups and active sites on the surface of nanoparticles is crucial for effectively adsorbing metal contaminants. One method to enhance this process is by introducing a shell of polymers or dendritic structures to the surface of the nanoparticles. This not only improves the placement of functional groups but also enhances the dispersion of the nanoparticles in organic solvents.
Considering the unique properties of both magnetic nanoparticles (MNPs) and dendrimers, this study aimed to present the modification of silica-coated magnetite nanoparticles with nitrogen-rich dendritic branches (Fe3O4@NR-TMD-G1, Fe3O4@NR-TMD-G2) to construct a high-capacity adsorbent. The characterization of the dendrimer-decorated magnetic nanoparticles has been considered by various techniques. The adsorption efficiency of prepared dendritic nanomaterial has been studied for the removal of Pb(II) and Cd(II) ions from aqueous media.
2. Material and methods
2.1. Materials and analyses
All necessary chemicals including: iron(II) chloride tetrahydrate (FeCl2·4H2O) (Sigma Aldrich), iron(III) chloride hexahydrate (FeCl3·6H2O) (Sigma Aldrich), ammonium hydroxide solution (Merck), tetraethylorthosilicate (Si(OC2H5)4) (Sigma Aldrich), 3-aminopropyltriethoxysilane (C9H23NO3Si) (Sigma Aldrich), trimesoyl chloride (C6H3(COCl)3) (Sigma Aldrich), and ethylene diamine (C2H8N2) (Sigma Aldrich) were purchased and used without any further purification. A magnetic stirrer (Heidolph, Germany), a sonication apparatus (Grand, USA), an oven (Memmert, Germany), and a pH meter (Mettler Toledo, Switzerland) were used to prepare the MNP adsorbent. The characterization process of adsorbents was implemented through FT-IR (Shimadzu 8900, Japan), XRD (Philips pw 1730, Netherlands), FE-SEM (TESCAN MIRA II, Czech Republic), TGA (PerkinElmer SII, USA), and VSM (cryogenic limited PPMS, Japan) techniques. All aqueous solutions prepared using deionized water. The solutions were prepared and homogenized with an orbital shaker (17![[thin space (1/6-em)]](https://www.rsc.org/images/entities/char_2009.gif) 054 BIBBY sterilin, Germany). The concentrations of Pb(II) and Cd(II) were then measured with an ICP-OES spectrophotometer (Agilent 725ICP-OES, USA).
054 BIBBY sterilin, Germany). The concentrations of Pb(II) and Cd(II) were then measured with an ICP-OES spectrophotometer (Agilent 725ICP-OES, USA).
2.2. Preparation of Fe3O4@SiO2@PrNH2
Fe3O4@SiO2@PrNH2 was prepared in three steps: in the first step, Fe3O4 MNPs were synthesized through the co-precipitation method. FeCl2·4H2O (5 mmol, 0.99 g) and FeCl3·6H2O (10 mmol, 2.7 g) were dissolved in 100 mL of deionized water and then stirred at 80 °C for 1 h. NH4OH (10 mL, 25%) was added to the mixture and stirred for another 1 h under the same condition. Finally, the precipitate was separated with a magnet and washed with deionized water and ethanol. The resultant solid was dried at 70 °C in a vacuum oven. For the second step, Fe3O4@SiO2 was manufactured through the Stöber method.31 Fe3O4 MNPs (1 g) were dispersed in 40 mL of ethanol and 6 mL of water under ultrasound irradiation for 30 min. NH3 (1.5 mL, 25%) was added to the mixture. After that, tetraethylorthosilicate (TEOS) (1.5 mL) was added and stirred at room temperature for 12 h. The final precipitate was recovered and washed with deionized water and ethanol, and dried at 70 °C in a vacuum oven. At the final step, Fe3O4@SiO2 (1 g) and 20 mL of toluene were poured into a round-bottom flask (100 mL) and dispersed under ultrasound radiation for 30 min. Then 1.5 mL of 3-aminopropyltriethoxysilane (ATPES) was added to the mixture and sonicated for 10 min. The mixture was refluxed for 24 h at 110 °C. The black precipitate was separated with an external magnet, washed with toluene, and dried at 70 °C in a vacuum oven.2.3. Preparations of Fe3O4@NR-TMD-G1
This adsorbent was prepared in two steps by using Fe3O4@SiO2@PrNH2 as the starting material. In the first step, 1 g of Fe3O4@SiO2@PrNH2 was placed in a round-bottom flask and dispersed in 50 mL of tetrahydrofuran for 30 minutes. Triethylamine (1 mL) and trimesoylchloride (TMC, 1 g) were then added and stirred at room temperature for 24 hours. The solid was isolated using a magnet, washed with dichloromethane, and dried at 70 °C in a vacuum oven to obtain Fe3O4@TMC nanostructure. For the second step, 1 g of Fe3O4@TMC was dispersed in 50 mL of THF for 30 minutes. Triethylamine (1 mL) and ethylenediamine (1 g) were added and stirred at room temperature for 24 hours. The solid was isolated using a magnet, washed with dichloromethane, and dried at 70 °C in a vacuum oven.2.4. Preparations of Fe3O4@NR-TMD-G2
Fe3O4@NR-TMD-G2 was prepared in two steps by using Fe3O4@NR-TMD-G1 as a starting material. At the first step, the Fe3O4@NR-TMD-G1 (1 g) was poured into a round-bottom flask and dispersed in tetrahydrofuran (50 mL) for 30 min. Triethylamine (1 mL) and trimesoyl chloride (1 g) were then added and stirred at room temperature for 24 h. The solid was isolated with a magnet and washed with dichloromethane. The mixture was then dried at 70 °C in a vacuum oven. At the second step, the prepared solid (1 g) was dispersed in 50 mL THF for 30 min. Triethylamine (1 g) and ethylenediamine (1 g) were then added and stirred at room temperature for 24 h. The solid was isolated with a magnet and washed with dichloromethane. The mixture was then dried at 70 °C in a vacuum oven.2.5. Adsorption experiments
The adsorption behaviours of Fe3O4@NR-TMD-G1 and Fe3O4@NR-TMD-G2 for Pb(II) and Cd(II) were assessed in batch experiments under different conditions. The effects of Fe3O4@NR-TMD-G1 dosages were analysed on 200 mg L−1 of Pb(II) and Cd(II). Moreover, the effect of pH (2–6) on the adsorption of Pb(II) and Cd(II) was evaluated by using the 3.2 g L−1 adsorbent. HCl (0.1 M) and NaOH (0.1 M) solutions were used to adjust pH of solution. Amounts of Pb(II) and Cd(II) in the solution were evaluated through Inductively Coupling Plasma Optical Emission Spectroscopy (ICP-OES). Removal efficiency (Re%) and adsorption capacity (mg g−1) can be determined through eqn (1) and (2).
 | (1) |
 | (2) |
DFT calculation was performed to demonstrate the adsorption mechanism. Gaussian 09 was employed to conduct DFT calculation with the B3LYP function.32–34 Dendritic Organic moiety of adsorbent was used as the computational model to improve the computing efficiency. The geometry optimization of the complex was then performed under the basis set of 6-311G (d, p) for all atoms except the metal ion (using LANL2DZ). The natural bond analysis was then conducted to evaluate the interaction mechanism. It is calculated using an integral equation formalism polarization continuum model (IEPCM) with water being the solvent to account for solvation effect.35 The adsorption energy (Eads) is determined through eqn (3).36
| Eads = Etotal − (Eligand + Emetal) | (3) |
3. Result and discussion
This study utilized a divergent approach to introduce dendritic branches onto solid supports by connecting a linker to the surface of magnetic nanoparticles. Trimesoyl core-based poly (ethylendiamine) dendrimer were grown on the surface of silica-coated magnetite nanoparticles (Scheme 1). Initially, magnetic Fe3O4 nanoparticles were prepared using the co-precipitation method, and a silica layer was created using the Stöber method. The (3-aminopropyl) triethoxysilane (APTMS) linker was then attached to the particle surface. The nucleophilic substitution of amino groups on trimesoyl chloride results in the formation of the Fe3O4@SiO2@TMC structure. Subsequently, polyamino dendrons up to generation two (G2) were created through a series of stepwise consecutive nucleophilic substitutions of diaminoethane on the trimesoyl chloride.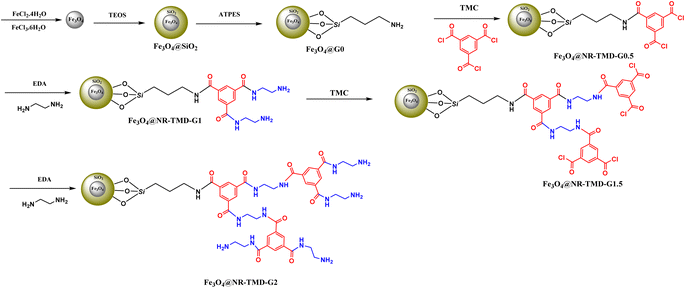 | ||
| Scheme 1 The synthetic pathway to construct dendrimer-decorated magnetic nanostructures (Fe3O4@NR-TMD-G1, Fe3O4@NR-TMD-G2). | ||
3.1. Characterization of adsorbents
Fig. 1 displays the FT-IR spectra of modified nanoparticles. The FT-IR spectrum of MNPs Fe3O4 (Fig. 1a) indicates the characteristic of the Fe–O absorption band around 590 cm−1. Fig. 1b depicts the band at 1073, 900–800, and 450 cm−1 relating to the asymmetric stretching, symmetric stretching, in-plane bending, and rocking modes of Si–O–Si and Si–O bonds. The presence of an alkyl group was corroborated by weak symmetric and asymmetric vibrations at 2980 and 2895 cm−1 (Fig. 1c). For Fe3O4@TMC-G0.5, the absorption band of Fe–O appears at 580 cm−1, whereas those of 1100 cm−1 belong to Si–O–Si splitting of the peak in the C![[double bond, length as m-dash]](https://www.rsc.org/images/entities/char_e001.gif) O stench vibration zone due to amide and acyl chloride (Fig. 1d). After reaction with EDA to generate Fe3O4@NR-TMD-G1, two peaks at 1800 and 1670 cm−1 disappeared, and the peak of the amide group appeared at 1640 cm−1 suggesting the successful synthesis of Fe3O4@NR-TMD-G1. The FT-IR spectrum of Fe3O4@NR-TMD-G1 and that of Fe3O4@NR-TMD-G2 are similar.
O stench vibration zone due to amide and acyl chloride (Fig. 1d). After reaction with EDA to generate Fe3O4@NR-TMD-G1, two peaks at 1800 and 1670 cm−1 disappeared, and the peak of the amide group appeared at 1640 cm−1 suggesting the successful synthesis of Fe3O4@NR-TMD-G1. The FT-IR spectrum of Fe3O4@NR-TMD-G1 and that of Fe3O4@NR-TMD-G2 are similar.
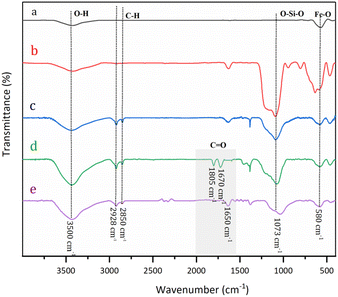 | ||
| Fig. 1 FT-IR spectra of Fe3O4 (a), Fe3O4@SiO2 (b), Fe3O4@SiO2-PrNH2 (c), TMC (d), and Fe3O4@NR-TMD-G1 (e). | ||
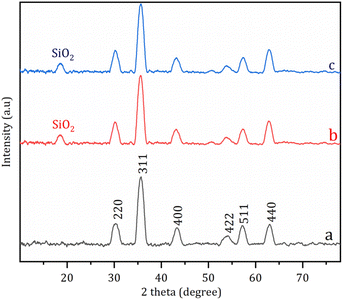
Fig. 2 demonstrates the XRD patterns of nanostructures. The characteristic (220), (311), (400), (422), (511) and (440) crystals of Fe3O4 were present at 30.2°, 35.6°, 43.3°, 53.4°, 57.1°, and 62.5°, respectively (Fig. 2a–c).37 These crystal planes still existed in the XRD spectra of Fe3O4@NR-TMD-G1 and Fe3O4@NR-TMD-G2 (Fig. 2b and c) at the same position, implying that the crystal structure of Fe3O4 was not destroyed during functionalization. Furthermore, a weak diffraction peak attributed to amorphous silica was observed at 18°, suggesting the successful coating of Fe3O4 by SiO2.38
Fig. 3 shows the thermal stability of the adsorbent. The first stage of weight loss for the physically adsorbed water was observed within the range of 25–110 °C. The surface silanol group condensation of silica was then found for a slight loss from 110 to 220 °C. After that, a decrease was observed within the range of 220–700 °C due to the decomposition of the residual silanol group and trimesoyl chloride dendrimers. The final weight losses were 21% and 11% for Fe3O4@NR-TMD-G1 and Fe3O4@NR-TMD-G2, respectively. The higher thermal stability of Fe3O4@NR-TMD-G2 than that of Fe3O4@NR-TMD-G1 was due to the growing number of aromatic amide bonds as the MNP adsorbents were generated.
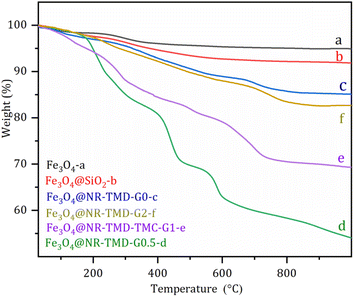 | ||
| Fig. 3 TGA analysis of Fe3O4 (a), Fe3O4@SiO2 (b), Fe3O4@NR-TMD-G0 (c), Fe3O4@NR-TMD-G0.5 (d), Fe3O4@NR-TMD-G1 (e), and Fe3O4@NR-TMD-G2 (f). | ||
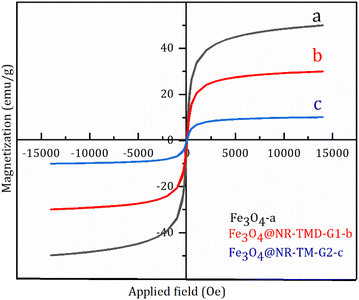
The VSM analysis was performed to determine the magnetization properties of MNPs and various organic compounds doped at room temperature. Fig. 4 depicts the S-like magnetization curve, the coincidence of the hysteresis loop, and the low remanence, coercively confirming the superparamagnetic properties of MNP adsorbents. The maximum saturated magnetization of Fe3O4 nanoparticle was measured at 50 emu g−1, which dropped by 30 emu g−1 for Fe3O4@NR-TMD-G1 and 10 emu g−1 for Fe3O4@NR-TMD-G2 (Fig. 4c). The saturated magnetization reduction with the growing dendrimer generation was due to the shielding of silica shell and trimesoyl chloride-based dendrimer decorated on the surface of magnetic Fe3O4. Although there was a decrease in the saturated magnetization after decoration, it could be easily taken out from the reaction medium with an external magnetic separator.25
Adsorption has more complicated levels in some cases which involve many factors affecting this process, e.g., pore size distribution, pore volume, and surface area. The surface chemistry and textural structure of an adsorbent play a key role in evaluating the interaction. The BET equation (eqn (4)) can be used to estimate the surface area of the adsorbent.39 Where P refers to the partial vapor pressure of the adsorbate gas in equilibrium with the surface at 77.4 K (Pa), and P0 denotes the saturated pressure of the adsorbate gas (Pa). Moreover, Vα indicates the volume of gas adsorbed at standard temperature and pressure (STP) (mL), whereas Vm represents the volume of gas adsorbed at STP to produce an apparent monolayer on the sample surface (mL). Moreover, C refers to the dimensionless constant associated with the enthalpy of adsorption for the adsorbate gas on the adsorbent.
 | (4) |
Fig. 5 depicts the N2 adsorption–desorption plot and pore size distribution plot. In addition, Table 1 summarizes the corresponding N2 adsorption–desorption results. Notably, both adsorbents exhibit mesopores and micropores within the range of 2 to 50 nanometers. Both adsorbents exhibit a clear H3-type hysteresis loop, signifying the existence of pores with varying sizes. According to Table 1, while the Fe3O4@NR-TMD-G2 adsorbent boasts a greater surface area, its pore diameter is smaller than that of Fe3O4@NR-TMD-G1. Interestingly, Fe3O4@NR-TMD-G1 has a higher number of mesopores, leading to improved adsorption efficiency. The constant C in BET equation plays a crucial role in assessing the level of interaction between the adsorbent and the adsorbate. Its value is higher in the Fe3O4@NR-TMD-G1 adsorbent than in the Fe3O4@NR-TMD-G2 adsorbent, a fact which suggests greater surface adsorption enthalpy in the initial adsorbed layer and stronger interaction energy between the adsorbent and the adsorbate.40
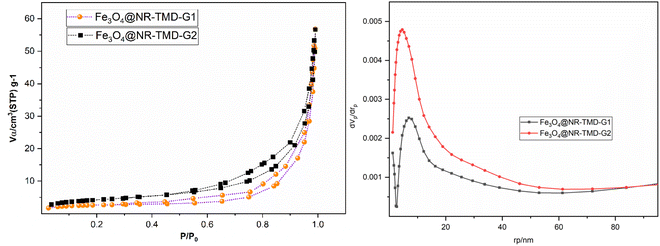 | ||
| Fig. 5 Adsorption–desorption and pore size distribution plots of Fe3O4@NR-TMD-G1, and Fe3O4@NR-TMD-G2 adsorbents. | ||
| Adsorbents | Surface area (m2 g−1) | Average pore diameter (nm) | C |
|---|---|---|---|
| Fe3O4@NR-TMD-G1 | 9.88 | 34.43 | 116.4 |
| Fe3O4@NR-TMD-G2 | 24.03 | 21.14 | 76.094 |
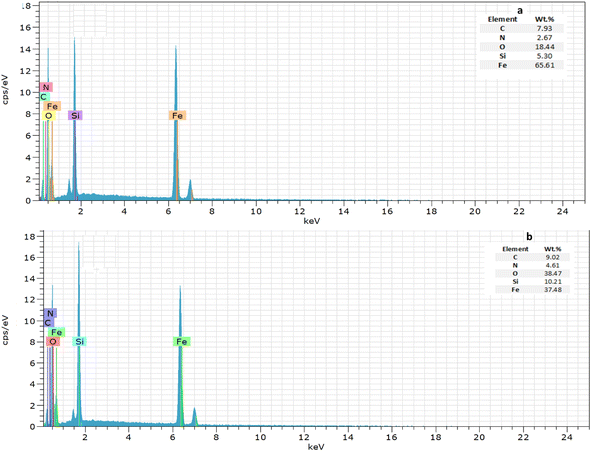
The SEM technique is employed to analyse the microstructural texture and surface morphology. One of the key parameters affecting the adsorption process is the pore structure, e.g., micro, meso, and macro in the adsorbent. Fig. 6 presents the SEM images and the histogram diagrams regarding the generation of both adsorbents. Accordingly, the particle size distribution is uniform in a spherical shape with a 3D porous structure; however, the Fe3O4@NR-TMD-G1 sample displays a more regular dispersity of particle size than Fe3O4@NR-TMD-G2. Therefore, it enhances the effective interface contact with metals. Moreover, the Fe3O4@NR-TMD-G1 has a larger average pore diameter that is more favourable for trapping lead ions, possessing a larger ion size than cadmium. In other words, the agglomeration of the particles observed in Fe3O4@NR-TMD-G2 can reduce micro and mesopores causing some potentially negative effects on the adsorption processes.41 The energy-dispersive X-ray spectroscopy (EDS) obtained from SEM analysis of Fe3O4@NR-TMD-G1 and Fe3O4@NR-TMD G2 display presence of Fe/Si/O/N/C in NMPs adsorbent (Fig. 7).
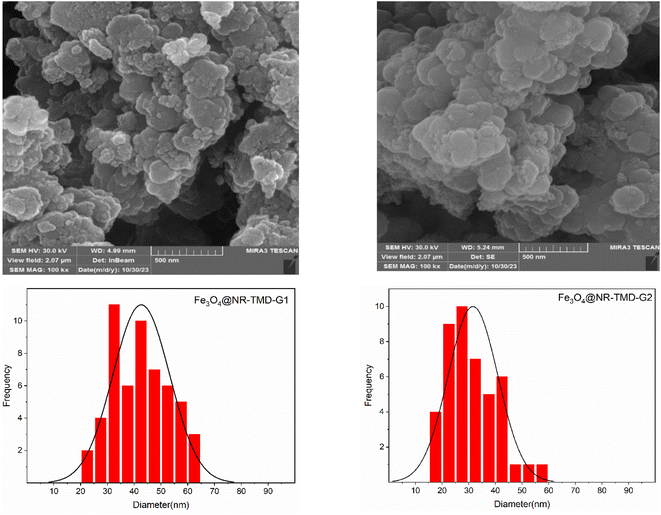 | ||
| Fig. 6 SEM image and particle size distribution of Fe3O4@NR-TMD-G1, and Fe3O4@NR-TMD-G2 nanostructures. | ||
4. The adsorption results
4.1. Effect of adsorption parameters
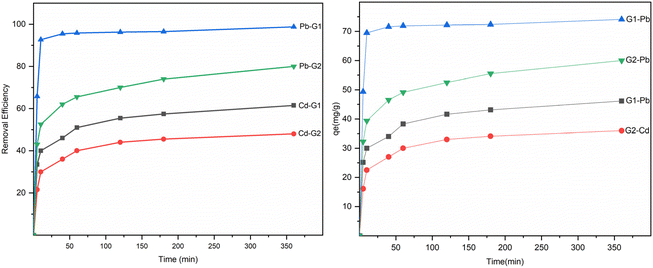
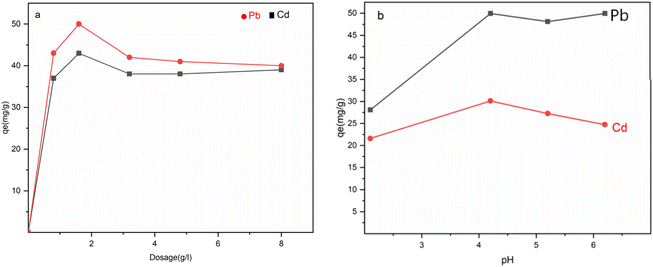
The rate of adsorption increased rapidly at first but then gradually slowed down until reaching an equilibrium presented in Fig. 8. Pb(II) reached the adsorption equilibrium on Fe3O4@NR-TMD-G1 and Fe3O4@NR-TMD-G2 within 25 and 120 minutes, respectively, whereas Cd(II) took 120 minutes on both nano-adsorbents. Fe3O4@NR-TMD-G1 demonstrated superior performance in adsorbing both ions when compared to Fe3O4@NR-TMD-G2 in a shorter period and with more efficacy of removal. These findings are consistent with the results obtained from the BET analysis. Because of this, we proceed to analyse the effective parameters in the adsorption process of Fe3O4@NR-TMD-G1. The rapid increase in the percentage removal at the beginning of the adsorption process is due to a large number of vacant binding sites on the adsorbent and faster diffusion of metal ions in the pores of dendritic nanomaterial.Increasing the amount of the adsorbent within a certain range can result in the desired removal effect and reduce costs. Fig. 9a indicates the optimum dosage of Fe3O4@NR-TMD-G1. As the dosage of Fe3O4@NR-TMD-G1 increased, the removal of each heavy metal was accelerated. However, it did not change anymore when the amount of the adsorbent exceeded 1.6 g L−1. Under these conditions, the residual ion concentration in the solution and at the adsorption interface reached an equilibrium. After that, increasing the adsorbent dosage had no tangible effects on improving the removal rate of heavy metals. Meanwhile, the number of capacities increased under the same conditions. However, the removal rate did not change greatly, something which reduced the adsorption capacity of Fe3O4@NR-TMD-G1 per unit of mass and created a substantial amount of material wastage.42
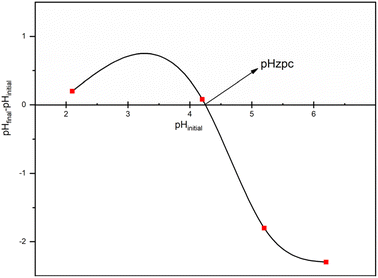
The pH value of the solution is one of the key parameters in adsorption processes, as the pH value of the adsorption media can change due to the dissociation of functional groups in the active adsorption area of an adsorbent. The surface charge of an adsorbent and the ionization degrees of materials are related to the effects of variations in the pH value (Fig. 9b). As the solution pH increased from 1 to 4, the adsorption of Pb(II) and Cd(II) ions increased sharply and achieved the best adsorption at pH 4.3 for both MNP adsorbents. The –NH and –C![[double bond, length as m-dash]](https://www.rsc.org/images/entities/char_e001.gif) N– groups of trimesoyl chloride dendrimers existed in proportion from –OH2+, –NH2+, and –C
N– groups of trimesoyl chloride dendrimers existed in proportion from –OH2+, –NH2+, and –C![[double bond, length as m-dash]](https://www.rsc.org/images/entities/char_e001.gif) NH+ at low pH values. The removal of ions would be blocked by the electrostatic repulsion between the protonate adsorbents and ions. Moreover, repulsion occurs between the protonate adsorbents and ions. The protonation degree would decrease, and the binding sites would be abundant with increases in pH. The influence of pH on adsorption can be investigated by considering the concept of zero-point charge (pHzpc), which refers to the pH at which the adsorbent has a zero charge.43 Below the pHzpc, the surface of the adsorbent is positively charged, while above it is negatively charged.44 The pHzpc value for the adsorbent was found to be 4.3 (Fig. 10). It was observed that the efficiency of heavy metals removal by adsorption increased as the pH levels increased from 2 to 4.3 (Fig. 10). At pH levels below 4.3, the adsorption capacity decreases. This is because H+ ions and metal ions compete for binding to the active sites on the surface of the adsorbent at lower pH levels. Furthermore, the adsorbent surface becomes positively charged at low pH levels, facilitating the desorption of cations. Basic pH (pH > 7) was not used to avoid removal of metal ions by precipitation.45
NH+ at low pH values. The removal of ions would be blocked by the electrostatic repulsion between the protonate adsorbents and ions. Moreover, repulsion occurs between the protonate adsorbents and ions. The protonation degree would decrease, and the binding sites would be abundant with increases in pH. The influence of pH on adsorption can be investigated by considering the concept of zero-point charge (pHzpc), which refers to the pH at which the adsorbent has a zero charge.43 Below the pHzpc, the surface of the adsorbent is positively charged, while above it is negatively charged.44 The pHzpc value for the adsorbent was found to be 4.3 (Fig. 10). It was observed that the efficiency of heavy metals removal by adsorption increased as the pH levels increased from 2 to 4.3 (Fig. 10). At pH levels below 4.3, the adsorption capacity decreases. This is because H+ ions and metal ions compete for binding to the active sites on the surface of the adsorbent at lower pH levels. Furthermore, the adsorbent surface becomes positively charged at low pH levels, facilitating the desorption of cations. Basic pH (pH > 7) was not used to avoid removal of metal ions by precipitation.45
4.2. Kinetic adsorption
The non-linear pseudo-first-order (NPFO) model, non-linear pseudo-second-order (NPSO) model were adopted to interpret the kinetic adsorption mechanism. The non-linear forms of pseudo-first-order and pseudo-second-order models can be expressed by eqn (5) and (6).46,47| qt = qe(1 − e−k1t) | (5) |
 | (6) |
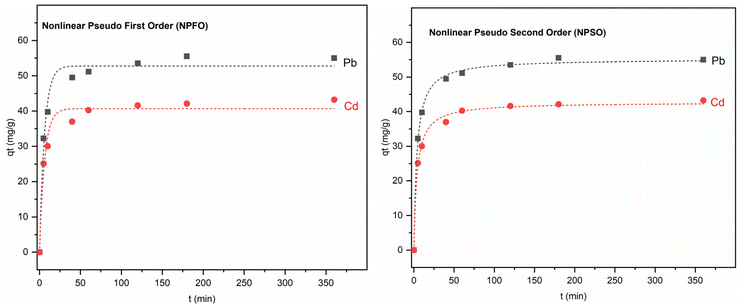 | ||
| Fig. 11 The fitting curves: non-linear pseudo-first-order and pseudo-second-order models for Pb(II) and Cd(II) adsorption by Fe3O4@NR-TMD-G1. | ||
| Kinetic model | Pb(II) | Cd(II) | |
|---|---|---|---|
| Fe3O4@NR-TMD-G1 | Fe3O4@NR-TMD-G1 | ||
| Pseudo-first-order | k1 (h−1) | 0.16499 | 0.16257 |
| χ2 | 5.99472 | 6.8361 | |
| qe,cal (mg g−1) | 54.21 | 40.69 | |
| qe,exp (mg g−1) | 74.22 | 46.12 | |
| R2 | 0.98351 | 0.97582 | |
| Pseudo-second-order | k2 (g mg−1 h−1) | 0.0047 | 0.00602 |
| χ2 | 0.80506 | 1.09416 | |
| qe (mg g−1) | 74.62 | 46.74 | |
| qe,exp (mg g−1) | 74.22 | 46.12 | |
| R2 | 0.99806 | 0.99559 |
4.3. Adsorption isotherm
Isotherm plays a key role in elucidating the adsorption mechanism, as it describes the interactive behaviour between adsorbents and adsorbates. The equilibrium data were modelled on the Langmuir, Freundlich, and Dubinin–Radushkevich (D–R) models. The Langmuir model suggests that the adsorption proceeds on a homogeneous surface with the linear form of the Langmuir model that can be expressed by eqn (7).48
 | (7) |
This equation indicates the uniform energy by monolayer coverage, where all sites are equal and have no interaction.
Where qe denotes the adsorption capacity in equilibrium, and qm indicates the maximum adsorption capacity (mg g−1). Moreover, Ce represents the metal ion concentration in equilibrium (mg L−1), and KL refers to the Langmuir constant (L mg−1).
The Langmuir isotherm parameters were employed to calculate the affinity between the adsorbent and the adsorbate through the dimensionless separation factor of RL determined through the following equation:
The values of RL promulgated whether the adsorption was irreversible (RL = 0), favourable (RL < 1), linear (RL = 1), or unfavourable (RL > 1).
Freundlich describes the capture of metal ions on a non-uniform surface by multilayer adsorption with different forms of adsorption energy. The linear form of Freundlich can be expressed by eqn (8).49 Where KF denotes the Freundlich constant (L mg−1), and n refers to the adsorption intensity exponent (dimensionless).
 | (8) |
The Dubinin–Radushkevich (D–R) isotherm model was adopted to confirm whether adsorption was physical or chemical. The linear equation of the D–R isotherm model can be expressed by eqn (9).43,50
ln![[thin space (1/6-em)]](https://www.rsc.org/images/entities/char_2009.gif) qe = ln qe = ln![[thin space (1/6-em)]](https://www.rsc.org/images/entities/char_2009.gif) qm − βε2 qm − βε2
| (9) |
The mean energy (kJ mol−1) can be obtained from
The value of E can be employed to evaluate whether the adsorption process was physical or chemical. The adsorption is considered to proceed chemically when E falls within the range of 8–16 kJ mol−1. It is also expected to proceed physically when E is below 8 kJ mol−1. Fig. 12 depicts the fitting curves for the adsorption isotherm models, and the corresponding parameters can be found in Table 3. Compared to the Freundlich model, the Langmuir model provides a better correlation coefficient that can better characterize the adsorption of Pb(II) and Cd(II) on the surface of nano-adsorbents. The maximum adsorption capacities (qm) obtained from the Langmuir model were 57.14 mg g−1 and 130.2 mg g−1 for Cd(II) and Pb(II), respectively. Furthermore, the calculated separation factor RL exists within the range of 0 to 1, indicating that the nano-adsorbents were favourable for the adsorption process of both Cd(II) and Pb(II).
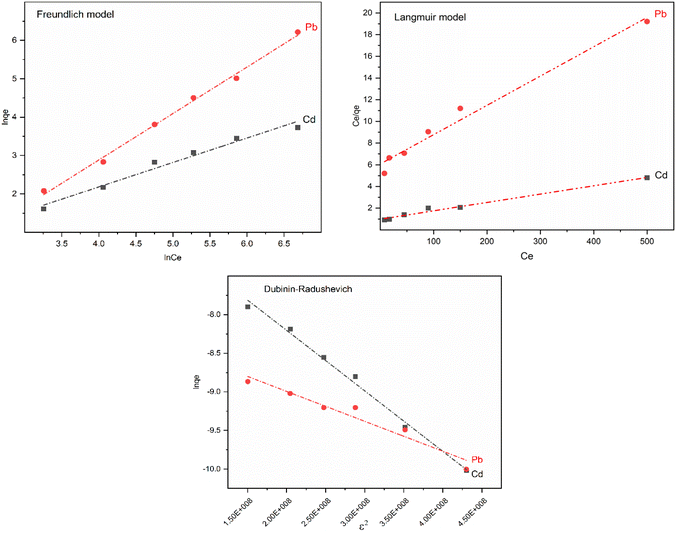 | ||
| Fig. 12 Isotherm fitting curves for adsorption of Pb(II) and Cd(II) on Fe3O4@NR-TMD-G1 nanostructure (T = 298 K). | ||
| Isotherm model | Parameter | Metal ion | |
|---|---|---|---|
| Cd(II) | Pb(II) | ||
| Langmuir | KL (L mg−1) | 0.0033 | 0.0077 |
| qmax (mg g−1) | 57.14 | 130.2 | |
| RL | 0.85 | 0.722 | |
| R2 | 0.9952 | 0.9817 | |
| Freundlich | KF (L mg−1) | 0.43 | 1.26 |
| n | 1.56 | 1.65 | |
| R2 | 0.9769 | 0.9730 | |
| Dubinin–Radushkevich | β (mol2 kJ−2) | 7.844 × 10⁻⁹ | 6.0772 × 10⁻⁹ |
| E (kJ mol−1) | 8 | 9.10 | |
| R2 | 0.9926 | 0.9890 | |
Furthermore, the Freundlich model also correlated well (R2 = 0.9769–0.9730) with KF Pb(II) > KF Cd(II), implying that the nano-adsorbent had greater adsorption potential for Pb(II) than for Cd(II). This finding was consistent with the results of adsorption experiments. Additionally, ions on nano-adsorbents had a preferential adsorption process due to the Freundlich constant 1/n, which was greater than 0 and smaller than 1. For further details on the adsorption process, the value of E calculated from the Dubinin–Radushkevich model was also considered. The range of E value at 8–16 kJ mol−1 was preferred to the chemisorption behaviour, and the E values of Pb(II) and Cd(II) adsorption fell within the range of 8–16 kJ mol−1. Therefore, adsorption proceeded through the chemisorption process.
4.4. Computational aspects and adsorption mechanism
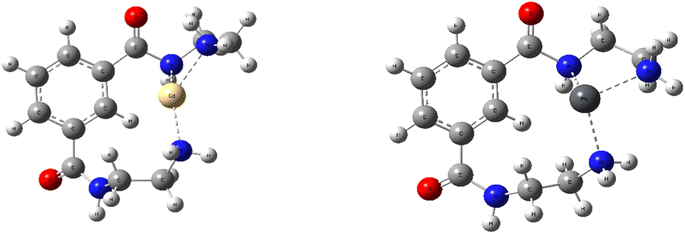
The adsorption mechanism was further elucidated by theatrical calculation through the DFT method. Fig. 13 indicates the optimized geometry of Fe3O4@NR-TMD-G1 with Pb(II) and Cd(II), and Table 4 lists the calculated parameters. The calculated adsorption energy revealed that Eads for Pb(II) was lower than Eads for Cd(II), indicating that Pb(II) was more robust on Fe3O4@NR-TMD-G1 than Cd(II). These findings were consistent with the experimental results. The adsorption mechanisms of Fe3O4@NR-TMD-G1 interactions with Pb(II) and Cd(II) were further revealed by the NBO analysis.51| Complex | Eads (kcal mol−1) | NBO partial charge | Electronic configuration of metal | |
|---|---|---|---|---|
| Ligand | Metal | |||
| Fe3O4@NR-TMD-G1-Pb | −73.433 | 0.5 | 1.49 | 6s1.94 6p0.55 7p0.01 |
| Fe3O4@NR-TMD-G1-Cd | 2.80 | 0.57 | 1.42 | 5s0.38 4d9.99 5p0.2 6p0.01 |
The NBO partial charges of Pb(II) and Cd(II) in the complex were 1.49 and 1.42, respectively, which were smaller than 2, indicating the existence of charge transfer from the ligand to metal during the adsorption process. Compared to the bared Pb(II), the electron configuration of Pb(II) in the complex was 6s1.94 6p0.55, suggesting that the electron transferred mainly from the ligand to 6s and 6p empty orbital of Pb(II). However, the electron configuration of Cd(II) in the complex was 5s0.38 4d9.99 6p0.01, demonstrating the electron transfer from the ligand to 5 s empty orbital of Cd(II) dominating the coordination.52
Electron-donating and electron-gaining abilities are expressed in terms of HOMO and LUMO, respectively. Egap = ELUMO − EHOMO is considered a measurement of how easily a molecule can be excited.35 Fig. 14 shows variations in HOMO–LUMO and Egap of Fe3O4@NR-TMD-G1, Fe3O4@NR-TMD-G1-Pb, and Fe3O4@NR-TMD-G1-Cd. However, a change was noticed in both HOMO and LUMO after the adsorption of Pb(II) and Cd(II) onto Fe3O4@NR-TMD-G1 structure. There was also a decrease in the Egap of Fe3O4@NR-TMD-G1-Pb and Fe3O4@NR-TMD-G1-Cd, suggesting that the adsorption of Pb(II) and Cd(II) destabilized the former steady structure.44
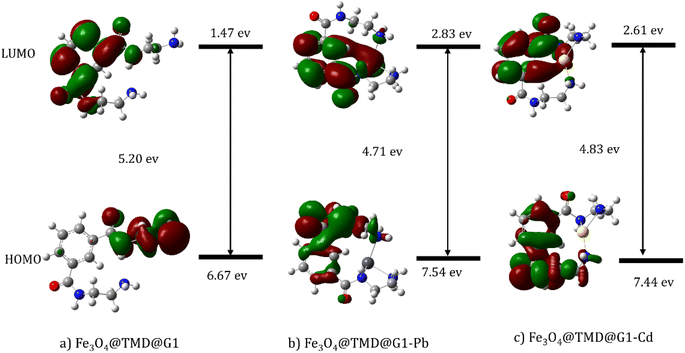 | ||
| Fig. 14 HOMO and LUMO plots of (a) Fe3O4@NR-TMD-G1, (b) Fe3O4@NR-TMD-G1-Pb and (c) Fe3O4@NR-TMD-G1-Cd structures. | ||
Differences in the adsorption capabilities of Fe3O4@NR-TMD-G1 for Pb(II) and Cd(II) can be explicated by the following implications. (1) The system formed by incorporating the sample with Pb(II) is more stable because the adsorption energy of the sample for Pb(II) calculated through DFT is significantly greater than that of Cd(II). (2) The Pb ion has a shorter hydration radius (0.401 nm) than the Cd ion (0.426 nm). Pb ions have lower levels of hydration energy (1481 kJ) than Cd ions (1755 kJ) (Table 5).53,54 Therefore, they can escape more easily from the hydration shell and enter the Fe3O4@NR-TMD-G1 network structure due to their low levels of hydration energy and short radii. As a result, they increase the adsorption affinity. (3) According to the theory of soft and hard acid bases, Pb(II) belongs to hard Lewis acids, and Cd(II) belongs to soft Lewis acids. Moreover, amino and carboxyl groups belong to hard bases; therefore, Fe3O4@NR-TMD-G1 has a higher affinity for Pb(II).35 It seems that electrostatic interaction and coordination of heteroatoms with metal ions play key roles in the adsorption of nanostructures.
| Parameters | Pb(II) | Cd(II) |
|---|---|---|
| Ionic radius (Å) | 1.32 | 0.97 |
| Electronegativity | 2.33 | 0.69 |
| Hydrated radius (Å) | 4.01 | 4.26 |
| Hydration energy (kJ mol−1) | −1481 | −1755 |
5. Comparison of Fe3O4@NR-TMD-G1 with other adsorbents
The maximum adsorption capacity of Pb(II) and Cd(II) on Fe3O4@NR-TMD-G1 were evaluated in comparison to other previously reported adsorbents. According to the Table 6, the maximum adsorption capacities (qm) of Fe3O4@NR-TMD-G1 for Pb(II) and Cd(II) are 130.2 and 57 mg g−1, respectively. Therefore, these results indicate that Fe3O4@NR-TMD-G1 is a favourable option for environmental clean-up of Pb(II) and Cd(II) ions when compared to other adsorbents.| Adsorbent | qm (mg g−1) | Reference | |
|---|---|---|---|
| Pb(II) | Cd(II) | ||
| NH2 functionalized magnetic graphene composite | 27.83 | 27.83 | 55 |
| NH2-MCM-41 nanoparticle | 18.25 | 18.25 | 56 |
| Magnetic nanoparticles/nanocomposites | 23.75 | 12.38 | 57 |
| Silica anchored salicylaldehyde modified polyamidoamine dendrimers | 89.09 | 65.19 | 58 |
| Fe3O4@SiO2@KCC-1 | 30.06 | 21.71 | 59 |
| P(AA-AN)-talc nanocomposite | 43.80 | 37.9 | 60 |
| MNP-PAMAM | 37 | 24.94 | 61 |
| Sulfur-ferromagnetic nanoparticles (SFMNs) | 55.94 | 24.73 | 28 |
| Fe3O4@NR-TMD-G1 | 130.2 | 57 | This work |
6. Reusability
Regenerating the adsorbent after it has been used in the adsorption–desorption cycle is crucial for economic reasons. Regeneration can help reduce the overall purification costs. Due to the low adsorption capacity of the synthesized adsorbent at lower pH levels, it is recommended to use an acidic pH condition for desorption of ions. As a result, the desorption of, Pb(II) and Cd(II) was carried out using 30 mL of 0.1 M HNO3 and HCl.62 As the pH decreases, the amount of desorption increases. The competition between H+ ions and metal ions, for binding to the active sites on the surface of the adsorbent at lower pH levels, increased. Additionally, the adsorbent surface becomes positively charged at low pH levels, which allows for the desorption of cations to take place.63 The effectiveness of adsorption was determined after 5 cycles for Pb(II) and Cd(II), as shown in Fig. 15, indicating promising potential for use in treating wastewater. Additionally, the magnetic power of the adsorbent remained constant throughout all cycles, showing consistency in performance.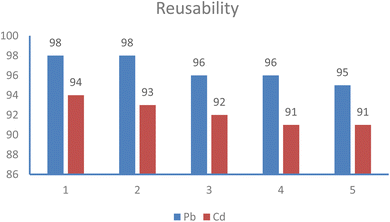 | ||
| Fig. 15 Reusability of Fe3O4@NR-TMD-G1 nanostructure for adsorption of Pb(II) and Cd(II) ions from aqueous solutions. | ||
To further investigation, the XRD and FT-IR spectra of Fe3O4@NR-TMD-G1 both before and after adsorption was compared. As is evident from the XRD pattens in Fig. 16, there are no significant structural changes in XRD pattern of Fe3O4@NR-TMD-G1, before and after adsorption process, which reveals structural stability of the prepared nanostructure. In Fig. 17, the FT-IR spectra of Fe3O4@NR-TMD-G1 before and after metal ions adsorption are shown. The shifts in characteristic stretching and bonding vibrations of Fe3O4@NR-TMD-G1 to lower frequencies after metal adsorption suggest that ions may have interacted with N–H and C![[double bond, length as m-dash]](https://www.rsc.org/images/entities/char_e001.gif) O bonds, causing changes in vibration frequencies.64 Some peaks that were previously observed in the FT-IR spectrum of the adsorbents are weakened. It was observed that Pb(II) had more significant impact compared to Cd(II) on the FT-IR spectrum, suggesting a strong interaction between Pb(II) and the absorbent. Therefore, these spectra also indicate that the chelation between the oxygen and nitrogen atoms in the structure and metal ions is the main phenomenon of the adsorption process.
O bonds, causing changes in vibration frequencies.64 Some peaks that were previously observed in the FT-IR spectrum of the adsorbents are weakened. It was observed that Pb(II) had more significant impact compared to Cd(II) on the FT-IR spectrum, suggesting a strong interaction between Pb(II) and the absorbent. Therefore, these spectra also indicate that the chelation between the oxygen and nitrogen atoms in the structure and metal ions is the main phenomenon of the adsorption process.
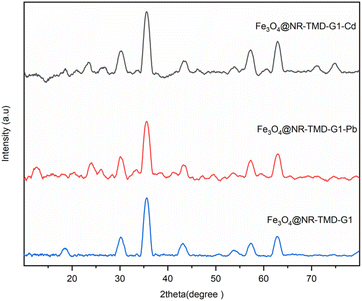 | ||
| Fig. 16 The XRD patterns of Fe3O4@NR-TMD-G1 nanostructure before and after the adsorption of Pb(II) and Cd(II) ions. | ||
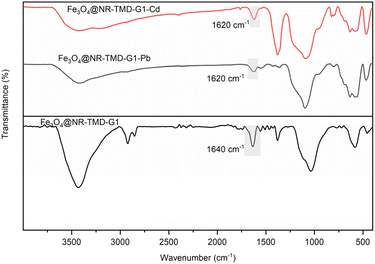 | ||
| Fig. 17 The FT-IR spectra of Fe3O4@NR-TMD-G1 nanostructure before and after the adsorption of Pb(II) and Cd(II) ions. | ||
7. Conclusion
In this study, a novel nano-magnetic core was encapsulated with trimesoyl chloride-based dendrimer for the adsorption of Pb(II) and Cd(II). It was synthesized and characterized fully in two generations. Compared to the second generation, the first generation (Fe3O4@NR-TMD-G1) exhibited superior efficiency in heavy metal ions adsorption. The crucial adsorption properties and effective parameters (contact time, pH, and adsorbent dosage) were also examined for this adsorbent through the batch method. The adsorption efficiency of Cd(II) and Pb(II) ions on Fe3O4@NR-TMD-G1 nanostructure increased as the pH levels increased from 2 to 4.3. The adsorption process was based on the Langmuir and non-linear pseudo-second-order kinetic model, indicating that adsorption was conducted by the monolayer behaviour. The maximum adsorption capacities obtained from the Langmuir model were 57.14 mg g−1 and 130.2 mg g−1 for Cd(II) and Pb(II), respectively. Fe3O4@NR-TMD-G1 exerted high reusability for Cd(II) and Pb(II) ions. The mean free energy calculated through the D–R model implied that adsorption was proceeded by the chemical adsorption mechanism. The optimized structure was obtained from the DFT calculation, which indicated the electron transfer from ligand to metal. However, due to complex formation, the energy gap between HOMO and LUMO decreased, implying that the adsorption managed to stabilize the structure. For its high and fast metal ions adsorption capacity, reusability, easily functionalization and high stability, it could be considered a promising adsorbent for the metal ions removal from large amounts of wastewaters.Data availability
The data supporting this article have been included in the manuscript text.Conflicts of interest
There are no conflicts to declare.References
- M. Vakili, S. Deng, G. Cagnetta, W. Wang, P. Meng, D. Liu and G. Yu, Sep. Purif. Technol., 2019, 224, 373–387 CrossRef CAS.
- A. Kumar, A. Kumar, M. M. S. Cabral-Pinto, A. K. Chaturvedi, A. A. Shabnam, G. Subrahmanyam, R. Mondal, D. K. Gupta, S. K. Malyan and S. S. Kumar, Int. J. Environ. Res. Public Health, 2020, 17, 2179 CrossRef CAS PubMed.
- M. M. Cabral Pinto, P. Marinho-Reis, A. Almeida, E. Pinto, O. Neves, M. Inácio, B. Gerardo, S. Freitas, M. R. Simões and P. A. Dinis, Int. J. Environ. Res. Public Health, 2019, 16, 4560 CrossRef PubMed.
- M. Goala, K. K. Yadav, J. Alam, B. Adelodun, K. S. Choi, M. M. Cabral-Pinto, A. A. Hamid, M. Alhoshan, F. A. A. Ali and A. K. Shukla, J. Water Proc. Eng., 2021, 42, 102152 CrossRef.
- M. S. Islam, R. J. Vogler, S. M. Abdullah Al Hasnine, S. Hernández, N. Malekzadeh, T. P. Hoelen, E. S. Hatakeyama and D. Bhattacharyya, ACS Omega, 2020, 5, 22255–22267 CrossRef CAS PubMed.
- S. Wu, P. Yan, W. Yang, J. Zhou, H. Wang, L. Che and P. Zhu, Chemosphere, 2021, 264, 128557 CrossRef CAS PubMed.
- H. Zhang, J. Zhu, L. Ma, L. Kang, M. Hu, S. Li and Y. Chen, ACS Omega, 2020, 5, 1062–1067 CrossRef CAS PubMed.
- Y. K. Penke, A. K. Yadav, P. Sinha, I. Malik, J. Ramkumar and K. K. Kar, Chem. Eng. J., 2020, 390, 124000 CrossRef CAS.
- Y. K. Penke, G. Anantharaman, J. Ramkumar and K. K. Kar, ACS Appl. Mater. Interfaces, 2017, 9, 11587–11598 CrossRef CAS PubMed.
- Y. K. Penke, A. K. Yadav, I. Malik, A. Tyagi, J. Ramkumar and K. K. Kar, Chemosphere, 2021, 267, 129246 CrossRef CAS PubMed.
- Y. K. Penke, G. Anantharaman, J. Ramkumar and K. K. Kar, J. Hazard Mater., 2019, 364, 519–530 CrossRef CAS PubMed.
- H. Zeng, H. Zeng, H. Zhang, A. Shahab, K. Zhang, Y. Lu, I. Nabi, F. Naseem and H. Ullah, J. Clean. Prod., 2021, 286, 124964 CrossRef CAS.
- S. Begum, N. Y. Yuhana, N. M. Saleh, N. H. N. Kamarudin and A. B. Sulong, Carbohydrate Polym., 2021, 259, 117613 CrossRef CAS PubMed.
- I. Medha, S. Chandra, K. R. Vanapalli, B. Samal, J. Bhattacharya and B. K. Das, Sci. Total Environ., 2021, 771, 144764 CrossRef CAS PubMed.
- G. K. R. Angaru, Y.-L. Choi, L. P. Lingamdinne, J.-S. Choi, D.-S. Kim, J. R. Koduru, J.-K. Yang and Y.-Y. Chang, Chemosphere, 2021, 267, 128889 CrossRef CAS PubMed.
- H. Masoumi, A. Ghaemi and H. G. Gilani, Sep. Purif. Technol., 2021, 260, 118221 CrossRef CAS.
- J. Zhang, T. Li, X. Li, Y. Liu, N. Li, Y. Wang and X. Li, J. Hazard. Mater., 2021, 412, 125187 CrossRef CAS PubMed.
- W. Ahlawat, N. Kataria, N. Dilbaghi, A. A. Hassan, S. Kumar and K.-H. Kim, Environ. Res., 2020, 181, 108904 CrossRef CAS PubMed.
- M. Z. A. Zaimee, M. S. Sarjadi and M. L. Rahman, Water, 2021, 13, 2659 CrossRef CAS.
- B. Tokay and I. Akpınar, Bioresour. Technol. Rep., 2021, 15, 100719 CrossRef CAS.
- U. Kamran, H. Jamal, M. I. H. Siddiqui and S.-J. Park, Water, 2023, 15, 3368 CrossRef CAS.
- M. Saeed, U. Kamran, A. Khan, M. I. H. Siddiqui, H. Jamal and H. N. Bhatti, New J. Chem., 2024, 48, 844–858 RSC.
- H. N. Bhatti, A. Khan and U. Kamran, Mater. Chem. Phys., 2024, 326, 129812 CrossRef.
- Y. Pan, X. Yuan, L. Jiang, H. Wang, H. Yu and J. Zhang, Chem. Eng. J., 2020, 384, 123310 CrossRef CAS.
- S. Ekinci, Z. İlter, S. Ercan, E. Çınar and R. Çakmak, Heliyon, 2021, 7, e06600 CrossRef CAS PubMed.
- L. Luan, B. Tang, Y. Liu, A. Wang, B. Zhang, W. Xu and Y. Niu, Sep. Purif. Technol., 2021, 257, 117902 CrossRef CAS.
- S. Liu, B. Yu, S. Wang, Y. Shen and H. Cong, Adv. Colloid Interface Sci., 2020, 281, 102165 CrossRef CAS PubMed.
- H. Song, A. Kumar and Y. Zhang, Chemosphere, 2022, 287, 132156 CrossRef CAS PubMed.
- M. Sajid, M. K. Nazal, N. Baig and A. M. Osman, Sep. Purif. Technol., 2018, 191, 400–423 CrossRef CAS.
- R. Ahangarani-Farahani and M. A. Bodaghifard, J. Mater. Sci.: Mater. Electron., 2022, 33, 25674–25686 CrossRef CAS.
- W. Stöber, A. Fink and E. Bohn, Adv. Colloid Interface Sci., 1968, 26, 62–69 CrossRef.
- O. A. Oyetade, A. A. Skelton, V. O. Nyamori, S. B. Jonnalagadda and B. S. Martincigh, Sep. Purif. Technol., 2017, 188, 174–187 CrossRef CAS.
- B. Wang, J. Xuan, X. Yang and Z. Bai, Colloids Surf., A, 2021, 626, 127030 CrossRef CAS.
- A. Y. Mehandzhiyski, E. Riccardi, T. S. Van Erp, H. Koch, P.-O. Åstrand, T. T. Trinh and B. A. Grimes, J. Phys. Chem. A, 2015, 119, 10195–10203 CrossRef CAS PubMed.
- Y. Zhang, K. Yuan, L. Magagnin, X. Wu, Z. Jiang and W. Wang, Chem. Eng. J., 2023, 462, 142019 CrossRef CAS.
- K. Chen, Q. Feng, Y. Feng, D. Ma, D. Wang, Z. Liu, W. Zhu, X. Li, F. Qin and J. Feng, Chem. Eng. J., 2022, 435, 135171 CrossRef CAS.
- R. Foroutan, S. J. Peighambardoust, R. Mohammadi, S. H. Peighambardoust and B. Ramavandi, Environ. Res., 2022, 211, 113020 CrossRef CAS PubMed.
- J. Hukkamäki and T. T. Pakkanen, Microporous Mesoporous Mater., 2003, 65, 189–196 CrossRef.
- S. Brunauer, P. H. Emmett and E. Teller, J. Am. Chem. Soc., 1938, 60, 309–319 CrossRef CAS.
- M. A. Al-Ghouti, J. Li, Y. Salamh, N. Al-Laqtah, G. Walker and M. N. Ahmad, J. Hazard Mater., 2010, 176, 510–520 CrossRef CAS PubMed.
- M. Yuan, D. Liu, S. Shang, Z. Song, Q. You, L. Huang and S. Cui, Int. J. Biol. Macromol., 2023, 253, 126634 CrossRef CAS PubMed.
- K. Padmavathy, G. Madhu and P. Haseena, Proc. Technol., 2016, 24, 585–594 CrossRef.
- R. Shahrokhi-Shahraki, C. Benally, M. G. El-Din and J. Park, Chemosphere, 2021, 264, 128455 CrossRef CAS PubMed.
- A. Çelekli, S. S. Birecikligil, F. Geyik and H. Bozkurt, Bioresour. Technol., 2012, 103, 64–70 CrossRef PubMed.
- Q. Liu, Y. Li, H. Chen, J. Lu, G. Yu, M. Möslang and Y. Zhou, J. Hazard. Mater., 2020, 382, 121040 CrossRef CAS PubMed.
- U. Kamran and S.-J. Park, Desalination, 2022, 522, 115387 CrossRef CAS.
- Y.-S. Ho and G. McKay, Process Biochem., 1999, 34, 451–465 CrossRef CAS.
- I. Langmuir, J. Am. Chem. Soc., 1918, 40, 1361–1403 CrossRef CAS.
- H. Freundlich, Z. Phys. Chem., 1907, 57, 385–470 CrossRef CAS.
- O. Redlich and D. L. Peterson, J. Phys. Chem., 1959, 63, 1024 CrossRef CAS.
- X. Song, Y. Niu, P. Zhang, C. Zhang, Z. Zhang, Y. Zhu and R. Qu, Fuel, 2017, 199, 91–101 CrossRef CAS.
- J. Zhao, Y. Niu, B. Ren, H. Chen, S. Zhang, J. Jin and Y. Zhang, Chem. Eng. J., 2018, 347, 574–584 CrossRef CAS.
- F. Lu, C. Xu, F. Meng, T. Xia, R. Wang and J. Wang, Adv. Mater. Interfaces, 2017, 4, 1700639 CrossRef.
- M. Alizadeh, S. J. Peighambardoust, R. Foroutan, H. Azimi and B. Ramavandi, Environ. Res., 2022, 212, 113242 CrossRef CAS PubMed.
- X. Guo, B. Du, Q. Wei, J. Yang, L. Hu, L. Yan and W. Xu, J. Hazard Mater., 2014, 278, 211–220 CrossRef CAS PubMed.
- A. Heidari, H. Younesi and Z. Mehraban, Chem. Eng. J., 2009, 153, 70–79 CrossRef CAS.
- M. Şahin, M. Atasoy, Y. Arslan and D. Yildiz, ACS Omega, 2023, 8, 34834–34843 CrossRef PubMed.
- K. Wu, Y. Wu, B. Wang, Y. Liu, W. Xu, A. Wang and Y. Niu, J. Taiwan Inst. Chem. Eng., 2022, 139, 104525 CrossRef CAS.
- F. Salari Goharrizi, S. Y. Ebrahimipour, H. Ebrahimnejad and S. J. Fatemi, J. Inorg. Organomet. Polym. Mater., 2024, 1–17 Search PubMed.
- M. R. Abass, W. M. El-Kenany and E. H. El-Masry, Environ. Sci. Pollut. Res., 2022, 29, 72929–72945 CrossRef CAS PubMed.
- V. Kothavale, A. Sharma, R. Dhavale, V. Chavan, S. Shingte, O. Selyshchev, T. Dongale, H. Park, D. Zahn and G. Salvan, Mater. Chem. Phys., 2022, 292, 126792 CrossRef CAS.
- E.-J. Kim, C.-S. Lee, Y.-Y. Chang and Y.-S. Chang, ACS Appl. Mater. Interfaces, 2013, 5, 9628–9634 CrossRef CAS PubMed.
- S. Debnath, D. Nandi and U. C. Ghosh, J. Chem. Eng. Data, 2011, 56, 3021–3028 CrossRef CAS.
- M. Tuzen, A. Sarı, M. R. A. Mogaddam, S. Kaya, K. Katin and N. Altunay, Mater. Chem. Phys., 2022, 277, 125501 CrossRef CAS.
| This journal is © The Royal Society of Chemistry 2024 |

