 Open Access Article
Investigation of variable range hopping and dielectric relaxation in GdCrO3 orthochromite perovskites
Mohamed Youssef Gnebera,
Imen Elhamdi a,
Jalel Messoudia,
Radhia Dhahri
 a,
Foudil Sahnouneb,
Mosbah Jemmalicd,
Magdy Husseine,
Essebti Dhahri
 a and
Benilde Faria Oliveira Costa
 f
f
aLaboratoire de Physique Appliquée, Faculté des Sciences, Université de Sfax, B.P. 1171, 3000 Sfax, Tunisia. E-mail: imen85356@gmail.com
bPhysics and Chemistry of Materials Lab, Faculty of Science, University Mohamed Boudiaf of M'sila, 28000, Algeria
cDepartment of Chemistry, College of Science, Qassim University, Saudi Arabia
dFaculty of Sciences, University of Sfax, LSME, Sfax 3018, Tunisia
eDepartment of Physics, Faculty of Science, Zagazig University Egypt, Egypt
fUniversity of Coimbra, CFisUC, Physics Department, Rua Larga, 3004-516 Coimbra, Portugal
First published on 12th November 2024
Abstract
This study investigates the structural, electrical, and dielectric properties of GdCrO3 (GCO) compounds. X-ray diffraction analysis confirmed the formation of the perovskite phase of GCO, crystallizing with the Pbnm space group. Scanning electron microscopy (SEM) was employed to examine the morphology and chemical composition of the powder, ensuring compound homogeneity, while transmission electron microscopy (TEM) provided insights into the internal structure and finer morphology of the GCO sample. Electrical measurements revealed that GCO exhibits semiconductor behavior, with a notable increase in conductivity as temperature rises, attributed to enhanced charge carrier mobility and hopping conduction mechanisms. Dielectric analysis demonstrated significant frequency-dependent behavior, characterized by various polarization effects and relaxation phenomena. GCO is a promising material for energy storage due to its giant permittivity and low energy loss. The activation energies derived from the electrical and dielectric measurements indicate higher resistance within the grains compared to the grain boundaries, suggesting complex conduction processes. Additionally, the dielectric loss spectra revealed substantial losses, likely due to defect states such as oxygen vacancies and mixed valence states, indicating a highly disordered material. These comprehensive insights into the structural and functional properties of GCO highlight its potential applications in electronic and electrical devices where controlled conductivity and dielectric properties are crucial.
1 Introduction
In recent years, perovskite oxides have been widely studied due to their increasing importance in both research and technology.1–4 Among these, rare-earth chromites (ACrO3, where A represents elements such as La, Gd, and Nd) have attracted considerable interest. This is due to their diverse physical properties, including multiferroicity,5 photocatalysis,6 magnetization reversal7 exchange bias,8 and the coupling of electric and magnetic dipoles at low temperatures.9 Therefore, rare-earth perovskite chromites have found extensive use in various technological applications. These include catalysts,10 volatile memories,11 oxygen ion conductors,12 solid oxide fuel cells,13 sensors,14 magnetic refrigerators,15 and interconnectors in multiferroic devices.16 Their effectiveness is particularly influenced by the R-site-dependent canted ferroelectric and antiferromagnetic properties. GdCrO3 (GCO), a rare-earth perovskite chromite, has been extensively studied due to its exceptional optical, dielectric, electrical, magnetic and magnetocaloric properties. These characteristics have positioned GCO as a versatile candidate in various applications including photocatalytic reduction,17 photocatalytic hydrogen evolution,18 magnetic refrigeration19 supercapacitors,20 and spintronics.21 The magnetic properties of GCO stem from interactions involving Cr3+–Cr3+, Gd3+–Gd3+, and Cr3+–Gd3+ pairs, which exhibit temperature-dependent behavior.22GCO exhibits a distorted perovskite structure at room temperature with space group Pbnm.23 In its orthorhombic crystal lattice, gadolinium ions occupy the corners of the unit cell, while chromium ions are situated at the central positions. In the orthorhombic phase of rare-earth chromite's, there is notable magnetic and electric dipolar coupling at low temperatures, which is critical for advancing magnetic and ferroelectric device technologies.24 Interestingly, below a certain temperature, nearly all ACrO3 compounds are expected to exhibit the magnetoelectric effect due to their lack of inversion symmetry. This effect results in a net magnetization induced by an applied electric field and, conversely, an electric polarization induced by an external magnetic field.25 The potential for ferroelectric ordering in polycrystalline rare-earth orthochromites with perovskite or distorted perovskite structures was first explored by Subba et al.26 From resistivity-temperature and polarization measurements, indications of ferroelectric ordering have arisen in DyCrO3, YbCrO3, HoCrO3, and LuCrO3.27 This behavior is attributed to distortions in the oxygen polyhedra surrounding Cr3+ ions. Additionally, these materials exhibit p-type extrinsic semiconducting behavior due to the presence of impurities such as Cr4+ or Cr6+ in their lattice.28 Notably, bulk GCO exhibits multiple ferroelectric ordering transitions, with the first observed at 360 K and another at 425 K, above which the spontaneous polarization diminishes.29 However, detailed dielectric properties below room temperature in the bulk regime remain unreported. Orthochromites are recognized for their high conductivity, robust chemical stability, and dense structure.30 Recent studies have extensively explored the electrical, dielectric, and optical properties of several orthochromite compounds, such as PrCrO3,31,32 SmCrO3,33 GdCrO3,34 and RFexCr1−xO3.35 These investigations have highlighted the emergence of notably high, sometimes colossal, permittivity, often attributed to effects related to grain boundaries.36
Below, we present a detailed investigation of the structural, electrical, and dielectric properties of GCO nanoparticle prepared by the sol–gel method.
2 Detailed experimentation
2.1 Sample preparation
Gadolinium and chromium nitrates (from Aldrich) were used to prepare GdCrO3 (GCO) nanoparticles by the sol–gel method.37–39 Sufficient amounts of each nitrate with the desired stoichiometric proportions were mixed and dissolved in distilled water. Citrate acid (C6H8O7) was subsequently introduced as a chelating agent into the mixture with the molar ratio (metal ions): (citric acid) = 1![[thin space (1/6-em)]](https://www.rsc.org/images/entities/char_2009.gif) :
:![[thin space (1/6-em)]](https://www.rsc.org/images/entities/char_2009.gif) 2. The solution was brought to 80 °C with magnetic stirring until the water evaporated. The gel formed at 180 °C is heated to 350 °C to obtain a dark powder. In order to eliminate all organic entities, the powder obtained was heated to 700 °C for 12 hours. Subsequently the product was finely ground, compressed into pellets of approximately 8 mm in diameter and 1 mm in thickness and heated at 800 °C for 4 hours to obtain the desired material.
2. The solution was brought to 80 °C with magnetic stirring until the water evaporated. The gel formed at 180 °C is heated to 350 °C to obtain a dark powder. In order to eliminate all organic entities, the powder obtained was heated to 700 °C for 12 hours. Subsequently the product was finely ground, compressed into pellets of approximately 8 mm in diameter and 1 mm in thickness and heated at 800 °C for 4 hours to obtain the desired material.
2.2 Characterization
X-ray diffraction (XRD) was performed using a PANalytical diffractometer with Cu Kα1 radiation (λ = 1.5406 Å) over a 2θ range of 20° to 80°. The resulting XRD patterns were analyzed to determine the lattice parameters of the samples using the FullProf program and the Rietveld refinement method.40 The morphology and chemical composition of the powder were examined using a TESCAN VEGA3 SBH scanning electron microscope (SEM) to evaluate the homogeneity of the GdCrO3 compound. The TEM images were acquired using a high-resolution transmission electron microscope (HR-TEM) FEI Tecnai G2, operating at an accelerating voltage of 200 kV. Electrical measurements were conducted on a pellet with dimensions of 1 mm in thickness and 8 mm in diameter. Complex impedance measurements were carried out using a ‘Solartron 1260’ impedance analyzer over a frequency range of 10 Hz to 106 Hz at temperatures ranging from 153 K to 373 K with a configuration involving capacitance in parallel with resistance (Cp–Rp configuration).41–433 Results and discussions
3.1 XRD structural analysis
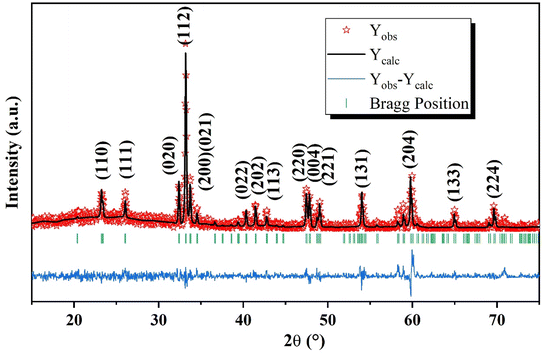
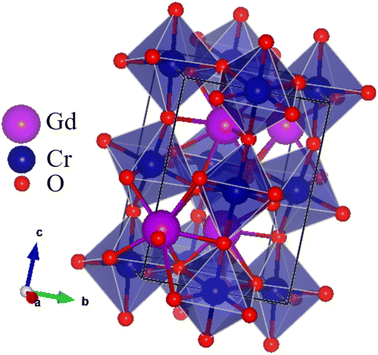
Fig. 1 shows the X-ray diffraction patterns of the GCO sample measured at room temperature. The patterns indicate a distorted perovskite structure with the Pbnm space group (JCPDS COD. 34-0406).44 The sharp peaks in the XRD patterns suggest that the samples are well-crystallized.45 No impurity peaks were detected, confirming the high purity of the prepared samples.46 The lattice parameters of the GCO sample, determined through Rietveld refinement, are listed in Table 1. The reliability of the refinement model was assessed using discrepancy R-factors and goodness of fit, which demonstrated results within acceptable limits. The orthorhombic unit cell of the GCO perovskite material was created using Vesta software,47–49 as shown in the inset of Fig. 2. This figure clearly illustrates the CrO6 octahedra50–52 and GdO8 dodecahedra that make up the orthorhombic perovskite structure of the GCO compound.| GCO | |
|---|---|
| Space group | Pbnm |
| a (Å) | 5.3141 |
| b (Å) | 5.5264 |
| c (Å) | 7.6035 |
| v (Å3) | 223.2928 |
| χ2 | 1.034 |
3.2 Morphology analysis
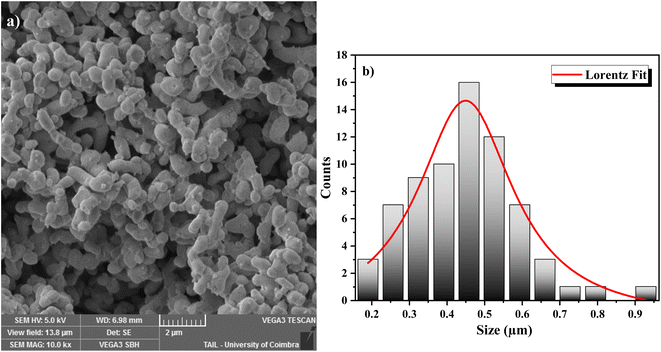
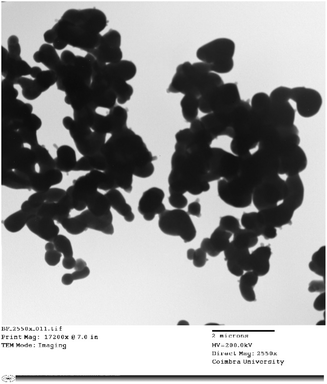
The surface morphology of the GdCrO3 (GCO) sample was analyzed using SEM, revealing a granular structure with interconnected particles, characteristic of polycrystalline perovskite materials (Fig. 3a). The particle size distribution was quantified using ImageJ software to process the SEM images, and the data were fitted to a Lorentzian distribution, as shown in the histogram (Fig. 3b), yielding an average particle size of 449 nm. This analysis indicates a relatively uniform particle size distribution, which is crucial for achieving consistent dielectric and electrical properties. Additionally, the observed morphology suggests the presence of a porous structure, which could influence the material's overall performance in electronic applications by affecting properties such as charge transport and dielectric behavior.The internal structure and finer morphology of the GdCrO3 (GCO) sample were investigated using TEM as shown in Fig. 4. The images reveal individual nanoparticles that appear larger than those observed in SEM, likely due to agglomeration effects. The nanoparticles exhibit irregular shapes, with some overlap, typical of materials synthesized by the Sol–gel method. While individual boundaries are discernible, the observed clustering suggests that inter-particle interactions during synthesis lead to aggregation. The TEM analysis indicates a relatively uniform internal composition and few crystalline defects, consistent with the expected perovskite structure. This agglomeration and nanoscale size may significantly influence the material's dielectric and electrical properties.
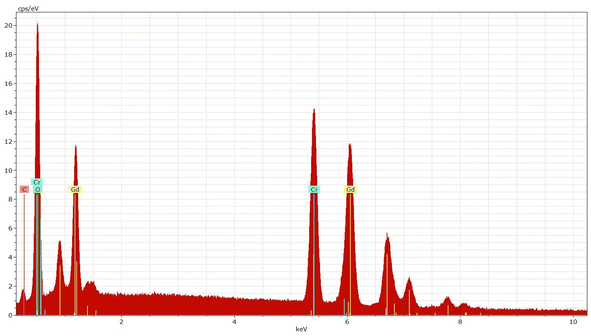
The EDX analysis of the GdCrO3 (GCO) sample reveals the elemental composition of the material, confirming the presence of gadolinium (Gd), oxygen (O), and chromium (Cr) (Fig. 5). Table 2 summarizes the atomic and weight percentages of the elements present in the GdCrO3 (GCO) sample, as determined by EDX analysis. The atomic percentages are 20.19% for Gd, 61.58% for O, and 18.23% for Cr, indicating a stoichiometric ratio that aligns well with the expected perovskite structure. In terms of weight percentages, gadolinium contributes 58.69%, while chromium and oxygen contribute 21.56% and 19.75%, respectively.
| Elements | Series | Atomic (%) | Weight (%) |
|---|---|---|---|
| Gadolinium | L-series | 20.19 | 58.69 |
| Oxygen | K-series | 61.58 | 19.75 |
| Chromium | K-series | 18.23 | 21.56 |
| Total | 100.00 | 100.00 |
3.3 Electrical conductivity analysis
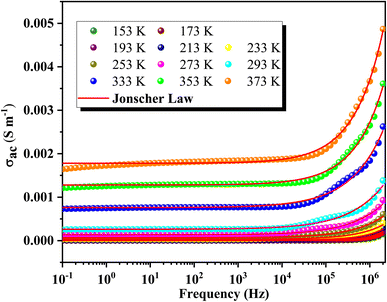
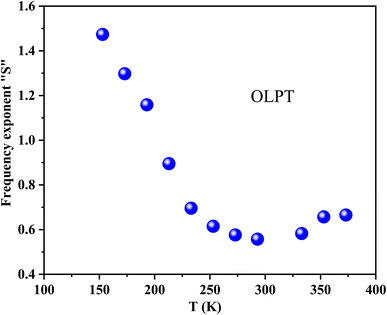
Fig. 6 illustrates the frequency-dependent conductivity of GCO chromite at various temperatures from 153 K to 373 K. The analysis identifies two main regimes: at low frequencies, the conductivity remains constant, forming a plateau known as continuous conductivity. As the frequency increases, the conductivity shifts from this static regime to a dispersive regime, referred to as AC conductivity. This behavior follows Jonscher's classical law, which is expressed by the formula:53| σac = σdc + Aωs | (1) |
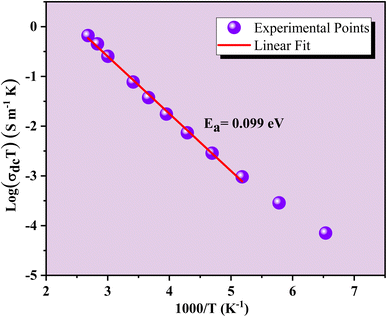
Fig. 8 shows the variations of log(σdc![[thin space (1/6-em)]](https://www.rsc.org/images/entities/char_2009.gif) T) as a function of the inverse temperature for the GCO compound in the semiconductor region. The high-temperature dc conductivity data suggest that the conductivity is dominated by the small polaron hopping (SPH) mechanism. This is described by the Arrhenius equation:59
T) as a function of the inverse temperature for the GCO compound in the semiconductor region. The high-temperature dc conductivity data suggest that the conductivity is dominated by the small polaron hopping (SPH) mechanism. This is described by the Arrhenius equation:59
| σdcT = σ0exp(−Ea/KBT) | (2) |
The evolution of log(σac![[thin space (1/6-em)]](https://www.rsc.org/images/entities/char_2009.gif) T) as a function of the inverse temperature is depicted in Fig. 9. These curves were utilized to validate the Arrhenius conduction mechanism in polarons' transport and determine activation energies (Ea) across various temperatures and frequencies. The slopes of these curves vary with both frequency and temperature, demonstrating the nuanced behavior of conductivity under different conditions. The fit of log(σacT) vs. 1000/T reveals a decrease in the Arrhenius activation energy in the low-temperature regime. Table 3 summarizes the trend of decreasing activation energy (Ea) with increasing frequency. Additionally, the observed increase in dc conductivity with temperature indicates enhanced charge carrier mobility at higher temperatures. The combined effect of a decrease in Ea and a simultaneous increase in ac conductivity (σac) with frequency suggests that hopping conduction is the dominant mechanism governing the electrical behavior of the material.60
T) as a function of the inverse temperature is depicted in Fig. 9. These curves were utilized to validate the Arrhenius conduction mechanism in polarons' transport and determine activation energies (Ea) across various temperatures and frequencies. The slopes of these curves vary with both frequency and temperature, demonstrating the nuanced behavior of conductivity under different conditions. The fit of log(σacT) vs. 1000/T reveals a decrease in the Arrhenius activation energy in the low-temperature regime. Table 3 summarizes the trend of decreasing activation energy (Ea) with increasing frequency. Additionally, the observed increase in dc conductivity with temperature indicates enhanced charge carrier mobility at higher temperatures. The combined effect of a decrease in Ea and a simultaneous increase in ac conductivity (σac) with frequency suggests that hopping conduction is the dominant mechanism governing the electrical behavior of the material.60
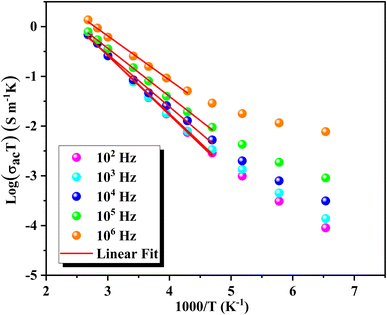 | ||
| Fig. 9 Temperature dependence of log(σacT) and Arrhenius activation energy for GCO compound across frequencies. | ||
| Frequency (Hz) | 102 | 103 | 104 | 105 | 106 |
|---|---|---|---|---|---|
| Ea (eV) | 0.1 | 0.099 | 0.091 | 0.084 | 0.076 |
3.4 Impedance analysis
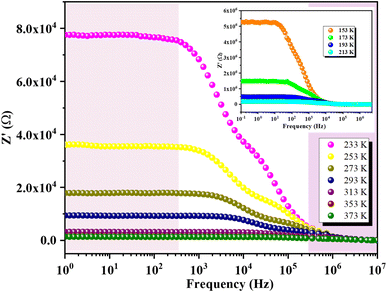
Fig. 10 illustrates the variation of the real part of impedance (Z′) with frequency at different temperatures. The plot reveals two distinct behaviors depending on frequency. Initially, Z′ exhibits a plateau regardless of frequency, indicating a stable impedance at low frequencies. However, as frequency increases, Z′ shows a significant decrease with rising temperature at specific frequencies. This observation correlates well with the continuous variation of conductivity observed at low frequencies, confirming the semiconductor characteristics of our compounds.61 In the intermediate frequency range, higher frequencies lead to a reduction in the accumulation of charges at grain boundaries, thereby causing a decrease in Z′. At higher frequencies, the Z′ spectra converge independently of frequency and temperature, indicating the dissipation of space charges due to reduced potential barriers.62 This plateau in behavior can be explained by the fact that within this frequency range, the mobile charges reach their relaxation frequencies and can no longer respond to the external electrical excitation.Fig. 11 shows the variation of the imaginary part of impedance Z′′ with frequency at different temperatures. Each temperature curve exhibits two distinct relaxation peaks at specific frequencies. The peak at the lower frequency side corresponds to the hopping of charge carriers between sites at the grain boundaries. In contrast, the peak at the higher frequency side is associated with the short-range hopping of carriers between localized sites within the grains. Additionally, as the temperature increases, these two peaks shift towards higher frequencies, indicating that the relaxation process is thermally activated (i.e., the dipoles are activated). Furthermore, the increase in temperature is accompanied by a decrease in the peak maxima, which can be attributed to the reduction in the electrical resistance of the compounds.
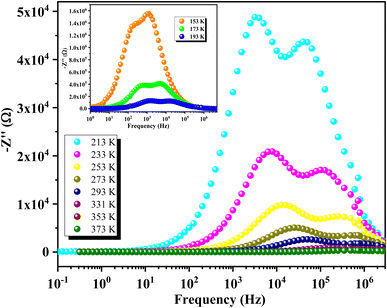 | ||
| Fig. 11 Frequency-dependent imaginary impedance Z′′ showing double relaxation peaks in GCO compound. | ||
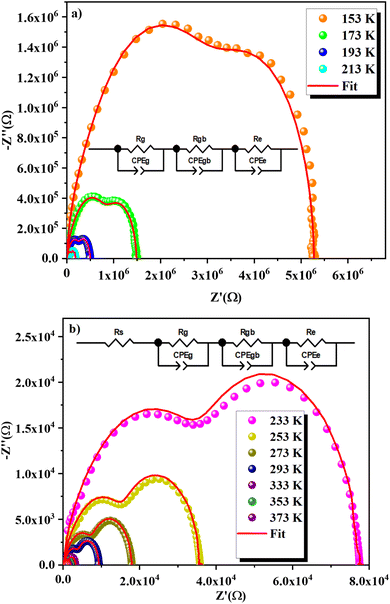
Fig. 12a and b presents Nyquist plots for the GCO compound across a range of temperatures (153–373 K). The Cole–Cole plots display two distinct semicircles, whose diameters decrease with increasing temperature. These diameters are indicative of the compound's resistance. As the temperature rises, the shrinking semicircle diameters suggest that the conduction process is thermally activated, thus confirming the semiconductor nature of the sample.63 The presence of two semicircular arcs indicates the existence of two distinct relaxation phenomena. The Cole–Cole plots were analyzed using Z-view software,64 employing various equivalent circuit models as shown in Fig. 12a and b. For the temperature range of 153 K to 213 K (Fig. 12a), the optimal fit was obtained with an equivalent circuit that includes a series combination of three elements: the electrode (Re//CPEe), the grain boundaries (Rgb//CPEgb), and the grain (Rg//Cg). In the higher temperature range of 233 K to 377 K, depicted in Fig. 12b, the equivalent circuit configuration is represented as [Rs + (Rg//CPEg) + (Rgb//CPEgb) + (Re//CPEe)], where R represents resistance and CPE stands for constant phase element. However, some curves do not reach zero in the low-frequency range for temperatures above 213 K. This phenomenon may be due to interface effects at low frequencies or could be attributed to the addition of resistance Rs, which prevents the curves from reaching zero in this range.
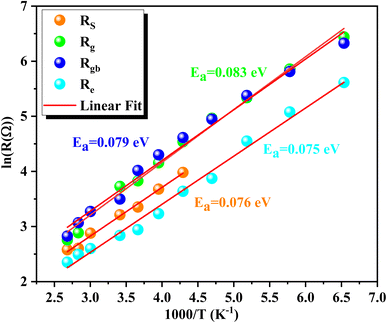
The activation energy can be determined using the Arrhenius equation:
| Rs,g,gb,e(Ω) = R0e−Ea/KBT | (3) |
| Parameter | Rs (Ω) | Rg (Ω) | Rgb (Ω) | Re (Ω) |
|---|---|---|---|---|
| Ea (eV) | 0.076 | 0.083 | 0.079 | 0.075 |
3.5 Modulus analysis
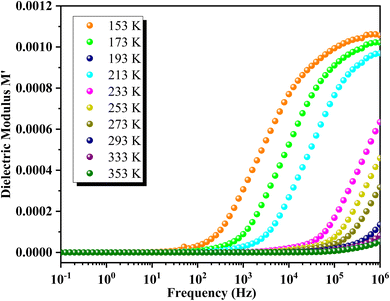
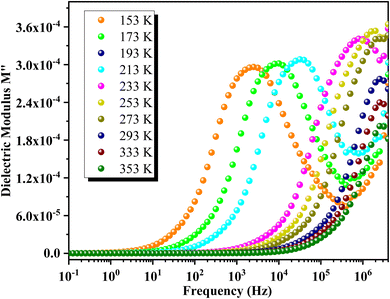
The variation of the real part of the modulus M′ as a function of frequency at different temperatures is depicted in Fig. 14. At lower temperatures, M′ shows a continuous increase with frequency. In contrast, at higher temperatures, M′ initially exhibits a static behavior at low frequencies, followed by an increase to an intermediate frequency where it stabilizes at a frequency-independent value. Each M′ spectrum of GCO perovskite demonstrates an increasing trend with frequency, reaching a saturation value M∞ that reflects short-range mobility of charge carriers in the material's electrical transport mechanism. Additionally, M′ values decrease uniformly with rising temperature across all frequencies, indicating the presence of temperature-dependent relaxation phenomena in GCO material's electrical conduction.Fig. 15 illustrates the frequency dependence of M′′ at various temperatures for GCO. Each curve exhibits a distinct asymmetric relaxation peak located at intermediate frequencies, indicative of grain-related effects. As temperature increases, the peak maximum shifts towards higher frequencies, suggesting a decrease in relaxation time.
3.6 Permittivity analysis
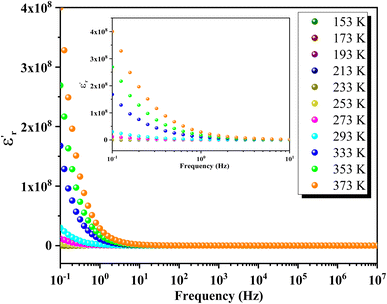
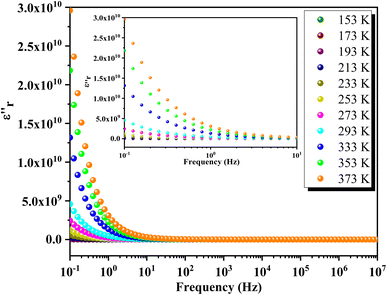
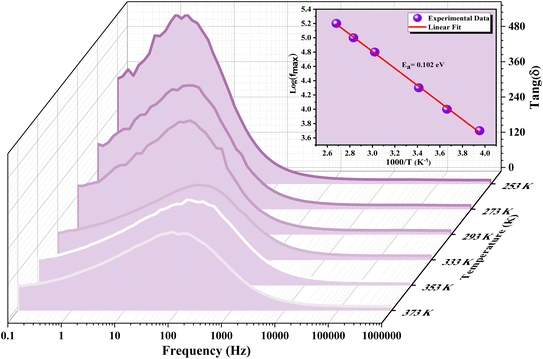
Fig. 16 depicts the frequency-dependent behavior of the real part of permittivity at various temperatures. At lower frequencies, the permittivity shows higher values, influenced by grain size effects and various polarization mechanisms such as dipolar, ionic, electronic and interfacial polarizations.65 As the frequency increases, the permittivity gradually decreases and eventually stabilizes at a lower constant value at higher frequencies, indicating the presence of space charges. At lower temperatures, ε′ decreases uniformly with frequency, while at higher temperatures, ε′ stabilizes at low frequencies before rapidly decreasing beyond a certain threshold. This behavior indicates an increase in the density of mobile charges and/or the difficulty electric dipoles encounter in responding to the applied electric excitation.In Fig. 17, the frequency dependence of the imaginary part of the permittivity at different temperatures is illustrated. As the frequency increases, ε′′ exhibits a rapid decrease until it reaches a minimum value at frequencies around 10 Hz. Beyond this point, ε′′ shows insensitivity to further increases in frequency and temperature. This behavior is attributed to Koop's theory and the Maxwell–Wagner phenomenological model, which explain that the dielectric structure of these compounds is characterized by grains with high conductivity that are particularly effective at higher frequencies. Fig. 18 illustrates the frequency-dependent variation of dielectric loss (tan(δ)) in GCO chromite across different temperatures. At lower frequencies, tan(δ) exhibits higher values, which can be attributed to interfacial effects, before decreasing to a minimum within each temperature spectrum. The dielectric loss spectra demonstrate significant temperature-dependent variations, with substantial losses observed at different temperature ranges. These losses are likely due to defect states, such as oxygen vacancies and mixed valence states, contributing to the highly disordered nature of the material. The multiple peaks and shifts in the spectra across various temperatures highlight the complexity of the material's dielectric response. These insights into the structural and functional properties of GCO chromite underscore its potential for applications in electronic and electrical devices, where controlled conductivity and dielectric properties are essential.
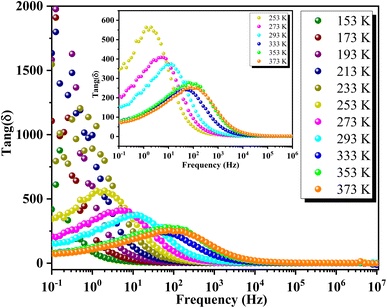 | ||
Fig. 18 Frequency-dependent dielectric loss (tan![[thin space (1/6-em)]](https://www.rsc.org/images/entities/char_2009.gif) g(δ)) of GCO chromite across different temperatures. g(δ)) of GCO chromite across different temperatures. | ||
However, tan![[thin space (1/6-em)]](https://www.rsc.org/images/entities/char_2009.gif) g(δ) exhibits an upward trend in the intermediate frequency range, peaking at the relaxation frequency (fmax), before declining with further frequency increments. The presence of these peaks at fmax across temperatures from 253 K to 373 K suggests the occurrence of thermally activated hopping phenomena within the GCO perovskite structure. However, the loss peak shifts to higher frequencies as temperatures rise, indicating a decrease in relaxation time. The temperature dependency of fmax follows an Arrhenius-like relationship expressed as:
g(δ) exhibits an upward trend in the intermediate frequency range, peaking at the relaxation frequency (fmax), before declining with further frequency increments. The presence of these peaks at fmax across temperatures from 253 K to 373 K suggests the occurrence of thermally activated hopping phenomena within the GCO perovskite structure. However, the loss peak shifts to higher frequencies as temperatures rise, indicating a decrease in relaxation time. The temperature dependency of fmax follows an Arrhenius-like relationship expressed as:
| fmax = f0e−Ea/KBT | (4) |
![[thin space (1/6-em)]](https://www.rsc.org/images/entities/char_2009.gif) g(δ)) of GCO chromite at various temperatures. Inset: plot of ln(fmax) versus the inverse of temperature, with the red line representing the fitted peak frequency Arrhenius equation. The activation energy estimated from the dielectric loss spectra is 102 meV. The significant dielectric loss observed in GCO perovskite indicates its highly disordered nature, likely influenced by defect states such as oxygen vacancies and mixed valence.
g(δ)) of GCO chromite at various temperatures. Inset: plot of ln(fmax) versus the inverse of temperature, with the red line representing the fitted peak frequency Arrhenius equation. The activation energy estimated from the dielectric loss spectra is 102 meV. The significant dielectric loss observed in GCO perovskite indicates its highly disordered nature, likely influenced by defect states such as oxygen vacancies and mixed valence.
4 Conclusion
In conclusion, the study of GCO compounds, particularly their electrical and dielectric properties, has revealed several key insights. The perovskite phase of GCO, confirmed through X-ray diffraction analysis, crystallizes with the Pbnm space group, underscoring its structural integrity and potential for diverse applications. Scanning electron microscopy (SEM) and energy-dispersive X-ray spectroscopy (EDX) analyses demonstrated the morphology and chemical composition of GCO, confirming its homogeneity and validating the synthesis process. Additionally, transmission electron microscopy (TEM) provided insights into the finer internal structure of the material. Electrical characterization has shown that GCO exhibits semiconductor behavior, with temperature-dependent conductivity suggesting thermally activated processes dominated by hopping conduction mechanisms. GCO is a material with giant permittivity (108) and low energy losses for temperatures above 253 K, making it an excellent candidate for energy storage. The activation energies extracted from various analyses provide crucial insights into charge carrier mobility and relaxation dynamics within GCO. Overall, these findings underscore GCO's potential for applications in electronic and electrical devices where controlled conductivity and dielectric properties are essential.Data availability
Data are available upon request to the authors.Conflicts of interest
The authors declare that they have no known competing financial interests or personal relationships that could have appeared to influence the work reported in this paper.References
- H. Zhang, Y. Bian, Y. Xia, Y. Cui, Z. Li, F. Zhang, Y. Bai, N. Chen and J. Chen, Correlated perovskite nickelates with valence variable rare-earth compositions, J. Rare Earths, 2024, 42(4), 743–748 CrossRef CAS.
- R. Roy and A. Dutta, Structural, optical, electrical, and dielectric relaxation properties of rare earth containing sodium bismuth titanate Na0.5Bi0.5TiO3 perovskite: Effect of ionic radius, J. Rare Earths, 2024, 42(2), 383–391 CrossRef CAS.
- S. Supriya, Recent trends and morphology mechanisms of rare-earth based BiFeO3 nano perovskites with excellent photocatalytic performances, J. Rare Earths, 2023, 41(3), 331–341 CrossRef CAS.
- M. Javed, A. A. Khan, J. Kazmi, N. Akbar, S. N. Khisro, A. Dar, A. D. K. Tareen and M. A. Mohamed, Variable range hopping transport and dielectric relaxation mechanism in GdCrO3 rare-earth orthochromite perovskite, J. Rare Earths, 2024, 42(7), 1304–1316 CrossRef CAS.
- J. R. Sahu, C. R. Serrao, N. Ray, U. V. Waghmare and C. N. R. Rao, Rare earth chromites: a new family of multiferroics, J. Mater. Chem., 2007, 17, 42–44 RSC.
- I. Bhati, P. B. Punjabi and S. C. Ameta, Photocatalytic degradation of fast green using nanosized CeCrO3, Maced, J. Chem. Chem. Eng., 2010, 29, 195 CAS.
- K. Yoshii and A. Nakamura, Reversal of magnetization in La0.5Pr0.5CrO3, J. Solid State Chem., 2000, 155(2), 447–450 CrossRef CAS.
- A. Indra, K. Dey, A. Midya, P. Mandal, O. Gutowski, U. Rütt, S. Majumdar and S. Giri, Magnetoelectric coupling and exchange bias effects in multiferroic NdCrO3, J. Phys.: Condens.Matter, 2016, 28(16), 166005 CrossRef CAS.
- T. Yamaguchi and K. Tsushima, Magnetic symmetry of rare-earth orthochromites and orthoferrites, Phys. Rev. B, 1973, 8, 5187 CrossRef CAS.
- T. Arakawa, S. Tsuchi-Ya and J. Shiokawa, Catalytic activity of rare-earth orthoferrites and orthochromites, Mater. Res. Bull., 1981, 16(1), 97–103 CrossRef CAS.
- J. Mao, Y. Sui, X. Zhang, Y. Su, X. Wang, Z. Liu, Y. Wang, R. Zhu, Y. Wang, W. Liu and J. Tang, Temperature-and magneticfield-induced magnetization reversal in perovskite YFe0.5Cr0.5O3, Appl. Phys. Lett., 2011, 98(19), 192510 CrossRef.
- V. V. Kharton, A. A. Yaremchenko and E. N. Naumovich, Research on the electrochemistry of oxygen ion conductors in the former Soviet Union. II. Perovskite-related oxides, J. Solid State Electrochem., 1999, 3, 303–326 CrossRef CAS.
- Z. Shao, W. Zhou and Z. Zhu, Advanced synthesis of materials for intermediate temperature solid oxide fuel cells, Prog. Mater. Sci., 2012, 57(4), 804–874 CrossRef CAS.
- M. Siemons, A. Leifert and U. Simon, Preparation and gas sensing characteristics of nanoparticulate p-type semiconducting LnFeO3 and LnCrO3 materials, Adv. Funct. Mater., 2007, 17(13), 2189–2197 CrossRef CAS.
- A. McDannald, L. Kuna and M. Jain, Magnetic and magnetocaloric properties of bulk dysprosium chromite, J. Appl. Phys., 2013, 114(11), 113904 CrossRef.
- R. Saha, A. Sundaresan and C. N. R. Rao, Novel features of multiferroic and magnetoelectric ferrites and chromites exhibiting magnetically driven ferroelectricity, Mater. Horiz., 2014, 1, 20–31 RSC.
- Z. Hou, F. Chen, J. Wang, C. P. François-Xavier and T. Wintgens, Novel Pd/GdCrO3 composite for photo-catalytic reduction of nitrate to N2 with high selectivity and activity, Appl. Catal., B, 2018, 232, 124–134 CrossRef CAS.
- K. Parida, A. Nashim and S. K. Mahanta, Visible-light driven Gd2Ti2O7/GdCrO3 composite for hydrogen evolution, Dalton Trans., 2011, 40(48), 12839–12845 RSC.
- S. Mahana, U. Manju and D. Topwal, GdCrO3: a potential candidate for low temperature magnetic refrigeration, J. Phys. D: Appl. Phys., 2018, 51(30), 305002 CrossRef.
- A. Nashim, S. Pany and K. Parida, Systematic investigation on the charge storage behavior of GdCrO3 in aqueous electrolyte, J. Energy Storage, 2021, 42, 103145 CrossRef.
- S. Terkhi, S. Bentata, Z. Aziz, T. Lantri and B. Abbar, First principle calculations of structural, electronic and magnetic properties of cubic GdCrO3 Perovskite, Indian J. Phys., 2018, 92, 847–854 CrossRef CAS.
- S. Mahana, U. Manju and D. Topwal, Complex magnetic behavior in GdCrO3, AIP Conf. Proc., 2017, 1832(1), 130046 CrossRef.
- A. Jaiswal, R. Das, S. Adyanthaya and P. Poddar, Synthesis and optical studies of GdCrO3 nanoparticles, J. Nanopart. Res., 2011, 13, 1019–1027 CrossRef CAS.
- T. Yamaguchi and K. Tsushima, Magnetic symmetry of rare-earth orthochromites and orthoferrites, Phys. Rev. B, 1973, 8, 5187–5198 CrossRef CAS.
- T. Yamaguchi and K. Tsushima, Magnetic Symmetry of Rare-Earth Orthochromites and Orthoferrites, Phys. Rev. B, 1973, 8, 5187 CrossRef CAS.
- G. V. Subba Rao, G. V. Chandrashekhar and C. N. R. Rao, Are rare earth orthochromites ferroelectric?, Solid State Commun., 1968, 6(3), 177–179 CrossRef.
- A. Jaiswal, R. Das, K. Vivekanand, T. Maity, P. M. Abraham, S. Adyanthaya and P. Poddar, Magnetic and dielectric properties and Raman spectroscopy of GdCrO3 nanoparticles, J. Appl. Phys., 2010, 107, 013912 CrossRef.
- A. K. Tripathi and H. B. Lal, Electrical transport in light rare-earth orthochromites, J. Mater. Sci., 1982, 17, 1595–1609 CrossRef CAS.
- H. B. Lal, R. D. Dwivedi and K. Gaur, Pyroelectric and dielectric properties of some light rare-earth orthochromites, J. Mater. Sci.: Mater. Electron., 1990, 1, 204–208 CrossRef CAS.
- Y. Shen, M. Liu, T. He and S. P. Jiang, electrical conductivity, and thermal expansion behavior of dense Nd1-xCaxCrO3 solid solutions, J. Am. Ceram. Soc., 2009, 92, 2259–2264 CrossRef CAS.
- R. Mguedla, A. Ben Jazia Kharrat, M. Saadi, K. Khirouni, N. Chniba-Boudjada and W. Boujelben, Structural, electrical, dielectric and optical properties of PrCrO3 orthochromite, J. Alloys Compd., 2020, 812, 152130 CrossRef CAS.
- R. Mguedla, A. Ben Jazia Kharrat, O. Taktak, H. Souissi, S. Kammoun, K. Khirouni and W. Boujelben, Experimental and theoretical investigations on optical properties of multiferroic PrCrO3 ortho chromite compound, Opt. Mater., 2020, 101, 109742 CrossRef CAS.
- Z. Xiang, J. Xub, Y. Huang, S. Gea and Y. Cui, Novel multiferroicity in orthorhombic SmCrO3, Nat. Sci. Mater., 2018, 28, 609–613 CAS.
- J. Shanker, K. Venkataramana, B. Vittal Prasad, R. Vijaya Kumar and D. Suresh Babu, Influence of Fe substitution on structural and electrical properties of Gd orthochromite ceramics, J. Alloys Compd., 2018, 732, 314–327 CrossRef CAS.
- J. Shanker, B. Vittal Prasad, M. Buchi Suresh, R. Vijaya Kumar and D. Suresh Babu, Electrical properties of NdCr1-xFexO3 perovskite ceramic nanoparticles-An impedance spectroscopy studies Mater, Res. Bull., 2017, 94, 385–398 CrossRef CAS.
- F. Rehman, J. B. Li, Y. K. Dou, J. S. Zhang, Y. J. Zhao, M. Rizwan, S. Khalid and H.-B. Jin, Dielectric relaxations and electrical properties of Aurivillius Bi3.5La0.5Ti2Fe0.5Nb0.5O12 ceramics, J. Alloys Compd., 2016, 654, 315–320 CrossRef CAS.
- A. Bougoffa, A. Benali, M. Bejar, E. Dhahri, M. P. F. Graça, M. A. Valente, L. Bessais and B. F. O. Costa, Mg-substitution effect on microstructure, dielectric relaxation and conduction phenomenon of Fe based perovskite nanomaterials, J. Alloys Compd., 2021, 856, 157425 CrossRef CAS.
- A. Benali, E. M. Benali, S. Gouadria, M. Elhadi, E. Dhahri, M. P. F. Graça, M. A. Valente and B. F. O. Costa, Colossal dielectric constant with enhanced magnetization in the La3+ and Ca2+ co-doped BiFeO3 nanoparticles, J. Mater. Sci.: Mater. Electron., 2022, 33, 16236–16250 CrossRef CAS.
- I. Elhamdi, F. Mselmi, H. Souissi, S. Kammoun, E. Dhahri, P. Sanguino and B. F. O. Costa, Summerfield scaling model and electrical conductivity study for understanding transport mechanisms of a Cr3+ substituted ZnAl2O4 ceramic, RSC Adv., 2023, 13, 3377–3393 RSC.
- H. M. Rietveld, A profile refinement method for nuclear and magnetic structures, J. Appl. Crystallogr., 1969, 2, 65–71 CrossRef CAS.
- A. Bougoffa, E. M. Benali, A. Benali, M. Bejar, E. Dhahri, M. P. F. Graça, M. A. Valente, G. Otero-Iruruetac and B. F. O. Costa, Investigation of temperature and frequency dependence of the dielectric properties of multiferroic (L0.8Ca0.2)0.4Bi0.6FeO3 nanoparticles for energy storage application, RSC Adv., 2022, 12, 6907–6917 RSC.
- E. M. Benali, A. Benali, M. Bejar, E. Dhahri, M. P. F. Graca, M. A. Valente and B. F. O. Costa, Structural, morphological, Raman, dielectric and electrical properties of La1−2xBaxBixFeO3 (0.00 ≤ x ≤ 0.20) compounds, RSC Adv., 2021, 11, 36148–36165 RSC.
- M. Horchani, A. Omri, M. Seif Eddine, A. Benali, A. Tozri, E. Dhahri, K. Pavani, B. F. O. Costa and M. F. P. Graca, Ni–Cu–Co ferrite synthesized using the sol–gel method: Effects of the Cr3+ ion concentration on its structural, electrical, and dielectric properties, Appl. Phys. A, 2022, 128, 947 CrossRef CAS.
- A. Jaiswal, R. Das, S. Adyanthaya and P. Poddar, Synthesis and optical studies of GdCrO3 nanoparticles, J. Nanopart. Res., 2011, 13, 1019–1027 CrossRef CAS.
- P. Mohanty, B. S. Jacobs, A. R. E. Prinsloo and C. J. Sheppard, Thermal decomposition of GdCrO4 to GdCrO3: structure and magnetism, AIP Adv., 2021, 11(1), 015235 CrossRef CAS.
- Z. Ma, G. Liu, W. Gao, Y. Liu, L. Xie, X. He, L. Liu, Y. Li and H. Zhang, The tunable spin reorientation, temperature induced magnetization reversal, and spontaneous exchange bias effect of Sm0.7Y0.3Cr1-xGaxO3, RSC Adv., 2018, 8, 33487–33495 RSC.
- A. Heydon, J. Horning, R. Levin, T. Mann, and Y. Yu, The Vesta-2 Software Description Language, Technical Report 1997-005, 1997 Search PubMed.
- I. Elhamdi, H. Souissi, O. Taktak, S. Kammoun, E. Dhahri, J. Pina, B. F. O. Costa and E. López-Lago, Optical characterization and defect-induced behavior in ZnAl1.999Ho0.001O4 spinel: Unraveling novel insights into structure, morphology, and spectroscopic features, Heliyon, 2024, 10(8), e29241 CrossRef CAS.
- I. Elhamdi, H. Souissi, O. Taktak, J. Elghoul, S. Kammoun, E. Dhahri and B. F. O. Costa, Experimental and modeling study of ZnO: Ni nanoparticles for near-infrared light emitting diodes, RSC Adv., 2022, 12, 13074–13086 RSC.
- I. Elhamdi, F. Mselmi, S. Kammoun, E. Dhahri, A. J. Carvalho, P. Tavares and B. F. O. Costa, A far-red-emitting ZnAl1.95Cr0.05O4 phosphor for plant growth LED applications, Dalton Trans., 2023, 52, 9301–9314 RSC.
- I. Elhamdi, H. Souissi, S. Kammoun, E. Dhahri, A. L. B. Brito, R. Fausto and B. F. O. Costa, Experimental determination and modeling of structural, vibrational and optical properties of the ZnAl2−xCrxO4 (x= 0 and 0.05) spinels, J. Lumin., 2023, 263, 119968 CrossRef CAS.
- I. Elhamdi, H. Souissi, S. Kammoun, E. Dhahri, J. Pina, B. F. O. Costa and E. López-Lago, Comprehensive characterization and optoelectronic significance of Ho3+ and Cr3+ Co-doped ZnAl2O4 spinels, Dalton Trans., 2024, 53, 7721–7733 RSC.
- K. Weron, How to obtain the universal response law in the Jonscher screened hopping model for dielectric relaxation, J. Phys.: Condens. Matter, 1991, 3, 221 CrossRef.
- K. Funke, Jump relaxation in solid electrolytes, Prog. Solid State Chem., 1993, 22, 111–195 CrossRef CAS.
- R. B. Said, B. Louati, K. Guidara and S. Kamoun, Thermodynamic properties and application of CBH model in the ac conductivity of LiNi1.5P2O7 ceramic, Ionics, 2014, 20, 1071–1078 CrossRef.
- A. Ghosh, Transport properties of vanadium germanate glassy semiconductors, Phys. Rev. B, 1990, 42, 5665 CrossRef CAS PubMed.
- M. F. Kotkata, F. A. Abdel-Wahab and H. M. Maksoud, Investigations of the conduction mechanism and relaxation properties of semiconductor Sm doped a-Se films, J. Phys. D: Appl. Phys., 2006, 39, 2059 CrossRef CAS.
- S. R. Majid and A. K. Arof, Electrical behavior of proton-conducting chitosan-phosphoric acid-based electrolytes, Phys. B, 2007, 390, 209–215 CrossRef CAS.
- K. P. Padmasree, D. K. Kanchan and A. R. Kulkarni, Impedance and Modulus studies of the solid electrolyte system 20CdI2–80 [xAg2O–y (0.7V2O5–0.3 B2O3)], where 1≤ x/y≤ 3, Solid State Ionics, 2006, 177, 475–482 CrossRef CAS.
- M. Pecovska-Gjorgjevich, S. Aleksovska, S. Dimitrovska-Lazova and M. Marinšek, The role of Cr/Co substitution on dielectric properties of gadolinium orthochromite, Phys. Scr., 2016, 91, 045805 CrossRef.
- P. B. Macedo, C. T. Moynihan and R. Bose, The role of ionic diffusion in polarisation in vitreous ionic conductors, Phys. Chem. Glasses, 1972, 13, 171–179 CAS.
- J. H. Joshi, G. M. Joshi, M. J. Joshi, H. O. Jethva and K. D. Parikh, Complex impedance, FT-Raman, and photoluminescence spectroscopic studies of pure and L-phenylalanine doped ammonium dihydrogen phosphate single crystals: the correlation with hydrogen bonding defect, New J. Chem., 2018, 42, 17227–17249 RSC.
- M. Satalkar, S. N. Kane, M. Kumaresavanji and J. P. Araujo, On the role of cationic distribution in determining magnetic properties of Zn0.7-xNixMg0.2Cu0.1Fe2O4 nano ferrite, Mater. Res. Bull., 2017, 91, 14–21 CrossRef CAS.
- J. G. Lyagaeva, G. K. Vdovin and D. A. Medvedev, Distinguishing Bulk and Grain Boundary Transport of a Proton-Conducting Electrolyte by Combining Equivalent Circuit Scheme and Distribution of Relaxation Times Analyses, J. Phys. Chem. C, 2019, 123(36), 21993–21997 CrossRef CAS.
- S. G. Kakade, Y.-R. Ma, R. S. Devan, Y. D. Kolekar and C. V. Ramana, Dielectric, Complex Impedance, and Electrical Transport Properties of Erbium (Er3+) Ion-Substituted Nanocrystalline, Cobalt-Rich Ferrite (Co1.1Fe1.9–xErxO4), J. Phys. Chem. C, 2016, 120, 5682–5693 CrossRef CAS.
| This journal is © The Royal Society of Chemistry 2024 |

