 Open Access Article
Construction of Cnts/calcined Zn-Co-LDHs hydrid to enhanced photocatalytic for ofloxacin decomposition: mechanism, degradation pathway, and toxicity assessment†
Nguyen Hoai Nama,
Nguyen Quoc Hungb,
Nguyen Thi Hong Anh c,
Nguyen Quoc Thang
 a and
Nguyen Thi Mai Tho
 *a
*a
aFaculty of Chemical Engineering, Industrial University of Ho Chi Minh City, Ho Chi Minh, Vietnam nguyenthimaitho@iuh.edu.vn
bCenter of Analytical Services and Experimentation HCM City, 2 Nguyen Van Thu, Đakao, District 1, Ho Chi Minh City, Vietnam
cFaculty of Chemical Engineering, Ho Chi Minh City University of Industry and Trade, 140 Le Trong Tan Street, Tay Thanh Ward, Tan Phu District, Ho Chi Minh, Vietnam
First published on 14th October 2024
Abstract
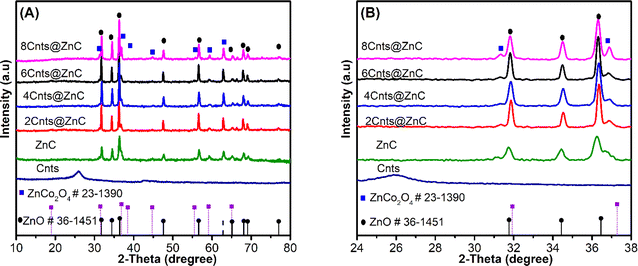
This work successfully synthesized the Cnts/calcined Zn-Co-LDHs (xCnts@ZnC) hybrid material using the Zn-Co-LDHs precursor. Using the co-precipitation method, we synthesized Zn-Co-LDHs onto Cnts ranging in mass from 0 to 80 mg. These were subsequently calcined at 550 °C to yield xCnts@ZnC (x = 2, 4, 6, 8). Based on the results, ZnC is found on the surface of Cnts in two phases: ZnO and ZnCo2O4. The photocatalytic activity of xCnts@ZnC is demonstrated by its capacity to degrade ofloxacin antibiotics (OFL) in the visible region; 6Cnts@ZnC (85.8%; k = 0.0099 min−1), shows the best decomposition rate constant, increasing by three times when compared to ZnC (53.3%; k = 0.0048 min−1). The h+, O2˙−, radicals are the main factors that determine of the decomposition process in the identified OFL decomposition mechanism of 6Cnts@ZnC, in which Cnts have the role of transporting and collecting electrons, minimizing the recombination between photogenerated electrons and holes. The OFL degradation pathways of 6Cnts@ZnC were also investigated and identified by the HPLC-MS spectrum and suggested the new degradation mechanism to small molecules that have nontoxic of small molecules to environment site by ADMET model. The OFL degradation obtained 96.44% and set equivalent of degradation after completing 300 min.
1 Introduction
The development of antibiotics is a significant milestone in the field of medicine due to their potent antibacterial capabilities, which are effective in the treatment and prevention of infections, inflammation, and other related conditions.1–3 OFL is one of the fluoroquinolone groups of antibiotics that is typically utilized in both commercial animal treatment and human medicine.4 The chemical stability of OFL and antibiotics in general means that they frequently do not completely absorb into the bodies of humans or animals. Instead, they are discharged into the environment, contaminating water sources, disrupting the ecological balance, and impacting organisms, so potentially fostering the emergence of antibiotic-resistant bacteria.5,6 As a result, they are discharged into the environment, contaminating water sources, disrupting the ecological balance, and impacting organisms, so potentially fostering the emergence of antibiotic-resistant bacteria occurrence and removal of multiple.2,7 Hence, the evaluation and removal of antibiotics from the environment of water has drawn a lot of interest in recent years.2,8 Environmental technology has examined multiple research approaches for eliminating antibiotics, such as adsorption,4 photocatalysis, biodegradation,7 and chemical decomposition.8 Using advanced oxidation processes (AOPs) is a promising method to break down antibiotics.9 This method utilizes semiconductors that absorb light in the visible area to generate pairs of electrons (e−) and holes (h+), which then remove antibiotics.10 Mixed metal oxides (MMO) generated from Layered Double Hydroxides (LDHs) have garnered interest recently due to their versatility and simple synthesis.11,12 The general formula for the layer structure of LDHs is [M1−x2+ Mx3+ (OH)2]x+ (An−)x/n·yH2O, where M2+ and M3+ are the divalent and trivalent metals, respectively, and An− are the interlayer anions.12,13 The MMO is composed of a divalent metal oxide and a spinel phase that is generated when LDHs are heated at high temperatures.14,15 MMO are used for many fields because of their surface adsorption, interlayer anion exchange, and “memory effect” rebuilding of a calcined LDHs precursor.15–17 Good electrical conductivity is a crucial characteristic of nanocarbons, which come in a variety of allotropes with a wide surface area dispersion, including graphite,18 graphene (GO),19 carbon nano tubes (Cnts)13 and reduced graphene oxide (RGO).20 To increase the band gap, prevent the combining of photogenerated electrons and holes, and enhance the effectiveness of photocatalysis, in order research has used a hybrid material consisting of MMO and nanocarbons.21,22 Several specific investigations, including RGO/Ni-Fe-MMO,20 GO/Zn-Al-MMO,14 Cnts/Zn-Cr-MMO,13 and RGO/Zn-Bi-MMO,23 have successfully used this graft material as a photocatalyst for the degradation of dyes or antibiotics. Motivated by the advantages MMO with LDHs precursors and nanocarbons, especially Cnts, we researched the synthesis of Cnts@Zn-Co-MMO hybrid material and applied the decomposition of OFL antibiotics in the visible light. The effects of various parameters on the photodegradation of OFL were investigated and discussed in detail. Furthermore, the photocatalyst's degradation mechanism was identified, and a new OFL degradation mechanism was projected.One modern economic trend is the use of computational approaches for drug design and property forecasting. There is a relationship between environmental characteristics and drug design models, but these parameters are also environmental. Pharmacy technicians, chemists, and environmental chemists can evaluate the toxicity of drugs and the environment using multiple models, one of which is the ADMET model.24–26 Some model predicted well ADMET of active compound in vitro likeness drug.27,28 The environmental impact for intermediate products of OFL degradation was assessed in this study using the ADMET prediction model.
2 Materials and methods
2.1 Materials
Cobalt(II) nitrate hexahydrate (Co(NO3)2·6H2O; 98%), zinc acetate dihydrate (Zn(CH3COO)2·2H2O; 99.5%), ethanol (C2H5OH; 99.5%), sodium hydroxide (NaOH; 99%) were purchased from Sigma-Aldrich, USA. Ofloxacin (98%), silver nitrate (AgNO3; 99.8%), ethanol (98%), p-benzoquinone (99%), Na2-EDTA, and were obtained from Xilong Scientific Co., Ltd, China. Carbon nanotubes (Cnts, 99%) were purchased from Jiangsu Xfnano Materials Tech Co., Ltd China.2.2 Synthesis of xCnts@ZnC hydrid
The xCnts@ZnC photocatalysts were synthesized using the co-precipitation method established by K. M. Parida29 with different amounts of Cnts ranging from 0 to 80 mg. Solution A contains 100 mL of 0.3 M Zn(CH3COO)2 and 100 mL of 0.1 M Co(NO3)2 in the molar ratio Zn/Co 3/1. In mixture B, the Cnts are distributed uniformly in 100 mL of 0.5 M NaOH solution by ultrasonic waves, based on the various masses of Cnts (0, 20, 40, 60, 80 mg). Slowly add solution A into mixture B, resulting in the formation of a pink precipitate in mixture B. The mixture is constantly stirred and maintained at a pH of 10 using a NaOH solution throughout the synthesis process. The pink mixture solution was subjected to thermal aging at 100 °C for 24 hours. The xCnts@ZnC (x = 0, 2, 4, 6, 8), the black product, is obtained by drying the product at 100 °C and calcining it at 500 °C for 4 hours. The samples are labeled as follows: ZnC; 2Cnts@ZnC, 4Cnts@ZnC, 6Cnts@ZnC and 8Cnts@ZnC.2.3 Photocatalytic measurements
The photocatalytic activity of the xCnts@ZnC hydrid were evaluated by analyzing the degradation of OFL in a water solvent under the region of visible light. The suspension consisted of 100 mL of 20 ppm OFL solution and 0.1 g 6Cnts@ZnC was sonicated for 10 minutes and stirred for 50 minutes in dark to reach equilibrium or adsorption. The concentration of OFL (Co) was subsequently determined.The photocatalytic system is then exposed directly to the visible light source from the halogen lamp (64640 HLX 150W, 24V, Osram, Germany) for 240 minutes, the maximum intensity of the light source is 100 mW cm−2. Every 30 minutes during the photocatalytic process, 3 mL of the suspension was removed and filtered through a 0.22 μm filter to get away of the solid residues. The decrease in OFL concentration over time was measured using UV spectroscopy at a wavelength of 275 nm. The OFL is directly photolyzed in the absence of a catalyst under the same conditions.
The optimum settings for the catalytic process were determined by analyzing factors influencing the OFL decomposition process of xCnts@ZnC materials, including xCnts@ZnC with different mass of Cnts; initial OFL concentration; the amount of hybrid material and pH. Using HPLC-MS spectrum to identify intermediate products OFL degradation.
3 Results and discussion
3.1 Characterization
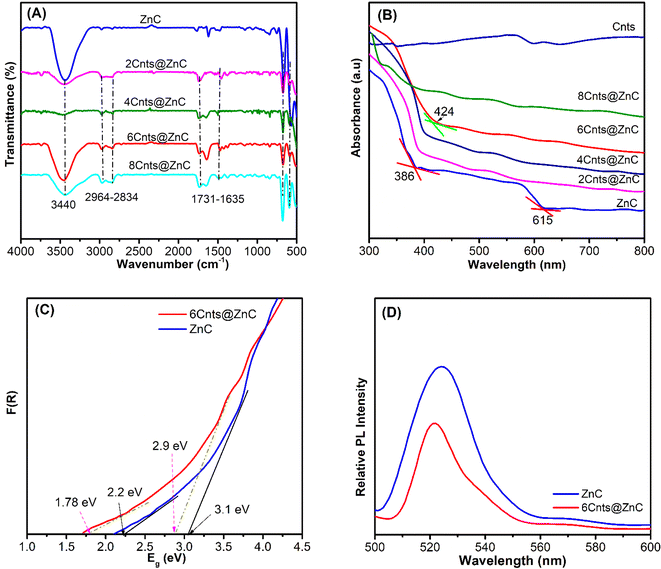
The FT-IR (Bruker-EQUINOX) study of the ZnC; 2Cnts@ZnC, 4Cnts@ZnC, 6Cnts@ZnC, and 8Cnts@ZnC samples show peaks at positions 3440 and 1600 cm−1, which correspond to the stretching vibrations of the O–H group in H2O20 (Fig. 2A). Additionally, there are peaks observed at locations 800–500 cm−1, which can be attributed to the vibrations of the Co–O and Zn–O groups.34,35 The 2Cnts@ZnC, 4Cnts@ZnC, 6Cnts@ZnC and 8Cnts@ZnC samples show characteristic vibrations of the C![[double bond, length as m-dash]](https://www.rsc.org/images/entities/char_e001.gif) C bond and vibrations of the C
C bond and vibrations of the C![[double bond, length as m-dash]](https://www.rsc.org/images/entities/char_e001.gif) O bond of COOH group, in along with peaks in the areas 1731–1635 cm−1.36 The peaks observed between 2964 and 2834 cm−1 can be attributed to the stretching vibrations of the C–H bonds in the CH2 group.37 This result is also in accordance with the bond structure of Cnts, which includes both C
O bond of COOH group, in along with peaks in the areas 1731–1635 cm−1.36 The peaks observed between 2964 and 2834 cm−1 can be attributed to the stretching vibrations of the C–H bonds in the CH2 group.37 This result is also in accordance with the bond structure of Cnts, which includes both C![[double bond, length as m-dash]](https://www.rsc.org/images/entities/char_e001.gif) C; C
C; C![[double bond, length as m-dash]](https://www.rsc.org/images/entities/char_e001.gif) O and C–H bonds.
O and C–H bonds.
The material's photocatalytic effectiveness is mostly dependent on the process of recombination between charge transfer and photogenerated electron–holes following light absorption.42,43 Fig. 2D displays the photoluminescence (PL) measurement outcomes for two samples, ZnC and 6Cnts@ZnC, when excited with a wavelength of 260 nm. The PL data for the ZnC sample reveal a very high maximum peak intensity, indicating a quick recombination rate, resulting in a low photocatalytic efficiency.44 But with the 6Cnts@ZnC sample, the maximum peak intensity is much lower, which lowers the rate at which photogenerated electrons and holes recombine.43 This makes it easier for electrons on the ZnC surface to transfer electrons to Cnts, which oxidizes and breaks down antibiotics, boosting the photocatalytic efficiency of 6Cnts@ZnC.
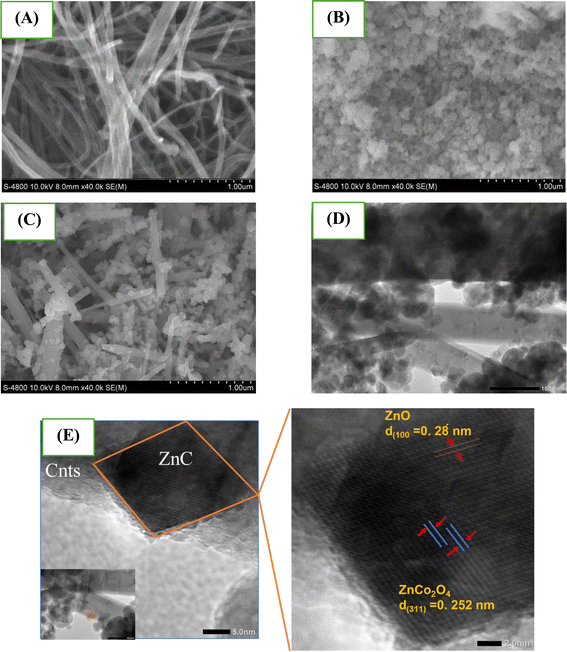
Further, the measurement of the distance between the lattice fringes in high resolution mode (HrTEM; JOEL JEM 2100) shows values of 0.28 nm and 0.251 nm, respectively, corresponding to the (100) plane of ZnO47 and the (311) plane of ZnCo2O4.48,49
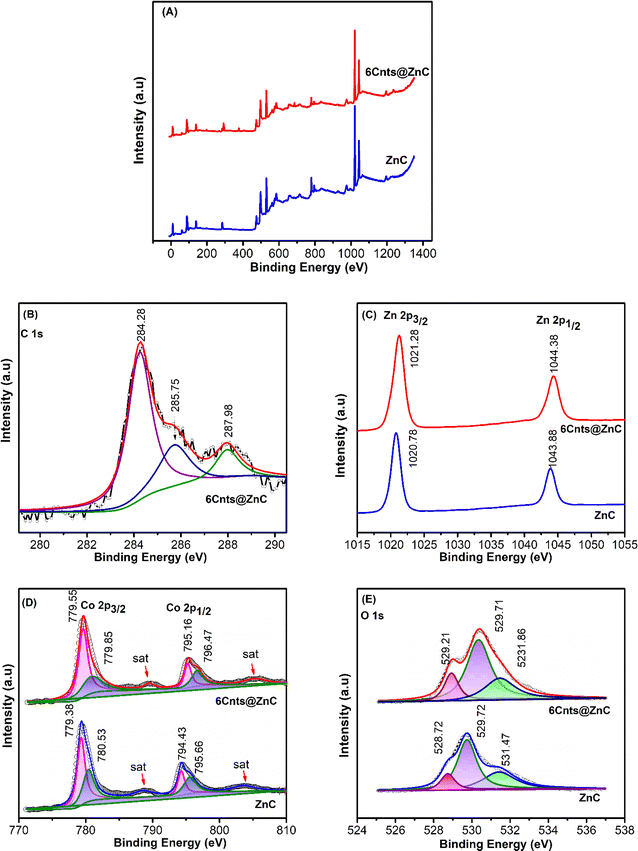 | ||
| Fig. 4 XPS survey spectra (A); high resolution core level spectra of (B) C 1s; (C) Zn 2p; (D) Co 2p; and (E) O 1s for ZnC and 6Cnts@ZnC. | ||
The deconvolution C 1s of the 6Cnts@ZnC sample in high resolution spectrum has three peaks with energy levels 284.28, 285.75 and 287.98 eV which are the bonds attributed to the graphitized carbon sp2 C![[double bond, length as m-dash]](https://www.rsc.org/images/entities/char_e001.gif) C, C–C bond, and C
C, C–C bond, and C![[double bond, length as m-dash]](https://www.rsc.org/images/entities/char_e001.gif) O bond (Fig. 4B).50,51 The C
O bond (Fig. 4B).50,51 The C![[double bond, length as m-dash]](https://www.rsc.org/images/entities/char_e001.gif) O bond power indicates that there is considerable oxidation in the Cnts network when paired with ZnC, and the graphitized carbon sp2 signal of C 1s indicates that there is an interaction between Cnts and ZnC.13 In addition, the ZnC and 6Cnts@ZnC samples show an apparent shift in the high-resolution XPS spectra of Zn 2p, indicating the creation of chemical interactions at the interface between Zn and C. The binding energies (B.E.) of the Zn 2p3/2 and Zn 2p1/2 peaks in pure ZnC are 1020.78 and 1043.88 eV, respectively. However, in the case of 6Cnts@ZnC, the associated peaks exhibit B.E. of 1021.28 and 1044.38 eV, respectively. The observed increase in B.E. at the Zn 2p position of 6Cnts@ZnC, relative to the Zn 2p location of ZnC, suggests that there is an electron transfer from ZnC to Cnts13 (Fig. 4C). The XPS spectra of Co 2p exhibits two prominent wide peaks, which correspond to Co 2p3/2 and Co 2p1/2 (Fig. 4D).52 Furthermore, two minor peaks in this spectrum (B.E. 789, 805 eV) linked to satellite shaking give additional evidence for the presence of multivalent cobalt (Co3+ and Co2+).53 Two peaks with B.E. 779.38 and 780.53 eV are included in the decoding results based on the Gaussian of the peak at value Co 2p3/2, and two peaks with B.E. 794.43 and 795.66 eV are included in the decoding results at value Co 2p1/2. Previous research on the characteristics of multivalent Co indicates that Co3+ is represented by two peaks with B.E. of 779.38 and 794.43 eV, whereas Co2+ is represented by two peaks with B.E. of 780.53 and 795.66 eV.54,55 The B.E. of Co 2p in 6Cnts@ZnC exhibits a clear shift towards higher values compared to the B.E. of Co 2p in ZnC. The high resolution XPS spectra of O 1s region of ZnC at B.E. of 528.72, 529.72 and 531.47 eV, as displayed in Fig. 4E, are indicative of typical metal–oxygen bonds (lattice oxygen – OL) oxygen vacancies – Ov, and oxygen absorbed on the surface – Ow.51,56,57 The XPS spectra of the O 1s region of 6Cnts@ZnC exhibit three distinct peaks, with higher binding energies compared to the O 1s spectrum of ZnC. The study results indicate a slight positive change in the binding energy at O 1s, Zn 2p, and Co 2p of the 6Cnts@ZnC sample in comparison to the ZnC sample. This indicates that the bond state and charge distribution of elements in the 6Cnts@ZnC sample suffered changes, leading to a decrease in electron density at these positions.18,58 Consequently, there is an increase in bond energy. Energy level changes like this show that Cnts and ZnC interact chemically to produce Zn–C and Co–C bonds in the 6Cnts@ZnC material.51,59 They also facilitate the transfer of 6Cnts@ZnC electrons from ZnC's surface to Cnts.49,60
O bond power indicates that there is considerable oxidation in the Cnts network when paired with ZnC, and the graphitized carbon sp2 signal of C 1s indicates that there is an interaction between Cnts and ZnC.13 In addition, the ZnC and 6Cnts@ZnC samples show an apparent shift in the high-resolution XPS spectra of Zn 2p, indicating the creation of chemical interactions at the interface between Zn and C. The binding energies (B.E.) of the Zn 2p3/2 and Zn 2p1/2 peaks in pure ZnC are 1020.78 and 1043.88 eV, respectively. However, in the case of 6Cnts@ZnC, the associated peaks exhibit B.E. of 1021.28 and 1044.38 eV, respectively. The observed increase in B.E. at the Zn 2p position of 6Cnts@ZnC, relative to the Zn 2p location of ZnC, suggests that there is an electron transfer from ZnC to Cnts13 (Fig. 4C). The XPS spectra of Co 2p exhibits two prominent wide peaks, which correspond to Co 2p3/2 and Co 2p1/2 (Fig. 4D).52 Furthermore, two minor peaks in this spectrum (B.E. 789, 805 eV) linked to satellite shaking give additional evidence for the presence of multivalent cobalt (Co3+ and Co2+).53 Two peaks with B.E. 779.38 and 780.53 eV are included in the decoding results based on the Gaussian of the peak at value Co 2p3/2, and two peaks with B.E. 794.43 and 795.66 eV are included in the decoding results at value Co 2p1/2. Previous research on the characteristics of multivalent Co indicates that Co3+ is represented by two peaks with B.E. of 779.38 and 794.43 eV, whereas Co2+ is represented by two peaks with B.E. of 780.53 and 795.66 eV.54,55 The B.E. of Co 2p in 6Cnts@ZnC exhibits a clear shift towards higher values compared to the B.E. of Co 2p in ZnC. The high resolution XPS spectra of O 1s region of ZnC at B.E. of 528.72, 529.72 and 531.47 eV, as displayed in Fig. 4E, are indicative of typical metal–oxygen bonds (lattice oxygen – OL) oxygen vacancies – Ov, and oxygen absorbed on the surface – Ow.51,56,57 The XPS spectra of the O 1s region of 6Cnts@ZnC exhibit three distinct peaks, with higher binding energies compared to the O 1s spectrum of ZnC. The study results indicate a slight positive change in the binding energy at O 1s, Zn 2p, and Co 2p of the 6Cnts@ZnC sample in comparison to the ZnC sample. This indicates that the bond state and charge distribution of elements in the 6Cnts@ZnC sample suffered changes, leading to a decrease in electron density at these positions.18,58 Consequently, there is an increase in bond energy. Energy level changes like this show that Cnts and ZnC interact chemically to produce Zn–C and Co–C bonds in the 6Cnts@ZnC material.51,59 They also facilitate the transfer of 6Cnts@ZnC electrons from ZnC's surface to Cnts.49,60
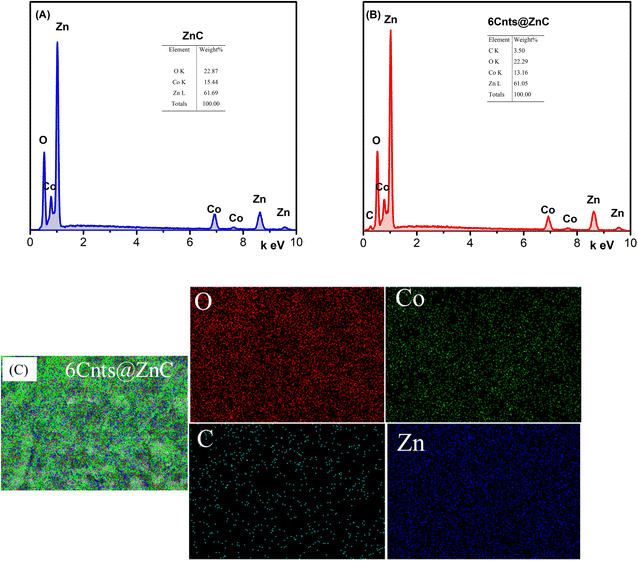
Fig. 5 displays the EDS result for the samples ZnC and Cnts@ZnC. Sample ZnC contains the elements C (2.17 wt%), O (22.87 wt%), Co (15.44% wt%), and Zn (61.69% wt%), whereas sample 6Cnts@ZnC contains the elements C (3.5 wt%), O (22.29 wt%), Co (13.16 wt%), and Zn (61.05 wt%).
3.2 Catalytic activity
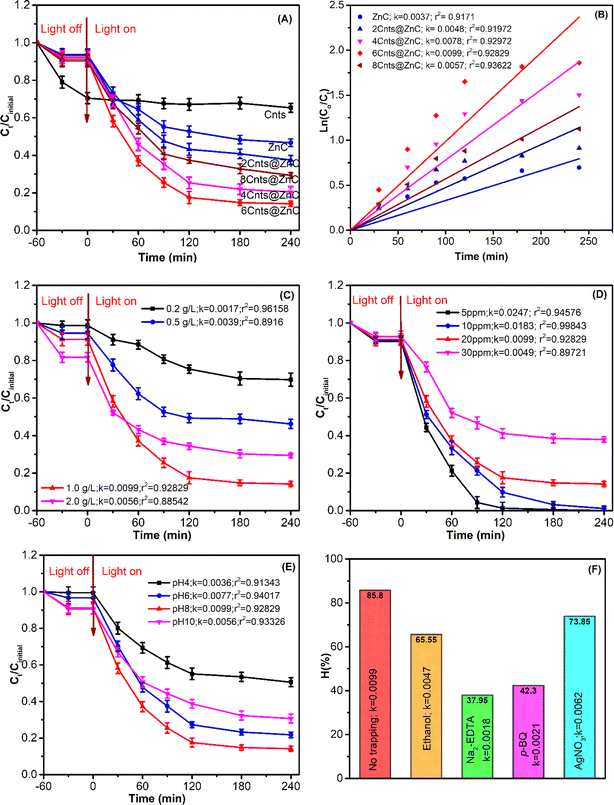
In 60 minutes, ZnC and xCnts@ZnC were able to remove 6–10% of the OFL reach desorption equilibrium, but the OFL degradation efficiency changed significantly (62.5–85.8%) during light on. Those experimental findings also show that the OFL decomposition efficiency of xCnts@ZnC (x = 2, 4, 6) has been significantly enhanced when increasing the Cnts mass from 20 to 60 mg, with 6Cnts@ZnC demonstrating its highest OFL decomposition efficiency, reaching (85.8%; k = 0.0099 min−1). When compared to ZnC, the OFL decomposition rate constant of 6Cnts@ZnC is three times higher. These are 2 reason: (i) Cnts possess a large surface charge. Thus, the precipitation of ZnC onto Cnts will result in an increase of the surface area of the xCnts@ZnC hydrid. This increase in area will enhance the adsorption capacity and boost the photoactivity of the xCnts@ZnC hydrid.61,62 (ii) Additionally, the Cnts function as pathways for the transport and capture of electrons, which promotes electron mobility on the xCnts@ZnC surface and lengthens the lifetime of photoelectrons. This results in reduced recombination between photogenerated electrons and holes, boosting the photocatalytic activity of xCnts@ZnC.40,45,63 However, the OFL degradation efficiency of the 8Cnts@ZnC hybrid photocatalyst diminished to 70.7% (k = 0.0057 min−1). The explanation could be that when increasing loading Cnts (80 mg) is combined with ZnC, too much black Cnts is deposited on ZnC, which prevents ZnC from absorbing light. These can decrease the efficiency of electron transfer between the Cnts and ZnC, resulting in an increased rate of electron recombination and hole generation by photoexcitation. Therefore, the OFL degradation efficiency of 8Cnts@ZnC decreased.61,62,64
After analyzing the catalytic process of composites using the first-order kinetic equation, we obtained R2 values ranging from 0.9171 to 0.93622 (Fig. 6B). This establishes that the OFL breakdown process of xCnts@ZnC catalysts are accurately described via the first-order kinetic equation. The results indicated that the efficiency and degradation rate of OFL in the xCnts@ZnC followed an established order: 6Cnts@ZnC (85.8%; k = 0.0099 min−1) > 4Cnts@ZnC (79.5%; k = 0.0078 min−1) > 8Cnts@ZnC(70.7%; k = 0.0057 min−1) > 2Cnts@ZnC (62.5%; k = 0.0049 min−1) > ZnC (53.3%; k = 0.0037 min−1). Therefore, the 6Cnts@ZnC hybrid was selected as the optimal to continue photocatalytic optimization.
 | ||
| Fig. 7 The three cationic (OFL+), Zwitterionic (OFL±), and anionic (OFL−) properties of OFL.5,70 | ||
According to experimental findings, OFL breakdown has a low photocatalytic effectiveness at pH 4 (49.4%; k = 0.0036 min−1). At this stage (pH 4 < pKa1), the positive charge 6Cnts@ZnC and OFL+ face electrostatic repulsion. At pH 6 and pH 8 (pKa1 < pH < pKa2), OFL happens in a zwitterionic state, meaning it carries both positive and negative charges on the same molecule (OFL±). As a result, the adsorption capacity of OFL on 6Cnts@ZnC is increased, leading to an enhanced photocatalytic efficiency. The results showed that the photocatalytic efficiency of the OFL degradation of 6Cnts@ZnC highest at pH 8. Previous research indicates that ˙OH is the primary oxidant in an alkaline environment.69 Results of the experiments also indicate that ˙OH also a factor in the OFL breakdown of Cnts@ZnC. During this period (pH 8), the concentration of OH− grows and it reacts with photogenerated holes as shown in eqn (1) and (2), which raises the amount of ˙OH according to reaction 2 of antibiotic degradation.8
At pH 10 > pKa2, the carboxy group on the quinolone ring undergoes deprotonation, resulting in the conversion of the OFL molecule from its neutral state to a negatively charged OFL− state. This leads to a repulsive interaction between OFL− and 6Cnt@ZnC, which is also negatively charged. Furthermore, a high level of OH− may react with both ˙OH radicals and photogenerated holes (as seen in eqn (3) and (4)),71 so slowing the decomposition of OFL and leading to a decrease in photocatalytic efficiency at pH 10 (69.35%; k = 0.0056 min−1).
| h+ + OH− → ˙OH | (1) |
| ˙OH + OFL → OFL* → degradation products | (2) |
| ˙OH + OH− → H2O + O˙ | (3) |
| 4h+ + 4OH− → O2 + 2H2O | (4) |
Use the Taus formula,41 (αhν)2 = A(hν − Eg), to determine the energy of the band gap of the synthesized material. Fig. 2C shows that the band gap energy of ZnC is 3.1 V for ZnO and 2.2 eV for ZnCo2O4. The band gap energy of 6Cnst@ZnC are 2.9 and 1.78 eV, respectively. Formula calculates the potential of the conduction and valence domains.38,39
| Evb = X − Ee + 0.5 Eg | (5) |
| Ecb = Evb − Eg | (6) |
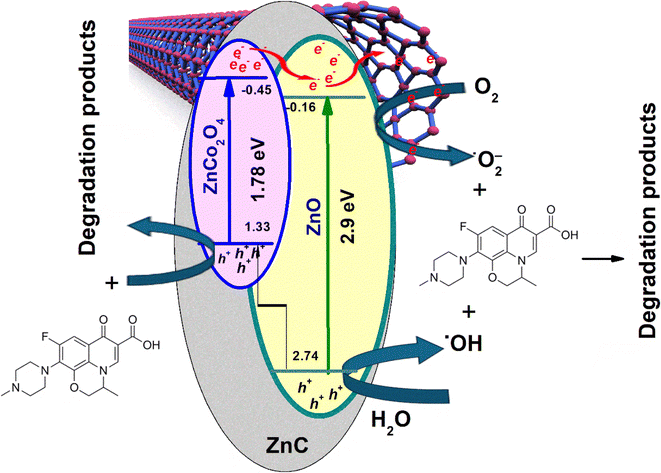
The 6Cnts@ZnC hybrid is exposed to visible light, ZnCo2O4 (Eg = 1.78 eV) is excited, generating a significant amount of photogenerated electrons and h+ pairs, whereas ZnO (Eg = 2.9 eV) can only absorb a fraction of the visible light, resulting in several fewer photogenerated electrons and h+ pairs. The Ecb of ZnO (Ecb = −0.16 eV) is higher than the reduction potential of O2/O2˙− (−0.33 eV vs. NHE), therefore, the photogenerated electrons on the CB of ZnO are unable to transform O2 to O2˙−. On the contrary, the ZnCo2O4 phase has a more negative Ecb (Ecb = −0.45 eV) the reduction potential of O2/O2˙−. As a result, the photo generated electrons on the CB of the ZnCo2O4 phase can reduce O2 to O2˙−. Additionally, these photo generated electrons can also transfer to the CB of ZnO and combine with the electrons on the CB of the ZnO phase, which then move directly to the Cnts. The large Cnts network functions as a highly effective electron trap, gathering photoexcited electrons from the CB of transported ZnO, so inhibiting the recombination of electron–hole pairs. Afterwards, electrons move towards the surface and react with the adsorbed O2 on xCnts@ZnC, leading to the creation of O2˙− radicals. These radicals have the capability to break down OFL, resulting in the production of degradation products. Alternatively, these electrons that have been stimulated by light can directly interact with OFL, leading to the creation of degradation products.
The typical oxidation potential of H2O/˙OH (+2.40 eV vs. NHE) is less than the Evb of ZnO (Evb = +2.74 eV) so the photo-generated h+ holes of ZnCo2O4 can oxidize H2O adsorbed produces a significant amount of ˙OH radicals, these ˙OH radicals decompose OFL to create degradation products. In addition, the h+ of ZnCo2O4 can directly decompose OFL to create degradation products. Furthermore, because of the differing Evb of ZnO and ZnCo2O4, a portion of the h+ in ZnO's VB migrates to ZnCo2O4's VB and combines with its h+ to directly break down OFL and produce the degradation products. The Evb of ZnCo2O4 (Evb = +1.33 eV) is less than the typical oxidation potential of H2O/˙OH, hence the h+ photo-generated hole of ZnCo2O4 is unable to oxidize H2O to make ˙OH. Based on the results mentioned previously, eqn (7)–(14) and Fig. 8 can be used to predict the OFL decomposing process of xCnts@ZnC.
| Cnts@ZnC + hν → ZnC (e−) + ZnC (h+) + Cnts | (7) |
| ZnC (e−) + O2 → O2˙− | (8) |
| ZnC (e−) + Cnts → Cnts (e−) | (9) |
| Cnts (e−) + O2 → O2˙− | (10) |
| O2˙− + OFL → degradation products | (11) |
| h+ (ZnC) +H2O → H+ + ˙OH | (12) |
| ˙OH + OFL → degradation products | (13) |
| h+ (ZnC) + OFL → degradation products | (14) |
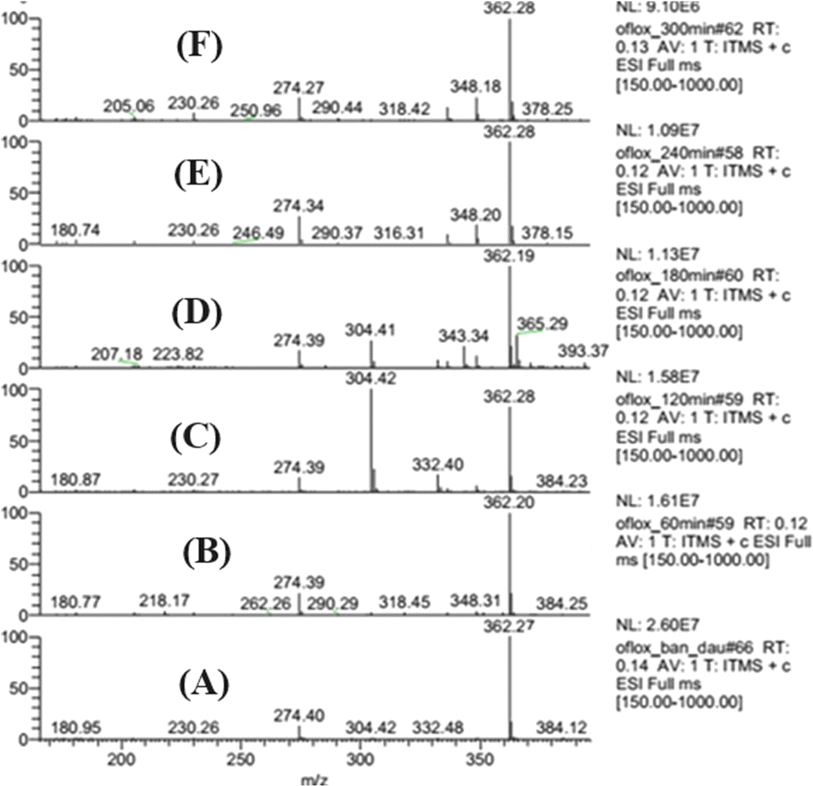
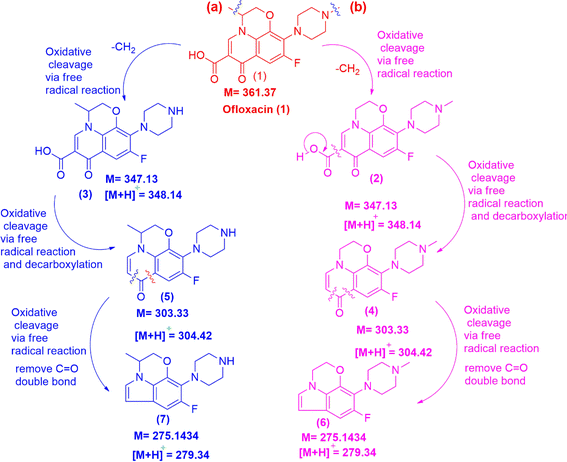
The fragmentation patterns of ion mother are depicted in Fig. 11. As shown in Fig. 11, OFL exhibits fragmentation into six stable structures, namely (2), (4), (6), route (b) as well as (3), (5), and (7), route (a) by two pathways. Compound (2) is synthesized from (1) through oxidative cleavage via a free radical reaction involving a damaged methylene group, as depicted in Fig. 11 along pathway (a). The structure (4) was formed through oxidative cleavage via free radical events and decarboxylation reactions. The chemical (6) was synthesized through oxidative cleavage via a free radical reaction, resulting in the removal of one C![[double bond, length as m-dash]](https://www.rsc.org/images/entities/char_e001.gif) O double bond and the reduction of one hydrogen molecule. The pathway (b) involves the elimination of a methylene group through oxidative cleavage via a free radical reaction, forming compound (3). Compound (5) is formed through oxidative clearing by means of a free radical reaction and subsequent decarboxylation. Compound (7) was synthesized through oxidative cleavage using a free radical reaction, resulting in the removal of one C
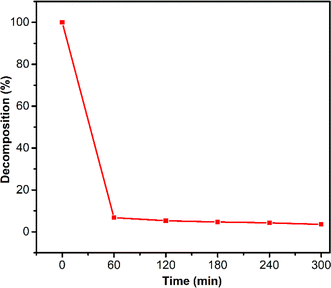
O double bond and the reduction of one hydrogen molecule. The pathway (b) involves the elimination of a methylene group through oxidative cleavage via a free radical reaction, forming compound (3). Compound (5) is formed through oxidative clearing by means of a free radical reaction and subsequent decarboxylation. Compound (7) was synthesized through oxidative cleavage using a free radical reaction, resulting in the removal of one C![[double bond, length as m-dash]](https://www.rsc.org/images/entities/char_e001.gif) O double bond and the reduction of one hydrogen molecule. The process of OFL degradation has been illustrated in Fig. 11, which is a groundbreaking proposition by us based on experimental evidence. The OFL exhibits a high degree of decomposability when subjected to a catalytic reaction for 300 min at an initial concentration of 20 ppm. Many previous titles about degradation of OFL has been conducted73–78 and our work conducted giving smaller molecule in degradation path as seen in Fig. 10, such as (6) or (7). Compound (6) or (7) is a pair of isomers that molecules are 273.31. The molecule (7) or (6) is formed by oxidative cleavage via free radical reaction that is removed one methylene group from methyl groups attached to two hetero cyclic rings of mother molecule, OFL. The transform path of OFL has some similarity structures with article at intermedia fragment ion molecule of 347.13 or compound (2) or (3) and 303.33 or molecule (4)/(5) as seen in Fig. 9 in this article and Fig. 11 at reference article via intermedia compounds.74
O double bond and the reduction of one hydrogen molecule. The process of OFL degradation has been illustrated in Fig. 11, which is a groundbreaking proposition by us based on experimental evidence. The OFL exhibits a high degree of decomposability when subjected to a catalytic reaction for 300 min at an initial concentration of 20 ppm. Many previous titles about degradation of OFL has been conducted73–78 and our work conducted giving smaller molecule in degradation path as seen in Fig. 10, such as (6) or (7). Compound (6) or (7) is a pair of isomers that molecules are 273.31. The molecule (7) or (6) is formed by oxidative cleavage via free radical reaction that is removed one methylene group from methyl groups attached to two hetero cyclic rings of mother molecule, OFL. The transform path of OFL has some similarity structures with article at intermedia fragment ion molecule of 347.13 or compound (2) or (3) and 303.33 or molecule (4)/(5) as seen in Fig. 9 in this article and Fig. 11 at reference article via intermedia compounds.74
The predictions of compounds after completing of degradation such as physiochemistry, medicinal chemistry, metabolism, excretion, toxicity, and environmental toxicity parameters that used ADMET model in medicinal chemistry of pure compound like drug such as light compound (6) in Fig. 11.24–26,79 Calculation results from ADMET model of compound (6) are indicated in Tables S.2–S.7† that reduced some tables the less relative to process the environment as this project target such as absorption, distribution, metabolism, and toxic pathway properties because they belong to medicinal pharmacy properties. As indicated in Table S.2,† the physicochemical properties of compound (6) are in ranges. Compound (6) exposed less solubility in water by log![[thin space (1/6-em)]](https://www.rsc.org/images/entities/char_2009.gif) P = 2.704 > 0 and log
P = 2.704 > 0 and log![[thin space (1/6-em)]](https://www.rsc.org/images/entities/char_2009.gif) S = −3.669 < 0. The medical chemistry of (6) are in full permission ranges and some significant parameters are Lipinski rule, Pfizer Rule, Golden Triangle are in permission domains, and it proved compound (6) has properties like drugless as seen Table S.3.† There are no alerts from medicinal chemistry parameters. As seen in Table S.4,† the properties of the drug metabolism of compound (6) indicated by enzyme inhibitors or substrate that these CYPs responsible for phase I reactions are concentrated in the liver. The metabolism parameters are CYPs in ranges that proved this compound has no effects on the liver. The excretion properties of (6) are exposed in Table S.5† and proved that compound (6) has short half-life because of the low value of T1/2. The clearance is a significant pharmacokinetic parameter that defines, together with the volume of distribution, the half-life, and thus the frequency of dosing of a drug. The CL of 6.709 is moderate dosing. The toxicity of compound (6) is indicated in Table S.6,† as seen in Table S.6,† a few parameters of compound (6) have toxicity in human body such as hepatotoxicity via H-HT value of 0.899 and drug induced lever injury by DILI value of 0.942. As exposed in Table S.7,† the properties of environmental toxicity of compound (6) are indicated that it has nontoxic in environmental site because parameters are optimal ranges. The ADMET model has proved that compound (6) is intermedia defragment that has without toxic to environment.
S = −3.669 < 0. The medical chemistry of (6) are in full permission ranges and some significant parameters are Lipinski rule, Pfizer Rule, Golden Triangle are in permission domains, and it proved compound (6) has properties like drugless as seen Table S.3.† There are no alerts from medicinal chemistry parameters. As seen in Table S.4,† the properties of the drug metabolism of compound (6) indicated by enzyme inhibitors or substrate that these CYPs responsible for phase I reactions are concentrated in the liver. The metabolism parameters are CYPs in ranges that proved this compound has no effects on the liver. The excretion properties of (6) are exposed in Table S.5† and proved that compound (6) has short half-life because of the low value of T1/2. The clearance is a significant pharmacokinetic parameter that defines, together with the volume of distribution, the half-life, and thus the frequency of dosing of a drug. The CL of 6.709 is moderate dosing. The toxicity of compound (6) is indicated in Table S.6,† as seen in Table S.6,† a few parameters of compound (6) have toxicity in human body such as hepatotoxicity via H-HT value of 0.899 and drug induced lever injury by DILI value of 0.942. As exposed in Table S.7,† the properties of environmental toxicity of compound (6) are indicated that it has nontoxic in environmental site because parameters are optimal ranges. The ADMET model has proved that compound (6) is intermedia defragment that has without toxic to environment.
4 Conclusions
Using co-precipitation and thermal methods, we were able to successfully synthesis the xCnt@ZnC hydrid. The xCnts@ZnC hydrid exhibits photocatalytic activity for OFL breakdown. The results indicated that 6Cnts@ZnC demonstrated the greatest efficacy in degrading 85.8% of OFL under visible light. The optimal parameters for this process were a catalyst mass of 1 g L−1, an OFL concentration of 20 ppm, an adsorption time of 60 minutes, visible light irradiation of 240 minutes, and pH 8. The combination of Cnts and ZnC creates the avorable conditions for efficient segregation of electrons and holes. Through their ability to capture electrons produced by conductivity, Cnts serve to prevent photogenerated electrons and holes recombination. Plus, the catalytic mechanism and intermediate stages of the OFL breakdown of xCnts@ZnC were predicted. The xCnts@ZnC hybrid breaks down the OFL solution in the visible lighting region, according to the first-level kinetic equation. It was demonstrated using the ADMET model that the small molecules produced by the OFL breakdown of the xCnts@ZnC hybrid are not environmentally hazardous. Because of its high stability, facile synthesis, and great endurance, we anticipate that xCnts@ZnC will aid in the development of photocatalytic materials in the treatment of pollution.Data availability
The data supporting this article has been included as part of the ESI.†Conflicts of interest
The authors declare that they have no known competing interests that could have appeared to influence the work reported in this paper.References
- B. Tan, Y. Fang, Q. Chen, X. Ao and Y. Cao, Opt. Mater., 2020, 110470, DOI:10.1016/j.optmat.2020.110470.
- P. Barathe, K. Kaur, S. Reddy, V. Shriram and V. Kumar, J. Hazard. Mater. Lett., 2024, 100105, DOI:10.1016/j.hazl.2024.100105.
- R. Haghniaz, A. Rabbani, F. Vajhadin, T. Khan, R. Kousar, A. R. Khan, H. Montazerian, J. Iqbal, A. Libanori, H. J. Kim and F. Wahid, J. Nanobiotechnol., 2021, 1–15, DOI:10.1186/s12951-021-00776-w.
- H. Peng, B. Pan, M. Wu, R. Liu, D. Zhang, D. Wu and B. Xing, J. Hazard. Mater., 2012, 211–212, 342–348 CrossRef CAS PubMed.
- T. Paul, M. L. MacHesky and T. J. Strathmann, Environ. Sci. Technol., 2012, 46, 11896–11904 CrossRef CAS PubMed.
- G. Zhao, J. Ding, F. Zhou, X. Chen, L. Wei, Q. Gao, K. Wang and Q. Zhao, Chem. Eng. J., 2021, 126704, DOI:10.1016/j.cej.2020.126704.
- N. H. Tran, H. Chen, M. Reinhard, F. Mao and K. Y. H. Gin, Water Res., 2016, 104, 461–472 CrossRef CAS PubMed.
- Q. Wang, P. Li, Z. Zhang, C. Jiang, K. Zuojiao, J. Liu and Y. Wang, J. Photochem. Photobiol., A, 2019, 378, 114–124 CrossRef CAS.
- T. Zeng, S. Jin, Z. Jin, S. Li, R. Zou, X. Zhang, S. Song and M. Liu, RSC Adv., 2023, 13, 14048–14059 RSC.
- M. Cheng, G. Zeng, D. Huang, C. Lai, P. Xu, C. Zhang and Y. Liu, Chem. Eng. J., 2016, 284, 582–598 CrossRef CAS.
- P. Karthikeyan and S. Meenakshi, J. Mol. Liq., 2019, 111766, DOI:10.1016/j.molliq.2019.111766.
- C. Jiehu, W. Chunlei, Z. Ming, Z. Jie, F. Li, D. Xiuhong, C. Leiming and L. Chunguang, Appl. Surf. Sci., 2020, 147564, DOI:10.1016/j.apsusc.2020.147564.
- Y. Zhu, P. Wu, S. Yang, Y. Lu, W. Li, N. Zhu, Z. Dang and Z. Huang, RSC Adv., 2016, 6, 37689–37700 RSC.
- D. Peng, Q. Jing, Z. Feng, J. Niu, X. Cheng, X. Wu, X. Zheng and X. Yuan, J. Phys. Chem. Solids, 2020, 109199, DOI:10.1016/j.jpcs.2019.109199.
- C. Wang, Z. Wang, J. Xu and Y. Nie, ACS Omega, 2021, 6, 22126–22136 CrossRef CAS PubMed.
- L. Guo, Y. Wu, P. Duan and Z. Zhang, Constr. Build. Mater., 2020, 117256, DOI:10.1016/j.conbuildmat.2019.117256.
- L. Zhang, J. Liu, H. Xiao, D. Liu, Y. Qin, H. Wu, H. Li, N. Du and W. Hou, Chem. Eng. J., 2014, 250, 1–5 CrossRef CAS.
- J. Jia, D. Li, J. Wan and X. Yu, J. Ind. Eng. Chem., 2016, 33, 162–169 CrossRef CAS.
- A. K. Rai, T. V. Thi, B. J. Paul and J. Kim, Electrochim. Acta, 2014, 146, 577–584 CrossRef CAS.
- G. Zhao, C. Li, X. Wu, J. Yu, X. Jiang, W. Hu and F. Jiao, Appl. Surf. Sci., 2018, 434, 251–259 CrossRef CAS.
- A. Shokrgozar, K. Seifpanahi-Shabani, B. Mahmoodi, N. M. Mahmoodi, F. Khorasheh and M. Baghalha, Desalin. Water Treat., 2021, 216, 389–400 CrossRef CAS.
- W. Zhang, C. Xu, E. Liu, J. Fan and X. Hu, Appl. Surf. Sci., 2020, 146039, DOI:10.1016/j.apsusc.2020.146039.
- N. T. M. Tho, D. N. N. Khanh, N. Q. Thang, Y. I. Lee and N. T. K. Phuong, Environ. Sci. Pollut. Res., 2020, 27, 11127–11137 CrossRef PubMed.
- G. Xiong, Z. Wu, J. Yi, L. Fu, Z. Yang, C. Hsieh, M. Yin, X. Zeng, C. Wu, A. Lu, X. Chen, T. Hou and D. Cao, Nucleic Acids Res., 2021, 49, W5–W14 CrossRef CAS PubMed.
- M. Bitew, T. B. Tegene Demissie, A. Belayneh, M. Endale and R. Eswaramoorthy, PLoS One, 2021, 16, e0260853 CrossRef CAS PubMed.
- Y. Wang, J. Xing, Y. Xu, N. Zhou, J. Peng, Z. Xiong, X. Liu, X. Luo, C. Luo, K. Chen, M. Zheng and H. Jiang, Q. Rev. Biophys., 2015, 48, 488–515 CrossRef PubMed.
- G. Van Vo, T.-H.-T. Nguyen, T.-P. Nguyen, T.-H.-T. Do, N.-M.-A. Tran, T.-H. Nguyen and T. Trang Nguyen, Saudi Pharm. J., 2022, 1301–1314, DOI:10.1016/j.jsps.2022.06.018.
- K. K. H. Ngo, T. K. C. Huynh, T. A. Nguyen, N. B. H. Pham, T. H. A. Nguyen, T. C. T. Nguyen, H. P. Nguyen, N. K. N. Phan, T. H. N. Nguyen, D. Ngoc-Phuong Ho, L. K. Huynh, T. Nguyen Minh An and T. K. D. Hoang, Results Chem., 2024, 101501, DOI:10.1016/j.rechem.2024.101501.
- K. M. Parida and L. Mohapatra, Chem. Eng. J., 2012, 179, 131–139 CrossRef CAS.
- J. Wang, B. Wang, Z. Wang, L. Chen, C. Gao, B. Xu, Z. Jia and G. Wu, J. Colloid Interface Sci., 2021, 586, 479–490 CrossRef CAS PubMed.
- X. Wang, P. Wu, Z. Zhao, L. Sun, Q. Deng, Z. Yin and X. Chen, J. Mater. Sci.: Mater. Electron., 2020, 31, 4895–4904 CrossRef CAS.
- N. Sharma, Z. Pap, S. Garg and K. Hernádi, Appl. Surf. Sci., 2019, 143536, DOI:10.1016/j.apsusc.2019.143536.
- N. Sharma, B. Veres, P. Dhiman, Z. Pap, K. Baán, S. Garg and K. Hernadi, RSC Adv., 2021, 11, 37426–37435 RSC.
- W. Ma, N. Wang, L. Yang, Y. Lu, S. Li, Y. Hou, K. Cao and Y. Yan, J. Mater. Sci.: Mater. Electron., 2019, 30, 20432–20442 CrossRef CAS.
- Y. Zhou, S. Feng, C. Ma, W. Wu, Z. Ye, X. Dai, Y. Wang and X. Cao, Ceram. Int., 2022, 31334–31343, DOI:10.1016/j.ceramint.2022.06.315.
- H. Y. Phin, Y. T. Ong and J. C. Sin, J. Environ. Chem. Eng., 2020, 103222, DOI:10.1016/j.jece.2019.103222.
- B. R. C. de Menezes, F. V. Ferreira, B. C. Silva, E. A. N. Simonetti, T. M. Bastos, L. S. Cividanes and G. P. Thim, J. Mater. Sci., 2018, 53, 14311–14327 CrossRef CAS.
- N. T. M. Tho, B. T. Huy, D. N. N. Khanh, H. N. N. Ha, V. Q. Huy, N. T. T. Vy, D. M. Huy, D. P. Dat and N. T. K. Phuong, Korean J. Chem. Eng., 2018, 35, 2442–2451 CrossRef CAS.
- H. Zhang, Y. Gao, S. Meng, Z. Wang, P. Wang, Z. Wang, C. Qiu, S. Chen, B. Weng and Y. M. Zheng, Advanced Science, 2024, 2400099, DOI:10.1002/advs.202400099.
- I. Ahmad, M. S. Akhtar, E. Ahmed and M. Ahmad, Sep. Purif. Technol., 2020, 116892, DOI:10.1016/j.seppur.2020.116892.
- A. C. Swathi and M. Chandran, J. Appl. Phys., 2023, 133(20) DOI:10.1063/5.0145796.
- F. Liu, S. Dong, Z. Zhang, X. Li, X. Dai, Y. Xin, X. Wang, K. Liu, Z. Yuan and Z. Zheng, RSC Adv., 2019, 9, 25750–25761 RSC.
- L. K. Babu, H. S. Rao, P. N. R. Kishore, N. L. Reddy, M. V. Sankar and Y. V. R. Reddy, J. Mater. Res., 2023, 38, 3301–3315, DOI:10.1557/s43578-023-01054-1.
- S. Majumder, N. D. Quang, N. M. Hung, N. D. Chinh, C. Kim and D. Kim, J. Colloid Interface Sci., 2021, 599, 453–466 CrossRef CAS PubMed.
- W. Liu, J. Zhou and J. Zhou, J. Mater. Sci., 2019, 54, 3294–3308 CrossRef CAS.
- S. M. Lam, J. C. Sin, A. Z. Abdullah and A. R. Mohamed, Fullerenes, Nanotubes Carbon Nanostruct., 2014, 22, 471–509 CrossRef CAS.
- A. Habibi-Yangjeh, M. Pirhashemi and S. Ghosh, J. Alloys Compd., 2020, 154229, DOI:10.1016/j.jallcom.2020.154229.
- S. Hemamalini and R. Manimekalai, Bull. Mater. Sci., 2024, 7961–7977, DOI:10.1007/s12034-021-02453-yS.
- K. Yang, Y. Zhang, C. Meng, F. F. Cao, X. Chen, X. Fu, W. Dai and C. Yu, Appl. Surf. Sci., 2017, 391, 635–644 CrossRef CAS.
- Y. Wang, X. Zhu, D. Liu, H. Tang, G. Luo, K. Tu, Z. Z. Xie, J. Lei, J. Li, X. Li and D. Qu, J. Appl. Electrochem., 2019, 49, 1103–1112 CrossRef CAS.
- L. Wang, X. Zhu, K. Tu, D. Liu, H. Tang, J. Li, X. Li, Z. zhong Xie and D. Qu, Electrochim. Acta, 2020, 136726, DOI:10.1016/j.electacta.2020.136726.
- Y. Wang, X. Zhu, D. Liu, H. Tang, G. Luo, K. Tu, Z. Z. Xie, J. Lei, J. Li, X. Li and D. Qu, J. Appl. Electrochem., 2019, 49, 1103–1112 CrossRef.
- X. Li, Y. Li, X. Guo and Z. Jin, Front. Chem. Sci. Eng., 2023, 17, 606–616 CrossRef CAS.
- W. Zhang, C. Xu, E. Liu, J. Fan and X. Hu, Appl. Surf. Sci., 2020, 146039, DOI:10.1016/j.apsusc.2020.146039.
- K. Yang, Y. Zhang, C. Meng, F. F. Cao, X. Chen, X. Fu, W. Dai and C. Yu, Appl. Surf. Sci., 2017, 391, 635–644 CrossRef CAS.
- T. V. M. Sreekanth, R. Ramaraghavulu, S. V. Prabhakar Vattikuti, J. Shim and K. Yoo, Mater. Lett., 2019, 253, 450–453 CrossRef CAS.
- Y. Bi, H. Fan, C. Hu, R. Wang, L. Niu, G. Wen and L. Qin, RSC Adv., 2024, 14, 11734–11745 RSC.
- H. Huang, J. Zhao, H. Guo, B. Weng, H. Zhang, R. A. Saha, M. Zhang, F. Lai, Y. Zhou, R. Z. Juan, P. C. Chen, S. Wang, J. A. Steele, F. Zhong, T. Liu, J. Hofkens, Y. M. Zheng, J. Long and M. B. J. Roeffaers, Adv. Mater., 2024, 2313209, DOI:10.1002/adma.202313209.
- X. Tang, M. Liang, Y. Zhang, W. Sun and Y. Wang, Dalton Trans., 2019, 48, 4413–4419 RSC.
- N. T. M. Tho, B. T. Huy, D. N. N. Khanh, H. N. N. Ha, V. Q. Huy, N. T. T. Vy, D. M. Huy, D. P. Dat and N. T. K. Phuong, Korean J. Chem. Eng., 2018, 35, 2442–2451 CrossRef CAS.
- N. Sharma, Z. Pap, I. Székely, M. Focsan, G. Karacs, Z. Nemeth, S. Garg and K. Hernadi, Appl. Surf. Sci., 2021, 150605, DOI:10.1016/j.apsusc.2021.150605.
- E. M. S. Azzam, N. A. Fathy, S. M. El-Khouly and R. M. Sami, J. Water Proc. Eng., 2019, 28, 311–321 CrossRef.
- Y. Huang, R. Li, D. Chen, X. Hu, P. Chen, Z. Chen and D. Li, Catalysts, 2018, 151, DOI:10.3390/catal8040151.
- L. Tian, L. Ye, J. Liu and L. Zan, Catal. Commun., 2012, 17, 99–103 CrossRef CAS.
- B. T. Huy, D. S. Paeng, C. Thi Bich Thao, N. T. Kim Phuong and Y. I. Lee, Arabian J. Chem., 2020, 13, 3790–3800 CrossRef.
- M. S. Khan, M. F. García, M. Javed, A. Kubacka, U. Caudillo-Flores, S. A. Halim, A. Khan, A. Al-Harrasi and N. Riaz, ACS Omega, 2021, 6, 26108–26118 CrossRef CAS PubMed.
- V. D. Doan, T. T. N. Nguyen, H. A. Le Pham, T. L. H. Nguyen, O. E. Lebedeva, H. P. Dang, A. T. Nguyen, V. A. Tran and V. T. Le, J. Mol. Liq., 2024, 124261, DOI:10.1016/j.molliq.2024.124261.
- M. F. Hanafi and N. Sapawe, in Materials Today: Proceedings, Elsevier Ltd, 2020, vol. 31, pp. 318–320 Search PubMed.
- E. Hapeshi, I. Fotiou and D. Fatta-Kassinos, Chem. Eng. J., 2013, 224, 96–105 CrossRef CAS.
- Q. Wang, B. Wang, Y. Ma and S. Xing, Chem. Eng. J., 2018, 354, 473–480 CrossRef CAS.
- Q. Wang, P. Li, Z. Zhang, C. Jiang, K. Zuojiao, J. Liu and Y. Wang, J. Photochem. Photobiol., A, 2019, 378, 114–124 CrossRef CAS.
- B. Weng, K. Q. Lu, Z. Tang, H. M. Chen and Y. J. Xu, Nat. Commun., 2018, 1543, DOI:10.1038/s41467-018-04020-2.
- I. Michael, E. Hapeshi, J. Aceña, S. Perez, M. Petrović, A. Zapata, D. Barceló, S. Malato and D. Fatta-Kassinos, Sci. Total Environ., 2013, 461–462, 39–48 CrossRef CAS PubMed.
- G. Zhao, J. Ding, F. Zhou, X. Chen, L. Wei, Q. Gao, K. Wang and Q. Zhao, Chem. Eng. J., 2021, 126704, DOI:10.1016/j.cej.2020.126704.
- H. Guo, Z. Li, S. Lin, D. Li, N. Jiang, H. Wang, J. Han and J. Li, Chemosphere, 2021, 129089, DOI:10.1016/j.chemosphere.2020.129089.
- E. Hapeshi, I. Fotiou and D. Fatta-Kassinos, Chem. Eng. J., 2013, 224, 96–105 CrossRef CAS.
- Q. Wang, P. Li, Z. Zhang, C. Jiang, K. Zuojiao, J. Liu and Y. Wang, J. Photochem. Photobiol., A, 2019, 378, 114–124 CrossRef CAS.
- Q. Wang, B. Wang, Y. Ma and S. Xing, Chem. Eng. J., 2018, 354, 473–480 CrossRef CAS.
- C. A. Lipinski, F. Lombardo, B. W. Dominy and P. J. Feeney, Adv. Drug Delivery Rev., 2012, 64, 4–17 CrossRef.
Footnote |
| † Electronic supplementary information (ESI) available. See DOI: https://doi.org/10.1039/d4ra06153e |
| This journal is © The Royal Society of Chemistry 2024 |

