 Open Access Article
Selective and naked eye colorimetric detection of creatinine through aptamer-based target-induced passivation of gold nanoparticles†
Chiranjit Das a,
Jeethu Raveendranb,
Jagadeesh Bayry
 b and
P. Abdul Rasheed
 *ba
*ba
aDepartment of Chemistry, Indian Institute of Technology Palakkad, Palakkad, Kerala, India-678623. E-mail: abdulrasheed@iitpkd.ac.in
bDepartment of Biological Sciences and Engineering, Indian Institute of Technology Palakkad, Palakkad, Kerala, India-678623
First published on 24th October 2024
Abstract
We report a simple naked eye colorimetric detection assay developed for the small molecule creatinine using the surface passivation of gold nanoparticles (AuNPs) which is conjugated with a creatinine binding aptamer. The selective binding of creatinine to aptamer sequences causes a decrease in the catalytic activity of AuNPs, and the color change time of the 4-nitrophenol reduction was used for the quantitative colorimetric detection of creatinine. Herein, the surfaces of AuNPs acted as the catalyst for the reduction of 4-nitrophenol (yellow) to 4-aminophenol (colorless), and the passivation with creatinine bound aptamer sequences delayed the reduction. The developed assay was able to detect creatinine in a linear range of 2–20 mM with a limit of detection of 0.87 mM. The developed colorimetric assay was very selective and repeatable and could detect creatinine in the presence of interfering biomolecules. Moreover, the assay showed excellent results for the analysis of creatinine in artificial urine samples. The developed assay can be used as a point of care (POC) device for the naked eye detection of creatinine within few minutes without any instrument support.
1. Introduction
Chronic kidney disease (CKD) affects about 13% of the global population, and millions of people die every year as a result of a lack of access to economical treatment.1 Excessive accumulation of electrolytes and waste products in the human body can pose significant health risks in the case of advanced chronic renal diseases. Diabetes and high blood pressure are the major causes of CKD, along with glomerulonephritis (damage to the glomeruli), recurrent kidney infections and others.2 The most used biomarker for the screening and diagnosis of CKD is creatinine, and it can be excreted from blood into sweat, saliva and urine.3,4 The kidneys use glomerular ultrafiltration to remove creatinine from blood plasma and maintain body homeostasis. However, declined kidney function leads to a corresponding increase in creatinine levels. The normal range of creatinine levels in human urine is 6–19 mM per day, and kidney dysfunction can alter these values.5,6CKD can be diagnosed using many tests, including blood, urine, routine check-ups and biopsies. Some of the common methods/techniques used for the detection of creatinine are liquid chromatography-mass spectrometry,7 electrochemical methods,8,9 high performance liquid chromatography (HPLC),10,11 spectrophotometry12 and others. Although these tests are extensively used as diagnostic methods, they have several limitations as they require costly equipment and experienced technicians and are time-consuming. Most hospitals do not have access to these testing facilities round the clock. Hence, affordable and accurate diagnosis of kidney diseases, even in remote settings, is highly essential.
Optical sensors offer several key benefits, including high sensitivity, rapid response times, and non-invasive detection, making them particularly advantageous in clinical monitoring.13 Unlike electrochemical sensors, optical sensing platforms can often operate without direct contact with the sample, reducing the risk of contamination and improving their applicability in sensitive environments, such as biological systems.14,15 Among the optical sensors, colorimetric approaches for studying biomolecules are becoming increasingly popular owing to their cost-effectiveness, excellent sensitivity, specificity, and visibility to the naked eye.16 Gold nanoparticles (AuNPs) are one of the most investigated nanomaterials for colorimetric biosensing applications owing to their easy fabrication, outstanding biocompatibility, promising chemical stability, and versatile optical properties.17 In addition, AuNPs show high extinction coefficients and size-dependent surface plasmon resonance (SPR) properties, which enable them to be used in colorimetric detection methods.18 One of the unique visual characteristics of AuNPs is the obvious change in the color from red to blue during aggregation, and this color variation is very sensitive and could serve as a signal in optical biosensors.19 By utilizing these properties, AuNPs have also been extensively explored for the optical detection of DNA,20,21 proteins,22–24 and tiny molecules.25,26 Furthermore, AuNPs have garnered extensive attention and research across various domains, such as healthcare,27,28 agriculture,29 and the food industry.30
There are several reports on optical biosensors for creatinine using AuNPs as the detection probes.31–33 Xia et al. used citrate-stabilized AuNPs as a sensing platform with polyethylene glycol (PEG) as a decorator, and Hg2+ as a linker to form a stable colorimetric probe system (PEG/Hg2+-AuNPs).31 Similarly, Du et al. developed an optical sensor for creatinine using the coordination system of adenosine/creatinine with Ag+ on an AuNP surface.32 A quick, easy, and affordable “switch-on/off” biosensor for the colorimetric detection of creatinine with superior sensitivity and selectivity was introduced by Chhillar et al. using Zn2+/AuNPs nanocomposite.34 In another work, Tirkey et al. developed a simple specific colorimetric and spectrophotometric sensor for detecting creatinine and utilizing citrate-capped AuNPs.35 Similarly, He et al. used citrate-capped AuNPs for the quantification of creatinine by evaluating the aggregation of AuNPs in the presence of creatinine.36
Specific molecules with binding affinity to the analyte, such as peptides and aptamers, can be used for the development of optical sensors.37,38 In this regard, Feng et al. used specific peptides with binding affinity to creatinine to determine creatinine present in urine.39 Here, the assay was based on the aggregation of AuNPs induced by the interaction between AuNPs and peptides in the presence of creatinine. This aggregation caused a change in the color of the solution, and using this assay, creatinine could be detected with very low LOD (24.9 ppb) values. All these reported optical sensors for creatinine use a spectrophotometer for the quantitative detection of creatinine. However, only qualitative detection was possible in these reported sensors even though the colour change was visible to the human naked eye. To avoid the use of specific costly equipment and trained technicians, we need to develop an optical sensor that allows for the quantitative detection of creatinine with the naked human eye.
Functionalizing AuNPs with deoxyribonucleic acid (DNA) has been widely explored, and the optical properties of DNA-modified AuNPs (DNA–AuNPs) have been applied to develop colorimetric sensors with human naked eye detection capabilities.40 Considering the specific binding of DNA aptamers with target analytes, a simple and efficient colorimetric detection system for lysozyme was introduced by Kim et al. using aptamer–AuNP conjugates.38 Here, the AuNPs were modified with specific aptamers to the lysozyme, and the correlation between the catalytic properties of the AuNPs and the exposed surface area of the AuNPs for the catalytic reduction of 4-nitrophenol (4-NP) was used to sense the lysozyme. The binding of specific aptamers with lysozyme could mask the catalytic surface of the AuNPs and slow down the reduction of 4-NP. The delay in color change time (CCT) can be used for the quantitative detection of lysozyme, and the developed sensor was able to detect lysozyme with a LOD of 16 nM with the naked eye. Using a similar strategy, an optical sensor for ultrasensitive colorimetric detection of NF-κB protein at picomolar levels was introduced by Rasheed et al.41 They used the specific binding of NF-κB to a DNA aptamer sequence, and these highly selective interactions promoted the passivation of the catalytic AuNP surfaces and decreased the reduction of 4-NP. The correlation between the NF-κB concentration and the visualized color change in the reduction rate of 4-NP was used for the naked eye quantitative detection of NF-κB with a LOD of 6.39 pM. In these two reports, the authors used high molecular weight protein targets (NF-κB = 65 kDa and lysozyme = 14 kDa) to develop the colorimetric sensors that mask the surface of AuNPs. To the best of our knowledge, there are no reports demonstrating the colorimetric sensing of small molecules with less than 1 kDa molecular weight using the surface passivation strategy. Because masking of the AuNP surface obviously depends on the size of the analyte, the sensitivity of the developed sensor should be an issue if the small molecules are used for the passivation of the AuNP surface.
In this study, we develop an assay for the colorimetric detection of a small molecule, creatinine (molecular weight of 113 Da), using DNA aptamer–AuNP conjugates. An aptamer specific to creatinine was used to conjugate the AuNPs, and the surface passivation of AuNPs depends on the concentration of creatinine on the surface. Consequently, the color change time (CCT) was delayed with respect to the concentration of creatinine, and this CCT of 4-NP reduction was used for the colorimetric detection of creatinine with our naked eye. To the best of our knowledge, this is the first report that comprehensively examined the naked eye detection of small molecules, especially creatinine, using the specific aptamer to conjugate the AuNPs. The simplicity, selectivity, and affordability of the proposed assay make it suitable for point of care (POC) applications for the quantitative detection of small molecules.
2. Experimental section
2.1. Materials
Sodium borohydride (NaBH4), 4-nitrophenol (4-NP), Tween 20, trisodium citrate dihydrate, sodium chloride (NaCl) and potassium chloride (KCl) were purchased from NICE Chemicals Private Ltd. (Kochi, Kerala, India). Creatinine was purchased from MyBioSource (SanDiego, USA). urea, uric acid, glucose, gold(III) chloride trihydrate (HAuCl4·3H2O) and tris(2-carboxyethyl)phosphine (TCEP) were purchased from Sigma-Aldrich (St. Louis, USA). Milli-Q water was used throughout the experiments (ELGA PURELAB Quest UV, 18.2 MΩ). A 0.1 M phosphate buffer (PB) solution was prepared by dissolving di-sodium hydrogen phosphate anhydrous and sodium dihydrogen phosphate monohydrate in Milli-Q water. DNA aptamer oligonucleotide sequences were purchased from Barcode Biosciences, India. The single stranded DNA (ssDNA) aptamer used for the study is 5′-thiol CGACGGTGGCCTATTAAATAGCTTTAGTTTAAGAAAAGTAATAGGGGGTGTCG-3′.42 The ssDNA is denoted as DNA afterwards in the manuscript for simplicity.2.2. AuNP synthesis
The AuNPs were synthesized using a procedure reported previously.41,43 Initially, 50 mL aqueous solution containing 0.254 mM of HAuCl4·3H2O was vigorously stirred and boiled. Subsequently, 38.8 mM of trisodium citrate solution (0.94 mL) was added quickly. The solution transitioned from light yellow to wine red. Following the change in color, the reaction mixture was continuously boiled for an additional 5 min before gradually cooling to room temperature. The AuNPs were purified by centrifugation at 14![[thin space (1/6-em)]](https://www.rsc.org/images/entities/char_2009.gif) 000 rpm for 15 min, followed by storing in the refrigerator until further use.
000 rpm for 15 min, followed by storing in the refrigerator until further use.
2.3. Synthesis of DNA–AuNPs
Initially, 5 μL of concentrated TCEP was used to deprotect the monothiol-modified DNA aptamer strands (1 μM, 0.1 mL). Subsequently, the 0.1 mL AuNP solution was mixed with the deprotected DNA aptamer, followed by buffering to a pH of 7.4 and salting (0.15 M NaCl and 0.01% Tween 20). The final reaction mixture was incubated for 5 h at room temperature to obtain the DNA–AuNPs. The purified DNA–AuNPs were obtained by centrifugation for 25 min at 15![[thin space (1/6-em)]](https://www.rsc.org/images/entities/char_2009.gif) 000 rpm, followed by redispersion in a buffer solution containing 0.15 M NaCl, 0.01% Tween 20 and 100 mM phosphate buffer (PB) at pH 7.4. UV-visible spectra of AuNP and DNA–AuNP conjugates were obtained using the BioTek EPOCH2NS instrument (Agilent Technologies, USA) in the range of 250–700 nm.
000 rpm, followed by redispersion in a buffer solution containing 0.15 M NaCl, 0.01% Tween 20 and 100 mM phosphate buffer (PB) at pH 7.4. UV-visible spectra of AuNP and DNA–AuNP conjugates were obtained using the BioTek EPOCH2NS instrument (Agilent Technologies, USA) in the range of 250–700 nm.
2.4. Detection of creatinine
The DNA–AuNP solution (0.1 mL, 1.5 nM) was mixed with a 0.1 mL solution of creatinine prepared in 0.1 M PB solution, and the mixture was incubated for 2 h at room temperature. The mixture was then mixed with a 4-NP solution (0.2 mL, 0.01 M), to which a freshly made NaBH4 solution (0.2 mL, 0.25 M) was added. The color-change time (CCT) to change the color from yellow to colorless was noted with different concentrations of creatinine. The concentration of creatinine was changed from 2 to 20 mM to plot CCT vs. the concentration of creatinine. Common interfering biomolecules, such as NaCl, KCl, urea, uric acid and glucose, were added to the assay in place of creatinine, and the CCT was measured to investigate the selectivity of the assay. Artificial urine was prepared as per protocol reported earlier44 by mixing urea, uric acid, KCl, NaCl, CaCl2, Na3C6H5O7·2H2O, NH4Cl, K2C2O4·7H2O, NaH2PO4·2H2O and Na2HPO4·2H2O as per the reported protocol. The components are dissolved in 100 mL of double-distilled water using a magnetic stirrer at room temperature. The artificial urine samples were diluted with PB solution (in the ratio of 1![[thin space (1/6-em)]](https://www.rsc.org/images/entities/char_2009.gif) :
:![[thin space (1/6-em)]](https://www.rsc.org/images/entities/char_2009.gif) 20), spiked with known concentrations of creatinine and used for the real sample analysis.
20), spiked with known concentrations of creatinine and used for the real sample analysis.
3. Results and discussion
3.1. Characterization of AuNPs
The addition of sodium citrate to the gold salt solution under boiling conditions changes the color of the solution from pale yellow to wine red, signifying the formation of AuNPs via trisodium citrate reduction. The modification of AuNPs with creatinine specific binding DNA aptamer sequence was performed by adding AuNPs and DNA aptamer solutions, followed by incubation for 5 h at room temperature. The DNA–AuNPs were formed through Au–S interaction between the thiol-modified aptamer and AuNPs and the DNA aptamer-modified AuNPs were denoted as DNA–AuNPs. The SEM images of the AuNPs and DNA–AuNPs are depicted in Fig. S1.† The presence of spherical AuNPs of size 10–15 nm was confirmed with SEM images. In the SEM image of DNA–AuNPs, a film-like layer was found covering the spherical AuNPs, and this may have contributed to the AuNP surface covered in aptamer via the thiol linkage. This analysis was further validated by the elemental composition of DNA–AuNP and AuNPs with EDS (Fig. S2†). Additionally, the presence of sulfur in DNA–AuNP indicates the presence of a thiol group in the sample, which in turn indicates the formation of aptamer-modified AuNPs. The TEM images of AuNPs and DNA–AuNPs are illustrated in Fig. 1(a) and (b), which shows that the presence of spherical particles of size ranges from 10 to 15 nm.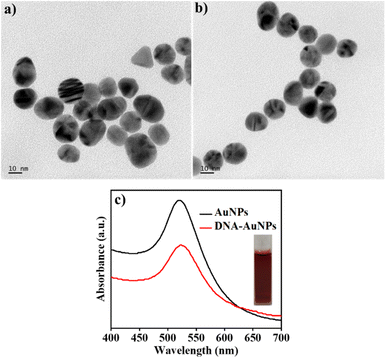 | ||
| Fig. 1 TEM images of (a) AuNPs and (b) DNA–AuNPs. The scale bar corresponds to 10 nm. (c) UV-visible spectra of AuNPs and DNA–AuNPs. | ||
The synthesized AuNPs were further characterized by UV-visible spectroscopy, which showed an absorption peak obtained at 521 nm (Fig. 1(c)), thus confirming the formation of AuNPs. The modification of AuNPs with creatinine specific binding DNA aptamer sequence was done by adding AuNPs and DNA aptamer solutions, followed by incubation for 5 h at room temperature. The DNA aptamer-modified AuNPs were denoted as DNA–AuNPs, and the absorption peak shifted to 523 nm, which confirmed the modification of aptamer DNA on the AuNPs. The FTIR spectra of DNA, AuNPs and DNA–AuNPs are shown in Fig. S3.† The FTIR spectra of AuNP show a peak at 1632 cm−1 corresponding to the anti-symmetric stretching of the carboxyl group in the capped citrate, and a broad peak in the range of 3200–3350 cm−1 represents the vibration of hydroxyl groups.45 The FTIR spectra of DNA also show a peak at 1634 cm−1, which can be attributed to O![[double bond, length as m-dash]](https://www.rsc.org/images/entities/char_e001.gif) C thymine and adenine vibrations.46 In addition, a peak at 3267 cm−1 can be attributed to the stretching vibrations of OH and NH bonds of the amino acids.46 Additionally, a peak at approximately 2400 cm−1 in the DNA can be assigned to the presence of thiol modification in the DNA.47,48 The FTIR spectra of DNA–AuNP show the presence of characteristic peaks of DNA and AuNPs, confirming the formation of DNA–AuNPs.
C thymine and adenine vibrations.46 In addition, a peak at 3267 cm−1 can be attributed to the stretching vibrations of OH and NH bonds of the amino acids.46 Additionally, a peak at approximately 2400 cm−1 in the DNA can be assigned to the presence of thiol modification in the DNA.47,48 The FTIR spectra of DNA–AuNP show the presence of characteristic peaks of DNA and AuNPs, confirming the formation of DNA–AuNPs.
3.2. AuNP-induced catalytic reduction of 4-NP
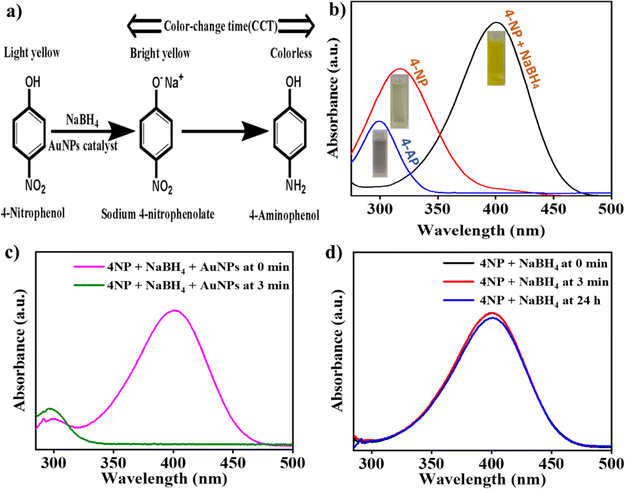
A schematic diagram showing the reduction reaction of 4-NP converted to sodium 4-nitrophenolate ion and then into 4-aminophenol (4-AP) is shown in Fig. 2(a). Under neutral conditions, 4-NP displayed an absorption peak at 317 nm, and the peak shifted to 400 nm after the addition of an aqueous NaBH4 solution due to the generation of sodium 4-nitrophenolate ion, as shown in Fig. 2(b). The absorption peak at 400 nm was diminished within few min in the presence of AuNPs, and a new peak at 299 nm was formed, which was associated with the formation of 4-AP. In addition, the complete disappearance of the peak at 400 nm further indicated a reduction of 4-NP to 4-AP. The surface of AuNPs could act as a catalyst for this reaction, which was indicated by the rapid color change in the presence of AuNPs in the reaction mixture. The UV-vis spectra showing the rapid reduction in the presence of AuNPs are depicted in Fig. 2(c). The CCT of the reaction was only few min in the presence of AuNPs under optimized conditions with a complete reduction of 4-NP, as evidenced by the disappearance of the peak at 400 nm. However, in the absence of AuNPs, it took more than 24 h for the reaction to complete because there was no significant change in the absorption even after 24 h (Fig. 2(d)). This AuNP-induced reduction reaction can be visualized by the change in the color of the solution from yellow to colorless, and the time required for the color change to colorless is denoted as the color change time (CCT).3.3. Sensing mechanism
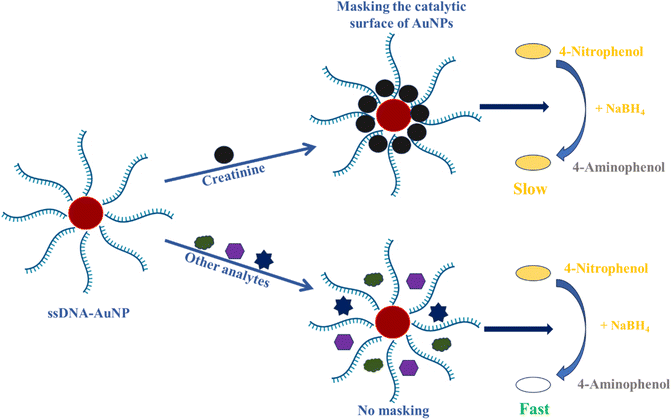
It was found that the AuNP-induced catalytic reduction of 4-NP to 4-AP within few min and the surface of AuNPs acted as the catalyst for the reduction. It is assumed that if the surfaces of AuNPs are passivated, there would be a delay in the reduction reaction time, which depends on the coverage strength of the surface masking. To prove this, the AuNPs were modified with creatinine aptamers so that the creatinine binds to the aptamer and blocks the catalytic surface of the AuNPs, leading to delayed CCT. The delaying of CCT is proportional to the concentration of creatinine present in the reaction mixture, as the coverage strength improves with increased creatinine concentration. The schematic showing the sensing mechanism is illustrated in Scheme 1. The analytes other than creatinine do not bind to the creatinine aptamer and hence no masking of the catalytic surface of AuNPs. Consequently, we observed a rapid color change in the reaction mixture.3.4. Optimization of various parameters
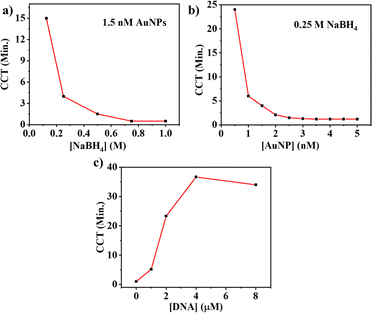
The reaction conditions were optimized by varying the concentrations of NaBH4, AuNPs, and DNA aptamers. The impact of NaBH4 was assessed by varying the concentration of NaBH4 from 0.125 to 1 M in the presence of 1.5 nM AuNPs and 0.01 M 4-NP (Fig. 3(a)). Because NaBH4 acts as a reducing agent, the reduction reaction fastens with the increased concentration of NaBH4, and hence the CCT was inversely correlated with the NaBH4 concentration. The reaction was found to be very fast at higher concentrations (0.75 and 1 M) of NaBH4, and it was difficult to distinguish the CCT at these higher concentrations. The reaction was completed in 1.5 min with 0.5 M NaBH4, and the reaction was completed in around 4 min with 0.25 M NaBH4. Hence, the 0.25 M NaBH4 was taken as the optimum concentration of the NaBH4 for further experiments.To optimize the catalyst concentration, the concentration of AuNPs was altered between 0.5 and 5 nM by keeping 0.25 M NaBH4 and 0.01 M 4-NP in the reaction. It was found that a higher concentration of AuNPs led to a faster reaction as it provided more catalytic surfaces, which indicated faster color change. The color change was not distinguishable with an AuNP concentration of 2 nM or higher, as depicted in Fig. 3(b). The CCT with 1.5 nM of AuNPs was found at around 4 min, and it was taken as the optimum concentration of AuNPs.
The optimization of the DNA aptamer concentration was also carried out by varying the aptamer concentration from 0 to 8 μM. The optimum concentrations of 0.25 M NaBH4 and 1.5 nM AuNPs were used for this optimization analysis by keeping the concentration of 4-NP at 0.01 M. The CCT was increased with increasing concentrations of DNA aptamer because a higher DNA concentration resulted in higher passivation of the surface of AuNPs. The CCT was found to be around 5 min at 1 μM DNA aptamer, and the CCT remained almost unchanged after the concentration of 4 μM of DNA aptamer, as shown in Fig. 3(c). Hence, the optimum concentration of DNA was selected as 1 μM because it gave a color change of around 5 min. Based on these optimization experiments, subsequent experiments were conducted using 0.25 M of NaBH4, 1.5 nM AuNPs and 1 μM DNA aptamer in the reaction mixture.
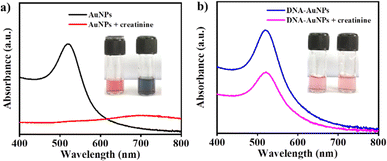
To validate the conjugation of DNA on the surface of AuNPs, we evaluated the interaction between creatinine with bare AuNPs and DNA–AuNPs. When creatinine interacts with bare AuNPs, aggregation occurs and the color of AuNPs changes from wine red to blue, as shown in Fig. 4(a). The citrate-reduced AuNPs give a significant negative charge to the AuNPs, which attract the positively charged creatinine molecules.35 This binding process neutralizes the overall charges on the particles and diminishes the distance between them, which results in aggregation. However, in the presence of a DNA aptamer on the surface of AuNPs, creatinine binds to the aptamer on the surface of AuNPs so that there is no direct interaction with AuNPs and no aggregation; hence, AuNPs remain stable with a wine red color, as shown in Fig. 4(b). This result confirmed the binding of DNA aptamer on the surface of AuNPs.
3.5. Creatinine detection
To develop the proposed assay sensor, the DNA–AuNPs were incubated with creatinine with varying concentrations for 2 h, followed by adding an aqueous solution of 4-NP and NaBH4 to evaluate the catalytic reduction of 4-NP to 4-AP. The CCT of the reaction was noted with varying concentrations of creatinine from 0 to 20 mM. It was found that the CCT increased with enhanced creatinine concentration as the surface passivation of AuNPs increased with higher concentrations of creatinine. Fig. 5(a) depicts the calibration curve of the system, correlating the CCT with creatinine concentration ranging from 2 to 20 mM. As shown in this figure, a significant difference in the CCT compared to the control was observed even for the 2 mM creatinine concentration. The corresponding photographs of the reaction mixture after particular time intervals are depicted in Fig. 5(b). The color of the mixture turned colorless after 5 min for the control samples, and this color change was delayed in a concentration-dependent manner with increasing concentrations of creatinine. However, almost all the reaction mixtures changed their color after 8 min except for the highest few concentrations, confirming that the catalytic reaction was almost completed for a higher concentration of up to 20 mM. The capability of the assay for the quantitative detection of creatinine at higher concentrations was evaluated using 20–100 mM creatinine concentrations. The calibration plot between CCT versus the concentration of creatinine and the corresponding photographs of the reaction mixtures at different time intervals are illustrated in Fig. S4.† As shown in Fig. S4,† it is confirmed that the developed assay can be used to detect creatinine at higher concentrations of up to 100 mM.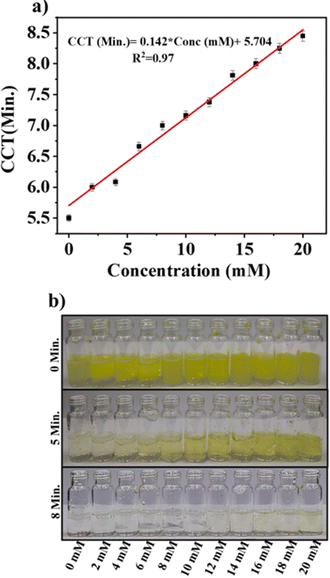 | ||
| Fig. 5 (a) The CCT versus concentration of creatinine of the developed assay with varying concentrations from 0 to 20 mM. (b) Photographs capturing the reaction mixtures at 0, 5, and 8 min. | ||
The calibration plot was fitted linearly with a calibration equation of CCT (min) = 0.142 × Conc. (mM) + 5.704, with an R2 value of 0.97. The limit of detection (LOD) was calculated using the equation LOD = 3 × σb/m, where σb for six blanks (which was found to be 0.041) as 0.87 mM. The LOD obtained for the developed assay sensor was compared with other optical sensors developed for the detection of creatinine (Table 1). It is evident from Table 1 that the developed assay sensor provided satisfactory and consistent results for the detection of creatinine levels. The LOD of 0.87 mM obtained for the sensor is significantly lower than that typically observed in physiological ranges. The LOD could be minimized by further optimizing the concentration of various parameters, including the concentrations of NaBH4, AuNPs, DNA aptamer and 4-NP. Another important feature of the developed sensor is naked eye detection, in which creatinine levels can be detected quantitatively with the human eye without using any instruments. This capability holds significant clinical importance in terms of point of care diagnosis with a substantial reduction in process costs and avoiding several limitations associated with conventional methods.
| Nanomaterial | Method | Linear range | LOD | Ref. |
|---|---|---|---|---|
| Citrate capped-AuNPs | UV-visible spectrophotometry | 26.5–70.7 μM | 26.5 μM | 35 |
| Citrate-stabilized AuNPs | UV-visible spectrophotometry | 0.1–20 mM | 80 μM | 36 |
| PVP-coated and PVA-coated AgNPs | UV-visible spectrophotometry | 0.03–1 mg dl−1 and 0.01–1 mg dl−1 | 0.024 mg dl−1 and 0.014 mg dl−1 | 49 |
| Citrate-capped AgNPs | UV-visible spectrophotometry | 0–4.2 μM | 66 nM | 50 |
| Gluconic acid-stabilized AgNPs | UV-visible spectrophotometry | 0.3–50 nM | 0.2 nM | 51 |
| L-Cysteine stabilized CuNPs | UV-visible spectrophotometry | 0.333–5.33 μM | 0.454 nM | 52 |
| Zn2+ AuNPs-based biosensor | UV-visible spectrophotometry | 0.0001–0.005 mg mL−1 | 2 μg mL−1 | 34 |
| DNA aptamer–AuNP conjugates | Naked eye detection | 2–20 mM | 0.87 mM | Our work |
3.6. Selectivity and reproducibility of the assay sensor
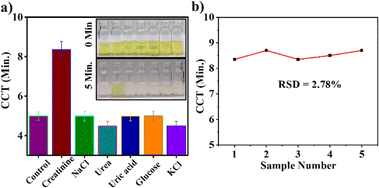
The selectivity of the developed assay was assessed by introducing various coexisting interfering molecules (NaCl: 74.09 mM, KCl: 46.81 mM, urea: 300 mM, uric acid: 2.3 mM, glucose: 5 mM) in place of creatinine. The results of the selectivity experiment are shown in Fig. 6(a), which demonstrate that only creatinine binds to the DNA–AuNPs, while there is no interaction between interfering biomolecules and DNA–AuNP. This was confirmed by the delayed CCT only in the presence of creatinine, and the CCT was almost similar to the control (in the absence of creatinine) for all other interfering molecules. The color change occurred quickly with interfering molecules due to the lack of passivation of the AuNP surfaces as there was no interaction between interfering biomolecules and DNA–AuNP. Hence, the developed sensor was found to be highly selective to creatinine in the presence of interfering molecules with concentrations similar to physiological levels. To assess the reproducibility of the sensor, five independent assays were conducted with 20 mM creatinine under optimum conditions, and the CCT was observed. The observed CCT was approximately 8 min in all the experiments with an RSD value of 2.78%. This indicates that the developed assay is highly reproducible (Fig. 6(b)).3.7. Real sample analysis
The practical application of the developed assay was also tested with artificial urine samples after spiking the known concentrations of creatinine. The artificial urine samples were diluted with PB solution (in a ratio of 1![[thin space (1/6-em)]](https://www.rsc.org/images/entities/char_2009.gif) :
:![[thin space (1/6-em)]](https://www.rsc.org/images/entities/char_2009.gif) 20) before spiking the creatinine, and the CCT assay was observed at two different concentrations of creatinine (10 mM and 20 mM). The recovery results from the real sample analysis are presented in Table 2, which showed an 89–107% recovery for creatinine with a standard deviation of 0.89–4.57%. This validates the capability of the developed assay for the detection of creatinine in complex real samples.
20) before spiking the creatinine, and the CCT assay was observed at two different concentrations of creatinine (10 mM and 20 mM). The recovery results from the real sample analysis are presented in Table 2, which showed an 89–107% recovery for creatinine with a standard deviation of 0.89–4.57%. This validates the capability of the developed assay for the detection of creatinine in complex real samples.
| Sample | Spiked creatinine (mM) | Found creatinine (mM) | Recovery (%) | Standard deviation (%) |
|---|---|---|---|---|
| S1 | 10 | 9.05 | 90.5 | 0.89 |
| 10 | 9.16 | 91.6 | ||
| 10 | 8.94 | 89.4 | ||
| S2 | 20 | 19.98 | 99.9 | 4.57 |
| 20 | 19.41 | 97.05 | ||
| 20 | 21.57 | 107.85 |
4. Conclusion
We developed an easy-to-use and effective colorimetric assay that could detect creatinine with high sensitivity and selectivity with our naked eye. The catalytic activity of AuNPs along with the specific binding of DNA aptamer enables the colorimetric sensing of creatinine. The specific binding aptamer for creatinine was used to conjugate the AuNPs, and the catalytic activity of the AuNP surface decreased as the creatinine concentration increased due to an increase in the masking of the AuNP surfaces. This delayed the CCT of the reduction of 4-NP to 4-AP, and this delay in CCT was used to quantify the creatinine concentrations. The developed sensor showed a LOD of 0.87 mM with a linear range of 2–20 mM. The developed colorimetric assay was highly selective, repeatable, and functional in the presence of interfering biomolecules, and the assay showed excellent results for the analysis of creatinine in artificial urine samples. The main feature of the developed assay is that the quantitative detection of creatinine is possible within few minutes with our naked eye without any instrument or technician support, and this will be highly beneficial for the clinical diagnosis of CKD.Data availability
Data will be available upon request.Conflicts of interest
There are no conflicts to declare.Acknowledgements
PAR acknowledges Ramalingaswami re-entry fellowship (BT/RLF/Re-entry/75/2020) from the Department of Biotechnology (DBT), Govt. of India. JR acknowledges Nava Kerala Post-Doctoral Fellowship (G.O.(Ms) No. 594/2022/HEDN Dt. 03/12/2022) from the Government of Kerala, India. The authors are thankful to CIF, IIT Palakkad for characterization facilities.References
- C. P. Kovesdy, Epidemiology of chronic kidney disease: an update 2022, Kidney Int. Suppl., 2022, 12, 7–11 CrossRef PubMed.
- J.-C. Lv and L.-X. Zhang, Prevalence and disease burden of chronic kidney disease, Renal Fibrosis: Mechanisms and Therapies, 2019, 3–15 Search PubMed.
- D. R. Farrell and J. A. Vassalotti, Screening, identifying, and treating chronic kidney disease: why, who, when, how, and what?, BMC Nephrol., 2024, 25, 34 CrossRef PubMed.
- R. B. Jadhav, T. Patil and A. P. Tiwari, Trends in sensing of creatinine by electrochemical and optical biosensors, Appl. Surf. Sci. Adv., 2024, 19, 100567 CrossRef.
- O. Sugita, K. Uchiyama, T. Yamada, T. Sato, M. Okada and K. Takeuchi, Reference values of serum and urine creatinine, and of creatinine clearance by a new enzymatic method, Ann. Clin. Biochem., 1992, 29, 523–528 CrossRef CAS PubMed.
- L. Hessels, N. Koopmans, A. W. Gomes Neto, M. Volbeda, J. Koeze, A. O. Lansink-Hartgring, S. J. Bakker, H. M. Oudemans-van Straaten and M. W. Nijsten, Urinary creatinine excretion is related to short-term and long-term mortality in critically ill patients, Intensive Care Med., 2018, 44, 1699–1708 CrossRef CAS PubMed.
- T. Sakurai, T. Irii and K. Iwadate, Simultaneous quantification of urea, uric acid, and creatinine in human urine by liquid chromatography/mass spectrometry, Leg. Med., 2022, 55, 102011 CrossRef CAS PubMed.
- C. L. Gonzalez-Gallardo, J. Morales-Hernández, L. Álvarez-Contreras, N. Arjona and M. Guerra-Balcázar, Electrochemical detection of creatinine on Cu/carbon paper electrodes obtained by physical vapor deposition, J. Appl. Electrochem., 2024, 54, 115–126 CrossRef CAS.
- R. Sriramprabha, M. Sekar, R. Revathi, C. Viswanathan and J. Wilson, Fe2O3/polyaniline supramolecular nanocomposite: A receptor free sensor platform for the quantitative determination of serum creatinine, Anal. Chim. Acta, 2020, 1137, 103–114 CrossRef CAS PubMed.
- M. Ogata and T. Taguchi, Simultaneous determination of urinary creatinine and metabolites of toluene, xylene, styrene, ethylbenzene and phenol by automated high performance liquid chromatography, Int. Arch. Occup. Environ. Health, 1988, 61, 131–140 CrossRef CAS PubMed.
- Y. Yue-dong, Simultaneous determination of creatine, uric acid, creatinine and hippuric acid in urine by high performance liquid chromatography, Biomed. Chromatogr., 1998, 12, 47–49 CrossRef.
- G. del Campo, A. Irastorza and J. A. Casado, Spectrophotometric simultaneous determination of creatinine and creatine by flow injection with reagent injection, Fresenius. J. Anal. Chem., 1995, 352, 557–561 CrossRef CAS.
- D. W. Lübbers, Optical sensors for clinical monitoring, Acta Anaesthesiol. Scand., Suppl., 1995, 104, 37–54 CrossRef PubMed.
- E. Eksin and A. Erdem, Recent Progress on Optical Biosensors Developed for Nucleic Acid Detection Related to Infectious Viral Diseases, Micromachines, 2023, 14, 295 CrossRef PubMed.
- X. Chen, X. E. Zhang, Y. Q. Chai, W. P. Hu, Z. P. Zhang, X. M. Zhang and A. E. Cass, DNA optical sensor: a rapid method for the detection of DNA hybridization, Biosens. Bioelectron., 1998, 13, 451–458 CrossRef CAS PubMed.
- A.-M. Hada, S. Suarasan, M. Muntean, M. Potara and S. Astilean, Aptamer-conjugated gold nanoparticles for portable, ultrasensitive naked-eye detection of C-reactive protein based on the Tyndall effect, Anal. Chim. Acta, 2024, 1307, 342626 CrossRef CAS PubMed.
- P. Si, N. Razmi, O. Nur, S. Solanki, C. M. Pandey, R. K. Gupta, B. D. Malhotra, M. Willander and A. de la Zerda, Gold nanomaterials for optical biosensing and bioimaging, Nanoscale Adv., 2021, 3, 2679–2698 RSC.
- X. Bai, Y. Wang, Z. Song, Y. Feng, Y. Chen, D. Zhang and L. Feng, The basic properties of gold nanoparticles and their applications in tumor diagnosis and treatment, Int. J. Mol. Sci., 2020, 21, 2480 CrossRef CAS PubMed.
- S. Zeng, K.-T. Yong, I. Roy, X.-Q. Dinh, X. Yu and F. Luan, A review on functionalized gold nanoparticles for biosensing applications, Plasmonics, 2011, 6, 491–506 CrossRef CAS.
- A. O. Abdelrazig, P. Rijiravanich, S. Suwannarat, W. Surareungchai and M. Somasundrum, Detection of DNA using gold nanoparticle-coated silica nanoparticles, Anal. Biochem., 2024, 686, 115411 CrossRef CAS PubMed.
- T.-H. Le, Q.-H. Phan, V.-T. Vo and P.-L. Truong, Gold nanoparticle-based biosensor for Lysozyme-DNA detection utilizing decomposition Mueller matrix polarimetry, Opt Laser. Technol., 2024, 179, 111302 CrossRef.
- S. A. Ali, H. Ayalew, B. Gautam, B. Selvaraj, J.-W. She, J. A. Janardhanan and H.-h. Yu, Detection of SARS-CoV-2 Spike Protein Using Micropatterned 3D Poly(3,4-Ethylenedioxythiophene) Nanorods Decorated with Gold Nanoparticles, ACS Appl. Mater. Interfaces, 2024, 16, 19904–19913 CAS.
- H. J. Yang, M. W. Kim, C. V. Raju, C. H. Cho, T. J. Park and J. P. Park, Highly sensitive and label-free electrochemical detection of C-reactive protein on a peptide receptor–gold nanoparticle–black phosphorous nanocomposite modified electrode, Biosens. Bioelectron., 2023, 234, 115382 CrossRef CAS PubMed.
- J. Tai, S. Fan, S. Ding and L. Ren, Gold nanoparticles based optical biosensors for cancer biomarker proteins: a review of the current practices, Front. Bioeng. Biotechnol., 2022, 10, 877193 CrossRef PubMed.
- K. Singh, D. Kukkar, R. Singh, P. Kukkar and K.-H. Kim, Exceptionally stable green-synthesized gold nanoparticles for highly sensitive and selective colorimetric detection of trace metal ions and volatile aromatic compounds, J. Ind. Eng. Chem., 2018, 68, 33–41 CrossRef CAS.
- D. Sang, X. Luo and J. Liu, Biological interaction and imaging of ultrasmall gold nanoparticles, Nano-Micro Lett., 2024, 16, 44 CrossRef CAS PubMed.
- X. Zhang, Gold nanoparticles: recent advances in the biomedical applications, Cell Biochem. Biophys., 2015, 72, 771–775 CrossRef CAS PubMed.
- T. P. Patil, A. K. Parthasarathy, D. Malavekar, J. Kim and A. P. Tiwari, Optical Biosensing of SARS-CoV-2 RNA Based on Positively Charged Poly-l-Lysine Functionalized Gold Nanoparticles, J. Cluster Sci., 2024, 35, 2525–2538 CrossRef CAS.
- P. J. Babu, S. Saranya, B. Longchar and A. Rajasekhar, Nanobiotechnology-mediated sustainable agriculture and post-harvest management, Curr. Res. Biotechnol., 2022, 4, 326–336 CrossRef.
- P. J. Babu and J. M. R. Tingirikari, A review on polymeric nanomaterials intervention in food industry, Polym. Bull., 2023, 80, 137–164 CrossRef CAS.
- Y. Xia, C. Zhu, J. Bian, Y. Li, X. Liu and Y. Liu, Highly sensitive and selective colorimetric detection of creatinine based on synergistic effect of PEG/Hg2+–AuNPs, Nanomaterials, 2019, 9, 1424 CrossRef CAS PubMed.
- H. Du, R. Chen, J. Du, J. Fan and X. Peng, Gold nanoparticle-based colorimetric recognition of creatinine with good selectivity and sensitivity, Ind. Eng. Chem. Res., 2016, 55, 12334–12340 CrossRef CAS.
- Q. Zhang, R. Yang, G. Liu, S. Jiang, J. Wang, J. Lin, T. Wang, J. Wang and Z. Huang, Smartphone-based low-cost and rapid quantitative detection of urinary creatinine with the Tyndall effect, Methods, 2024, 221, 12–17 CrossRef CAS PubMed.
- M. Chhillar, D. Kukkar, A. Deep, A. K. Yadav and K.-H. Kim, Zn2+/GNPs nanocomposite for highly selective colorimetric detection of creatinine in urine samples of CKD patients, Inorg. Chem. Commun., 2023, 158, 111618 CrossRef CAS.
- A. Tirkey and P. J. Babu, Synthesis and characterization of citrate-capped gold nanoparticles and their application in selective detection of creatinine (A kidney biomarker), Sens. Int., 2024, 5, 100252 CrossRef.
- Y. He, X. Zhang and H. Yu, Gold nanoparticles-based colorimetric and visual creatinine assay, Microchim. Acta, 2015, 182, 2037–2043 CrossRef CAS.
- H. J. Hwang, M. Y. Ryu and J. P. Park, Identification of high affinity peptides for capturing norovirus capsid proteins, RSC Adv., 2015, 5, 55300–55302 RSC.
- B.-H. Kim, I. S. Yoon and J.-S. Lee, Masking Nanoparticle Surfaces for Sensitive and Selective Colorimetric Detection of Proteins, Anal. Chem., 2013, 85, 10542–10548 CrossRef CAS PubMed.
- S. Feng, R. Shi, P. Xu, J. R. Bhamore, J. Bal, S. H. Baek, C. Y. Park, J. P. Park and T. J. Park, Colorimetric detection of creatinine using its specific binding peptides and gold nanoparticles, New J. Chem., 2020, 44, 15828–15835 RSC.
- K. Nejati, M. Dadashpour, T. Gharibi, H. Mellatyar and A. Akbarzadeh, Biomedical Applications of Functionalized Gold Nanoparticles: A Review, J. Cluster Sci., 2022, 33, 1–16 CrossRef CAS.
- P. A. Rasheed and J.-S. Lee, Ultrasensitive colorimetric detection of NF-κB protein at picomolar levels using target-induced passivation of nanoparticles, Anal. Bioanal. Chem., 2018, 410, 1397–1403 CrossRef CAS PubMed.
- A. Ganguly, A. Paul and S. Prasad, Pysanka-inspired electrode modification with aptamer encapsulation in ZIF-8 for urine creatinine electrochemical biosensing, Chemosensors, 2023, 11, 557 CrossRef CAS.
- J.-H. Oh and J.-S. Lee, Designed Hybridization Properties of DNA–Gold Nanoparticle Conjugates for the Ultraselective Detection of a Single-Base Mutation in the Breast Cancer Gene BRCA1, Anal. Chem., 2011, 83, 7364–7370 CrossRef CAS PubMed.
- N. Sarigul, F. Korkmaz and İ. Kurultak, A New Artificial Urine Protocol to Better Imitate Human Urine, Sci. Rep., 2019, 9, 20159 CrossRef CAS PubMed.
- M. Nour, O. Hamdy, A. Faid, E. Eltayeb and A. Zaky, Utilization of gold nanoparticles for the detection of squamous cell carcinoma of the tongue based on laser-induced fluorescence and diffuse reflectance characteristics: an in vitro study, Laser Med. Sci., 2022, 37, 3551–3560 CrossRef PubMed.
- G. Dodi, D. Popescu, F. D. Cojocaru, M. Aradoaei, R. C. Ciobanu and C. T. Mihai, Use of Fourier-Transform Infrared Spectroscopy for DNA Identification on Recycled PET Composite Substrate, Appl. Sci., 2022, 12, 4371 CrossRef CAS.
- J.-S. Chen, P.-F. Chen, H. T.-H. Lin and N.-T. Huang, A Localized surface plasmon resonance (LSPR) sensor integrated automated microfluidic system for multiplex inflammatory biomarker detection, Analyst, 2020, 145, 7654–7661 RSC.
- S. R. Ede, A. Ramadoss, S. Anantharaj, U. Nithiyanantham and S. Kundu, Enhanced catalytic and supercapacitor activities of DNA encapsulated β-MnO2 nanomaterials, Phys. Chem. Chem. Phys., 2014, 16, 21846–21859 RSC.
- R. Narimani, M. Azizi, M. Esmaeili, S. H. Rasta and H. T. Khosroshahi, An optimal method for measuring biomarkers: colorimetric optical image processing for determination of creatinine concentration using silver nanoparticles, 3 Biotech, 2020, 10, 1–9 CrossRef PubMed.
- M. T. Alula, L. Karamchand, N. R. Hendricks and J. M. Blackburn, Citrate-capped silver nanoparticles as a probe for sensitive and selective colorimetric and spectrophotometric sensing of creatinine in human urine, Anal. Chim. Acta, 2018, 1007, 40–49 CrossRef CAS PubMed.
- S. Sadeghi and M. Hosseinpour-Zaryabi, Sodium gluconate capped silver nanoparticles as a highly sensitive and selective colorimetric probe for the naked eye sensing of creatinine in human serum and urine, Microchem. J., 2020, 154, 104601 CrossRef CAS.
- U. Sivasankaran, T. C. Jos and K. G. Kumar, Selective recognition of creatinine – development of a colorimetric sensor, Anal. Biochem., 2018, 544, 1–6 CrossRef CAS PubMed.
Footnote |
| † Electronic supplementary information (ESI) available. See DOI: https://doi.org/10.1039/d4ra06191h |
| This journal is © The Royal Society of Chemistry 2024 |

