 Open Access Article
Creative Commons Attribution 3.0 Unported Licence
The intrinsic piezoelectricity of monoclinic Pb(Zr1−xTix)O3†
Junyu Niu a,
Chong Lib and
Zengzhe Xi*a
aShaanxi Key Laboratory of Photoelectric Functional Materials and Devices, School of Materials and Chemical Engineering, Xi'an Technological University, Xi'an 710021, Shaanxi, China. E-mail: zzhxi@xatu.edu.cn
bShenzhen Key Laboratory of Advanced Thin Films and Applications, Key Laboratory of Optoelectronic Devices and Systems of Ministry of Education and Guangdong Province, College of Physics and Optoelectronic Engineering, Shenzhen University, Shenzhen 518060, P. R. China
First published on 2nd December 2024
Abstract
The phase diagram of Pb(Zr1−xTix)O3 (PZT) is quite clear; however, the existence and intrinsic piezoelectricity of low-symmetry structures near the MPB (morphotropic phase boundary) remain subjects of considerable uncertainty. The impact of the MPB on the piezoelectric properties of PZT was investigated via first principles study. Different PZT structures were established by virtual crystal approximation (VCA). The density functional theory (DFT) with plane-wave basis set method was utilized to calculate the energy, elastic, and piezoelectric properties. The presence of the monoclinic phase in MPB was confirmed near x ∼ 0.53. This phase exhibited distinct piezoelectric properties. Although the coefficients d33 and d15 were lower, the maximum value of d31 reached −198.33 pm V−1. By exhaustively exploring all possible structures at the MPB, we demonstrate that the intrinsic piezoelectricity of monoclinic structures is not the main contributor to the MPB effect. Further study shows that this is related to the hybridization between the O2p orbital and the d orbital of the central atom. Finally, analysis of the energy barrier along the polarization rotation paths implies a flattening of free energy in the monoclinic phase, suggesting a high intrinsic piezoelectric coefficient. The intrinsic piezoelectric properties of the monoclinic phase may bring new ideas to the study of the MPB effect.
1. Introduction
Lead-based piezoelectric materials have garnered significant attention owing to their exceptional ferroelectric properties.1–7 PZT, as a perovskite-type ferroelectric material, exhibits different phases near Curie temperature (Tc).8 Above Tc, PZT crystals exist in a cubic phase. Below Tc, PZT consists of a continuous solid solution of PbTiO3 and PbZrO3. At Ti concentration greater than 0.53, the microstructure primarily consists of the tetragonal phase. Conversely, at Ti concentration of less than 0.53, the microstructure consists of the rhombohedral phase. Currently, the most widely used PZT material is located at the MPB.1,2,6,9,10There is no consensus on the MPB effect, although there are two main conjectures regarding this effect. The first theory is “field-induced phase transition”. Shrout et al. found that applying a high electric field in the [001] direction induces a transformation from the rhombohedral to the tetragonal phase, accompanied with a large strain in relaxor single crystals.11 Another theory is polarization rotation, first proposed by Fu et al.12 They compared the energy of different polarization rotation paths in BaTiO3. Noheda et al. proved the polarization rotation path along a–g–d–e in Pb(ZnNb)O3–PbTiO3 single crystals.13 The flattening of the free energy surface was considered a major factor contributing to high piezoelectricity. At present, polarization rotation theory is recognized by a large number of researchers.14,15 However, the intricacies of the MPB exceed conventional understanding. Even pure PbTiO3, which is usually considered unrelated to the MPB, demonstrated an MPB containing two monoclinic structures under a certain pressure in theory.16
In recent years, beyond the study of domain wall structures,17–21 researchers have focused on the contribution of intrinsic piezoelectricity of the low symmetry phase, especially the monoclinic phase.22–30 Bai et al. proved that the shear strain of a monoclinic structure has an important influence on its ferroelectric properties through thermodynamics.31 Damjanovic emphasized the crucial role played by intrinsic piezoelectricity in the MPB.32 The monoclinic phase, serving as a structural entity along the phase transition path, constitutes a significant subject for investigating lead-based piezoelectric crystals through the polarization rotation theory. In 1999, Noheda et al. confirmed that the monoclinic PZT brings unique ferroelectric mechanisms.33 Cohen et al. confirmed the existence of the R–MA–T transition utilizing DFT.12 In 2016, the diffraction peak of a certain Cm structure in PZT was found via SXRD.34 Neutron diffraction also confirmed the existence of low-temperature Cc structure and high-temperature Cm structure in PZT.35,36 However, the academic community still lacks a complete understanding of the stability and intrinsic piezoelectric properties of various monoclinic phases. Liu et al. believed that compared with other structures, the MA structure is the key factor in generating the giant piezoelectric response of a perovskite crystal.37,38 On the phase boundaries of the two monoclinic structures, the larger displacement of Pb in the MA structure in the external field or strain might be more advantageous in piezoelectric response.39 Jin et al. proposed the ferroelectric adaptive theory, which suggests that the monoclinic phase is composed of rhombohedral phase or tetragonal phase nano-twins, which appear as monoclinic phase as a whole, and such diffraction spots have been observed in Pb(MnNb)O3–PbTiO3 ceramics and Pb(ZnNb)O3–PbTiO3 single crystals. The emergence of these studies raised new doubts about the intrinsic piezoelectric properties of the monoclinic phase.40,41 However, evidence was found that the pure Cm structure existed on the side of the tetragonal phase, not the adaptive phase in the PZT, by convergent beam electron diffraction in 2011.4
Additionally, DFT is considered to be an effective method to study piezoelectric effects.42,43 Bellaiche et al. used the DFT method to study the properties of PZT in a certain temperature range at MPB and proposed the possibility of a low-temperature monoclinic phase as a polarization rotation mesophase in 2000.44 Liu et al. determined the position of MPB of PZT. Furthermore, the piezoelectric and elastic properties can be calculated.45 Duerloo et al. predicted four novel high piezoelectric materials using this DFT method.46 Ghosez et al. evaluated the differences in the crystal dynamics of the BaTiO3, PbTiO3, and PbZrO3 lattices via the calculation of phonon scattering.47
Finally, monoclinic structure as the transition state of ferroelectric phase transition is a crucial part of polarization rotation theory. The intrinsic piezoelectricity of the monoclinic phase is a significant aspect for researchers to understand the MPB effect. Therefore, in this study, we determined the existence and intrinsic piezoelectricity of monoclinic phases by first principles calculations in detail.
2. Computational methods
This study employed the open-source ABINIT software. For the purpose of investigating the intrinsic piezoelectric effect in different 2 × 2 × 2 VCA lattices, the exchange-correlation potential for electrons was described using GGA implemented in the PBE scheme.48 The Monkhorst–Pack method was employed for sampling the K point in the Brillouin zone, with a grid density of 6 × 6 × 6. The BFGS algorithm was employed for geometry optimization during the calculations. The cutoff energy was set to 600 eV, and the maximum displacement was 0.0005 Å. To enhance accuracy, the convergence for the maximum tolerance on the plane wave function squared residual was 10−18. The maximum force tolerance was 0.01 eV Å−1. The electric polarizations were calculated using the Berry phase method.493. Results and discussion
Fig. 1 illustrates the total energy differences between different phases to P4mm. Table S1† shows the lattice parameters of these structures and Fig. S1† shows the total energy of this phase. The energy difference is defined via the formula ED(x) = EP4mm(x) − Ephase(x). Firstly, in the Zr-rich region (x < 0.53), the R![[3 with combining macron]](https://www.rsc.org/images/entities/char_0033_0304.gif) m phase exhibits the lowest total energy compared to other phases, with a maximum difference of around 0.04 eV. In the Ti-rich region (x > 0.53), the P4mm phase shows the lowest total energy, which indicates stability in this range. Secondly, high Ti content is not conducive to the existence of a rhombohedral phase; when x > 0.8, the total energy of R
m phase exhibits the lowest total energy compared to other phases, with a maximum difference of around 0.04 eV. In the Ti-rich region (x > 0.53), the P4mm phase shows the lowest total energy, which indicates stability in this range. Secondly, high Ti content is not conducive to the existence of a rhombohedral phase; when x > 0.8, the total energy of R![[3 with combining macron]](https://www.rsc.org/images/entities/char_0033_0304.gif) m and R
m and R![[3 with combining macron]](https://www.rsc.org/images/entities/char_0033_0304.gif) c structure will fail to converge. Furthermore, at lower Ti concentration, the R
c structure will fail to converge. Furthermore, at lower Ti concentration, the R![[3 with combining macron]](https://www.rsc.org/images/entities/char_0033_0304.gif) m phase exhibits lower total energy compared to the R
m phase exhibits lower total energy compared to the R![[3 with combining macron]](https://www.rsc.org/images/entities/char_0033_0304.gif) c phase. Similarly, this phenomenon is also reflected in the three monoclinic structures; in the range of x < 0.2 and x > 0.7, their structures also fail to converge. It is noteworthy that the Cm(MB) phase has higher total energy at any Ti concentration, except for a local extremum near x = 0.51, which closely aligns with MPB (x ∼ 0.53). Additionally, the total energy and convergence are not the only verification methods for the existence. In view of this, the study attempts to calculate the free energy to study the existence of Cm(MB) structures. For other monoclinic phases (MC, MA), they exhibit an excessive total energy at the MPB, with a significant energy barrier to even the nearest stable MB structures (0.012 eV, 0.023 eV).
c phase. Similarly, this phenomenon is also reflected in the three monoclinic structures; in the range of x < 0.2 and x > 0.7, their structures also fail to converge. It is noteworthy that the Cm(MB) phase has higher total energy at any Ti concentration, except for a local extremum near x = 0.51, which closely aligns with MPB (x ∼ 0.53). Additionally, the total energy and convergence are not the only verification methods for the existence. In view of this, the study attempts to calculate the free energy to study the existence of Cm(MB) structures. For other monoclinic phases (MC, MA), they exhibit an excessive total energy at the MPB, with a significant energy barrier to even the nearest stable MB structures (0.012 eV, 0.023 eV).
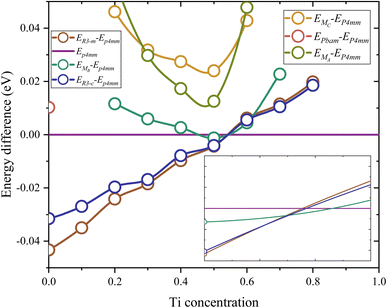 | ||
| Fig. 1 The difference in total energy between P4mm and other phases. The spectral line closest to the top in the figure will have the lowest total energy to obtain a stable structure. | ||
By calculating the phonon scattering situation at the Γ point, the relationship between energy and temperature can be determined, expressed as:
 | (1) |
The zero-point energy is:
 | (2) |
While the free energy F can be expressed as:
 | (3) |
At 0 K, the free energy is equal to the zero-point energy.
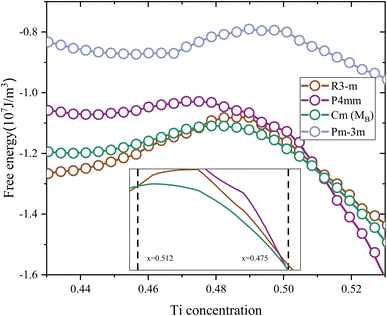
Based on the calculations of the free energy in Fig. 2, the P4mm phase has the lowest free energy for x > 0.512, while the R![[3 with combining macron]](https://www.rsc.org/images/entities/char_0033_0304.gif) m phase has the lowest free energy for x < 0.475.50 The range in which the free energy of both takes its minimum is very close to the range commonly considered for the MPB of the PZT. Within a narrow range of 0.475 < x < 0.512, the Cm(MB) phase exhibits the lowest free energy, indicating its stable existence in this chemical composition. These two methods (total energy and free energy) yield very close results. In order to further explore the origin of this stability of Cm(MB), the paper first selects the structure of x = 0.5 as the research object. Subsequently, phonon scattering spectra are calculated via the linear response method.
m phase has the lowest free energy for x < 0.475.50 The range in which the free energy of both takes its minimum is very close to the range commonly considered for the MPB of the PZT. Within a narrow range of 0.475 < x < 0.512, the Cm(MB) phase exhibits the lowest free energy, indicating its stable existence in this chemical composition. These two methods (total energy and free energy) yield very close results. In order to further explore the origin of this stability of Cm(MB), the paper first selects the structure of x = 0.5 as the research object. Subsequently, phonon scattering spectra are calculated via the linear response method.
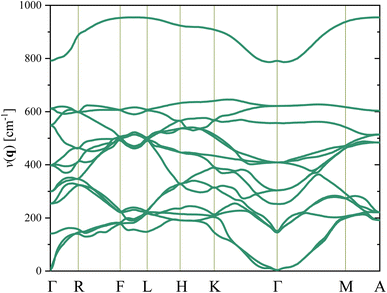
In Fig. 3, firstly, it is found that the degeneracy of the phonon structure of the Cm(MB) phase is destroyed compared with the literature. The first reason for this result is that the Cm(MB) phase belongs to the lower crystal group, and the symmetry of the structure is reduced. Secondly, it is due to the doping effect of Zr atoms in the crystal. The softest frequency is 2.72 cm−1, and the second softest frequency is 2.9 cm−1. They are all located at Γ point, which belongs to a vibration of the optical transverse mode of the central atom of the lattice. Finally, since the lowest frequency vibration mode of Cm(MB) phase is above the virtual frequency region, it can be considered that Cm(MB) phase can exist stably in theory.
This stability of the monoclinic structure is reflected in its ferroelectric property. For the Cm(MB) phase located at x = 0.5, the component of the polarization intensity vector is Px = 0.133, Py = 0.125, and Pz = 0.0457, respectively. This indicates that Cm(MB) phase may have different displacement polarization characteristics and polarization rotation characteristics from other structures. This phenomenon should first be reflected in the chemical bond changes in the structure. For PZT, the covalent bond between A position atoms and O with the covalent bond between the central atoms and O2p orbit are equally important contributions to the stability of structure.51–53 The Born effective charge in the range of 0.45 < x < 0.55 and the displacement of the atom with respect to the symmetric position are shown in Table S2.† The Z* stands for the average Born effective charge, and the  ,
,  . These two very close values indicate that the two atoms have very close chemical environments.47 Additionally, both
  and
and  are greater than its valency of +4; this suggests that the chemical bond between Ti, Zr, and O is mainly covalent (ZO1x = −2.494, ZO1y = −4.429, ZO1z = −2.209, ZO3x = −2.381, ZO3y = −2.341, ZO3z = −4.684, ZO4x = −2.75, ZO4y = −4.846, ZO4z = −1.966, ZO6x = −2.106, ZO6y = −2.041, ZO6z = −4.058). Meanwhile, the
  , which may indicate the weakening of the covalent bond between Pb6s and O2p orbit compared with the P4mm structure in this chemical compound. Finally, the most stable structure around x = 0.5 is the R
![[3 with combining macron]](https://www.rsc.org/images/entities/char_0033_0304.gif) m phase,54 which has a similar band gap to the Cm(MB) structure shown in Fig. S5.† This suggests that the Cm(MB) structure may have an electronic structure with a reduced DOS of conduction bond and an increased DOS of valence band.
m phase,54 which has a similar band gap to the Cm(MB) structure shown in Fig. S5.† This suggests that the Cm(MB) structure may have an electronic structure with a reduced DOS of conduction bond and an increased DOS of valence band.
Fig. 4 shows the structure of covalent bonds by calculating the PDOS method. It can be observed firstly that both phases exhibit large band gaps, with EgCm(MB) = 2.987 eV, and EgPm3m = 2.463 eV, respectively. Fig. S7† shows the electronic structure of the MB-Cm phase. Additionally, the PDOS spectra of the two phases exhibit similar peak shapes and identical positions. The peak position of the Cm(MB) phase is closer to lower energy (Cm(MB): −5.5 eV to 0 eV, Pm3m: −5 eV to 0 eV) indeed due to the reduction of the total DOS visible in the conduction band. Fig. S8† provides some electronic structures of PZT in different phases. Unlike phase transitions in general materials, the ferroelectric phase transition in the PZT cells is entirely determined by the distortion of oxygen octahedra in the lattice. As can be seen in Fig. S8,† the band structures and DOS between different phases are very similar. Therefore, despite the inherent lack of rigor in this approach, it is possible to determine band shifts by assessing the band gaps of these structures. This difference is mainly the contribution of Ti and Zr atoms in the valence band. This can be attributed to atomic displacements caused by the phase transition process. In PDOS, the range from −5 eV to 0 eV primarily consists of hybridization peaks between the oxygen and the central atoms. The main contributors to the p-orbit DOS are O2p orbit, while the main contributors to the d-orbit DOS are Ti3d and Zr4d orbits. Above the Fermi level, the O2p with Ti3d and Zr4d orbits exhibit similar peak shapes and peak positions. Meanwhile, even though in the conduction band, Cm(MB) has lower DOS than Pm3m phase, Cm(MB) crystal still occupies higher energy positions (Cm(MB): 3 eV, Pm3m: 2 eV); this effect plays a significant role in the stability of the Cm(MB) phase. This indicates a weak hybridization between the O2p and d orbits of central atoms, suggesting a weakening bonding energy in the Ti–O and Zr–O bonds. At −8 eV to −6 eV, the DOS of Pb6s orbit is drastically reduced compared to Pm3m. Table S3† shows the –COHP of the different PZT phases. Due to the limitations of the VCA, these calculations are based on 2 × 4 × 4 supercells, where the atomic distribution belongs to the Td point group, representing a crystal with a Zr/Ti ratio of 1. In the Pm3m phase, the –COHP values for Zr–O and Ti–O are 0.0431 and 0.0427, respectively. Similarly, for commonly used ferroelectric structures such as P4mm and R3m, the –COHP values also show a decrease. In the Cm(MB) structure, the –COHP is the lowest, with values of 0.0406 and 0.0395 for Ti–O1 and Ti–O2, respectively, and 0.0412 and 0.0409 for Zr–O1 and Zr–O2, respectively. This indicates a reduction in the overlap of bonding orbits between the central atoms and the oxygen atoms in the Cm(MB) structure, which is consistent with the conclusion of weakened covalent bonds obtained from the PDOS analysis.
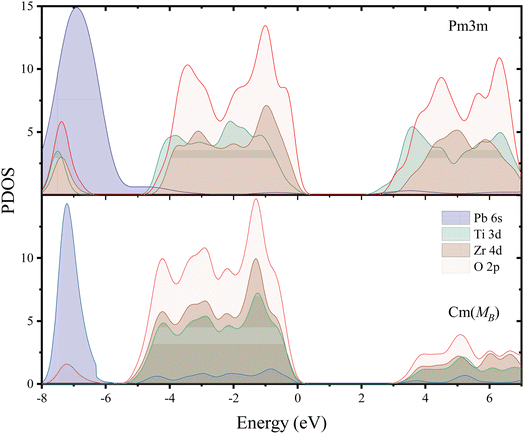 | ||
| Fig. 4 The density of states (DOS) for the Pm3m phase (above) and Cm(MB) (bottom) phases located at x = 0.5. | ||
The above conclusions based on PDOS are consistent with the conclusions drawn by the study of Born effective charge in the previous paragraphs of the paper. In the electron density image presented in Fig. S2† the monoclinic structure was selected as the study object. In the 2 × 2 × 2 VCA supercell constructed in this paper, all parameters are fully relaxed. By examining the electron density images of the central atom plane and the O3, O4 atom plane in the (001) direction of the crystal, the charge density transfer between the central atom and the O3, O4 atoms are found. This effect may relate to the contraction or expansion of the oxygen octahedron structure in this direction. In addition, the antiferroelectric distortion belonging to the M2+ mode can be observed in the fully relaxed supercell.55–58 This is preliminarily believed to be related to the monoclinic structure reducing its own energy and improving the stability.
Based on the calculated ferroelectric and elastic properties of the crystal, the piezoelectric constants can be obtained from the rate of change of polarization intensity with respect to strain,49,59,60 where the strain is set to not exceed 1%. Firstly, when the external electric field is zero, the piezoelectric stress constants can be expressed as:
 | (4) |
 | (5) |
| pi = psi + eijηj | (6) |
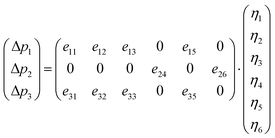 | (7) |
For the monoclinic structure in m space group, the elastic constant matrix is:
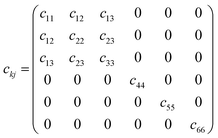 | (8) |
The relationship between them is as follows:
| eij = dikckj | (9) |
This relationship can be reduced to:
 | (10) |
Taking the polarization intensity along the [001] direction as an example, it can be expressed as:
| Δp3 = e31η1 + e32η2 + e33η3 + e35η5 | (11) |
By applying strain along the c-axis, the piezoelectric constant can be obtained as:
 | (12) |
The piezoelectric strain constant dij is related to this formula. The bold e is the meta charge. Z means Born effective charge.
| d33 ≈ e33s33 | (13) |
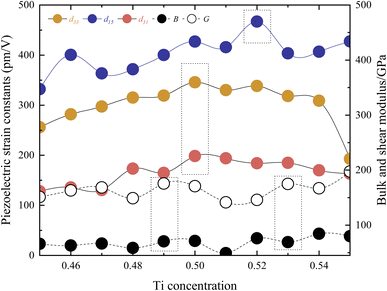
Fig. 5 presents the relationship between piezoelectric strain constants and Ti concentration. The maximum value of the d33 = 345.71 pm V−1 is observed at x = 0.5. The maximum value of the d15 = 466.84 pm V−1 is found at x = 0.52. Similarly, the maximum value of the d31 = −198.33 pm V−1 is at x = 0.5. These positions are in close proximity to MPB. Compared to experimental values, the Cm(MB) phase exhibits lower values.1,2 However, although the highest performance of the structure is a shear piezoelectric coefficient, the relatively high d31 in the Cm(MB) phase suggests that the structure possesses distinctive transverse piezoelectricity. This is because the above three extreme values are not located in the same chemical composition. Due to the differing symmetries of various ferroelectric structures, utilizing a single metric such as the c/a ratio to measure lattice distortion is not universally applicable. In Fig. S9,† the volume and lattice parameters decrease with increasing x, while the displacement of the central atom relative to the crystal center remains essentially unchanged. This indicates that as x increases, the lattice distortion caused by the central atom intensifies, which is consistent with the behavior of PZT near MPB.
A comparison of the piezoelectric properties of several monoclinic structures at the MPB is presented in Table 1. Among these monoclinic structures, the MB structure exhibits the highest piezoelectric performance; however, this performance still shows a significant gap compared to the rhombohedral and tetragonal structures. For instance, the most successful commercial PZT exhibits a d33 of 750 pm V−1 at the MPB, while the common P4mm and R![[3 with combining macron]](https://www.rsc.org/images/entities/char_0033_0304.gif) m phases of PZT have d33 values of 260 pm V−1 and 225 pm V−1, respectively. By exhaustively exploring all possible structures at the MPB based on the VCA method, we demonstrate that the intrinsic piezoelectricity of monoclinic structures is not the main contributor to the MPB effect.
m phases of PZT have d33 values of 260 pm V−1 and 225 pm V−1, respectively. By exhaustively exploring all possible structures at the MPB based on the VCA method, we demonstrate that the intrinsic piezoelectricity of monoclinic structures is not the main contributor to the MPB effect.
| pm V−1 | P4mm | R![[3 with combining macron]](https://www.rsc.org/images/entities/char_0033_0304.gif) m m |
R![[3 with combining macron]](https://www.rsc.org/images/entities/char_0033_0304.gif) c c |
Cm(MA) | Cm(MB) | Pm(MC) | Cc |
|---|---|---|---|---|---|---|---|
| d33 | 454.76 | 473.46 | 442.33 | 281.17 | 345.71 | 212.36 | 171.34 |
| d15 | 583.67 | 615.14 | 501.82 | 301.12 | 466.84 | 251.37 | 204.71 |
Fig. S3† illustrates the total energy, the zero point energy, and the frequency of the softest phonon vibration mode at Γ point of the structure around x = 0.5. It is shown that x = 0.5 and x = 0.52 are both located at the bottom of the energy curve, while the softest frequency of x = 0.5 is lower and reaches the range of virtual frequencies. Fig. S4† shows the above properties for x = 0.52 versus c/a. These data suggest that the structure with x = 0.52 is more stable indeed, while the high piezoelectric coefficient d33 and d31 at x = 0.5 may be related to the smaller virtual frequency here, due to the softening of the transverse mode vibration of the central atoms. Fig. 5 also depicts the bulk modulus B and shear modulus G. These parameters are derived from the elastic stiffness constants cij and the elastic compliance constants sij. The computed results show the maximum and minimum values at x = 0.49, x = 0.53, and x = 0.51, respectively, for B and G. These extrema positions do not align with the position in which it has the direction of maximum polarization, indicating that such elastic properties may play a significant role in influencing the piezoelectric performance. Additionally, these extreme values stand vary close (s31,x=0.5 = 31.28, s31,x=0.52 = 29.53, s33,x=0.5 = 34.86, s33,x=0.52 = 34.24, s15,x=0.5 = 22.02, s15,x=0.52 = 17.99, unit: 10−12 m2 n−1). The difference in piezoelectric properties is almost due to differences in electronic structure (e31,x=0.5 = −6.34, e31,x=0.52 = −6.23, e33,x=0.5 = 9.92, e33,x=0.52 = 9.88, e15,x=0.5 = 19.41, e15,x=0.52 = 25.94, unit: C m2). Based on this conclusion, the polarization rotation theory is adopted in this paper. By applying strain to the model, the position of the central atoms is changed, and the rotation of the polarization direction of the structure to the d position is simulated.
Fig. S6† illustrates the total energy, the zero point energy, and the frequency of the softest phonon vibration mode at Γ point of the structure located at x = 0.52. The energy of barriers along the polarization rotation path is defined via the formula EB(θ) = Etotal energy(θ) − Etotal energy(0). θ is the angle of polarization rotation. It can be observed from Fig. 6 that the barrier height gradually increases with the increase in the rotation angle. Moreover, within the lower rotation angle, relatively low barrier heights are observed, corresponding to the flattening of free energy. This phenomenon is also found in the zero point energy of Fig. S6.† This serves as the origin of the intrinsic piezoelectricity in the Cm(MB) phase.
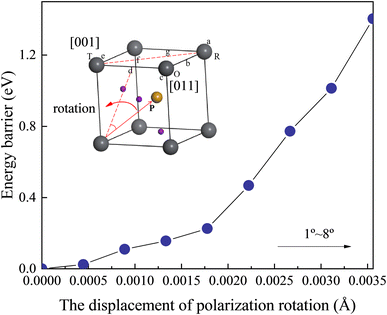 | ||
| Fig. 6 Portrayal of the energy barriers along the polarization rotation path of Cm(MB) phase along the d direction at x = 0.52. | ||
4. Conclusion
In this study, the intrinsic piezoelectric properties of monoclinic PZT were investigated via first-principles study. Firstly, crystal structures versus Ti concentrations were constructed based on VCA, and the position of the MPB was determined at x ∼ 0.53. The free energy indicates the relatively lower of Cm(MB) phase at 0.475 < x < 0.512. The study of the phonon spectrum shows that the structure has the softest mode indicating stable existence. Secondly, studies on the electronic structure and Born effective charge show that this stability is inseparable from the bond energy enhancement between the O and central atoms. Subsequently, the elastic and piezoelectric properties of the crystal were calculated. The results reveal relatively lower values of the d33 and d15 piezoelectric strain constants in the Cm(MB) phase, being 345.71 pm V−1 (x = 0.5) and 466.84 pm V−1 (x = 0.52), respectively. However, the d31 component of the piezoelectric strain constant was found to be relatively high, at −198.33 pm V−1 (x = 0.5). By exhaustively exploring all possible structures at the MPB, we demonstrate that the intrinsic piezoelectricity of monoclinic structures is not the main contributor to the MPB effect. Finally, the origin of this piezoelectricity was explained by calculating the energy barriers along the polarization rotation path. Due to the flattening of the free energy, the Cm(MB) phase of PZT crystals exhibits relatively high intrinsic piezoelectricity. This may bring new ideas to the study of the MPB effect.Data availability
All authors in this paper promise that all data do not exist in any published articles and all data are free from any restrictions involving privacy and secrecy.Conflicts of interest
There are no conflicts to declare.Acknowledgements
This research work was supported by calculation technology and computing resource from Shenzhen Key Laboratory of Advanced Thin Films and Applications, and Xi 'an Technological University Development Fund, No. 0103-207000026.References
- J.-M. Cha, S.-J. Ha, J.-h. Kim, H.-A. Cha, J.-J. Choi, B.-D. Hahn, K.-H. Cho, S.-Y. Yoon and C.-W. Ahn, Ceram. Int., 2023, 49, 264–270 CrossRef CAS.
- B. Jaffe, R. S. Roth and S. Marzullo, J. Appl. Phys., 1954, 25, 809–810 CrossRef CAS.
- S. Kim, W.-J. Lee, Y.-H. Cho, M. Shim and S. Kim, Jpn. J. Appl. Phys., 2013, 52, 091101 CrossRef.
- R. Schierholz and H. Fuess, Phys. Rev. B:Condens. Matter Mater. Phys., 2011, 84, 064122 CrossRef.
- N. Zhang, H. Yokota, A. M. Glazer, Z. Ren, D. A. Keen, D. S. Keeble, P. A. Thomas and Z. G. Ye, Nat. Commun., 2014, 5, 5231 CrossRef CAS PubMed.
- M. J. Haun, E. Furman, S. J. Jang and L. E. Cross, Ferroelectrics, 1989, 99, 13–25 CrossRef CAS.
- X.-K. Wei, S. Prokhorenko, B.-X. Wang, Z. Liu, Y.-J. Xie, Y. Nahas, C.-L. Jia, R. E. Dunin-Borkowski, J. Mayer, L. Bellaiche and Z.-G. Ye, Nat. Commun., 2021, 12, 5322 CrossRef CAS PubMed.
- A. M. Glazer, P. A. Thomas, K. Z. Baba-Kishi, G. K. H. Pang and C. W. Tai, Phys. Rev. B:Condens. Matter Mater. Phys., 2004, 70, 184123 CrossRef.
- A. M. George, J. Íñiguez and L. Bellaiche, Phys. Rev. Lett., 2003, 91, 045504 CrossRef CAS PubMed.
- R. Guo, E. Alberta, A. Thomas, B. A. Jones and L. E. Cross, Ferroelectrics, 2002, 270, 265–270 CrossRef CAS.
- S.-E. Park and T. R. Shrout, J. Appl. Phys., 1997, 82, 1804–1811 CrossRef CAS.
- H. Fu and R. E. Cohen, Nature, 2000, 403, 281–283 CrossRef CAS PubMed.
- B. Noheda, D. E. Cox, G. Shirane, S. E. Park, L. E. Cross and Z. Zhong, Phys. Rev. Lett., 2001, 86, 3891–3894 CrossRef CAS PubMed.
- K. Datta, R. B. Neder, J. Chen, J. C. Neuefeind and B. Mihailova, Sci. Rep., 2017, 7, 471 CrossRef PubMed.
- X. Ke, S. Yang, Y. Wang, D. Wang, L. Zhao, J. Gao, Y. Wang and X. Ren, Phys. Rev. B, 2021, 103, 085132 CrossRef CAS.
- M. Ahart, M. Somayazulu, R. E. Cohen, P. Ganesh, P. Dera, H.-k. Mao, R. J. Hemley, Y. Ren, P. Liermann and Z. Wu, Nature, 2008, 451, 545–548 CrossRef CAS PubMed.
- Y. Cao, G. Sheng, J. X. Zhang, S. Choudhury, Y. L. Li, C. A. Randall and L. Q. Chen, Appl. Phys. Lett., 2010, 97, 252904 CrossRef.
- T. Asada and Y. Koyama, Phys. Rev. B:Condens. Matter Mater. Phys., 2007, 75, 214111 CrossRef.
- Z. Liu, B. Yang, W. Cao and T. Lookman, Phys. Rev. B, 2016, 94, 214117 CrossRef.
- G. A. Rossetti, A. G. Khachaturyan, G. Akcay and Y. Ni, J. Appl. Phys., 2008, 103, 114113 CrossRef.
- X.-K. Wei, C.-L. Jia, T. Sluka, B.-X. Wang, Z.-G. Ye and N. Setter, Nat. Commun., 2016, 7, 12385 CrossRef CAS PubMed.
- Y. Gu, F. Xue, S. Lei, T. T. A. Lummen, J. Wang, V. Gopalan and L.-Q. Chen, Phys. Rev. B:Condens. Matter Mater. Phys., 2014, 90, 024104 CrossRef CAS.
- T. Hyun Kim, J.-H. Ko, S. Kojima, A. A. Bokov, X. Long and Z.-G. Ye, Appl. Phys. Lett., 2012, 100, 082903 CrossRef.
- A. A. Bokov, X. Long and Z.-G. Ye, Phys. Rev. B:Condens. Matter Mater. Phys., 2010, 81, 172103 CrossRef.
- I. Lazar, D. Kajewski, A. Majchrowski, A. Soszyński, J. Koperski and K. Roleder, Ferroelectrics, 2016, 500, 67–75 CrossRef CAS.
- B. Noheda, D. E. Cox, G. Shirane, J. A. Gonzalo, L. E. Cross and S. E. Park, Appl. Phys. Lett., 1999, 74, 2059–2061 CrossRef CAS.
- B. Noheda, presented in part at the AIP Conference Proceedings, 2000 Search PubMed.
- A. G. A. Nisbet, F. Fabrizi, S. C. Vecchini, M. Stewart, M. G. Cain, T. Hase, P. Finkel, S. Grover, R. Grau-Crespo and S. P. Collins, Phys. Rev. Mater., 2021, 5, L120601 CrossRef CAS.
- K. Roleder, A. Majchrowski, I. Lazar, R. W. Whatmore, A. M. Glazer, D. Kajewski, J. Koperski and A. Soszyński, Phys. Rev. B, 2022, 105, 144104 CrossRef CAS.
- G. Catalan, A. Lubk, A. H. G. Vlooswijk, E. Snoeck, C. Magen, A. Janssens, G. Rispens, G. Rijnders, D. H. A. Blank and B. Noheda, Nat. Mater., 2011, 10, 963–967 CrossRef CAS PubMed.
- G. Bai, Y. Han, W. Li and C. Gao, Phys. Rev. B, 2022, 106, 184105 CrossRef CAS.
- D. Damjanovic, IEEE Trans. Ultrason. Ferroelectrics Freq. Control, 2009, 56, 1574–1585 Search PubMed.
- B. Noheda, J. A. Gonzalo, R. Guo, S.-E. Park, L. E. Cross, D. E. Cox and G. Shirane, AIP Conf. Proc., 2000, 535(1), 304–313 CrossRef CAS.
- L. Fan, J. Chen, Y. Ren, Z. Pan, L. Zhang and X. Xing, Phys. Rev. Lett., 2016, 116, 027601 CrossRef PubMed.
- G. Fraysse, J. Haines, V. Bornand, J. Rouquette, M. Pintard, P. Papet and S. Hull, Phys. Rev. B:Condens. Matter Mater. Phys., 2008, 77, 064109 CrossRef.
- A. K. Singh, D. Pandey and O. Zaharko, Phys. Rev. B:Condens. Matter Mater. Phys., 2006, 74, 024101 CrossRef.
- H. Liu, J. Chen, L. Fan, Y. Ren, Z. Pan, K. V. Lalitha, J. Rödel and X. Xing, Phys. Rev. Lett., 2017, 119, 017601 CrossRef PubMed.
- N. Zhang, H. Yokota, A. M. Glazer, D. A. Keen, S. Gorfman, P. A. Thomas, W. Ren and Z.-G. Ye, IUCrJ, 2018, 5, 73–81 CrossRef CAS PubMed.
- N. Zhang, H. Yokota, A. M. Glazer, Z. Ren, D. A. Keen, D. S. Keeble, P. A. Thomas and Z. G. Ye, Nat. Commun., 2014, 5, 5231 CrossRef CAS PubMed.
- Y. M. Jin, Y. U. Wang, A. G. Khachaturyan, J. F. Li and D. Viehland, J. Appl. Phys., 2003, 94, 3629–3640 CrossRef CAS.
- Y. M. Jin, Y. U. Wang, A. G. Khachaturyan, J. F. Li and D. Viehland, Phys. Rev. Lett., 2003, 91, 197601 CrossRef CAS PubMed.
- O. Hudak, Phase Transitions, 2008, 81, 1073–1079 CrossRef CAS.
- B. Völker, C. M. Landis and M. Kamlah, Smart Mater. Struct., 2012, 21, 035025 CrossRef.
- L. Bellaiche, A. García and D. Vanderbilt, Phys. Rev. Lett., 2000, 84, 5427–5430 CrossRef CAS PubMed.
- Y. Y. Liu, L. Yang and J. Y. Li, J. Appl. Phys., 2013, 113, 183524 CrossRef.
- K.-A. N. Duerloo, M. T. Ong and E. J. Reed, J. Phys. Chem. Lett., 2012, 3, 2871–2876 CrossRef CAS.
- P. Ghosez, E. Cockayne, U. V. Waghmare and K. M. Rabe, Phys. Rev. B:Condens. Matter Mater. Phys., 1999, 60, 836–843 CrossRef CAS.
- J. P. Perdew, K. Burke and M. Ernzerhof, Phys. Rev. Lett., 1996, 3865 CrossRef CAS PubMed.
- L. Dong, J. Lou and V. B. Shenoy, ACS Nano, 2017, 11, 8242–8248 CrossRef CAS PubMed.
- S. Baroni, S. de Gironcoli, A. Dal Corso and P. Giannozzi, Rev. Mod. Phys., 2001, 73(2), 515–562 CrossRef CAS.
- R. E. Cohen, Nature, 1992, 358, 136–138 CrossRef CAS.
- J. Shi, I. Grinberg, X. Wang and A. M. Rappe, Phys. Rev. B:Condens. Matter Mater. Phys., 2014, 89, 094105 CrossRef.
- R. Tharamas, J. Jutimoosik, A. Bootchanont, P. Kidkhunthod, S. Rujirawat, Z.-G. Ye and R. Yimnirun, Integr. Ferroelectr., 2017, 177, 137–142 CrossRef CAS.
- S.-Y. Liu, Q.-S. Shao, D.-S. Yu, Y.-K. Lü, D.-J. Li, Y. Li and M.-S. Cao, Chin. Phys. B, 2013, 22, 017702 CrossRef.
- B. K. Mani, S. Lisenkov and I. Ponomareva, Phys. Rev. B:Condens. Matter Mater. Phys., 2015, 91, 134112 CrossRef.
- J. S. Baker and D. R. Bowler, Phys. Rev. B, 2019, 100, 140401(R) CrossRef.
- N. Sicron, B. Ravel, Y. Yacoby, E. A. Stern, F. Dogan and J. J. Rehr, Phys. Rev. B:Condens. Matter Mater. Phys., 1994, 50, 13168–13180 CrossRef CAS PubMed.
- A. K. Tagantsev, K. Vaideeswaran, S. B. Vakhrushev, A. V. Filimonov, R. G. Burkovsky, A. Shaganov, D. Andronikova, A. I. Rudskoy, A. Q. R. Baron, H. Uchiyama, D. Chernyshov, A. Bosak, Z. Ujma, K. Roleder, A. Majchrowski, J. H. Ko and N. Setter, Nat. Commun., 2013, 4, 2229 CrossRef CAS PubMed.
- G. Sághi-Szabó, R. E. Cohen and H. Krakauer, Phys. Rev. Lett., 1998, 80, 4321 CrossRef.
- Z. Wu and H. Krakauer, Phys. Rev. B:Condens. Matter Mater. Phys., 2003, 68, 014112 CrossRef.
Footnote |
| † Electronic supplementary information (ESI) available. See DOI: https://doi.org/10.1039/d4ra06270a |
| This journal is © The Royal Society of Chemistry 2024 |

