 Open Access Article
Development of a selective COX-2 inhibitor: from synthesis to enhanced efficacy via nano-formulation†
Marwa Elewa‡
 *a,
Mohamed Shehda‡b,
Pierre A. Hanna
 c,
Mohamed M. Saida,
Sherif Ramadan
 de,
Assem Barakat
 f and
Yasmine M. Abdel Aziz
 *a
*a
aPharmaceutical Organic Chemistry Department, Faculty of Pharmacy, Suez Canal University, Ismailia, Egypt. E-mail: marwa_elewa@pharm.suez.edu.eg; msaid123eg@yahoo.com; yasmine_abdelaziz@pharm.suez.edu.eg
bDepartment of Pharmaceutical Chemistry, Faculty of Pharmacy, Horus University-Egypt, New Damietta, Egypt. E-mail: Dr.shehda@gmail.com
cDepartment of Pharmaceutics and Industrial Pharmacy, Faculty of Pharmacy, Suez Canal University, Ismailia, 41522, Egypt. E-mail: pierre_hanna@pharm.suez.edu.eg
dChemistry Department, Michigan State University, East Lansing, MI 48824, USA. E-mail: sramadan@chemistry.msu.edu
eDepartment of Chemistry, Benha University, Benha, Egypt
fDepartment of Chemistry, College of Science, King Saud University, P. O. Box 2455, Riyadh 11451, Saudi Arabia. E-mail: ambarakat@ksu.edu.sa
First published on 17th October 2024
Abstract
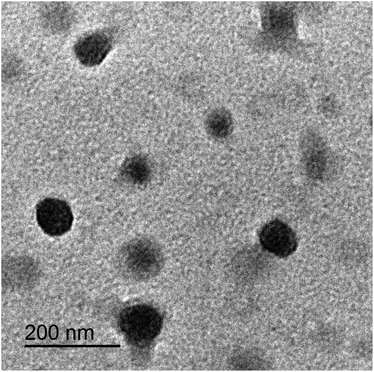
Non-steroidal anti-inflammatory drugs NSAIDs are widely used for managing various conditions including pain, inflammation, arthritis and many musculoskeletal disorders. NSAIDs exert their biological effects by inhibiting the cyclooxygenase (COX) enzyme, which has two main isoforms COX-1 and COX-2. The COX-2 isoform is believed to be directly related to inflammation. Based on structure–activity relationship (SAR) studies of known selective COX-2 inhibitors, our aim is to design and synthesize a novel series of 2-benzamido-N-(4-substituted phenyl)thiophene-3-carboxamide derivatives. These derivatives are intended to be selective COX-2 inhibitors through structural modification of diclofenac and celecoxib. The compound 2-benzamido-5-ethyl-N-(4-fluorophenyl)thiophene-3-carboxamide VIIa demonstrated selective COX-2 inhibition with an IC50 value of 0.29 μM and a selectivity index 67.24. This is compared to celecoxib, which has an IC50 value of 0.42 μM and a selectivity index 33.8. Molecular docking studies for compound VIIa displayed high binding affinity toward COX-2. Additionally, the suppression of protein denaturation with respect to albumin was performed as an indicative measure of the potential anti-inflammatory efficacy of the novel compounds. Compound VIIa showed potent anti-inflammatory activity with 93% inhibition and an IC50 value 0.54 μM. In comparison, celecoxib achieved 94% inhibition with an IC50 value 0.89 μM. Although molecule VIIa demonstrated significant in vitro anti-inflammatory activity, adhered to Lipinski's “five rules” (RO5) and exhibited promising drug-like properties, it showed indications of poor in vivo activity. This limitation is likely due to poor aqueous solubility, which impacts its bioavailability. This issue could be addressed by incorporating the drug in niosomal nanocarrier. Niosomes were prepared using the thin-film hydration technique. These niosomes exhibited a particle size of less than 200 nm, high entrapment efficiency, and an appropriate drug loading percentage. Transmission electron microscopy (TEM) and differential scanning calorimetry (DSC) studies revealed that the niosomes were spherical and demonstrated compatibility of all of its components. The drug release study indicated that the pure drug had limited practicality for in vivo use. However, incorporating the drug into niosomes significantly improved its release profile, making it more suitable for practical use.
1. Introduction
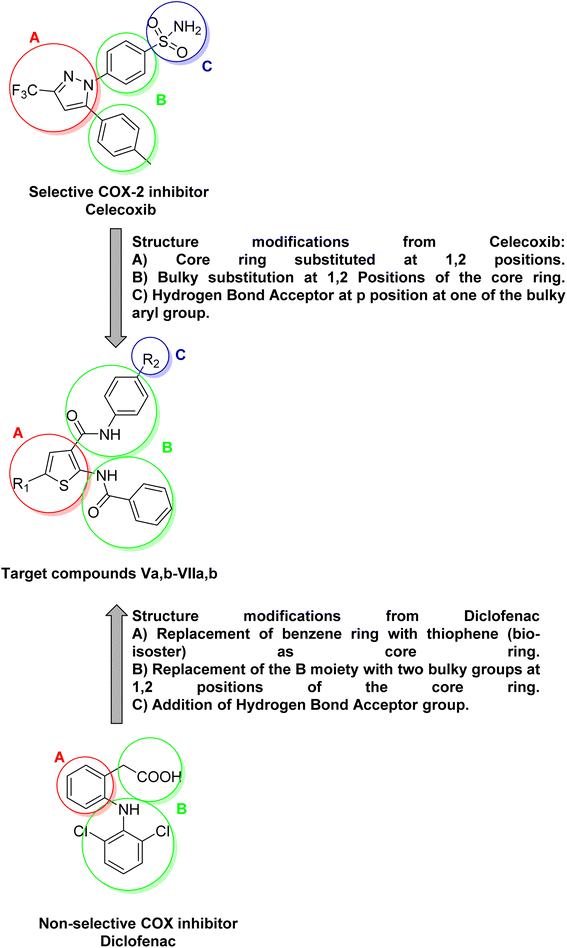
Inflammation is a normal adaptive response to tissue injury, triggered by harmful stimuli such as physical trauma, microbial infections, allergens or noxious chemicals. It is associated with common disorders such as arthritis, asthma, etc.1 The benefits of inflammation as an adaptive response include the destruction of invading organisms and the removal of irritants or foreign bodies, followed by the repair of injured tissue. The anti-inflammatory drugs exert their biological effects by inhibiting the cyclooxygenase COX enzyme, which has two main isoforms COX-1, and COX-2. COX-2 isoform is believed to be responsible for biosynthesis of prostaglandins PGs that are associated with inflammation. Non-steroidal anti-inflammatory drugs NSAIDs are among the most widely used drugs for the treatment of various inflammatory diseases and relieving pain.2 Traditional NSAIDs, such as diclofenac, exert their biological effects by inhibiting both COX-1 and COX-2 isoforms, making them non-selective COX inhibitors. Their non-selective inhibition on COX isoforms can lead to serious adverse effects.3,4 It is worth noting that both COX-1 and COX-2 are highly similar in structure, sharing approximately 60–65% of their amino acid sequence, which makes them almost superimposable. COX isoforms have four domains, with the most crucial being the catalytic domain.5 Although COX-1, and COX-2 isoforms are highly similar in structure, there is a notable structural difference in the active site (catalytic domain) of COX-2.6,7 The COX-2 isoform has an active site that is approximately 20% larger than that of COX-1 and also features a characteristic region for hydrogen bond formation.8 Based on the structural differences between COX-1 and COX-2 isoforms, a variety of selective COX-2 inhibitors have been designed as anti-inflammatory agents. These inhibitors aim to minimize adverse effects associated with COX-1 inhibition.9 The most well-known family of selective COX-2 inhibitors is the COXIBs. Structure–activity relationship (SAR) studies of celecoxib have identified three significant moieties. As shown in (Fig. 1), the first moiety is (A) a central ring substituted at the 1,2 positions. The second one is (B) bulky substitutions at the 1,2 positions of the central ring. The last moiety is (C) hydrogen bond acceptor substitution on the para-position of one of the two bulky aryl groups.10 It is worth noting that, the structure of diclofenac lacks the characteristic hydrogen bond acceptor moiety (C) which is crucial for the selectivity towards COX-2. The aim of this research is to design and synthesize novel selective COX-2 inhibitors by modifying the structures of diclofenac and celecoxib as illustrated in (Fig. 1). The in vitro selectivity toward COX-2 compared to diclofenac and celecoxib as well as the drug-like properties of the novel compounds were investigated.2. Results and discussion
2.1. Chemistry
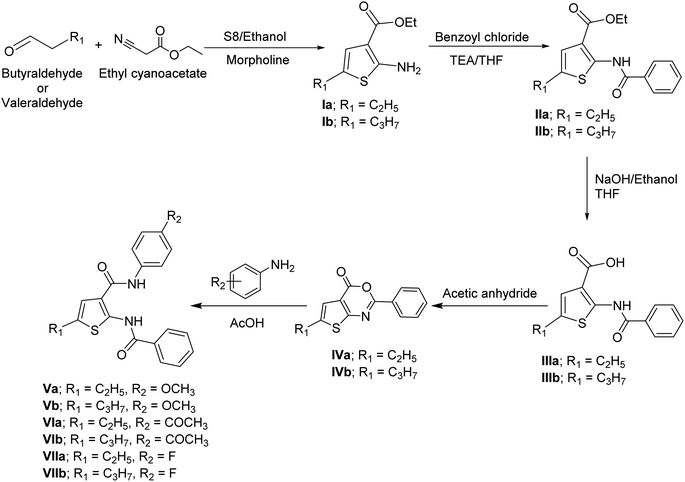
Ethyl 2-aminothiophene-3-carboxylate derivatives Ia,b were obtained in a good yield following Gewald's aminothiophene reaction.11,12 The synthesis of ethyl 2-benzamidothiophene-3-carboxylate derivatives IIa,b was achieved by the reaction of 2-aminothiophene derivatives Ia,b with benzoyl chloride in tetrahydrofuran (THF) in the presence of triethylamine (TEA).13 The synthesis of 2-benzamidothiophene-3-carboxylic acid derivatives IIIa,b was achieved through a hydrolysis reaction. Ethyl 2-benzamidothiophene-3-carboxylate derivatives IIa,b was converted into their corresponding carboxylic acid derivatives by boiling the ester with sodium hydroxide and ethanol in basic hydrolysis reaction, followed by acidification with HCl.14 The synthesis of 4H-thieno[2,3-d][1,3]oxazin-4-one derivatives IVa,b were achieved by refluxing 2-benzamidothiophene-3-carboxylic acid derivatives IIIa,b with acetic anhydride.15 2-Benzamido-N-phenylthiophene-3-carboxamide derivatives Va,b–VIIa,b were obtained by condensation reaction between 4H-thieno[2,3-d][1,3]oxazin-4-one derivatives IVa,b and p-substituted aniline in glacial acetic acid (AcOH) (Scheme 1).15The structures of these newly synthesized compounds Va,b–VIIa,b were confirmed by spectral data (IR spectroscopy, 1H-NMR, 13C-NMR, mass spectroscopy). The IR spectra showed two broad peaks around 3400 and 3350 cm−1, corresponding to the secondary amine groups of the amides. Additionally, two peaks around 1610 and 1530 cm−1, were observed, representing the carbonyl groups of the amides. The 1H-NMR spectra of these compounds revealed two singlets around 12.5 ppm and 10 ppm representing the two exchangeable protons of the two amides. The aromatic region displayed several signals integrating to 10 protons, corresponding to the two benzene rings and the proton of thiophene ring. The aliphatic region showed the characteristic signals for the ethyl and propyl groups in series a and b, respectively. The 13C-NMR spectra showed two signals for the two carbons of the two carbonyl groups at 165 ppm and 160 ppm. The aromatic region showed number of signals corresponding to their aromatic rings. The aliphatic region showed the characteristic signals for the ethyl and propyl groups in series a and b, respectively.
2.2. Biological activity
| Compound | IC50 μM![[thin space (1/6-em)]](https://www.rsc.org/images/entities/char_2009.gif) a a |
Selectivity index (SI)b | |
|---|---|---|---|
| COX-1 | COX-2 | ||
| a IC50 values are calculated as the concentration that make 50% inhibition of COX-1 or COX-2.b Selectivity index (SI) = IC50 (COX1)/IC50 (COX2). | |||
| Va | 24.3 | 1.98 | 12.27 |
| Vb | 26.6 | 3.35 | 7.94 |
| VIa | 21.3 | 0.86 | 24.76 |
| VIb | 15.7 | 1.23 | 12.75 |
| VIIa | 19.5 | 0.29 | 67.24 |
| VIIb | 16.6 | 0.85 | 19.52 |
| Diclofenac | 0.09 | 0.05 | 1.8 |
| Celecoxib | 14.2 | 0.42 | 33.80 |
| Compound | IC50 of inhibition | % inhibition at the higher concentration |
|---|---|---|
| Va | 1.9 | 85% |
| Vb | 3.29 | 78% |
| VIa | 1.34 | 81% |
| VIb | 1.95 | 85% |
| VIIa | 0.54 | 93% |
| VIIb | 1.13 | 86% |
| Celecoxib | 0.89 | 94% |
2.3. In silico studies
| Ligands | Protein | Binding energy (kcal mol−1) | Number of H-bonds | Active site residues | Bonds length (Å) |
|---|---|---|---|---|---|
| Celecoxib | COX-1 | −7.9 | 3 | Ser 353 | 1.96 |
| His 90 | 2.01 | ||||
| Gln 192 | 2.03 | ||||
| COX-2 | −7.50 | 2 | Ser 530 | 1.16 | |
| Arg 120 | 1.23 | ||||
| VIIa | COX-1 | 1.26 | — | — | — |
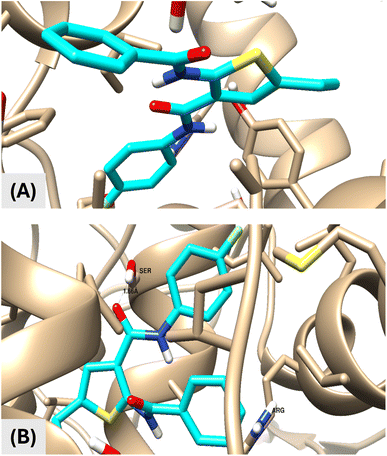
| COX-2 | −14.25 | 1 | Ser 530 | 1.66 | |
| van der Waals interactions Arg 120 |
![[thin space (1/6-em)]](https://www.rsc.org/images/entities/char_2009.gif) P (octanol–water partition coefficient) value of 3.08, 3 H-bond acceptors and 2 H-bond donors. Fig. 3A shows that using the “Boiled Egg” model, the drug appeared in the egg white but not the egg yolk. This indicated that the drug could not pass through the blood-brain barrier, however, it can be passively absorbed through the gastrointestinal tract.
P (octanol–water partition coefficient) value of 3.08, 3 H-bond acceptors and 2 H-bond donors. Fig. 3A shows that using the “Boiled Egg” model, the drug appeared in the egg white but not the egg yolk. This indicated that the drug could not pass through the blood-brain barrier, however, it can be passively absorbed through the gastrointestinal tract.
Some of the predicted physicochemical and pharmacokinetic properties of the drug are listed in Table 4. According to these values, the drug aqueous solubility was shown to be 7.02 × 10⁻⁶ mg mL−1 This indicated that the drug is under the category of poorly water soluble. The gastrointestinal absorption of this drug was predicted to be high. Combining both physicochemical and pharmacokinetic parameters suggests that the drug could be categorized as class II based on biopharmaceutical classification system (BCS).
| Physicochemical properties | Pharmacokinetic behavior | ||
|---|---|---|---|
| Molecular weight | 368.42 g mol−1 | GI absorption | High |
Log![[thin space (1/6-em)]](https://www.rsc.org/images/entities/char_2009.gif) Po/w Po/w |
3.08 | BBB penetration | No |
| Aqueous solubility at 25 °C | 7.02 × 10⁻⁶ mg mL | Log![[thin space (1/6-em)]](https://www.rsc.org/images/entities/char_2009.gif) Kp (skin permeation) Kp (skin permeation) |
−4.93 cm s−1 |
Hence molecular properties of compound VIIa obeyed Lipinski's “five rules” (RO5) and exhibited promising drug-like properties as illustrated in (Fig. 3B). Lipophilicity of compound VIIa was shown by Fig. 3C to be high. This might be participating to the poor aqueous solubility of the compound and high log![[thin space (1/6-em)]](https://www.rsc.org/images/entities/char_2009.gif) Po/w value.
Po/w value.
As a result of these studies, the compound VIIa is suggested to be considered as a “drug candidate” that is an efficient anti-inflammatory with selective COX-1 inhibition effect. According to BCS, the drug is classified as a class II member due to its poor solubility with high GI permeability.
2.4. Development of niosomal formulation to enhance drug efficacy
As stated earlier the drug candidate was predicted to belong to BCS class II. This indicates that the aqueous solubility of this candidate could be a great obstacle facing the delivery of the drug and its practical use. Since the lipophilicity of the drug was shown to be high, a lipid-based nano drug delivery system was shown to be the drug delivery system of choice. Niosomes were chosen to be the nanoparticulate drug delivery system for the delivery of this drug candidate. They are analogous to liposomes in that they could be prepared following the same procedures, under a variety of conditions, leading to the formation of unilamellar or multilamellar vesicular structures.16 When compared to phospholipid-based vesicles, the surfactant vesicles have several advantages such as greater stability, thus lesser care in handling and storage and lower cost. These advantages make surfactant vesicles more attractive than phospholipid ones for industrial applications both in the field of pharmaceutics and cosmetics.17–19 The aim of this section was to improve the delivery of the drug and enhance its dissolution and release characteristics to enhance the practical utility of the drug so that it can be transferred to in vivo studies and clinical phases of the study.The main advantages of using spectrophotometric techniques for determination of drug concentrations in the solutions are the low cost, simplicity and less time consumption.21
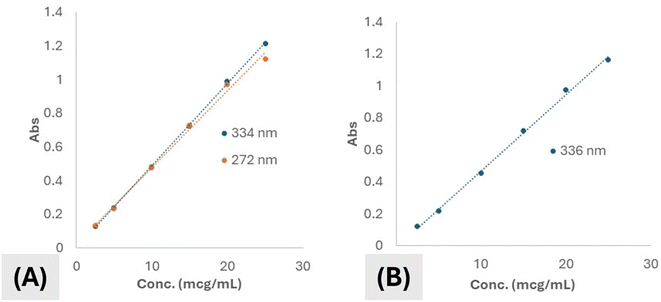
Regarding the alcoholic solution of the drug in study, two absorbance peaks (λmax) were manifested. One appeared at 272 nm while the other appeared at 334 nm. Both peaks showed absorbances that were strongly positively correlated to the concentration of the drug all over the range of concentration used for construction of the calibration curve. However, the peak appearing at 334 was chosen to be the one used for quantification of the drug because of higher regression value for the whole concentration range detected. Calibration curves of the drug in ethanol for both peaks were shown by (Fig. 4A). The absorbance of the drug in ethanol was shown to be following Beer's–Lambert's law within the whole range of concentrations used in the experiment. Linearity range was shown to be from 2.5–25 μg mL−1. The regression coefficient (R2) value was calculated and shown to be 0.9995 suggesting very strong correlation between concentration and absorbance and hence good accuracy and reproducibility.
Calibration curve of the drug in aqueous solution at pH 6.8 was illustrated not to differ so much from ethanol. The absorbance peak was shifted from 334 nm to become 346 nm. This is suggested to take place due to protonation of some active centers in the molecule. Also, the regression was also reliable, yet, it was reduced as compared to that of the drug in ethanol. Calibration curve of the drug at pH 6.8 is illustrated by (Fig. 4B).
| Yield (%) | Particle size (nm) | Span | Entrapment efficiency | Drug loading (%) | |
|---|---|---|---|---|---|
| PNi | 88.41% ± 3.04 | 107.33 ± 1.15 | 1.08 ± 0.06 | — | — |
| DNi | 85.73% ± 2.97 | 116.00 ± 3.6 | 1.12 ± 0.13 | 78.28% ± 3.01 | 23.81% ± 2.74 |
As shown by (Table 5), yield percentage values of both formulae exceeded 85%. This could be generally considered to be an efficient system for industrial scale up. The yield of PNi was shown to be slightly, yet significantly, higher than that of the DNi system. This was reported in many nanocarrier systems.22 This was suggested to take place as a result of the infusion of some of the drug to the medium resulting in reduction in the final overall weight of the formulated particles.23
It was clearly demonstrated, regarding particle size and particle size distribution, expressed as span value, that both PNi and DNi formulations were of appropriate particle size range and distribution. Particles of size below 150 nm manifested extraordinary characteristic including increasing solubility and penetration of drugs.24 Both PNi and DNi showed particle sizes below 150 nm and span values indicating almost a single particles population with narrow distribution. Nevertheless, incorporating the drug in nanoparticles resulted in mild increase in the particles size, however, the changed particles size remained below 150 nm, indicating no major change in the enhancing solubility capabilities of the nanosystem.24
Particles showed a good entrapment of the drug. The value of percentage drug entrapped within the particles was suggested to be high due of two reasons; the first is the technique used and the second one is that the drug was of high solubility in the base used and low solubility in the external phase (aqueous phase).25 The drug loading of DNi suggested that the particles could be properly used for delivering the drug at its therapeutics dose without the use of much weight of the formula.
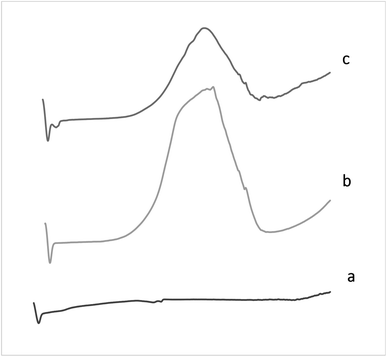
By comparing the DSC thermograms of the pure drug, PNi formula, and DNi niosomes, it was clearly evidenced that the drug was totally dispersed at molecular level in niosomes. This is indicated through the absence of the endothermic peak of the pure drug in the drug-loaded nanoparticles thermogram.23 This was clearly illustrated by (Fig. 5).
The solubility of a drug can significantly impact its bioavailability, absorption rate, and ultimately, its effectiveness as a therapeutic agent. This illustrates the importance of incorporating the drug candidate in a niosomal nanocarrier in order to enhance solubility, improve release pattern and finally improve bioavailability.26,27
3. Materials and methods
3.1. Chemistry
“Stuart melting point apparatus SMP10 was used for melting points determination. Melting points were uncorrected. Vector 22 infrared spectrophotometer (υmax in cm−1) was used to measure infrared (IR) spectra. Nuclear magnetic resonance 1H NMR spectra were recorded on Bruker spectrometer (400–500 MHz). 13C NMR spectra were carried out at either 100 or 125 MHz. Chemical shifts (δ) are indicated in ppm. Electron impact mass spectra (EI-MS) were recorded on a Finnigan MAT 312 mass spectrometer.Compound IIIa: white powder; yield 92%; m.p.: 201–202 °C as reported.34
Compound IIIb: reddish white powder; yield 90%; m.p.: 162–164 °C. 1H NMR (400 MHz, DMSO-d6) δ 12.96 (s, 1H, OH), 11.75 (s, 1H, NH), 7.68–7.66 (d, J = 7.3 Hz, 2H), 7.45–7.35 (m, 3H), 6.68 (s, 1H), 2.46–2.43 (t, J = 7.3 Hz, 2H), 1.40–1.35 (m, 2H), 0.70–0.66 (t, J = 7.3 Hz, 3H). 13C NMR (100 MHz, DMSO-d6) δ 167.20, 163.01, 146.41, 135.04, 133.28, 132.41, 129.70, 127.52, 121.26, 113.98, 31.13, 24.52, 13.85.
3.2. Biological evaluation
The experimental protocols were approved by the Ethics Committee of the Suez Canal University with code 201802M1. We would like to confirm that our study does not involve any experiments with live subjects; all experiments were conducted in vitro, not in vivo.3.3. In silico studies
3.4. Development of niosomal formulation to enhance drug delivery and efficacy
An accurately and precisely weighed amount of the drug, 10 mg, was dissolved in 100 mL of ethanol to form a solution of concentration of 100 μg mL−1. Aliquots of the formed solution were withdrawn and diluted properly with ethanol to form a series of solutions ranging in concentration from 2.5–25 μg mL−1 of the drug in ethanol. The absorbance of each concentration at λmax was determined and recorded.
Experiment was repeated three times to assure reproducibility of method. Average absorbance was plotted against concentration to construct calibration curve.
The calibration curves of the drug in phosphate buffers of pH 6.8 was constructed following the same method but with replacing ethanol with phosphate buffer of pH 6.8 (BP 2013). This was done to quantify the drug in the in vitro release study.44
![[thin space (1/6-em)]](https://www.rsc.org/images/entities/char_2009.gif) :
:![[thin space (1/6-em)]](https://www.rsc.org/images/entities/char_2009.gif) 60
60![[thin space (1/6-em)]](https://www.rsc.org/images/entities/char_2009.gif) :
:![[thin space (1/6-em)]](https://www.rsc.org/images/entities/char_2009.gif) 1 w/w, respectively), were dissolved in 10 mL of chloroform
1 w/w, respectively), were dissolved in 10 mL of chloroform![[thin space (1/6-em)]](https://www.rsc.org/images/entities/char_2009.gif) :
:![[thin space (1/6-em)]](https://www.rsc.org/images/entities/char_2009.gif) methanol mixture (1
methanol mixture (1![[thin space (1/6-em)]](https://www.rsc.org/images/entities/char_2009.gif) :
:![[thin space (1/6-em)]](https://www.rsc.org/images/entities/char_2009.gif) 1, v/v) in a round-bottom flask using a BUCHI Rotavapor (Buchi R-215 Advanced Rotavapor with V-Condensor and V-850 Controller). Afterwards, the organic solvents were removed under vacuum in a rotary evaporator at 40 °C for 20 min. To form a thin film; and kept in a desiccator under vacuum for 2 h to ensure total removal of trace solvents. Afterwards, hydration of the film was carried out using 5 mL of distilled water at 55 °C. The niosomal suspension was then sonicated for 15 minutes using a probe sonicator (Fisherbrand™ Model 120, Thermo Fisher Scientific Inc., MA, USA).
1, v/v) in a round-bottom flask using a BUCHI Rotavapor (Buchi R-215 Advanced Rotavapor with V-Condensor and V-850 Controller). Afterwards, the organic solvents were removed under vacuum in a rotary evaporator at 40 °C for 20 min. To form a thin film; and kept in a desiccator under vacuum for 2 h to ensure total removal of trace solvents. Afterwards, hydration of the film was carried out using 5 mL of distilled water at 55 °C. The niosomal suspension was then sonicated for 15 minutes using a probe sonicator (Fisherbrand™ Model 120, Thermo Fisher Scientific Inc., MA, USA).The niosomal suspension was left to mature overnight at 4 °C and stored at refrigerator temperature for further studies.
![[thin space (1/6-em)]](https://www.rsc.org/images/entities/char_2009.gif) 000 rpm. The crop of solid residue was collected, left to dry, and weighed (Cubis® II Essentials MCE, Sartorius AG, Göttingen, Germany). Yield percent was calculated using the following formula:
000 rpm. The crop of solid residue was collected, left to dry, and weighed (Cubis® II Essentials MCE, Sartorius AG, Göttingen, Germany). Yield percent was calculated using the following formula:| Yield percent = (Wr/Wi) × 100 |
Span value was used for measuring the extent of particle size distribution.
![[thin space (1/6-em)]](https://www.rsc.org/images/entities/char_2009.gif) 000 rpm for 2 cycles each spent 60 min. To separate the niosomes from the aqueous phase (HERMLE Labortechnik GmbH, Germany).
000 rpm for 2 cycles each spent 60 min. To separate the niosomes from the aqueous phase (HERMLE Labortechnik GmbH, Germany).The supernatant was then decanted, filtered with 0.2 μm filter, and analyzed by UV-VIS spectroscopy at 334 nm (cf. ESI†). The amount of free drug was determined and the percent entrapment efficiency (EE%) of the drug was given by the formula:48,49
| EE% = ((WL − WF)/WL) × 100 |
While the percent drug loading (DL%) was given by the formula:48,49
| DL% = ((WL − WF)/WtN) ×100 |
Samples of the pure drug were left to dry completely at room temperature. A samples of 3 mg each was placed in 40 μL aluminum pans and then crimped inside them upon closure of the pans using special piston. Sample-containing pan was then heated up at a rate of 10 °C min−1. Under constant purging of nitrogen gas at a rate equivalent to 30 mL min−1 (Shimadzu® DSC-60, Kyoto, Japan). The thermal range used was between 25 °C and 350 °C. A reference of an empty aluminum pan having the same dimensions and quality was used for comparing differences in energy absorption or release by the sample.50,52 Peaks were then analyzed using Shimadzu® DSC-60 data analysis software.
4. Conclusions
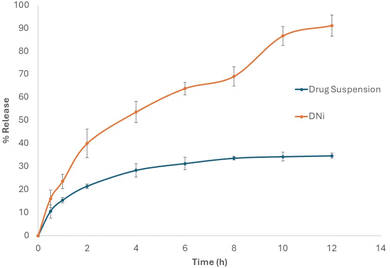
Based on SAR studies of the known selective COX-2 inhibitors, a novel series of 2-benzamido-N-phenylthiophene-3-carboxamide derivatives was designed, synthesized and identified as selective COX-2 inhibitors. The inhibitory activity of the novel compounds was evaluated against both COX-1 and COX-2 isoforms. Compound 2-benzamido-5-ethyl-N-(4-fluorophenyl)thiophene-3-carboxamide VIIa showed selective COX-2 inhibition with IC50 0.29 μM and selectivity index 67.24 comparable to celecoxib with IC50 value of 0.42 μM and selectivity index 33.8. Molecular docking studies for the most active compound VIIa displayed high binding affinity inside COX-2 active site. The suppression of protein denaturation with respect to albumin was a performed as suggestive indicator for the probable anti-inflammatory efficacy of the novel compounds. Compound VIIa showed potent anti-inflammatory activity having 93% inhibition with IC50 value 0.54 μM compared to celecoxib with 94% inhibition and IC50 value 0.89 μM. Despite being effective, compound VIIa as a drug candidate suffered a massive drawback which is its poor aqueous solubility. The drug candidate was incorporated in a niosomal nanocarrier drug delivery system to overcome this limiting characteristic and improve its effectiveness. The prepared nanosystem proved physicochemical suitability as a nano drug delivery system with no incompatibility with the drug candidate. The pattern of release of the drug candidate from the niosomal system proved its efficiency to enhance drug solubility, release pattern, and suggested enhance bioavailability at last. Further work regarding formulating the DNi in an oral fast dissolving films, the in vivo efficacy of the drug, safety, pharmacokinetic behavior, and pharmacodynamic characteristics determination will be considered in the future work.Data availability
Data supporting this study are openly available from the corresponding authors.Author contributions
Conceptualization, Y. M. A.-A.; P. A. H.; M. E. and M. M. S. methodology, Y. M. A.-A.; P. A. H.; and M. E.; software, Y. M. A.-A.; P. A. H.; and M. E.; investigation, Y. M. A.-A.; P. A. H.; and M. E.; resources, Y. M. A.-A.; P. A. H.; and M. E.; data curation, Y. M. A.-A.; P. A. H.; S. R.; A. B. and M. E.; writing—original draft preparation, Y. M. A.-A.; P. A. H.; and M. E.; writing—review and editing, all; funding acquisition, A. B. All authors have read and agreed to the published version of the manuscript.Conflicts of interest
The authors declare no conflicts of interest.Acknowledgements
The authors would like to extend their sincere appreciation to the Researchers Supporting Project (RSP2024R64), King Saud University, Riyadh, Saudi Arabia. Authors acknowledge Dr Mohamed S. Nafie [Department of Chemistry, College of Sciences, University of Sharjah, Sharjah (P. O. 27272), United Arab Emirates (UAE); and Chemistry Department, Faculty of Science, Suez Canal University, Ismailia, (P.O. 41522), Egypt] who conducted in vitro COX-1 and COX-2 inhibition assays, egg albumin assay, and a molecular docking study using AutoDock Vina with Chimera.References
- R. Korbut and T. J. Guzik, in Nijkamp and Parnham's Principles of Immunopharmacology, ed. F. P. Nijkamp and M. J. Parnham, Springer, 2019, pp. 139–163 Search PubMed.
- S. Fiorucci, R. Meli, M. Bucci and G. Cirino, Biochem. Pharmacol., 2001, 62, 1433–1438 CrossRef CAS.
- S. Bindu, S. Mazumder and U. Bandyopadhyay, Biochem. Pharmacol., 2020, 180, 114–147 CrossRef.
- K. Schrör and M. Voelker, in NSAIDs and Aspirin, ed. A. Lanas, Springer, Cham, 2016, pp. 107–122, DOI:10.1007/978-3-319-33889-7_7.
- P. Rao and E. E. Knaus, J. Pharm. Pharm. Sci., 2008, 11, 81s–110s Search PubMed.
- P. Świątek, M. Strzelecka, R. Urniaz, K. Gębczak, T. Gębarowski, K. Gąsiorowski and W. Malinka, Bioorg. Med. Chem., 2017, 25, 316–326 CrossRef.
- D. L. Simmons, R. M. Botting and T. Hla, Pharmacol. Rev., 2004, 56, 387–437 CrossRef CAS.
- L. Dong, A. J. Anderson and M. G. Malkowski, Biochemistry, 2019, 58, 3990–4002 CrossRef CAS.
- A. A. Mabrouk, M. I. Tadros and W. M. El-Refaie, J. Drug Delivery Sci. Technol., 2021, 61, 102240–102252 CrossRef CAS.
- G. Carullo, F. Galligano and F. Aiello, MedChemComm, 2017, 8, 492–500 RSC.
- R. Mayer and K. Gewald, Angew. Chem., Int. Ed. Engl., 1967, 6, 294–306 CrossRef CAS.
- R. W. Sabnis, Sulfur Rep., 1994, 16, 1–17 CrossRef CAS.
- T. J. Reilly, J. Chem. Educ., 1999, 76, 1557 CrossRef CAS.
- V. Theodorou, M. Alagiannis, N. Ntemou, A. Brentas, P. Voulgari, V. Polychronidou, M. Gogou, M. Giannelos and K. Skobridis, J. Org. Chem., 2018, 308–319 CAS.
- M. T. Bogert and H. A. Seil, J. Am. Chem. Soc., 1905, 27, 1305–1310 CrossRef.
- I. F. Uchegbu and A. T. Florence, Adv. Colloid Interface Sci., 1995, 58, 1–55 CrossRef CAS.
- A. Manosroi, P. Wongtrakul, J. Manosroi, H. Sakai, F. Sugawara, M. Yuasa and M. Abe, Colloids Surf., B, 2003, 30, 129–138 CrossRef CAS.
- C. Terzano, L. Allegra, F. Alhaique, C. Marianecci and M. Carafa, Eur. J. Pharm. Biopharm., 2005, 59, 57–62 CrossRef CAS.
- D. Paolino, R. Muzzalupo, A. Ricciardi, C. Celia, N. Picci and M. Fresta, Biomed. Microdevices, 2007, 9, 421–433 CrossRef CAS.
- O. Mozgova, M. Blazheyevskiy, L. Kryskiw, T. Kucher, O. Shliusar and V. Moroz, Chem. Pap., 2024, 6585–6591, DOI:10.1007/s11696-024-03558-4.
- M. Bakshi and S. Singh, J. Pharm. Biomed. Anal., 2002, 28, 1011–1040 CrossRef CAS.
- R. A. Hashad, R. A. H. Ishak, S. Fahmy, S. Mansour and A. S. Geneidi, Int. J. Biol. Macromol., 2016, 86, 50–58 CrossRef CAS.
- P. A. Hanna, M. M. Ghorab and S. Gad, Anti-Inflammatory Anti-Allergy Agents Med. Chem., 2019, 18, 26–44 CrossRef CAS.
- M. Danaei, M. Dehghankhold, S. Ataei, F. Hasanzadeh Davarani, R. Javanmard, A. Dokhani, S. Khorasani and M. Mozafari, Pharmaceutics, 2018, 10, 57–74 CrossRef.
- V. Ravalika and A. K. Sailaja, Nano Biomed. Eng., 2017, 9, 242–248 CAS.
- Z. Sezgin-Bayindir, M. N. Antep and N. Yuksel, AAPS PharmSciTech, 2015, 16, 108–117 CrossRef CAS.
- K. T. Savjani, A. K. Gajjar and J. K. Savjani, Int. Scholarly Res. Not., 2012, 2012, 195727–195737 Search PubMed.
- F. J. Tinney, W. A. Cetenko, J. J. Kerbleski, D. T. Connor, R. J. Sorenson and D. J. Herzig, J. Med. Chem., 1981, 24, 878–882 CrossRef CAS.
- Z. Szlávik, L. Ondi, M. Csékei, A. Paczal, Z. B. Szabó, G. b. Radics, J. Murray, J. Davidson, I. Chen and B. Davis, J. Med. Chem., 2019, 62, 6913–6924 CrossRef.
- L. Ouyang, L. Zhang, J. Liu, L. Fu, D. Yao, Y. Zhao, S. Zhang, G. Wang, G. He and B. Liu, J. Med. Chem., 2017, 60, 9990–10012 CrossRef CAS.
- K. Clausen and L. SO, Nouv. J. Chim., 1980, 4, 43–46 CAS.
- A. M. Zaino, R. C. Dash, S. J. James, N. MacGilvary, A. Crompton, K. S. McPherson, M. Stanzione, D. M. Korzhnev, N. J. Dyson and N. Chatterjee, Bioorg. Med. Chem., 2024, 106, 117755–117765 CrossRef CAS.
- N. D. Smith, WO2009/026241A1, 2009.
- I. Kharizomenova, N. Samsonova, N. Kaplina, M. Kapustina and A. Grinev, Khim. Geterotsikl. Soedin., 1980, 45–46 CAS.
- K. R. A. Abdellatif, W. A. A. Fadaly, Y. A. Mostafa, D. M. Zaher and H. A. Omar, Bioinorg. Chem., 2019, 91, 103–132 Search PubMed.
- B. Roschek Jr, R. C. Fink, D. Li, M. McMichael, C. M. Tower, R. D. Smith and R. S. Alberte, J. Med. Food, 2009, 12, 615–623 CrossRef.
- Y. Mizushima and M. Kobayashi, J. Pharm. Pharmacol., 1968, 20, 169–173 CrossRef CAS.
- G. Rimon, R. S. Sidhu, D. A. Lauver, J. Y. Lee, N. P. Sharma, C. Yuan, R. A. Frieler, R. C. Trievel, B. R. Lucchesi and W. L. Smith, Proc. Natl. Acad. Sci. U. S. A., 2010, 107, 28–33 CrossRef CAS.
- J. R. Kiefer, J. L. Pawlitz, K. T. Moreland, R. A. Stegeman, W. F. Hood, J. K. Gierse, A. M. Stevens, D. C. Goodwin, S. W. Rowlinson and L. J. Marnett, Nature, 2000, 405, 97–101 CrossRef CAS.
- O. Trott and A. J. Olson, J. Comput. Chem., 2010, 31, 455–461 CrossRef CAS.
- A. T. Boraei, E. H. Eltamany, I. A. Ali, S. M. Gebriel and M. S. Nafie, Bioinorg. Chem., 2021, 111, 104877–104891 CrossRef CAS.
- B. Steinfeld, J. Scott, G. Vilander, L. Marx, M. Quirk, J. Lindberg, K. Koerner and J. Behav, Health Serv. Res., 2015, 42, 504–518 Search PubMed.
- Y. P. Pancham, B. Girish and S. S. Sanjay, J. Pharm. Innov., 2020, 9, 5–8 CAS.
- I. Takeuchi, Y. Taniguchi, Y. Tamura, K. Ochiai and K. Makino, Colloids Surf., A, 2018, 537, 411–417 CrossRef CAS.
- S. Sangkana, K. Eawsakul, T. Ongtanasup, R. Boonhok, W. Mitsuwan, S. Chimplee, A. K. Paul, S. S. Saravanabhavan, T. Mahboob and M. Nawaz, Nanoscale Adv., 2024, 6, 1467–1479 RSC.
- Y. Thabet, M. Elsabahy and N. G. Eissa, Methods, 2022, 199, 9–15 CrossRef CAS.
- J. J. Muso-Cachumba, G. Ruiz-Lara, G. Monteiro and C. d. O. Rangel-Yagui, Braz. J. Pharm. Sci., 2023, 59, e23365–e23374 CrossRef CAS.
- T. A. Ahmed, BMC Pharmacol. Toxicol., 2020, 21, 1–12 CrossRef.
- P. A. Hanna, H. A. Al-Abbadi, M. A. Hashem, A. E. Mostafa, Y. K. Mahmoud, E. A. Ahmed, I. M. Hegab, I. E. Helal and M. F. Ahmed, Int. J. Pharm.: X, 2024, 8 DOI:10.1016/j.ijpx.2024.100284.
- R. B. Guerra, D. A. Gálico, B. B. Holanda and G. Bannach, J. Therm. Anal. Calorim., 2016, 123, 2523–2530 CrossRef CAS.
- C. Leyva-Porras, P. Cruz-Alcantar, V. Espinosa-Solís, E. Martínez-Guerra, C. I. Piñón-Balderrama, I. Compean Martínez and M. Z. Saavedra-Leos, Polymers, 2019, 12, 5–26 CrossRef.
- A. A. Wassel, Biomed. J., 2018, 2, 1–5 Search PubMed.
- P. Pandey, K. Dua and H. Dureja, Int. J. Biol. Macromol., 2019, 139, 1304–1316 CrossRef CAS.
- G. Nerli, S. Robla, M. Bartalesi, C. Luceri, M. D'Ambrosio, N. Csaba and F. Maestrelli, Carbohydr. Polym. Technol. Appl., 2023, 6, 100332–100341 CAS.
- R. Sirati, A. E. Khajehrahimi, R. Kazempoor, S. Kakoolaki and A. Ghorbanzadeh, Heliyon, 2024, 10, e26486–e26497 CrossRef CAS.
Footnotes |
| † Electronic supplementary information (ESI) available. See DOI: https://doi.org/10.1039/d4ra06295g |
| ‡ These authors contributed equally. |
| This journal is © The Royal Society of Chemistry 2024 |

