DOI:
10.1039/D4RA06347C
(Paper)
RSC Adv., 2024,
14, 32802-32817
Synthesis and characterization of novel uranyl clusters supported by bis(pyrazolyl) methane ligands: biomimetic catalytic oxidation, BSA protein interaction and cytotoxicity studies†
Received
2nd September 2024
, Accepted 9th October 2024
First published on 17th October 2024
Abstract
Two novel uranyl complexes were synthesized using bis-pyrazolyl methane ligands. The complexes were characterized by several spectroscopic techniques, including UV-Vis, IR, NMR, mass spectrometry, fluorescence, electrochemical, and thermogravimetric analysis. The solid-state structure of the complex C1 was determined with the help of single-crystal X-ray diffraction studies. The complexes C1 and C2 efficiently catalyse the oxidation of 3,5-di-tert-butyl catechol and 2-aminophenol in the atmospheric air, imitating the catalytic activity of the catechol oxidase and phenoxazinone synthase enzymes. The kinetic parameters and the catalytic efficiency (Kcat/KM) of the reactions were calculated. Formation of organic free radicals in the catalytic reactions was confirmed by EPR spectroscopy. The interaction of these complexes with the protein, bovine serum albumin, was investigated by using UV-Vis and fluorescence spectral analysis. The cytotoxicity of the complexes against MDAMB-231 and A549 cell lines was investigated, and IC50 values were determined.
Introduction
Depleted uranium, which is a major contributor to radioactive wastes, constitutes a critical environmental challenge in the present world.1,2 Therefore, using its compounds in functional materials can have an impact on reducing environmental risk, creating a secure environment, and contributing to sustainability.
In recent years, there has been a surge in the synthesis and modeling of uranyl complexes due to their interesting structural diversities and unique coordination properties, making these complexes have potential applications in the fields of catalysis, photocatalysis, fluorescent materials, hydrogen evolution, gas storage, and sensing.3–10 Significant advancements in the catalytic chemistry of uranyl complexes have occurred over the past 20 years. Uranyl complexes have the proclivity to display various oxidation stages varying from +2 to +6. UO2n+ uranyl ions, where n can be 1 or 2, comprise the majority of the higher oxidation state of uranyl complexes. And UO22+ is the most prevalent form in the environment.11
Uranyl complexes play an important role in biochemistry because of their interaction with biological molecules. Uranyl salts, specifically nitrate and acetate, are commonly employed as contrast agents in electron microscopy.12 Sulfadiazine-azo-azomethine dye-based uranyl complexes have demonstrated bactericidal activity against Gram-positive bacteria, as well as fungicidal action.13,14 Across the years, Schiff base uranyl complexes have shown oncolytic,15 antibacterial, and anti-fungal efficacy. These complexes show photoluminescence properties; thus, they can be used as spectroscopic markers or probes.16 A wide range of proteins have been known to interact with the uranyl ion, which includes proteins associated with blood, bone growth, and intracellular proteins.17,18
Pyrazoles are a class of heterocyclic aromatic compounds known for their biological applications. Trofimenko pioneered the development of bis(pyrazolyl)alkane derivatives, which have now become a well-established category of stable bidentate ligands.19 Bis(pyrazolyl)methane supported complexes have been explored in various fields including, in the development of antimicrobials,20,21 catalysts for organic transformation reactions,22,23 and dye sensitized solar cells.24 However, the coordination chemistry of bis(pyrazolyl)alkane ligands with uranyl ions has not been explored.
This work reports the synthesis and characterization of novel uranyl complexes supported by bis(pyrazolyl)methane ligands, and exploring their catalytic activity in the oxidation of catechol to quinone and oxidative dimerization of 2-amino phenol to 2-amino-phenoxazine-3-one. To the best of our knowledge, this is the first uranyl complex used for the oxidation of 2-aminophenol. Also, this work investigates the interaction studies of the metal complex with BSA protein and the anti-cancer activity of the complex with the MTT lung cancer cells and MTT breast cancer cells.
Experimental
Synthesis of ligands
The preparation of the ligands, bis(pyrazolyl)methane (L1) and bis(3,5-dimethyl pyrazolyl)methane. (L2) (Fig. 1) was done according to the methods described in the literature.20,25 Both the ligands were duly characterized using spectro-analytical techniques.
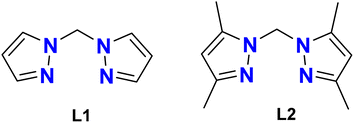 |
| | Fig. 1 Structure of ligands, L1 (bis(pyrazolyl)methane) and L2 (bis(3,5-dimethyl pyrazolyl)methane). | |
Synthesis of complexes
In a general procedure, 1.5 mmol of the ligand was dissolved in 5 mL of methanol and to which 1.5 mmol of uranyl acetate, dissolved in methanol (5 mL) was added with continuous stirring. The solution was stirred for a period of 2 h at room temperature. The solid product was obtained by slow evaporation of the solvent, which was washed with hexane and dried under air.
[(L1)2(UO2)4(H2O)2(OAc)2] C1. Yield 92%; M.P. 196–200 °C; IR (KBr, selected, cm−1) 3780 (m), 3330 (b), 3024 (m), 2923 (m), 2361 (w), 1550 (m), 1464 (m), 1338 (m), 1268 (s), 1144 (m), 1003 (m), 919 (s), 807 (s), 675.36 (s), 522 (s), 469 (w); UV-Vis (MeOH, 10−4 M) (λ in nm (Abs.) 205 (1.217), 222.5 (1.622), 262.5 (0.545)); 1H NMR (DMSO-d6, 500 MHz, 298 K, ppm) δ 7.94 (2H, b, 5-CHpz), 7.50 (2H, b, 3-CHpz), 6.39 (2H, s, CH2), 6.28 (2H, b, 4-CHpz); 13C{1H} NMR (DMSO-d6, 125 MHz, 298 K, ppm) δ 140.48 (3-CHpz), 131.02 (5-CHpz), 106.70 (4-CHpz), 64.65 (CH2).
[(L2)2(UO2)4(H2O)2(OAc)2] C2. Yield: 90%; M.P. 208–210 °C; IR (KBr, selected, cm−1) 3330 (b), 3024 (m), 2923 (m), 2361 (w), 1550 (m), 1464 (m), 1338 (m), 1268 (s), 1144(m), 919 (s), 807 (s), 675 (s), 522 (m). UV-Vis (MeOH, 10−4 M) (λ in nm (Abs.) 220 (1.807), 265 (1.028)); 1H NMR (CDCl3, 500 MHz, 298 K, ppm) δ 6.03 (s, 2H, CHpz), 5.81 (s, 2H, –CH2–), 2.40 (s, 3H, CH3 pz), 2.06 (s, 3H, CH3 pz); 13C{1H} NMR (CDCl3, 125 MHz, 298 K, ppm) δ 147.51 (pz(3)-CCH3), 140.44 (pz(5)-CCH3), 106.0 (pz(4)-CH), 59.29 (pz-CH2-pz), 13.78 (pz(3)-CCH3), 11.19 (pz(5)-CCH3).
X-ray crystal studies
Single crystal X-ray analysis of complex C1 was performed using a yellow, block-shaped crystal (size – 0.29 × 0.12 × 0.07 mm3). A Bruker D8 Quest apparatus was used to obtain the diffraction data at 300 K. For the analysis, SADABS multi-scan absorption correction technique was used and data integration was done by using SAINT. Bruker SHELXTL package was used to solve and refine the structure.26,27 Non-hydrogen atoms were represented anisotropically and hydrogen atoms were treated isotropically using a riding model (HFIX 43) at predefined places. The images and data provided in this article were produced by the WinGX suit28 and Mercury.29 Details of the crystallographic data are provided in ESI.†
Catecholase activity and kinetic studies
A well-known model compound, 3,5-di-tert-butylcatechol (DTBC) was used as the substrate to investigate the catecholase activity of the uranyl complexes. Using a UV-Vis spectrophotometer, the conversion of the substrate (DTBC) to the oxidised species 3,5-di-tert-butyl benzoquinone (DTBQ) was monitored at 400 nm over the course of 120 minutes at room temperature, in methanol, with observations made every 10 minutes. The catalyst-to-substrate ratio for the reaction was set to be 1![[thin space (1/6-em)]](https://www.rsc.org/images/entities/char_2009.gif) :
:![[thin space (1/6-em)]](https://www.rsc.org/images/entities/char_2009.gif) 100 (0.1 mmol
100 (0.1 mmol![[thin space (1/6-em)]](https://www.rsc.org/images/entities/char_2009.gif) :
:![[thin space (1/6-em)]](https://www.rsc.org/images/entities/char_2009.gif) 10 mmol). Further, the reaction parameters, i.e., solvent, pH, temperature, etc. were varied to achieve the optimum catalytic activity. The kinetic studies were conducted and the kinetic parameters such Vmax, KM and Kcat were calculated from Michaelis Menten equation plot and Lineweaver Burk plot.30,31
10 mmol). Further, the reaction parameters, i.e., solvent, pH, temperature, etc. were varied to achieve the optimum catalytic activity. The kinetic studies were conducted and the kinetic parameters such Vmax, KM and Kcat were calculated from Michaelis Menten equation plot and Lineweaver Burk plot.30,31
Phenoxazinone synthase-like activity and kinetic studies
The metal complexes were utilized to perform the phenoxazinone synthase activity, with 2-amino phenol serving as the model substrate. The reactions were carried out at ambient temperature under aerobic conditions, utilizing water: methanol mixture (1![[thin space (1/6-em)]](https://www.rsc.org/images/entities/char_2009.gif) :
:![[thin space (1/6-em)]](https://www.rsc.org/images/entities/char_2009.gif) 1) as the solvent. Various catalyst-to-substrate ratios such as 1
1) as the solvent. Various catalyst-to-substrate ratios such as 1![[thin space (1/6-em)]](https://www.rsc.org/images/entities/char_2009.gif) :
:![[thin space (1/6-em)]](https://www.rsc.org/images/entities/char_2009.gif) 50, 1
50, 1![[thin space (1/6-em)]](https://www.rsc.org/images/entities/char_2009.gif) :
:![[thin space (1/6-em)]](https://www.rsc.org/images/entities/char_2009.gif) 100, 1
100, 1![[thin space (1/6-em)]](https://www.rsc.org/images/entities/char_2009.gif) :
:![[thin space (1/6-em)]](https://www.rsc.org/images/entities/char_2009.gif) 200 and 1
200 and 1![[thin space (1/6-em)]](https://www.rsc.org/images/entities/char_2009.gif) :
:![[thin space (1/6-em)]](https://www.rsc.org/images/entities/char_2009.gif) 500 were tested to determine the catalyst's effectiveness. To understand the effects of solvents on the activity of phenoxazinone synthase, we conducted a reaction using various solvents, including water methanol and DMSO. The reactions were monitored and analysed using spectrophotometer analysis. The progress of the reaction was tracked by observing an increase in the distinct absorption peak of the resulting compound, 2-amino-phenoxazine-3-one, at a wavelength of 425 nm over a duration of 2 hours. The analysis was conducted at 10 minute intervals. The rate of the reactions was calculated using the initial slope of the plot of absorbance vs. time. We determined the T∞ value to calculate the rate in terms of concentration. To understand the effect of substrate concentration on the rate of the reactions, a Michaelis Menten plot was constructed and various kinetic parameters were calculated using Lineweaver Burk Plot.30,32
500 were tested to determine the catalyst's effectiveness. To understand the effects of solvents on the activity of phenoxazinone synthase, we conducted a reaction using various solvents, including water methanol and DMSO. The reactions were monitored and analysed using spectrophotometer analysis. The progress of the reaction was tracked by observing an increase in the distinct absorption peak of the resulting compound, 2-amino-phenoxazine-3-one, at a wavelength of 425 nm over a duration of 2 hours. The analysis was conducted at 10 minute intervals. The rate of the reactions was calculated using the initial slope of the plot of absorbance vs. time. We determined the T∞ value to calculate the rate in terms of concentration. To understand the effect of substrate concentration on the rate of the reactions, a Michaelis Menten plot was constructed and various kinetic parameters were calculated using Lineweaver Burk Plot.30,32
Detection of hydrogen peroxide in the oxidation of DTBC
The catalytic mixture was prepared in 1![[thin space (1/6-em)]](https://www.rsc.org/images/entities/char_2009.gif) :
:![[thin space (1/6-em)]](https://www.rsc.org/images/entities/char_2009.gif) 10 (catalyst
10 (catalyst![[thin space (1/6-em)]](https://www.rsc.org/images/entities/char_2009.gif) :
:![[thin space (1/6-em)]](https://www.rsc.org/images/entities/char_2009.gif) substrate) ratio in methanol (10 mL). After 2 h of reaction the reaction mixture was mixed with water (10 mL) and extracted using dichloromethane. The aqueous layer was acidified with 0.1 M H2SO4 and maintained a pH of ∼2. 1 mL of 10% KI was added to the acidified solution, followed by 2–3 drops of 3% ammonium molybdate. The solution turns bluish black and the formation of I3− was detected using a UV-Vis spectrophotometer.
substrate) ratio in methanol (10 mL). After 2 h of reaction the reaction mixture was mixed with water (10 mL) and extracted using dichloromethane. The aqueous layer was acidified with 0.1 M H2SO4 and maintained a pH of ∼2. 1 mL of 10% KI was added to the acidified solution, followed by 2–3 drops of 3% ammonium molybdate. The solution turns bluish black and the formation of I3− was detected using a UV-Vis spectrophotometer.
In vitro cytotoxicity studies
Cytotoxicity assessment (MTT Assay). The impact of complexes C1 and C2 on the MDA-MB-231 (Breast Cancer cell) and A549 (Lung Cancer Cell) cell lines was assessed by the conventional colorimetric MTT assay. The cell cultures were trypsinized and the cell count was modified to approximately 10![[thin space (1/6-em)]](https://www.rsc.org/images/entities/char_2009.gif) 000 cells using DMEM (Dulbecco's Modified Eagle Medium). 200 μL of the cell suspension were added to each well of the 96 well microtiter plate. The plate was then incubated at 37 °C and 5% CO2 atmosphere for 24 hours. The cells were exposed to the complexes for 24 hours in a medium containing metal complex concentration ranging from 10 to 50 μg mL−1. The plate was removed from the incubator and the drug containing media was aspirated. 100 μL of medium containing 10% MTT reagent was then added to each well to get a final concentration of 0.5 mg mL−1 and the plate was incubated at 37 °C and 5% CO2 atmosphere for 3 h The culture medium was removed completely without disturbing the crystals formed. Then 100 μl of solubilisation solution (DMSO) was added and the plate was gently shaken in a rotary shaker to solubilize the formed formazan. The absorbance was quantified using a microplate reader at two specific wavelengths: 570 nm and 630 nm. The percentage growth inhibition was determined by subtracting the background and blank values. The cytotoxicity has been assessed using the MTT assay, with cancer cells treated with cisplatin as a positive control and untreated cancer cell as the negative control under similar conditions. The results of the cytotoxicity activities on the cell lines against the metal complexes were evaluated with the dose value of the metal complex required to reduce the cell lines to 50% (IC50).33–36
000 cells using DMEM (Dulbecco's Modified Eagle Medium). 200 μL of the cell suspension were added to each well of the 96 well microtiter plate. The plate was then incubated at 37 °C and 5% CO2 atmosphere for 24 hours. The cells were exposed to the complexes for 24 hours in a medium containing metal complex concentration ranging from 10 to 50 μg mL−1. The plate was removed from the incubator and the drug containing media was aspirated. 100 μL of medium containing 10% MTT reagent was then added to each well to get a final concentration of 0.5 mg mL−1 and the plate was incubated at 37 °C and 5% CO2 atmosphere for 3 h The culture medium was removed completely without disturbing the crystals formed. Then 100 μl of solubilisation solution (DMSO) was added and the plate was gently shaken in a rotary shaker to solubilize the formed formazan. The absorbance was quantified using a microplate reader at two specific wavelengths: 570 nm and 630 nm. The percentage growth inhibition was determined by subtracting the background and blank values. The cytotoxicity has been assessed using the MTT assay, with cancer cells treated with cisplatin as a positive control and untreated cancer cell as the negative control under similar conditions. The results of the cytotoxicity activities on the cell lines against the metal complexes were evaluated with the dose value of the metal complex required to reduce the cell lines to 50% (IC50).33–36
Result and discussion
IR and Raman spectral studies
In the IR spectrum of C1, the pyrazole ring ν(C–H) vibrations are seen as medium to strong intensity bands at 3025 cm−1. Pyrazole ring ν(C![[double bond, length as m-dash]](https://www.rsc.org/images/entities/char_e001.gif) N) vibrations are responsible for the broad bands observed at 1515 cm−1 and 1399 cm−1. The strong, intense band seen at 1470 cm−1 and the medium band observed at 1275 cm−1 are attributed to the C
N) vibrations are responsible for the broad bands observed at 1515 cm−1 and 1399 cm−1. The strong, intense band seen at 1470 cm−1 and the medium band observed at 1275 cm−1 are attributed to the C![[double bond, length as m-dash]](https://www.rsc.org/images/entities/char_e001.gif) C and C–N vibrations of the pyrazole ring, respectively. In the range of 1092 cm−1 to 1024 cm−1, the strong bands observed are attributed to ν(N–N) vibrations. ν(O–H) stretching is attributed to prominent, intense bands observed at 3346 cm−1 and 3124 cm−1, which denote the presence of water molecules.24,37 Strong bands observed between 900 to 940 cm−1 are assigned to uranyl asymmetric normal vibrations.38 The strong absorption observed at 691 cm−1 results from the acetate groups attached to the uranyl group by covalent bonds. Similarly, in the IR spectrum of C2, pyrazole ring ν(C–H) and methyl ν(C–H) vibrations are observed as medium intensity bands at 3024 cm−1 and 2923 cm−1 respectively. A strong band observed at 1550 cm−1 is attributed to pyrazole ring ν(C
C and C–N vibrations of the pyrazole ring, respectively. In the range of 1092 cm−1 to 1024 cm−1, the strong bands observed are attributed to ν(N–N) vibrations. ν(O–H) stretching is attributed to prominent, intense bands observed at 3346 cm−1 and 3124 cm−1, which denote the presence of water molecules.24,37 Strong bands observed between 900 to 940 cm−1 are assigned to uranyl asymmetric normal vibrations.38 The strong absorption observed at 691 cm−1 results from the acetate groups attached to the uranyl group by covalent bonds. Similarly, in the IR spectrum of C2, pyrazole ring ν(C–H) and methyl ν(C–H) vibrations are observed as medium intensity bands at 3024 cm−1 and 2923 cm−1 respectively. A strong band observed at 1550 cm−1 is attributed to pyrazole ring ν(C![[double bond, length as m-dash]](https://www.rsc.org/images/entities/char_e001.gif) N) vibrations. An intense band observed at 1464 cm−1 is assigned to vibrations of pyrazole ring ν(C
N) vibrations. An intense band observed at 1464 cm−1 is assigned to vibrations of pyrazole ring ν(C![[double bond, length as m-dash]](https://www.rsc.org/images/entities/char_e001.gif) C). Medium intense bands observed at 1268 cm−1 and 1003 cm−1 correspond to the characteristic pyrazole ring group vibrations ν(C–N) and ν(N–N). A strong band observed at 3330 cm−1 is assigned to O–H stretching, indicating the presence of water molecules. The strong peak at 919 cm−1 is due to the anti-symmetrical normal vibration of the uranyl ion.39 The strong absorption at 675 cm−1 results from the acetate groups attached to the uranyl centre. The IR spectra of the ligands (L1 and L2) and complexes (C1 and C2) are provided in the ESI.† The Raman spectra of the complexes C1 and C2 were analysed. A medium intensity peak observed at 842 cm−1 in C2 corresponds to the U
C). Medium intense bands observed at 1268 cm−1 and 1003 cm−1 correspond to the characteristic pyrazole ring group vibrations ν(C–N) and ν(N–N). A strong band observed at 3330 cm−1 is assigned to O–H stretching, indicating the presence of water molecules. The strong peak at 919 cm−1 is due to the anti-symmetrical normal vibration of the uranyl ion.39 The strong absorption at 675 cm−1 results from the acetate groups attached to the uranyl centre. The IR spectra of the ligands (L1 and L2) and complexes (C1 and C2) are provided in the ESI.† The Raman spectra of the complexes C1 and C2 were analysed. A medium intensity peak observed at 842 cm−1 in C2 corresponds to the U![[double bond, length as m-dash]](https://www.rsc.org/images/entities/char_e001.gif) O stretching vibrations.40 In the case of C1, it is observed as a weak peak. The broad peak observed in the range of 100–300 cm−1 for both the complexes is attributed to combination of uranyl bending vibrations.41 The U–N stretching vibrations are expected to appear in the region below 200 cm−1 as weak-bonds are perhaps masked under this broad peak. Other prominent peaks observed around 1500 cm−1 are originating from ligand C
O stretching vibrations.40 In the case of C1, it is observed as a weak peak. The broad peak observed in the range of 100–300 cm−1 for both the complexes is attributed to combination of uranyl bending vibrations.41 The U–N stretching vibrations are expected to appear in the region below 200 cm−1 as weak-bonds are perhaps masked under this broad peak. Other prominent peaks observed around 1500 cm−1 are originating from ligand C![[double bond, length as m-dash]](https://www.rsc.org/images/entities/char_e001.gif) C and C
C and C![[double bond, length as m-dash]](https://www.rsc.org/images/entities/char_e001.gif) N vibrations.42 Raman spectra of both the complexes are provided in the ESI.†
N vibrations.42 Raman spectra of both the complexes are provided in the ESI.†
Photophysical properties
The photophysical properties of the complexes (C1 and C2) were analysed using UV-Vis, NIR and photoluminescence (PL) spectroscopy in MeOH at 10−3 M concentration and compared with the precursor uranyl acetate.
In the absorption spectra of the complexes C1 and C2, absorption bands observed at around 220 nm and 265 nm are assigned to π → π* and n → π* transitions respectively. Both the complexes C1 and C2 exhibit a slight shift in absorption wavelength in comparison to their respective ligands, demonstrating the involvement of pyrazole ring azomethine groups in the coordination.43 Using the UV-visible spectral data, with the help of Tauc plot, the direct optical band gap (Eg) of the complexes C1 and C2 were calculated25 and are listed in Table 1. In the NIR spectra of the C1 and C2, weak absorption peaks observed in the range 1000–1500 cm−1 are ascribed to f–f transitions of uranium.44 The UV-visible and NIR spectra of ligands (L1 and L2) and complexes (C1 and C2) and the corresponding Tauc plots used for the calculation of direct band gaps are provided in ESI.†
Table 1 Optical properties of the compounds C1 and C2
| Compounds |
Absorbance λmax solution (nm) |
Emission λmax solution (nm) |
Optical bandgap (direct) Eg (eV) |
CIE coordinates |
| C1 |
220, 265 |
403 |
5.21, 3.95 |
0.154, 0.259 |
| C2 |
222, 265 |
403 |
5.13 |
0.155, 0.265 |
In the emission spectra, the metal complexes C1 and C2 showed slightly increased intensity values for the emission peak as compared to the bare uranyl acetate (Fig. 2), however, no observable shift in the wavelength was observed. This increased intensity can be attributed to the increased electron density on the metal due to ligand coordination.45 It was evident that, complex C2, which contains electron donating group on the pyrazole ring, exhibited slightly higher intensity as compared to C1.46 The emission intensity values were plotted on the CIE 1976 (Commission Internationale deL'Eclairage) and represented in Fig. 3 and the CIE coordinates are listed in Table 1.
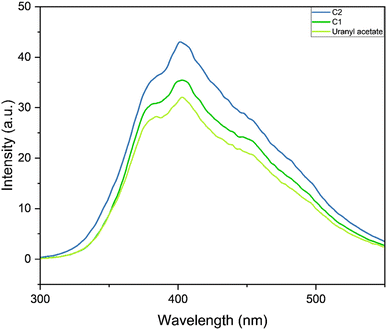 |
| | Fig. 2 Emission spectra of the complexes C1, C2 and uranyl acetate. | |
 |
| | Fig. 3 CIE chromaticity diagram for (a) uranyl acetate. (b) Complex C1 and (c) complex C2. | |
NMR studies
The H1 NMR spectrum of the uranyl complex C1 was compared with the ligand L1.24,25 Same four peaks were observed as those of the ligand, however, with a slight variation in the chemical shift values owing to the metal chelation. The triplet observed at 6.28 ppm is attributed to the protons of the pyrazole ring, and a singlet at 6.39 ppm is due to the methylene protons. The signals due to other protons of the pyrazole ring are observed at 7.49 and 7.94 ppm. In the corresponding 13C{1H} NMR of the complex, four signals were observed. Three pyrazole ring carbons were observed at 106.70, 131.02 and 140.48 ppm and a peak at 64.60 ppm was ascribed to the methylene carbon. Similarly, in the H1 NMR of the complex C2, a slight change in the chemical shift values is observed as compared to ligand.20 The peaks at 2.06 and 2.40 ppm correspond to the methyl group present in the 3rd and 5th position of the pyrazole ring, while the methylene protons are observed at 5.81 ppm. The pyrazole ring proton was observed at 6.03 ppm. In the corresponding 13C{1H} NMR spectrum, the peaks observed at 11.19 and 13.78 ppm correspond to the methyl group carbons. Pyrazole ring carbons (3 & 5-pz) are observed at 141.0 ppm. Methylene linker and pyrazole ring (4-position) carbon signals are seen at 57.3 and 106.2 ppm, respectively.20,25
Mass analysis
Mass analysis of both the complexes, C1 and C2 was performed. In the mass spectrum of complex C1, the peaks of high intensity observed at m/z 886.20, 841.23, 797.22, 651.18, 607.17, 563.18, 454.10 and 417.12 indicate the fragmentation of the uranyl complex cluster in the mass analysis experimental conditions. Similarly, complex C2, exhibited high intensity peaks at m/z 943.34, 753.27, 709.26, 665.24, 519.19 and 475.18. The mass spectra of both the complexes are provided in ESI.†
Electrochemical studies
Complex C1 was subjected to a room-temperature cyclic voltammetry analysis using three electrode system with a platinum counter electrode, a glassy carbon working electrode, and an aqueous Ag+/AgCl reference electrode (0.1 M). KCl solution was used as a supporting electrolyte. These studies were carried out in water in the potential window run from −2.0 V to 2.0 V, at the scan rate of 0.1 V s−1. Only the complex C1 was found to exhibit redox activity, it displayed a cathodic peak at −0.405 V and an anodic peak at 0.425 V (Fig. 4). This quasi-reversible redox process was attributed to the reduction of the uranyl ion i.e., UO22+ + e− → UO2+ and the corresponding oxidation reaction i.e., UO2+ → UO22+ + e− respectively.47
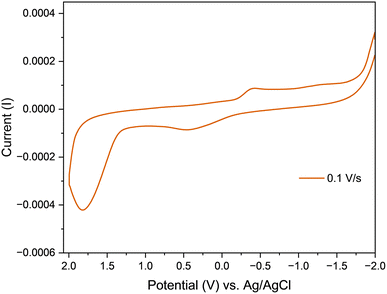 |
| | Fig. 4 Cyclic voltammograms of complex C1 at different scan rates. | |
X-ray crystal structure
The unit cell of complex C1 is in a monoclinic crystal system and has a space group of P21/c. The complex contains a cluster of four uranyl centres mutually connected by four bridging oxygens and two bridging acetate ligands. All the four uranyl centres are found to have distorted pentagonal bipyramidal geometry,48 with two perpendicularly placed oxo ligands, one bridging oxygen and one oxygen from acetate group taking the four coordination positions. For the two uranyl centres, the bidentate bis(pyrazolyl)methane ligands and a bridging oxygen take the remaining three positions and for the other two uranyl centres, two bridging oxygens and coordinating water molecule occupy the three coordination positions (Fig. 5). The average U![[double bond, length as m-dash]](https://www.rsc.org/images/entities/char_e001.gif) O bond length is found to be 1.78 Å and the average U–O bond length with the bridging oxygen is found to be 2.30 Å. The average U–O bond length with acetate oxygen is found to be 2.37 Å. These bond length values are in accordance with previously reported values.49 All the important bond lengths and angles are provided in the ESI.† Interestingly, free ligand molecules (i.e., bis(pyrazolyl)methane) were seen to strongly interact with the uranyl clusters via hydrogen bonding (average bond length ∼2.80 Å) with coordinated water molecules and form a three-dimensional network (Fig. 6).
O bond length is found to be 1.78 Å and the average U–O bond length with the bridging oxygen is found to be 2.30 Å. The average U–O bond length with acetate oxygen is found to be 2.37 Å. These bond length values are in accordance with previously reported values.49 All the important bond lengths and angles are provided in the ESI.† Interestingly, free ligand molecules (i.e., bis(pyrazolyl)methane) were seen to strongly interact with the uranyl clusters via hydrogen bonding (average bond length ∼2.80 Å) with coordinated water molecules and form a three-dimensional network (Fig. 6).
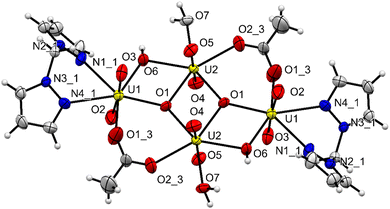 |
| | Fig. 5 The molecular structure of the uranyl cluster complex C1 with 50% probability ellipsoids. Bond lengths and angles and provided in ESI.† | |
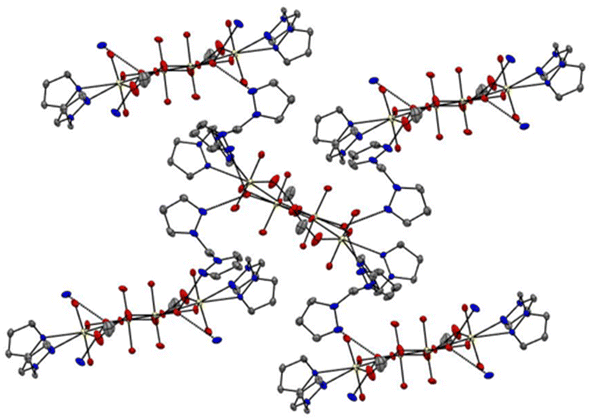 |
| | Fig. 6 3D network generated by the hydrogen bonding interaction between uranyl cluster and free ligand, bis(pyrazolyl)methane, in complex C1 (colour code: yellow – uranium, red – oxygen, blue – nitrogen, and grey – carbon; hydrogen bonds are indicated as dotted lines, average bond length ∼2.8 Å). | |
Powder X-ray diffraction studies
Powder X-ray diffraction patterns are obtained for the C1 (Fig. 7a) and C2 (Fig. 7c) complexes. The PXRD data of the complex C1 was compared with the PXRD pattern generated (Mercury software) from Single Crystal XRD data of C1 (Fig. 7b). The prominent PXRD peaks of the C1 were found to match well with the generated pattern indicating their similar structure. On the other hand, the complex C2 exhibited distinct and narrow peaks indicating the high degree of crystallinity. We calculated the crystalline sizes for C1 and C2 using Debye–Scherrer formula50 and values were found to be 43 nm and 41 nm, respectively.
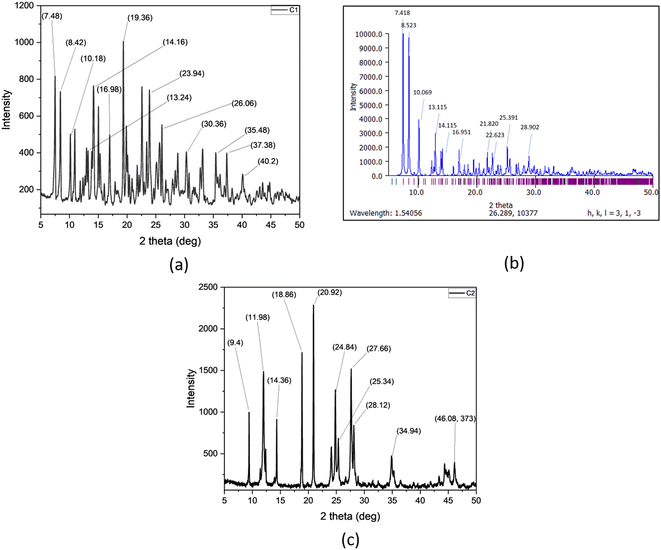 |
| | Fig. 7 (a) PXRD pattern of complex C1, (b) PXRD pattern of complex C1 generated from Mercury software. (c) PXRD pattern of complex C2. | |
Thermogravimetric analysis
The thermal gravimetric analysis was conducted for the complexes C1 and C2 using a heating rate of 10 °C min−1. The complex C1 decomposes in different steps as the temperature increases. Initially, the complex C1 experiences a mass loss in the temperature range of 100–180 °C due to the removal of coordinated water molecules from the metal complex. In the second stage, mass loss occurs in the temperature range of 200–350 °C due to the decomposition of ligand. Finally, a stable mass was reached at high temperatures corresponding to the formation of uranyl trioxide.50 For the complex C2, initially there was a loss of water molecules from the complex in a temperature range of 50 to 90 °C. The organic molecule elimination within a temperature range of 100 to 400 °C causes a mass loss in the second phase. The stable mass corresponding to UO3 was obtained in a temperature range of 400 to 460 °C.50,51 Corresponding thermograms are provided in ESI.†
Catecholase activity
The most widely used model compound, 3,5-di-tert-butyl catechol (DTBC) was utilised as the catechol substrate in the current studies.31 The catalytic reactions were performed under various conditions and meticulously monitored by UV-Vis spectroscopy. To analyse the formation of the oxidation product, 3,5-di-tert-butyl benzoquinone (DTBQ), an increase in the absorbance at 380 nm was tracked. A slight shift in the peak from the usual value, 400 nm is likely the result of the catalyst and substrate interaction.52 The preliminary studies were carried out at room temperature with neutral pH in methanol solvent under air. The UV-visible spectrum of the reaction was measured every 10 minute for 2 hours. Further reaction conditions were varied with respect to solvent, pH and temperature to see their impact. Every catalytic reaction was run for at least two times and the reaction rate was calculated using initial slope of ΔA vs. time plots and concentration (M) vs. time graph.9,31,53 The average rate values are provided in the Table 2. Both complexes C1 and C2, exhibited similar reactivity, displaying very good catechol oxidase mimicking property of the complexes (Entry 1 & 2, Table 2). This catalytic activity was found to be almost double as compared to the bare uranyl acetate under same reaction conditions (Entry 9, Table 2). Since both the complexes exhibited comparable activity, we proceeded with complex C1 for further investigations. To examine the effect of solvent on the oxidation reaction, the reaction media was changed to different solvents, using DMSO (Entry 3, Table 2), lead into diminished reactivity, while a mixture of methanol and water (1![[thin space (1/6-em)]](https://www.rsc.org/images/entities/char_2009.gif) :
:![[thin space (1/6-em)]](https://www.rsc.org/images/entities/char_2009.gif) 1) (Entry 4, Table 2) resulted into a slight decrease in the activity. It was evident that, the solvent plays a prominent role in the catecholase activity and methanol is the most appropriate solvent for this system.54 Higher binding affinity of the DMSO towards the metal centre, which blocks the substrate–catalyst interaction is envisaged to be the reason for decreased activity in DMSO.55 The pH of the catalytic reaction in methanol was found to be 7.2 at RT (the pH of the reaction mixture was measured using a digital pH meter; before each reading the instrument was calibrated using an acid base and neutral buffer). Since the pH of the reaction medium is known to play key role in the catechol oxidase activity,54 the pH of the catalytic reaction was changed to 10 (by adding 0.1 N NaOH to the reaction mixture) (Entry 5, Table 2) and to 3 (by adding 0.1 N HNO3 to the reaction mixture) (Entry 6, Table 2). It was evident that, at the basic condition (pH ∼ 10, Entry 5, Table 2), the catalytic activity of the system slightly improved, while at the acidic condition (pH ∼ 3, Entry 6, Table 2) the catalytic activity decreased significantly. The initial catalytic reaction was carried out at RT (25 °C) (Entry 1, Table 2), in order to examine the effect of temperature, the catalytic reaction was carried out at a higher temperature (i.e., 50 °C) (Entry 7, Table 2). Indeed, at the high temperature, the reaction rate was found to nearly double its value, indicating the positive influence of the temperature on the catalytic reaction. Since all the catalytic reactions were conducted in open air, the atmospheric oxygen is envisaged to be captured and utilized by the catalyst in the current oxidation reaction.56 Therefore, increase in the oxygen concentration is expected to benefit the reaction. Certainly, when the catalytic reaction was conducted in high oxygen atmosphere (by purging oxygen into reaction mixture, till saturation), noticeable increase in the catalytic activity was observed (Entry 8, Table 2). Fig. 8 shows the UV-vis spectra of the catalytic reactions of catalyst C1, (a) under ambient conditions (as Entry 1, Table 2); (b) under high O2 concentration conditions (as Entry 8, Table 2). Fig. 9 shows the plots of change in the product (DTBQ) concentration with respect to time, under ambient condition and under high O2 concentration.
1) (Entry 4, Table 2) resulted into a slight decrease in the activity. It was evident that, the solvent plays a prominent role in the catecholase activity and methanol is the most appropriate solvent for this system.54 Higher binding affinity of the DMSO towards the metal centre, which blocks the substrate–catalyst interaction is envisaged to be the reason for decreased activity in DMSO.55 The pH of the catalytic reaction in methanol was found to be 7.2 at RT (the pH of the reaction mixture was measured using a digital pH meter; before each reading the instrument was calibrated using an acid base and neutral buffer). Since the pH of the reaction medium is known to play key role in the catechol oxidase activity,54 the pH of the catalytic reaction was changed to 10 (by adding 0.1 N NaOH to the reaction mixture) (Entry 5, Table 2) and to 3 (by adding 0.1 N HNO3 to the reaction mixture) (Entry 6, Table 2). It was evident that, at the basic condition (pH ∼ 10, Entry 5, Table 2), the catalytic activity of the system slightly improved, while at the acidic condition (pH ∼ 3, Entry 6, Table 2) the catalytic activity decreased significantly. The initial catalytic reaction was carried out at RT (25 °C) (Entry 1, Table 2), in order to examine the effect of temperature, the catalytic reaction was carried out at a higher temperature (i.e., 50 °C) (Entry 7, Table 2). Indeed, at the high temperature, the reaction rate was found to nearly double its value, indicating the positive influence of the temperature on the catalytic reaction. Since all the catalytic reactions were conducted in open air, the atmospheric oxygen is envisaged to be captured and utilized by the catalyst in the current oxidation reaction.56 Therefore, increase in the oxygen concentration is expected to benefit the reaction. Certainly, when the catalytic reaction was conducted in high oxygen atmosphere (by purging oxygen into reaction mixture, till saturation), noticeable increase in the catalytic activity was observed (Entry 8, Table 2). Fig. 8 shows the UV-vis spectra of the catalytic reactions of catalyst C1, (a) under ambient conditions (as Entry 1, Table 2); (b) under high O2 concentration conditions (as Entry 8, Table 2). Fig. 9 shows the plots of change in the product (DTBQ) concentration with respect to time, under ambient condition and under high O2 concentration.
Table 2 Average rate of catalytic reactions (catalyst![[thin space (1/6-em)]](https://www.rsc.org/images/entities/char_2009.gif) :
:![[thin space (1/6-em)]](https://www.rsc.org/images/entities/char_2009.gif) substrate (1
substrate (1![[thin space (1/6-em)]](https://www.rsc.org/images/entities/char_2009.gif) :
:![[thin space (1/6-em)]](https://www.rsc.org/images/entities/char_2009.gif) 100)) determined with the help of UV-visible spectral analysis
100)) determined with the help of UV-visible spectral analysis
| Sl. no. |
Condition |
Solvent |
Catalyst used |
Average rate (M min−1) |
| 1 |
25 °C, pH 7.2 |
MeOH |
C1 |
1.10 × 10⁻⁵ |
| 2 |
25 °C, pH 7.2 |
MeOH |
C2 |
1.11 × 10⁻⁵ |
| |
25 °C, pH 7.2 |
DMSO |
C1 |
0.014 × 10⁻⁵ |
| 4 |
25 °C, pH 7.2 |
MeOH![[thin space (1/6-em)]](https://www.rsc.org/images/entities/char_2009.gif) : :![[thin space (1/6-em)]](https://www.rsc.org/images/entities/char_2009.gif) water (1 water (1![[thin space (1/6-em)]](https://www.rsc.org/images/entities/char_2009.gif) : :![[thin space (1/6-em)]](https://www.rsc.org/images/entities/char_2009.gif) 1) 1) |
C1 |
0.80 × 10⁻⁵ |
| 5 |
25 °C, pH 10 |
MeOH |
C1 |
1.11 × 10⁻⁵ |
| 6 |
25 °C, pH 3 |
MeOH |
C1 |
0.42 × 10⁻⁵ |
| 7 |
50 °C, pH 7.2 |
MeOH |
C1 |
1.92 × 10⁻⁵ |
| 8 |
25 °C, O2 purged, pH 7.2 |
MeOH |
C1 |
1.28 × 10⁻⁵ |
| 9 |
25 °C, pH 7.2 |
MeOH |
Uranyl acetate |
0.52 × 10⁻⁵ |
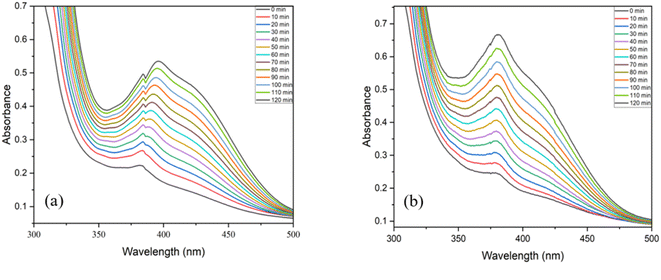 |
| | Fig. 8 UV-visible spectra of reaction mixture of C1 recorded at the time interval of 10 min, (a) under ambient conditions, (b) under high O2 concentration conditions. | |
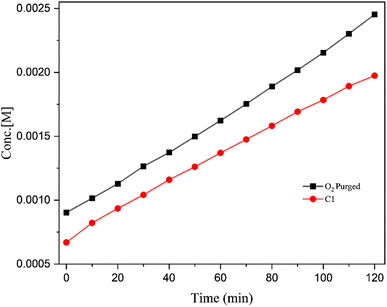 |
| | Fig. 9 Plots of concentration of product (DTBQ) concentration vs. time for the catalytic reactions conducted at ambient conditions and higher O2 concentration. | |
The oxidation of DTBC by molecular oxygen is expected to yield hydrogen peroxide as a byproduct. The production of hydrogen peroxide in the current reaction was qualitatively analysed by iodine liberation test. The catalytic mixture with a 1![[thin space (1/6-em)]](https://www.rsc.org/images/entities/char_2009.gif) :
:![[thin space (1/6-em)]](https://www.rsc.org/images/entities/char_2009.gif) 10 catalyst: substrate ratio was used for the investigation. The formation of I3− was detected by UV-Vis spectral analysis of the reaction mixture (Fig. 10).9
10 catalyst: substrate ratio was used for the investigation. The formation of I3− was detected by UV-Vis spectral analysis of the reaction mixture (Fig. 10).9
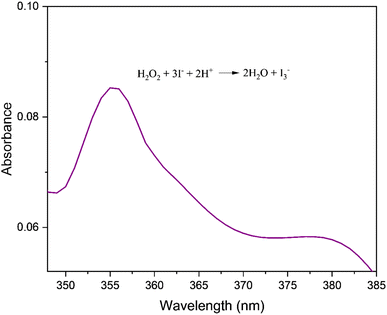 |
| | Fig. 10 UV-visible spectrum of the reaction mixture depicting absorption peak corresponding to I3− (λ = 353 nm). | |
The catalyst C1 was tested with different ratios of 3,5-di-tert-butylcatechol (1![[thin space (1/6-em)]](https://www.rsc.org/images/entities/char_2009.gif) :
:![[thin space (1/6-em)]](https://www.rsc.org/images/entities/char_2009.gif) 50, 1
50, 1![[thin space (1/6-em)]](https://www.rsc.org/images/entities/char_2009.gif) :
:![[thin space (1/6-em)]](https://www.rsc.org/images/entities/char_2009.gif) 100, 1
100, 1![[thin space (1/6-em)]](https://www.rsc.org/images/entities/char_2009.gif) :
:![[thin space (1/6-em)]](https://www.rsc.org/images/entities/char_2009.gif) 150). The concentration versus observed rate plot shows a typical hyperbolic curve (Fig. 11), which is in line with the Michaelis Menten kinetic model. It indicates that the rate of reaction increases with the increase in substrate concentration.57 The kinetic parameters of the catalytic reaction obtained from the Lineweaver Burk plot are provided in Table 3. This reaction exhibited Kcat value of 400 h−1 indicating its high potency. Kcat values of some of the model compounds containing copper,58 cobalt,59 zinc,60 manganese61,62 and uranyl9 centers are listed in Table S9 (ESI†) for comparison.
150). The concentration versus observed rate plot shows a typical hyperbolic curve (Fig. 11), which is in line with the Michaelis Menten kinetic model. It indicates that the rate of reaction increases with the increase in substrate concentration.57 The kinetic parameters of the catalytic reaction obtained from the Lineweaver Burk plot are provided in Table 3. This reaction exhibited Kcat value of 400 h−1 indicating its high potency. Kcat values of some of the model compounds containing copper,58 cobalt,59 zinc,60 manganese61,62 and uranyl9 centers are listed in Table S9 (ESI†) for comparison.
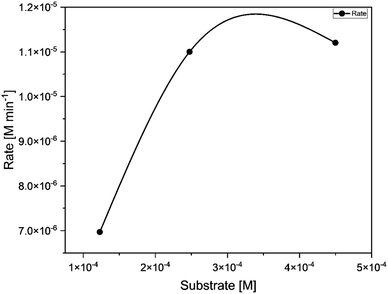 |
| | Fig. 11 Concentration of substrate [M] (50, 100, 200) vs. rate of the reaction [M min −1] for catalyst C1. | |
Table 3 Kinetic parameters obtained from Lineweaver Burk plot
| Complex |
Vmax (M h−1) |
KM (M) |
Kcat (h−1) |
Kcat/KM |
| C1 |
9.7 × 10⁻⁴ |
1.6 × 10⁻⁴ |
4.0 × 10² |
4.12 × 10⁵ |
The EPR spectrum of catalyst C1 in 5 equivalent 3,5 DTBC in methanol at exhibited a distinct peak at giso 1.99 and B ∼ 326 mT (Fig. 12). This peak indicates the formation of organic radical intermediate during the oxidation of 3,5 DTBC to 3,5 DTBQ.9 The absence of any additional peaks in the spectrum suggests that catalyst C1 exhibits diamagnetic characteristics.
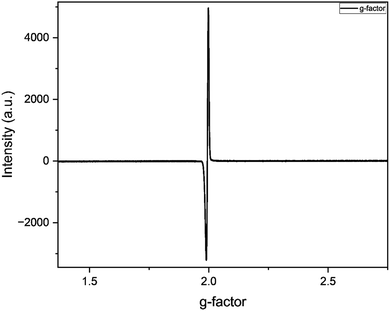 |
| | Fig. 12 EPR spectrum of C1 and 3,5 DTBC reaction mixture (1![[thin space (1/6-em)]](https://www.rsc.org/images/entities/char_2009.gif) : :![[thin space (1/6-em)]](https://www.rsc.org/images/entities/char_2009.gif) 5) in methanol at 25 °C. 5) in methanol at 25 °C. | |
Proposed catalytic cycle for oxidation of 3,5-di-tert-butyl catechol
Based on the experimental observations and previous studies,9 a plausible mechanistic cycle was established for the catechol oxidase reaction. In the first step, the phenolic OH groups of the catechol model compound (3,5-di-tert-butyl catechol) interact with the uranyl center via coordination and hydrogen bonding interactions. The next step of the catalytic cycle involves elimination of the H atom from the O-coordinated hydroxyl of the substrate. The substrate further undergoes oxidation in presence of molecular oxygen resulting in the formation of 3,5-di-tert-butyl ortho-benzosemiquinone (3,5-DTBSQ) and hydroperoxyl radical. The final step of the catalytic cycle involves the abstraction of hydrogen atom from phenolic –OH by hydroperoxyl radical forming hydrogen peroxide and the oxidation of 3,5 DTBSQ to form the product 3,5-di-tert-butyl benzoquinone followed by regeneration of the catalyst. The catalytic pathway is depicted in Fig. 13.
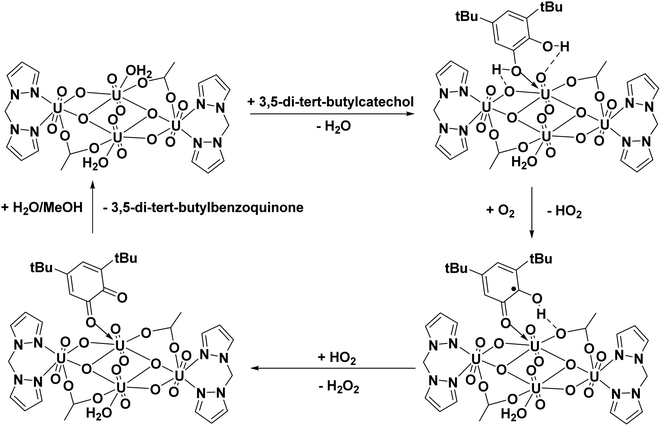 |
| | Fig. 13 Proposed catalytic cycle for the oxidation of 3,5-di-tert-butyl catechol to 3,5-di-tert-butyl benzoquinone. | |
Phenoxazinone synthase activity
We analysed the phenoxazinone synthase activity for the complexes C1 and C2 using 2-aminophenol as a substrate under aerobic conditions at 25 °C, using deionised water–methanol as the solvent for all the reactions. We analysed the reactions by measuring the increase in the absorbance band at 425 nm, the characteristic λmax for the phenoxazinone chromophore with respect to time (Fig. 14). The rates are calculated from the slope of concentrations vs. time graphs (Fig. 15). The calculated average rate values are provided in Table 4. The complex C2 showed faster oxidative dimerization of 2-aminophenol (Entry 2, Table 4) compared to C1 (Entry 1, Table 4) and bare uranyl acetate (Entry 3, Table 4). The Michaelis-Menton kinetic model (Fig. 16) confirms that, these reactions follow first order kinetics and the corresponding kinetic parameters calculated from Lineweaver Burk plot are listed in the Table 5. Further, the effect of solvent on the oxidation of 2-aminophenol was determined. When the reaction media was changed to an aprotic solvent, DMSO, the reaction rate was found to decrease significantly (Entry 4, Table 4) indicating the need of protic solvent media for the progression of this reaction.63,64 The impact of pH on the oxidation of 2-aminophenol was investigated by performing the reaction under both acidic and basic conditions. The catalytic conversion of phenoxazinone was substantially decreased when the reaction is carried out under acidic conditions with a pH of 3 (Entry 7 Table 4). Under alkaline conditions with a pH of 10, the reaction rate showed a slight increase (Entry 6 Table 4). This could be attributed to the formation of a more stable complex-substrate adduct, which is favoured at basic pH levels.65 Several biomimicking catalysts were reported for 2-aminophenol oxidation using transition metals such as copper,58,65–69 cobalt,70,71 zinc,68 and nickel.68 To best of our knowledge, this is the first uranyl-based catalyst used for 2-aminophenol oxidation. The catalytic efficiency of these metal complexes is compared in a tabular form provided in the ESI (Table S10†).
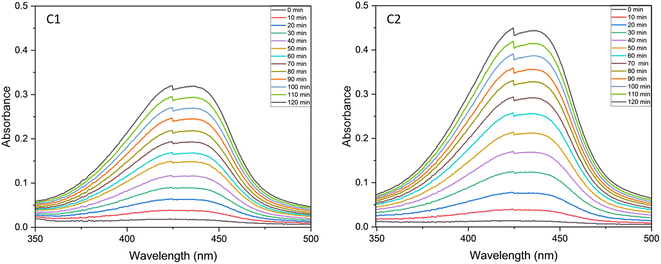 |
| | Fig. 14 UV-visible spectra of catalytic mixture of C1 and C2 recorded at the time interval of 10 min in a 1![[thin space (1/6-em)]](https://www.rsc.org/images/entities/char_2009.gif) : :![[thin space (1/6-em)]](https://www.rsc.org/images/entities/char_2009.gif) 50 catalyst to substrate ratio. 50 catalyst to substrate ratio. | |
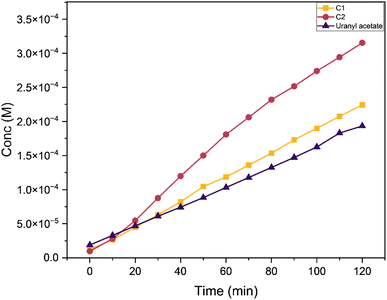 |
| | Fig. 15 Conc. (M) vs. time (min) graph comparing the change in concentration of the product formed with C1, C2 and uranyl acetate as the reaction progress w.r.t. time at a catalyst to substrate ratio of 1![[thin space (1/6-em)]](https://www.rsc.org/images/entities/char_2009.gif) : :![[thin space (1/6-em)]](https://www.rsc.org/images/entities/char_2009.gif) 50. 50. | |
Table 4 Average rate of catalytic reactions (catalyst![[thin space (1/6-em)]](https://www.rsc.org/images/entities/char_2009.gif) :
:![[thin space (1/6-em)]](https://www.rsc.org/images/entities/char_2009.gif) substrate (1
substrate (1![[thin space (1/6-em)]](https://www.rsc.org/images/entities/char_2009.gif) :
:![[thin space (1/6-em)]](https://www.rsc.org/images/entities/char_2009.gif) 50)) determined with the help of UV-visible spectral analysis
50)) determined with the help of UV-visible spectral analysis
| Sl. no. |
Condition |
Solvent |
Catalyst used |
Average rate (M min−1) |
Represents the average rate obtained in a catalyst to substrate ratio of 1![[thin space (1/6-em)]](https://www.rsc.org/images/entities/char_2009.gif) : :![[thin space (1/6-em)]](https://www.rsc.org/images/entities/char_2009.gif) 100. 100. |
| 1 |
25 °C |
Water![[thin space (1/6-em)]](https://www.rsc.org/images/entities/char_2009.gif) : :![[thin space (1/6-em)]](https://www.rsc.org/images/entities/char_2009.gif) MeOH MeOH |
C1 |
1.79 × 10⁻⁶ |
| 2 |
25 °C |
Water![[thin space (1/6-em)]](https://www.rsc.org/images/entities/char_2009.gif) : :![[thin space (1/6-em)]](https://www.rsc.org/images/entities/char_2009.gif) MeOH MeOH |
C2 |
2.65 × 10⁻⁶ |
| 3 |
25 °C |
Water![[thin space (1/6-em)]](https://www.rsc.org/images/entities/char_2009.gif) : :![[thin space (1/6-em)]](https://www.rsc.org/images/entities/char_2009.gif) MeOH MeOH |
Uranyl acetate |
1.51 × 10⁻⁶ |
| 4 |
25 °C |
DMSO |
C2 |
Trace |
| 5a |
25 °C |
Water![[thin space (1/6-em)]](https://www.rsc.org/images/entities/char_2009.gif) : :![[thin space (1/6-em)]](https://www.rsc.org/images/entities/char_2009.gif) MeOH MeOH |
C2 |
3.22 × 10⁻⁶ |
| 6a |
25 °C pH 10 |
Water![[thin space (1/6-em)]](https://www.rsc.org/images/entities/char_2009.gif) : :![[thin space (1/6-em)]](https://www.rsc.org/images/entities/char_2009.gif) MeOH MeOH |
C2 |
3.41 × 10⁻⁶ |
| 7a |
25 °C pH 3 |
Water![[thin space (1/6-em)]](https://www.rsc.org/images/entities/char_2009.gif) : :![[thin space (1/6-em)]](https://www.rsc.org/images/entities/char_2009.gif) MeOH MeOH |
C2 |
Trace |
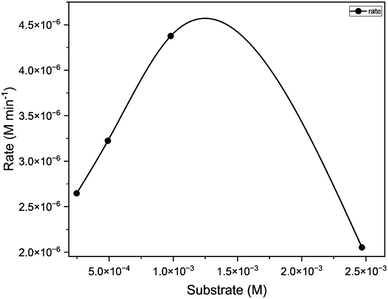 |
| | Fig. 16 Concentration of substrate [M] (50, 100, 200, 500) vs. rate of the reaction [M min −1] for catalyst C2. | |
Table 5 Kinetic parameters obtained from Lineweaver Burk plot
| Complex |
Vmax (M h−1) |
KM (M) |
Kcat (h−1) |
Kcat/KM |
| C2 |
3.2 × 10⁻⁴ |
2.7 × 10⁻⁴ |
6.6 × 101 |
2.44 × 10⁵ |
Reaction pathway for the oxidation of 2-aminophenol
The mechanism of uranyl catalyzed phenoxazinone synthase reaction is expected to follow the similar path as that of the catechol oxidase reaction described above. In the proposed mechanism for phenoxazinone synthase activity, the initial step of the reaction involves the interaction of 2-aminophenol with the removal of water molecules. The –OH and –NH2 groups of the substrate form coordinative and the hydrogen bonding interaction with the uranyl center. Further the substrate undergoes oxidation in the presence of O2 forming 6-iminocyclohexa-2,4-diene-1-one and hydrogen peroxide, regenerating the catalyst. Then, the highly electrophilic 6-iminocyclohexa-2,4-diene-1-one couples with another 2-aminophenol to form 2-amino-4-((2-hydroxyphenyl)amino)phenol (A). In step 2, the product A interacts with the catalyst in a similar reaction pathway as step 1, forming the product, 4-((2-hydroxyphenyl)amino)-6-iminocyclohex-3-en-1-one (B). The formed product B undergoes tautomerisation to form product, 2-amino-10H-phenoxazin-3-ol (C) and H2O2, which is then followed by the catalyst's regeneration. In step 3, the hydrogen peroxide produced in the reaction, oxidizes the product C, leading to the formation of 2-amino-phenoxazine-3-one.9,65 The reaction pathway is shown in Fig. 17.
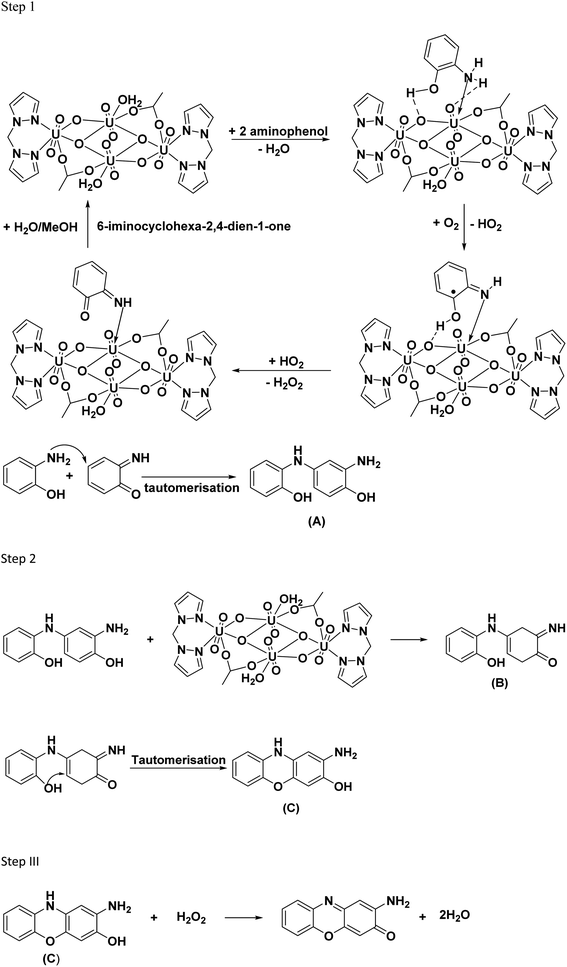 |
| | Fig. 17 Proposed reaction pathway for oxidation 2-aminophenol to 2-amino-phenoxazine-3-one using C1 catalyst. | |
Interaction studies of complexes with BSA protein: UV-Vis spectral analysis
Protein interaction studies with the bovine serum albumin and the complexes C1 and C2 were monitored using a UV-Vis spectrophotometer.72 Tris–base HCl was used as a buffer to maintain a pH of 6.94. Protein alone showed absorption at a wavelength in the range of 260 to 290 nm, which is attributed to the n–π* transitions corresponding to the tryptophan and tyrosine amino acids. The complexes C1 and C2 at different concentrations (2, 4, 8, 12, 16 and 20 μM) were used for the interaction studies (Fig. 18). In all the mixtures, the characteristic BSA absorption peak at λmax of 280 nm remained unaffected indicating that the microenvironment of the protein chromophore is intact even after binding to the uranyl complex.73 However, the absorption spectra intensified as the metal ion concentrations increased from 2 to 20 μM. These hyperchromic shifts observed during the interaction studies are mostly due to the metal ion interaction with the tryptophan residue present on the BSA protein's surface.74,75 The binding constant (K) values for both the complexes were calculated using the intercept to slope ratio (data provided in ESI†).74 The binding constant for the complex C1 was determined to be 1.07 × 10⁴ and for complex C2, 4.6 × 10³, indicating that, complex C1 binds strongly to the BSA protein than the complex C2. Overall, these values indicate the moderate binding ability of the complexes with the protein.74
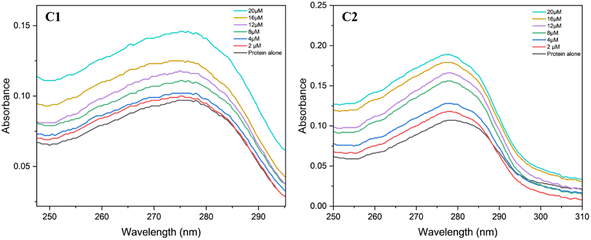 |
| | Fig. 18 Absorption spectra BSA protein (2.5 μM) with complexes C1 and C2 at different concentrations (2, 4, 8, 12, 16, 20) in μM solutions. | |
Interaction studies of complexes with BSA protein: fluorescence analysis
The fluorescence studies were utilised to investigate the interaction between the BSA protein and the uranyl complexes C1 and C2 in Tris–HCl buffer medium with a pH of 6.94. In these studies, the protein was excited at 296 nm (i.e., tryptophan residues were excited) and the change in the fluorescence was analysed at different concentrations of the complexes C1 and C2 by monitoring the emission peak 336 nm for the BSA protein. It was observed that, the fluorescence intensity of BSA with C1 metal complexes decreases upon increasing the metal complex concentration (Fig. 19). The decrease in intensity was ascribed to the tryptophan quenching mechanism. The Stern–Volmer plot was used to calculate the protein binding efficiency (Ksv) of the metal complexes,73 the Ksv value for the complex C1 is found to be 2.06 × 10⁴. Interestingly, in the case of complex C2, increase in the complex concentration resulted into increase in the intensity of the peak, however the binding efficiency is found to be of the same order (i.e., Ksv = 3.6 × 10⁴).
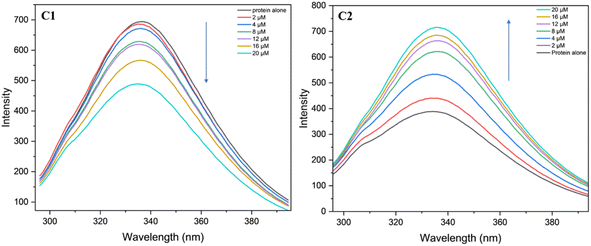 |
| | Fig. 19 Fluorescence spectra BSA protein (2.5 μM) with complexes C1 and C2 at different concentrations (2, 4, 8, 12, 16, 20) in μM solutions. | |
In vitro cytotoxicity studies
The cytotoxicity assessment of the C1 and C2 complexes on the MDA-MB-231 (breast cancer) and A549 (lung cancer) cell lines was performed. In the case of breast cancer cell line, MDA-MB-231, the compound C2 was found to exhibit better cytotoxic activity compared to C1. On the other hand, studies on A549 lung cancer cells revealed that compound C1 is more cytotoxic to lung cancer cell lines than the compound C2. The corresponding IC50 values are provided in Table 6. The graphs showing the cell line viability (%) vs. concentration (μg mL−1) are displayed as Fig. 20. From the studies, it is evident that as concentration of uranyl complexes increases, resulting in a decrease in cell viability percentage. Microscope images of MDAMB-231 cell line after treating with two different dosages of complexes C2, along with the standard cisplatin and control is depicted in Fig. 21. Similarly, Fig. 22 displays the microscopic images of the A549 cell line with two different doses of C1 along with cisplatin and untreated cell line. The bis(pyrazolyl)methane and its derivatives show significantly greater IC50 values when compared to their corresponding metal complexes or have no anti-cancer efficiency against different cell lines, indicating reduced efficiency and lowered inhibitory activity as an anti-cancer agent.76–78 In the case of uranyl salts the amount is subsequentially high (ranging from 100 to 250 μM) to inhibit a cancer cell growth.79
Table 6 IC50 value of the metal complexes for MDA-MB-231 and A549
| Sample name |
MDAMB-231 cell line IC50 (in μg ml−1) 24 h |
A549 cell line IC50 (in μg ml−1) 24 h |
| C1 |
32.68 |
24.77 |
| C2 |
27.66 |
30.91 |
| Cis-platin |
7.87 |
11.59 |
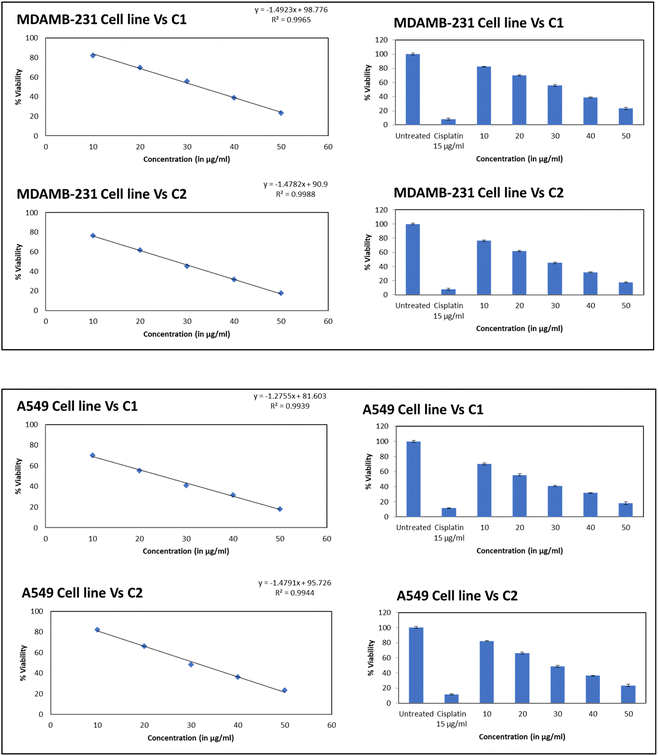 |
| | Fig. 20 The graph showing the cell line viability (%) vs. concentration (μg mL−1). Top – compound C1, bottom – compound C2. | |
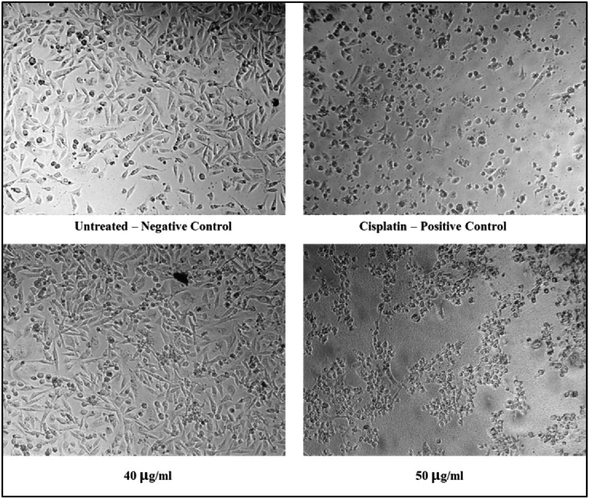 |
| | Fig. 21 Microscopic images of MDAMB-231 cell lines treated with 40 and 50 μg mL−1 of C2 in comparison with cisplatin and control. | |
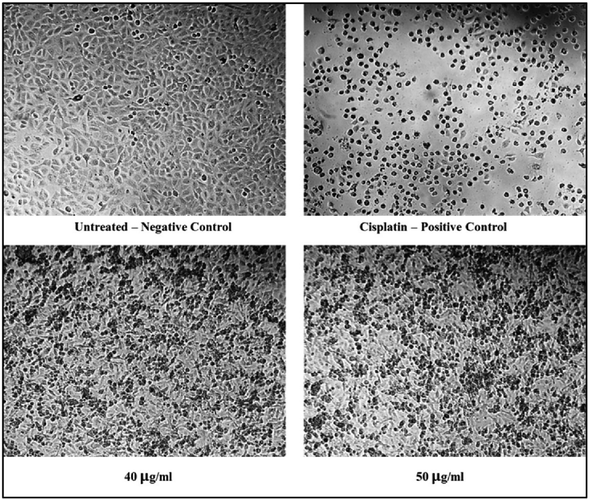 |
| | Fig. 22 Microscopic images of A549 cell lines treated with 40 and 50 μg mL−1 of C1 in comparison with cisplatin and control. | |
Conclusion
Two uranyl complexes, C1 and C2, supported by bis(pyrazolyl)methane ligands, were synthesised and characterised using various spectro-analytical techniques. The structural studies of complex C1 were conducted using the crystal, which showed a space group of P21/c. Fluorescence studies were conducted on the complexes, and it was found that the complex synthesised with the ligand containing an electron-donating group exhibited a high fluorescence intensity. The mass spectrum and thermal studies were performed to analyse the chemical structure and temperature stability of the complex, respectively. These catalysts were found to be excellent bio-imitators for the enzyme's catechol oxidase and phenoxazinone synthase in the in the presence of atmospheric air. Complex C1 has a catalytic efficiency of 4.12 × 10⁵ for the conversion of catechol to quinone, and complex C2 found to have a catalytic efficiency of 2.44 × 10⁵ for the oxidation of 2-aminophenol in the presence of atmospheric air. The complex C1 showed better binding ability with the BSA protien, as revealed by the UV-Vis and fluorescence spectroscopyic studies. The anti-cancer studies were conducted for both complexes with two cell lines (breast cancer cell and lung cancer cell). The complex C1 exhibited an IC50 value of 24.77 for the lung cancer cell line, and the complex C2 showed an IC50 value of 27.66 for the breast cancer cells.
Data availability
The data supporting this article have been included as part of the ESI.†
Conflicts of interest
There are no conflicts to declare.
Acknowledgements
NS thanks Amrita Vishwa Vidyapeetham for providing the PhD fellowship. NVK thanks Science and Engineering Research Board (SERB) India for the TARE grant (TAR/2018/000881) and Amrita Vishwa Vidyapeetham for the support. AP thanks Manipal Academy of Higher Education (MAHE), Manipal. Single Crystal XRD Facility and NMR Facility – VIT, Vellore is acknowledged for the aid in the analysis.
References
- F. Shaki, E. Zamani, A. Arjmand and J. Pourahmad, Iran. J. Pharm. Res., 2019, 18, 90 CAS
 .
. - O. C. Lind, J. Tschiersch and B. Salbu, J. Environ. Radioact., 2020, 211, 106077 CrossRef CAS
 .
. - W. Chen, H.-M. Yuan, J.-Y. Wang, Z.-Y. Liu, J.-J. Xu, M. Yang and J.-S. Chen, J. Am. Chem. Soc., 2003, 125, 9266–9267 CrossRef CAS
 .
. - P. Thuéry, C. Villiers, J. Jaud, M. Ephritikhine and B. Masci, J. Am. Chem. Soc., 2004, 126, 6838–6839 CrossRef
 .
. - K. Darzinezhad, M. M. Amini, E. Mohajerani, M. Armaghan, T. O. Knedel, A. Abareghi and C. Janiak, Dalton Trans., 2019, 48, 3695–3703 RSC
 .
. - K. Darzinezhad, M. M. Amini, M. Janghouri, E. Mohajerani, M. R. Fathollahi, Z. Jamshidi and C. Janiak, Inorg. Chem., 2020, 59, 17028–17037 CrossRef CAS
 .
. - L. Ding, J. Leduc, T. Fischer, S. Mathur and Y. Li, Nanoscale Adv., 2020, 2, 2478–2484 RSC
 .
. - S. Ghosh, A. K. Srivastava, R. Govu, U. Pal and S. Pal, Inorg. Chem., 2019, 58, 14410–14419 CrossRef CAS
 .
. - S. Ghosh, A. K. Srivastava, M. Sharma and S. Pal, ChemistrySelect, 2022, 7, e202200293 CrossRef CAS
 .
. - Z. Zhou, X.-B. Li, Z. Huang, Q.-Y. Wu, J.-X. Wang, Z.-H. Zhang, J. Yu, L. Mei, F. Ma and K. Hu, Inorg. Chem. Front, 2024, 11, 6493–6501 RSC
 .
. - N. Behera and S. Sethi, Eur. J. Inorg. Chem., 2021, 2021, 95–111 CrossRef CAS
 .
. - A. A. Sharfalddin, A.-H. Emwas, M. Jaremko and M. A. Hussien, PLoS One, 2021, 16, e0256186 CrossRef CAS
 .
. - A. M. Khedr and F. A. Saad, Turk. J. Chem., 2015, 39, 267–280 CrossRef CAS
 .
. - M. Gaber, H. A. El-Ghamry, S. K. Fathalla and M. A. Mansour, Mater. Sci. Eng., C, 2018, 83, 78–89 CrossRef CAS
 .
. - Z. Asadi, M. Asadi, F. Dehghani Firuzabadi, R. Yousefi and M. Jamshidi, J. Iran. Chem. Soc., 2014, 11, 423–429 CrossRef CAS
 .
. - M. Y. Zhao, R. J. Ma, Y. N. Chen, H. X. Zhang, K. Kong, H. Bin Chu, F. Y. Zhao and Y. L. Zhao, Appl. Mech. Mater., 2013, 271, 55–59 Search PubMed
 .
. - L. Götzke, G. Schaper, J. März, P. Kaden, N. Huittinen, T. Stumpf, K. K. K. Kammerlander, E. Brunner, P. Hahn and A. Mehnert, Coord. Chem. Rev., 2019, 386, 267–309 CrossRef
 .
. - Y.-W. Lin, Biomolecules, 2020, 10, 457 CrossRef CAS
 .
. - S. Trofimenko, J. Am. Chem. Soc., 1970, 92, 5118–5126 CrossRef CAS
 .
. - S. Swathy, H. Chandran, G. Reshma, S. Nakul, M. Kumar, M. A. Krishnan, N. V Kulkarni, D. Senthurpandi, S. S. Contractor and S. B. Arakera, J. Mol. Struct., 2022, 1251, 132018 CrossRef
 .
. - N. V Kulkarni and V. K. Revankar, J. Coord. Chem., 2011, 64, 725–741 CrossRef
 .
. - M. Roy, A. Adhikary, A. K. Mondal and R. Mondal, ACS Omega, 2018, 3, 15315–15324 CrossRef CAS
 .
. - N. V. Kulkarni, C. Dash, N. B. Jayaratna, S. G. Ridlen, S. Karbalaei Khani, A. Das, X. Kou, M. Yousufuddin, T. R. Cundari and H. V. R. Dias, Inorg. Chem., 2015, 54, 11043–11045 CrossRef CAS
 .
. - V. Hegde, C. O. Sreekala, N. V Kulkarni and J. Mathew, J. Photochem. Photobiol., A, 2024, 449, 115389 CrossRef CAS
 .
. - V. Hegde, C. O. Sreekala, N. V Kulkarni, D. Senthurpandi and J. Mathew, J. Mol. Struct., 2022, 1266, 133512 CrossRef CAS
 .
. - G. M. Sheldrick, Acta Crystallogr., 2015, C71, 3–8 CrossRef
 .
. - G. M. Sheldrick, Acta Crystallogr., 2008, A64, 112–122 CrossRef
 .
. - L. J. Farrugia, J. Appl. Crystallogr., 2012, 45, 849–854 CrossRef CAS
 .
. - https://www.ccdc.cam.ac.uk/Community/csd-community/Free-Mercury/.
- S. K. Dey and A. Mukherjee, Coord. Chem. Rev., 2016, 310, 80–115 CrossRef CAS
 .
. - S. K. Dey and A. Mukherjee, New J. Chem., 2014, 38, 4985–4995 RSC
 .
. - M. El Boutaybi, N. Bouroumane, M. Azzouzi, M. Aaddouz, S. Bacroume, M. El Miz, R. Touzani, Z. Bahari, A. Zarrouk and A. El-Marghany, Crystals (Basel), 2023, 13, 155 CrossRef
 .
. - D. Gerlier and N. Thomasset, J. Immunol. Methods, 1986, 94, 57–63 CrossRef CAS
 .
. - M. C. Alley, D. A. Scudiere, A. Monks, M. Czerwinski, R. Shoemaker and M. R. Boyd, Proc. Am. Assoc. Cancer Res., 1986, 27, 389 Search PubMed
 .
. - D. Gerlier and N. Thomasset, J. Immunol. Methods, 1986, 94, 57–63 CrossRef CAS
 .
. - MTT Cell Proliferation Assay Instruction Guide, ATCC, VA, USA, https://www.atcc.org Search PubMed.
- G. Reshma, S. Nakul, P. M. Mahitha, N. V Kulkarni, D. Senthurpandi, S. S. Yamijala, W. W. Brennessel and W. D. Jones, J. Mol. Struct., 2022, 1251, 132005 CrossRef
 .
. - H. B. Howsaui, A. S. Basaleh, M. H. Abdellattif, W. M. I. Hassan and M. A. Hussien, Biomolecules, 2021, 11, 1138 CrossRef CAS
 .
. - G. L. Caldow, A. B. Van Cleave and R. L. Eager, Can. J. Chem., 1960, 38, 772–782 CrossRef CAS
 .
. - B. S. Satyanarayana, Proc. Natl. Acad. Sci., India, Sect. A, 1942, 15, 414–416 CrossRef
 .
. - M. Dembowski, V. Bernales, J. Qiu, S. Hickam, G. Gaspar, L. Gagliardi and P. C. Burns, Inorg. Chem., 2017, 56, 1574–1580 CrossRef CAS
 .
. - V. Krishnakumar, N. Jayamani and R. Mathammal, Spectrochim. Acta, Part A, 2011, 79, 1959–1968 CrossRef CAS
 .
. - A. S. Potapov and A. I. Khlebnikov, Polyhedron, 2006, 25, 2683–2690 CrossRef CAS
 .
. - G. Feng, K. N. McCabe, S. Wang, L. Maron and C. Zhu, Chem. Sci., 2020, 11, 7585–7592 RSC
 .
. - E. Badaruddin, Z. Aiyub, Z. Abdullah and S. B. Nasir, Malays. J. Anal. Sci., 2009, 13, 129–135 Search PubMed
 .
. - Y. Suzuki, M. Yamaji, S. Maki and T. Hirano, J. Photochem. Photobiol., A, 2016, 314, 93–95 CrossRef CAS
 .
. - R. Agarwal and M. K. Sharma, Inorg. Chem., 2018, 57, 10984–10992 CrossRef CAS
 .
. - M. Azam, G. Velmurugan, S. M. Wabaidur, A. Trzesowska-Kruszynska, R. Kruszynski, S. I. Al-Resayes, Z. A. Al-Othman and P. Venuvanalingam, Sci. Rep., 2016, 6, 32898 CrossRef CAS
 .
. - P. C. Burns, R. C. Ewing and F. C. Hawthorne, Can. Mineral., 1997, 35, 1551–1570 CAS
 .
. - A. A. Sharfalddin, A.-H. Emwas, M. Jaremko and M. A. Hussien, PLoS One, 2021, 16, e0256186 CrossRef CAS
 .
. - I. M. Yanachkova and M. Staevsky, J. Mater. Sci., 1973, 8, 606–610 CrossRef
 .
. - A. Sarkar, A. Chakraborty, A. Adhikary, S. Maity, A. Mandal, D. Samanta, P. Ghosh and D. Das, Dalton Trans., 2019, 48, 14164–14177 RSC
 .
. - M. A. Chrisman, M. J. Goldcamp, A. N. Rhodes and J. Riffle, J. Chem. Educ., 2023, 100, 893–899 CrossRef CAS
 .
. - M. Ashafaq, M. Raizada, M. Khalid, M. Shahid, M. Ahmad and Z. A. Siddiqi, J. Coord. Chem., 2018, 71, 2118–2145 CrossRef CAS
 .
. - M. Shahid, I. Mantasha, S. Khan, M. Mehtab, O. Yadav, A. Ansari, K. M. A. Qasem, A. Ahmed, M. Saniya and M. N. Akhtar, J. Mol. Struct., 2021, 1244, 130878 CrossRef CAS
 .
. - K. Pal, S. Barman and J. Bag, Chem. Biodivers., 2023, 20, e202201166 CrossRef CAS
 .
. - D. Mukherjee, P. Nag, A. A. Shteinman, S. R. Vennapusa, U. Mandal and M. Mitra, RSC Adv., 2021, 11, 22951–22959 RSC
 .
. - S. Reja, D. Sarkar, K. Sarkar, D. Mukherjee, T. K. S. Fayaz, P. Sanphui and R. K. Das, Inorg. Chim. Acta, 2024, 560, 121809 CrossRef CAS
 .
. - R. R. Tripathy, P. K. Deheri, P. Biswas, S. Jana and S. Sarkar, J. Mol. Struct., 2024, 1312, 138576 CrossRef CAS
 .
. - S. Das, A. Sahu, M. Joshi, S. Paul, M. Shit, A. Roy Choudhury and B. Biswas, ChemistrySelect, 2018, 3, 10774–10781 CrossRef CAS
 .
. - P. Seth, L. K. Das, M. G. B. Drew and A. Ghosh, Eur. J. Inorg. Chem., 2012, 2012, 2232–2242 CrossRef CAS
 .
. - M. S. Khan, M. Khalid, M. S. Ahmad, M. Shahid and M. Ahmad, Res. Chem. Intermed., 2020, 46, 2985–3006 CrossRef CAS
 .
. - A. Mouadili, D. Mazouzi and R. Touzani, Iran. J. Chem. Chem. Eng., 2023, 42, 1111–1125 CAS
 .
. - A. Mouadili, A. Attayibat, S. El Kadiri, S. Radi and R. Touzani, Appl. Catal., A, 2013, 454, 93–99 CrossRef CAS
 .
. - N. Podder and S. Mandal, New J. Chem., 2020, 44, 12793–12805 RSC
 .
. - S. Mukherjee, S. Roy, S. Mukherjee and B. Biswas, J. Mol. Struct., 2020, 1217, 128348 CrossRef CAS
 .
. - M. Garai, D. Dey, H. R. Yadav, A. R. Choudhury, M. Maji and B. Biswas, ChemistrySelect, 2017, 2, 11040–11047 CrossRef CAS
 .
. - A. Chatterjee, S. Khan and R. Ghosh, Polyhedron, 2019, 173, 114151 CrossRef CAS
 .
. - W. P. Sohtun, S. Muthuramalingam, M. Sankaralingam, M. Velusamy and R. Mayilmurugan, J. Inorg. Biochem., 2021, 216, 111313 CrossRef CAS
 .
. - A. K. Maji, A. Chatterjee, S. Khan, B. K. Ghosh and R. Ghosh, J. Mol. Struct., 2017, 1146, 821–827 CrossRef CAS
 .
. - K. Ghosh, K. Harms and S. Chattopadhyay, ChemistrySelect, 2017, 2, 8207–8220 CrossRef CAS
 .
. - A. Singh, A. Kumar, P. Kumar, T. Bhardwaj, R. Giri and N. Garg, Future Med. Chem., 2021, 13, 1341–1352 CrossRef CAS
 .
. - A. Baral, L. Satish, D. P. Das, H. Sahoo and M. K. Ghosh, New J. Chem., 2017, 41, 8130–8139 RSC
 .
. - H. A. Alhazmi, M. S. Alam, M. Albratty, A. Najmi, A. A. Abdulhaq, R. Hassani, W. Ahsan and A. N. Qramish, J. Chem., 2023, 2023, 2581653 Search PubMed
 .
. - M. Zhou, Y. Bi, H. Zhou, X. Chen, F. Zhang, Y. Li and X. Qu, ChemistryOpen, 2021, 10, 373–379 CrossRef CAS
 .
. - C. Di Nicola, F. Marchetti, C. Pettinari, R. Pettinari, F. Brisdelli, M. Crucianelli, C. Lelii and A. Crispini, Inorg. Chim. Acta, 2017, 455, 677–682 CrossRef CAS
 .
. - P. Seguí, J. J. Aguilera-Correa, E. Domínguez-Jurado, C. M. Sánchez-López, R. Pérez-Tanoira, A. V Ocaña, J. A. Castro-Osma, J. Esteban, A. Marcilla and C. Alonso-Moreno, Sci. Rep., 2021, 11, 16306 CrossRef
 .
. - M. Pellei, V. Gandin, L. Marchiò, C. Marzano, L. Bagnarelli and C. Santini, Molecules, 2019, 24, 1761 CrossRef CAS
 .
. - A. Carmona, V. Malard, E. Avazeri, S. Roudeau, F. Porcaro, E. Paredes, C. Vidaud, C. Bresson and R. Ortega, Neurotoxicology, 2018, 68, 177–188 CrossRef CAS
 .
.
Footnote |
| † Electronic supplementary information (ESI) available: ESI contains all the characterization data of the complexes such as IR, UV, NMR, Mass spectra and single crystal X-ray analysis; Spectral and kinetic data of the catechol oxidation reactions, aminophenol oxidation reactions, BSA-binding interactions are also provided along with the cytotoxicity analysis data. The XRD data of the complex C1 is deposited in CCDC. CCDC 2329479. For ESI and crystallographic data in CIF or other electronic format see DOI: https://doi.org/10.1039/d4ra06347c |
|
| This journal is © The Royal Society of Chemistry 2024 |
Click here to see how this site uses Cookies. View our privacy policy here.  Open Access Article
 *a,
Ajeetkumar Patil
 *b,
Suresh B. Arakerac and
Sam Johnd

![[thin space (1/6-em)]](https://www.rsc.org/images/entities/char_2009.gif) :
:![[thin space (1/6-em)]](https://www.rsc.org/images/entities/char_2009.gif) 100 (0.1 mmol
100 (0.1 mmol![[thin space (1/6-em)]](https://www.rsc.org/images/entities/char_2009.gif) :
:![[thin space (1/6-em)]](https://www.rsc.org/images/entities/char_2009.gif) 10 mmol). Further, the reaction parameters, i.e., solvent, pH, temperature, etc. were varied to achieve the optimum catalytic activity. The kinetic studies were conducted and the kinetic parameters such Vmax, KM and Kcat were calculated from Michaelis Menten equation plot and Lineweaver Burk plot.30,31
10 mmol). Further, the reaction parameters, i.e., solvent, pH, temperature, etc. were varied to achieve the optimum catalytic activity. The kinetic studies were conducted and the kinetic parameters such Vmax, KM and Kcat were calculated from Michaelis Menten equation plot and Lineweaver Burk plot.30,31
![[thin space (1/6-em)]](https://www.rsc.org/images/entities/char_2009.gif) :
:![[thin space (1/6-em)]](https://www.rsc.org/images/entities/char_2009.gif) 1) as the solvent. Various catalyst-to-substrate ratios such as 1
1) as the solvent. Various catalyst-to-substrate ratios such as 1![[thin space (1/6-em)]](https://www.rsc.org/images/entities/char_2009.gif) :
:![[thin space (1/6-em)]](https://www.rsc.org/images/entities/char_2009.gif) 50, 1
50, 1![[thin space (1/6-em)]](https://www.rsc.org/images/entities/char_2009.gif) :
:![[thin space (1/6-em)]](https://www.rsc.org/images/entities/char_2009.gif) 100, 1
100, 1![[thin space (1/6-em)]](https://www.rsc.org/images/entities/char_2009.gif) :
:![[thin space (1/6-em)]](https://www.rsc.org/images/entities/char_2009.gif) 200 and 1
200 and 1![[thin space (1/6-em)]](https://www.rsc.org/images/entities/char_2009.gif) :
:![[thin space (1/6-em)]](https://www.rsc.org/images/entities/char_2009.gif) 500 were tested to determine the catalyst's effectiveness. To understand the effects of solvents on the activity of phenoxazinone synthase, we conducted a reaction using various solvents, including water methanol and DMSO. The reactions were monitored and analysed using spectrophotometer analysis. The progress of the reaction was tracked by observing an increase in the distinct absorption peak of the resulting compound, 2-amino-phenoxazine-3-one, at a wavelength of 425 nm over a duration of 2 hours. The analysis was conducted at 10 minute intervals. The rate of the reactions was calculated using the initial slope of the plot of absorbance vs. time. We determined the T∞ value to calculate the rate in terms of concentration. To understand the effect of substrate concentration on the rate of the reactions, a Michaelis Menten plot was constructed and various kinetic parameters were calculated using Lineweaver Burk Plot.30,32
500 were tested to determine the catalyst's effectiveness. To understand the effects of solvents on the activity of phenoxazinone synthase, we conducted a reaction using various solvents, including water methanol and DMSO. The reactions were monitored and analysed using spectrophotometer analysis. The progress of the reaction was tracked by observing an increase in the distinct absorption peak of the resulting compound, 2-amino-phenoxazine-3-one, at a wavelength of 425 nm over a duration of 2 hours. The analysis was conducted at 10 minute intervals. The rate of the reactions was calculated using the initial slope of the plot of absorbance vs. time. We determined the T∞ value to calculate the rate in terms of concentration. To understand the effect of substrate concentration on the rate of the reactions, a Michaelis Menten plot was constructed and various kinetic parameters were calculated using Lineweaver Burk Plot.30,32
![[thin space (1/6-em)]](https://www.rsc.org/images/entities/char_2009.gif) :
:![[thin space (1/6-em)]](https://www.rsc.org/images/entities/char_2009.gif) 10 (catalyst
10 (catalyst![[thin space (1/6-em)]](https://www.rsc.org/images/entities/char_2009.gif) :
:![[thin space (1/6-em)]](https://www.rsc.org/images/entities/char_2009.gif) substrate) ratio in methanol (10 mL). After 2 h of reaction the reaction mixture was mixed with water (10 mL) and extracted using dichloromethane. The aqueous layer was acidified with 0.1 M H2SO4 and maintained a pH of ∼2. 1 mL of 10% KI was added to the acidified solution, followed by 2–3 drops of 3% ammonium molybdate. The solution turns bluish black and the formation of I3− was detected using a UV-Vis spectrophotometer.
substrate) ratio in methanol (10 mL). After 2 h of reaction the reaction mixture was mixed with water (10 mL) and extracted using dichloromethane. The aqueous layer was acidified with 0.1 M H2SO4 and maintained a pH of ∼2. 1 mL of 10% KI was added to the acidified solution, followed by 2–3 drops of 3% ammonium molybdate. The solution turns bluish black and the formation of I3− was detected using a UV-Vis spectrophotometer.
![[thin space (1/6-em)]](https://www.rsc.org/images/entities/char_2009.gif) 000 cells using DMEM (Dulbecco's Modified Eagle Medium). 200 μL of the cell suspension were added to each well of the 96 well microtiter plate. The plate was then incubated at 37 °C and 5% CO2 atmosphere for 24 hours. The cells were exposed to the complexes for 24 hours in a medium containing metal complex concentration ranging from 10 to 50 μg mL−1. The plate was removed from the incubator and the drug containing media was aspirated. 100 μL of medium containing 10% MTT reagent was then added to each well to get a final concentration of 0.5 mg mL−1 and the plate was incubated at 37 °C and 5% CO2 atmosphere for 3 h The culture medium was removed completely without disturbing the crystals formed. Then 100 μl of solubilisation solution (DMSO) was added and the plate was gently shaken in a rotary shaker to solubilize the formed formazan. The absorbance was quantified using a microplate reader at two specific wavelengths: 570 nm and 630 nm. The percentage growth inhibition was determined by subtracting the background and blank values. The cytotoxicity has been assessed using the MTT assay, with cancer cells treated with cisplatin as a positive control and untreated cancer cell as the negative control under similar conditions. The results of the cytotoxicity activities on the cell lines against the metal complexes were evaluated with the dose value of the metal complex required to reduce the cell lines to 50% (IC50).33–36
000 cells using DMEM (Dulbecco's Modified Eagle Medium). 200 μL of the cell suspension were added to each well of the 96 well microtiter plate. The plate was then incubated at 37 °C and 5% CO2 atmosphere for 24 hours. The cells were exposed to the complexes for 24 hours in a medium containing metal complex concentration ranging from 10 to 50 μg mL−1. The plate was removed from the incubator and the drug containing media was aspirated. 100 μL of medium containing 10% MTT reagent was then added to each well to get a final concentration of 0.5 mg mL−1 and the plate was incubated at 37 °C and 5% CO2 atmosphere for 3 h The culture medium was removed completely without disturbing the crystals formed. Then 100 μl of solubilisation solution (DMSO) was added and the plate was gently shaken in a rotary shaker to solubilize the formed formazan. The absorbance was quantified using a microplate reader at two specific wavelengths: 570 nm and 630 nm. The percentage growth inhibition was determined by subtracting the background and blank values. The cytotoxicity has been assessed using the MTT assay, with cancer cells treated with cisplatin as a positive control and untreated cancer cell as the negative control under similar conditions. The results of the cytotoxicity activities on the cell lines against the metal complexes were evaluated with the dose value of the metal complex required to reduce the cell lines to 50% (IC50).33–36
![[double bond, length as m-dash]](https://www.rsc.org/images/entities/char_e001.gif) N) vibrations are responsible for the broad bands observed at 1515 cm−1 and 1399 cm−1. The strong, intense band seen at 1470 cm−1 and the medium band observed at 1275 cm−1 are attributed to the C
N) vibrations are responsible for the broad bands observed at 1515 cm−1 and 1399 cm−1. The strong, intense band seen at 1470 cm−1 and the medium band observed at 1275 cm−1 are attributed to the C![[double bond, length as m-dash]](https://www.rsc.org/images/entities/char_e001.gif) C and C–N vibrations of the pyrazole ring, respectively. In the range of 1092 cm−1 to 1024 cm−1, the strong bands observed are attributed to ν(N–N) vibrations. ν(O–H) stretching is attributed to prominent, intense bands observed at 3346 cm−1 and 3124 cm−1, which denote the presence of water molecules.24,37 Strong bands observed between 900 to 940 cm−1 are assigned to uranyl asymmetric normal vibrations.38 The strong absorption observed at 691 cm−1 results from the acetate groups attached to the uranyl group by covalent bonds. Similarly, in the IR spectrum of C2, pyrazole ring ν(C–H) and methyl ν(C–H) vibrations are observed as medium intensity bands at 3024 cm−1 and 2923 cm−1 respectively. A strong band observed at 1550 cm−1 is attributed to pyrazole ring ν(C
C and C–N vibrations of the pyrazole ring, respectively. In the range of 1092 cm−1 to 1024 cm−1, the strong bands observed are attributed to ν(N–N) vibrations. ν(O–H) stretching is attributed to prominent, intense bands observed at 3346 cm−1 and 3124 cm−1, which denote the presence of water molecules.24,37 Strong bands observed between 900 to 940 cm−1 are assigned to uranyl asymmetric normal vibrations.38 The strong absorption observed at 691 cm−1 results from the acetate groups attached to the uranyl group by covalent bonds. Similarly, in the IR spectrum of C2, pyrazole ring ν(C–H) and methyl ν(C–H) vibrations are observed as medium intensity bands at 3024 cm−1 and 2923 cm−1 respectively. A strong band observed at 1550 cm−1 is attributed to pyrazole ring ν(C![[double bond, length as m-dash]](https://www.rsc.org/images/entities/char_e001.gif) N) vibrations. An intense band observed at 1464 cm−1 is assigned to vibrations of pyrazole ring ν(C
N) vibrations. An intense band observed at 1464 cm−1 is assigned to vibrations of pyrazole ring ν(C![[double bond, length as m-dash]](https://www.rsc.org/images/entities/char_e001.gif) C). Medium intense bands observed at 1268 cm−1 and 1003 cm−1 correspond to the characteristic pyrazole ring group vibrations ν(C–N) and ν(N–N). A strong band observed at 3330 cm−1 is assigned to O–H stretching, indicating the presence of water molecules. The strong peak at 919 cm−1 is due to the anti-symmetrical normal vibration of the uranyl ion.39 The strong absorption at 675 cm−1 results from the acetate groups attached to the uranyl centre. The IR spectra of the ligands (L1 and L2) and complexes (C1 and C2) are provided in the ESI.† The Raman spectra of the complexes C1 and C2 were analysed. A medium intensity peak observed at 842 cm−1 in C2 corresponds to the U
C). Medium intense bands observed at 1268 cm−1 and 1003 cm−1 correspond to the characteristic pyrazole ring group vibrations ν(C–N) and ν(N–N). A strong band observed at 3330 cm−1 is assigned to O–H stretching, indicating the presence of water molecules. The strong peak at 919 cm−1 is due to the anti-symmetrical normal vibration of the uranyl ion.39 The strong absorption at 675 cm−1 results from the acetate groups attached to the uranyl centre. The IR spectra of the ligands (L1 and L2) and complexes (C1 and C2) are provided in the ESI.† The Raman spectra of the complexes C1 and C2 were analysed. A medium intensity peak observed at 842 cm−1 in C2 corresponds to the U![[double bond, length as m-dash]](https://www.rsc.org/images/entities/char_e001.gif) O stretching vibrations.40 In the case of C1, it is observed as a weak peak. The broad peak observed in the range of 100–300 cm−1 for both the complexes is attributed to combination of uranyl bending vibrations.41 The U–N stretching vibrations are expected to appear in the region below 200 cm−1 as weak-bonds are perhaps masked under this broad peak. Other prominent peaks observed around 1500 cm−1 are originating from ligand C
O stretching vibrations.40 In the case of C1, it is observed as a weak peak. The broad peak observed in the range of 100–300 cm−1 for both the complexes is attributed to combination of uranyl bending vibrations.41 The U–N stretching vibrations are expected to appear in the region below 200 cm−1 as weak-bonds are perhaps masked under this broad peak. Other prominent peaks observed around 1500 cm−1 are originating from ligand C![[double bond, length as m-dash]](https://www.rsc.org/images/entities/char_e001.gif) C and C
C and C![[double bond, length as m-dash]](https://www.rsc.org/images/entities/char_e001.gif) N vibrations.42 Raman spectra of both the complexes are provided in the ESI.†
N vibrations.42 Raman spectra of both the complexes are provided in the ESI.†
![[double bond, length as m-dash]](https://www.rsc.org/images/entities/char_e001.gif) O bond length is found to be 1.78 Å and the average U–O bond length with the bridging oxygen is found to be 2.30 Å. The average U–O bond length with acetate oxygen is found to be 2.37 Å. These bond length values are in accordance with previously reported values.49 All the important bond lengths and angles are provided in the ESI.† Interestingly, free ligand molecules (i.e., bis(pyrazolyl)methane) were seen to strongly interact with the uranyl clusters via hydrogen bonding (average bond length ∼2.80 Å) with coordinated water molecules and form a three-dimensional network (Fig. 6).
O bond length is found to be 1.78 Å and the average U–O bond length with the bridging oxygen is found to be 2.30 Å. The average U–O bond length with acetate oxygen is found to be 2.37 Å. These bond length values are in accordance with previously reported values.49 All the important bond lengths and angles are provided in the ESI.† Interestingly, free ligand molecules (i.e., bis(pyrazolyl)methane) were seen to strongly interact with the uranyl clusters via hydrogen bonding (average bond length ∼2.80 Å) with coordinated water molecules and form a three-dimensional network (Fig. 6).


![[thin space (1/6-em)]](https://www.rsc.org/images/entities/char_2009.gif) :
:![[thin space (1/6-em)]](https://www.rsc.org/images/entities/char_2009.gif) 1) (Entry 4, Table 2) resulted into a slight decrease in the activity. It was evident that, the solvent plays a prominent role in the catecholase activity and methanol is the most appropriate solvent for this system.54 Higher binding affinity of the DMSO towards the metal centre, which blocks the substrate–catalyst interaction is envisaged to be the reason for decreased activity in DMSO.55 The pH of the catalytic reaction in methanol was found to be 7.2 at RT (the pH of the reaction mixture was measured using a digital pH meter; before each reading the instrument was calibrated using an acid base and neutral buffer). Since the pH of the reaction medium is known to play key role in the catechol oxidase activity,54 the pH of the catalytic reaction was changed to 10 (by adding 0.1 N NaOH to the reaction mixture) (Entry 5, Table 2) and to 3 (by adding 0.1 N HNO3 to the reaction mixture) (Entry 6, Table 2). It was evident that, at the basic condition (pH ∼ 10, Entry 5, Table 2), the catalytic activity of the system slightly improved, while at the acidic condition (pH ∼ 3, Entry 6, Table 2) the catalytic activity decreased significantly. The initial catalytic reaction was carried out at RT (25 °C) (Entry 1, Table 2), in order to examine the effect of temperature, the catalytic reaction was carried out at a higher temperature (i.e., 50 °C) (Entry 7, Table 2). Indeed, at the high temperature, the reaction rate was found to nearly double its value, indicating the positive influence of the temperature on the catalytic reaction. Since all the catalytic reactions were conducted in open air, the atmospheric oxygen is envisaged to be captured and utilized by the catalyst in the current oxidation reaction.56 Therefore, increase in the oxygen concentration is expected to benefit the reaction. Certainly, when the catalytic reaction was conducted in high oxygen atmosphere (by purging oxygen into reaction mixture, till saturation), noticeable increase in the catalytic activity was observed (Entry 8, Table 2). Fig. 8 shows the UV-vis spectra of the catalytic reactions of catalyst C1, (a) under ambient conditions (as Entry 1, Table 2); (b) under high O2 concentration conditions (as Entry 8, Table 2). Fig. 9 shows the plots of change in the product (DTBQ) concentration with respect to time, under ambient condition and under high O2 concentration.
1) (Entry 4, Table 2) resulted into a slight decrease in the activity. It was evident that, the solvent plays a prominent role in the catecholase activity and methanol is the most appropriate solvent for this system.54 Higher binding affinity of the DMSO towards the metal centre, which blocks the substrate–catalyst interaction is envisaged to be the reason for decreased activity in DMSO.55 The pH of the catalytic reaction in methanol was found to be 7.2 at RT (the pH of the reaction mixture was measured using a digital pH meter; before each reading the instrument was calibrated using an acid base and neutral buffer). Since the pH of the reaction medium is known to play key role in the catechol oxidase activity,54 the pH of the catalytic reaction was changed to 10 (by adding 0.1 N NaOH to the reaction mixture) (Entry 5, Table 2) and to 3 (by adding 0.1 N HNO3 to the reaction mixture) (Entry 6, Table 2). It was evident that, at the basic condition (pH ∼ 10, Entry 5, Table 2), the catalytic activity of the system slightly improved, while at the acidic condition (pH ∼ 3, Entry 6, Table 2) the catalytic activity decreased significantly. The initial catalytic reaction was carried out at RT (25 °C) (Entry 1, Table 2), in order to examine the effect of temperature, the catalytic reaction was carried out at a higher temperature (i.e., 50 °C) (Entry 7, Table 2). Indeed, at the high temperature, the reaction rate was found to nearly double its value, indicating the positive influence of the temperature on the catalytic reaction. Since all the catalytic reactions were conducted in open air, the atmospheric oxygen is envisaged to be captured and utilized by the catalyst in the current oxidation reaction.56 Therefore, increase in the oxygen concentration is expected to benefit the reaction. Certainly, when the catalytic reaction was conducted in high oxygen atmosphere (by purging oxygen into reaction mixture, till saturation), noticeable increase in the catalytic activity was observed (Entry 8, Table 2). Fig. 8 shows the UV-vis spectra of the catalytic reactions of catalyst C1, (a) under ambient conditions (as Entry 1, Table 2); (b) under high O2 concentration conditions (as Entry 8, Table 2). Fig. 9 shows the plots of change in the product (DTBQ) concentration with respect to time, under ambient condition and under high O2 concentration.
![[thin space (1/6-em)]](https://www.rsc.org/images/entities/char_2009.gif) :
:![[thin space (1/6-em)]](https://www.rsc.org/images/entities/char_2009.gif) substrate (1
substrate (1![[thin space (1/6-em)]](https://www.rsc.org/images/entities/char_2009.gif) :
:![[thin space (1/6-em)]](https://www.rsc.org/images/entities/char_2009.gif) 100)) determined with the help of UV-visible spectral analysis
100)) determined with the help of UV-visible spectral analysis
![[thin space (1/6-em)]](https://www.rsc.org/images/entities/char_2009.gif) :
:![[thin space (1/6-em)]](https://www.rsc.org/images/entities/char_2009.gif) water (1
water (1![[thin space (1/6-em)]](https://www.rsc.org/images/entities/char_2009.gif) :
:![[thin space (1/6-em)]](https://www.rsc.org/images/entities/char_2009.gif) 1)
1)

![[thin space (1/6-em)]](https://www.rsc.org/images/entities/char_2009.gif) :
:![[thin space (1/6-em)]](https://www.rsc.org/images/entities/char_2009.gif) 10 catalyst: substrate ratio was used for the investigation. The formation of I3− was detected by UV-Vis spectral analysis of the reaction mixture (Fig. 10).9
10 catalyst: substrate ratio was used for the investigation. The formation of I3− was detected by UV-Vis spectral analysis of the reaction mixture (Fig. 10).9
![[thin space (1/6-em)]](https://www.rsc.org/images/entities/char_2009.gif) :
:![[thin space (1/6-em)]](https://www.rsc.org/images/entities/char_2009.gif) 50, 1
50, 1![[thin space (1/6-em)]](https://www.rsc.org/images/entities/char_2009.gif) :
:![[thin space (1/6-em)]](https://www.rsc.org/images/entities/char_2009.gif) 100, 1
100, 1![[thin space (1/6-em)]](https://www.rsc.org/images/entities/char_2009.gif) :
:![[thin space (1/6-em)]](https://www.rsc.org/images/entities/char_2009.gif) 150). The concentration versus observed rate plot shows a typical hyperbolic curve (Fig. 11), which is in line with the Michaelis Menten kinetic model. It indicates that the rate of reaction increases with the increase in substrate concentration.57 The kinetic parameters of the catalytic reaction obtained from the Lineweaver Burk plot are provided in Table 3. This reaction exhibited Kcat value of 400 h−1 indicating its high potency. Kcat values of some of the model compounds containing copper,58 cobalt,59 zinc,60 manganese61,62 and uranyl9 centers are listed in Table S9 (ESI†) for comparison.
150). The concentration versus observed rate plot shows a typical hyperbolic curve (Fig. 11), which is in line with the Michaelis Menten kinetic model. It indicates that the rate of reaction increases with the increase in substrate concentration.57 The kinetic parameters of the catalytic reaction obtained from the Lineweaver Burk plot are provided in Table 3. This reaction exhibited Kcat value of 400 h−1 indicating its high potency. Kcat values of some of the model compounds containing copper,58 cobalt,59 zinc,60 manganese61,62 and uranyl9 centers are listed in Table S9 (ESI†) for comparison.


![[thin space (1/6-em)]](https://www.rsc.org/images/entities/char_2009.gif) :
:![[thin space (1/6-em)]](https://www.rsc.org/images/entities/char_2009.gif) 50 catalyst to substrate ratio.
50 catalyst to substrate ratio.![[thin space (1/6-em)]](https://www.rsc.org/images/entities/char_2009.gif) :
:![[thin space (1/6-em)]](https://www.rsc.org/images/entities/char_2009.gif) substrate (1
substrate (1![[thin space (1/6-em)]](https://www.rsc.org/images/entities/char_2009.gif) :
:![[thin space (1/6-em)]](https://www.rsc.org/images/entities/char_2009.gif) 50)) determined with the help of UV-visible spectral analysis
50)) determined with the help of UV-visible spectral analysis
![[thin space (1/6-em)]](https://www.rsc.org/images/entities/char_2009.gif) :
:![[thin space (1/6-em)]](https://www.rsc.org/images/entities/char_2009.gif) 100.
100.![[thin space (1/6-em)]](https://www.rsc.org/images/entities/char_2009.gif) :
:![[thin space (1/6-em)]](https://www.rsc.org/images/entities/char_2009.gif) MeOH
MeOH![[thin space (1/6-em)]](https://www.rsc.org/images/entities/char_2009.gif) :
:![[thin space (1/6-em)]](https://www.rsc.org/images/entities/char_2009.gif) MeOH
MeOH![[thin space (1/6-em)]](https://www.rsc.org/images/entities/char_2009.gif) :
:![[thin space (1/6-em)]](https://www.rsc.org/images/entities/char_2009.gif) MeOH
MeOH![[thin space (1/6-em)]](https://www.rsc.org/images/entities/char_2009.gif) :
:![[thin space (1/6-em)]](https://www.rsc.org/images/entities/char_2009.gif) MeOH
MeOH![[thin space (1/6-em)]](https://www.rsc.org/images/entities/char_2009.gif) :
:![[thin space (1/6-em)]](https://www.rsc.org/images/entities/char_2009.gif) MeOH
MeOH![[thin space (1/6-em)]](https://www.rsc.org/images/entities/char_2009.gif) :
:![[thin space (1/6-em)]](https://www.rsc.org/images/entities/char_2009.gif) MeOH
MeOH


.
.
.
.
.
.
.
.
.
.
.
.
.
.
.
.
.
.
.
.
.
.
.
.
.
.
.
.
.
.
.
.
.
.
.
.
.
.
.
.
.
.
.
.
.
.
.
.
.
.
.
.
.
.
.
.
.
.
.
.
.
.
.
.
.
.
.
.
.
.
.
.
.
.
.
.
.


