 Open Access Article
Electrochemical evaluation of screen-printed sensor manufacturing and LOx enzyme immobilization for lactate biomarker detection: influence of reference electrode material
Julia Konzen Moreira *abhj,
Milleny Germann Souza
 bj,
Gabriela Victória de Mello Jantzch
 cj,
Duane da Silva Moraes
 dfj,
Thomas Sponchiado Pastore
 ej,
Iara Janaína Fernandes
 df,
Juliana Nichterwitz Scherer
 bg,
Jacqueline Ferreira Leite dos Santos
 ah,
Willyan Hasenkamp Carreira
 ij and
Priscila Schimdt Lora
 bk
bk
aPhD Graduate Program in Chemistry, Federal University of Rio Grande do Sul (UFRGS), Brazil
bUndergraduate Program in Biomedical Science, University of Vale do Rio dos Sinos (UNISINOS), Brazil
cMaster's Graduate Program in Medicine: Medical Sciences, Federal University of Rio Grande do Sul (UFRGS), Brazil
dPhD Graduate Program in Mining, Metallurgical and Materials Engineering, Federal University of Rio Grande do Sul (UFRGS), Brazil
eGraduate Program in Biomedical Engineering, University of Vale do Rio dos Sinos (UNISINOS), Brazil
fUndergraduate Program in Chemistry Engineering, University of Vale do Rio dos Sinos (UNISINOS), Brazil
gPhD Graduate Program in Psychiatry and Behavioral Sciences, Federal University of Rio Grande do Sul (UFRGS), Brazil
hLaboratory of Applied Materials and Interfaces, Institute of Chemistry, Federal University of Rio Grande do Sul (UFRGS), Brazil
iPhD Graduate Program in Bioengineering and Biotechnology, Swiss Federal Institute of Technology Lausanne (EPFL), Switzerland
jBiosens Development and Industry LTDA (BIOSENS), Theodomiro Porto do Fonseca Avenue, Sao Leopoldo, RS 93022-718, Brazil. E-mail: juliakonzenm@gmail.com
kPhD Graduate Program in Medicine: Medical Sciences, Federal University of Rio Grande do Sul (UFRGS), Brazil
First published on 29th November 2024
Abstract
Electrochemical sensors have gained significant attention in medical diagnostics, with continuous advancements in materials improving their performance. This study focuses on the development of screen-printed electrodes (SPEs) for lactate detection. The electrodes were produced using a carbon/graphene paste, and this material was evaluated as an alternative to the commonly used Ag/AgCl reference electrode (WE). The screen-printing technique enabled scalable, efficient sensor production on polymeric substrates. Cyclic voltammetry (CV) was used to assess the electrochemical properties and reproducibility of the sensors. The results showed that Ag/AgCl WE exhibited a higher ΔEp, indicating greater charge transfer resistance, but also demonstrated higher current density, which enhances the efficiency of the faradaic process and improves repeatability. To evaluate the impact of the conductive material of the WE on lactate detection, lactate oxidase (LOx) was immobilized on the working electrode using a Nafion polymer membrane, ensuring enzyme stability and minimizing interference. The linear relationship between lactate concentration and measured electric current revealed that carbon/graphene reference electrodes are a viable alternative to Ag/AgCl, offering comparable performance in terms of sensitivity and detection limit. These sensors are unaffected by interferents such as glucose and ascorbic acid; however, when using human plasma, a reduction in the measured electric current was observed at all concentrations, which may impact analyte detection sensitivity. This finding suggests the need for future studies to evaluate other biological interferents.
1 Introduction
Electrochemical sensors have shown substantial potential across diverse real-time and in situ applications, spanning pharmaceutical testing, environmental monitoring, and particularly medical diagnostics. In medical applications, biosensors are devices engineered to measure chemical, biological, or biochemical reactions, and electrochemical detection often utilises a three-electrode system that functions as a transducer. Constructed from conductive materials, this system converts chemical reactions into electrical signals that can be processed to determine the presence or concentration of specific analytes in a sample. The three-electrode setup is composed of conductive materials such as gold, carbon, silver, platinum, or copper and includes a working electrode (WE), a counter electrode (CE), and a reference electrode (RE). The RE, typically made of Ag/AgCl, provides a stable and known potential to ensure measurement consistency. Each electrode plays a crucial role in achieving accurate, sensitive, and reproducible results. The WE detects reaction-generated signals by responding to electrical potentials, while the RE maintains a constant potential, and the CE completes the circuit, allowing current flow. Substance detection is often directed by a bioreceptor immobilized on the WE, such as enzymes, antibodies, antigens, hormones, neurotransmitters, or amino acids which facilitates the specific interaction with the target analyte.1,2For constructing sensors from these conductive materials, various methods are employed, including chemical and physical vapour deposition, electrodeposition, photolithography, and screen printing. These techniques enable precise control over key parameters such as thickness, uniformity, dimensions, tolerances, and overall cost. This level of control is essential for tailoring the sensors' specific characteristics to meet the demands of their intended applications.3 Screen printing is the most explored method in sensor fabrication due to its ability to produce with repeatability, along with the simplicity and low cost of the technique. This versatility makes it suitable for applications ranging from prototyping in research and development to large-scale industrial production. Sensors produced by this technique are known as SPEs, or screen-printed electrodes. This technique involves transferring a conductive material onto a base, usually flexible substrates like paper or plastic, through a screen containing the designed electrode patterns, allowing the printing of dozens of sensors in a single step.4 Advancements in equipment have further optimised the screen-printing technique, with different generations of machinery offering varying capabilities. The choice of equipment depends on factors such as production capacity, resolution, and the properties of the substrate and conductive material used. These advancements ensure the efficient production of high-quality sensors tailored to specific technical requirements.
In addition to sensor manufacturing, the immobilization of biological receptors is crucial in defining a biosensor's composition. This process aims to securely attach bioreceptors to the sensor surface, thereby enhancing the stability and longevity of specific molecules used for detecting biological analytes. When it comes to enzymes, immobilization has numerous advantages, among them the increase in the stability of the catalytic activity, which allows to effectively capture the communication between the enzyme and the analyte electrically, in addition to the reduction in the risk of contamination between the reactants.5
Encapsulation techniques, covalent bonds, and chemical adsorption are reported in the literature; however, physical adsorption is widely used due to various advantageous characteristics. This technique is relatively simple, eliminating complex and time-consuming steps, and is cost-effective as it does not require the use of multiple reagents or specialized equipment. Physical adsorption allows for rapid immobilization of bioreceptors, resulting in a quicker response from the biosensor. Furthermore, this approach preserves the biological activity of the bioreceptors, as it does not involve chemical modifications that could affect their natural functions. On a prototyping scale, this procedure can be performed using an automatic pipettor, while on a large scale, high-performance depositors can efficiently and accurately perform the same function. Therefore, the combination of the screen-printing technique for sensor production with physical adsorption for bioreceptor immobilization enables the development of electrochemical biosensors in both prototyping and industrial contexts.6,7
To demonstrate the electrochemical characteristics of sensors, Cyclic Voltammetry (CV) is frequently used. This popular and straightforward technique measures the electrical current while the potential of the WE is cyclically varied in redox reactions, using solutions that contain redox couples, such as potassium ferrocyanide and potassium ferricyanide. By applying a potential in more negative (cathodic) regions, the reduction of the compound present in the solution occurs, generating a peak with a current proportional to the compound's concentration in the sensor. After this reduction phase, the potential is reversed and swept in the opposite direction toward more positive (anodic) regions, returning to the initial value. In reversible reactions, this results in oxidation, producing a peak symmetric to the reduction peak.
Therefore, CV can provide valuable data on the reproducibility of the sensor manufacturing process. This is because structural characteristics of the sensors—such as thickness, type of material, and potential flaws—can directly impact the electrical current obtained during measurements. In other words, CV can help assess the consistency of sensors, as variations in these structural characteristics influence sensor performance.8,9
From this measurement, peak current data is extracted to calculate the delta peak, which provides insights into the reversibility of redox reactions—a desirable property in electrochemical sensors. A delta peak of approximately 59 mV/n (where n is the number of electrons transferred) indicates that the sensor can perform redox reactions efficiently and quickly. Conversely, a larger delta peak suggests that the redox reactions are not fully reversible, pointing to possible limitations such as slow electron transfer kinetics or restricted diffusion of the analytes. Additionally, the sensor's stability can be assessed by monitoring changes in the delta peak over multiple voltammetry cycles. A consistent delta peak over time indicates good operational stability, while significant variations may suggest sensor degradation or alterations in the electrode surface. Therefore, the delta peak is also a valuable measure to evaluate changes on the sensor surface during bioreceptor immobilization processes.10–12
Researchers worldwide have focused their efforts on the application of sensors, especially those manufactured through screen printing, for the detection of biological biomarkers that indicate critical health conditions, such as lactate. This biomarker is widely studied, as blood lactate concentrations exceeding 2 mmol L−1 (approximately 18 mg dL−1) are indicative of hyperlactatemia, a condition that reflects low oxygen availability to tissues, also known as hypoxia. Several factors can trigger an increase in lactate. Under physiological conditions, this increase is observed during intense physical activities due to high energy demand. Conversely, in pathological conditions, the rise in lactate occurs due to metabolic dysfunctions associated with hypoperfusion, which require rapid identification to anticipate medical decisions and reduce adverse outcomes, such as in cases of sepsis, trauma, and heart failure. In the context of sepsis, for example, where this marker is considered a risk predictor, each hour of delay in its identification increases the patient's risk of mortality by 9%.13–16
Currently, lactate determination tests are performed centrally in clinical laboratories, requiring skilled professionals and specific infrastructure for processing biological samples. Quantification is typically conducted using colorimetric techniques and spectrophotometry, which measures the absorbance of light during the lactate oxidation–reduction reaction mediated by the enzymes Lactate Oxidase (LOx) or Lactate Dehydrogenase (LDH).17 Regarding clinical importance of lactate in aiding the diagnosis of various conditions of low oxygen availability, the last decade of studies has worked on the challenge of access to lactate testing in out-of-hospital settings. Electrochemical biosensor technology offers a solution by measuring charge transfers between ions generated during the lactic acid oxidation reaction mediated by LDH or LOx in point-of-care devices. This technology transduces electrical signals, enabling the detection of analyte levels during triage procedures in out-of-hospital environments. This approach ensures rapid identification of the patient's health status severity, significantly reducing the health team's decision-making time.18–22
However, research and industry face challenges in the large-scale production of these POC (point of care) devices, which must maintain reproducible performance and precise technical specifications. Manufacturing costs need to be addressed, alongside the requirement for sterile environments to achieve the repeatability necessary for diagnostic methods. Overcoming these factors is essential for successful industrialization. Additionally, challenges remain in immobilizing the specific bioreceptor for the target analyte on the sensors. Effective immobilization techniques are needed to ensure stability and to minimize the impact of interfering species.2,23
Considering that the studies available in the literature typically use Ag/AgCl as a reference electrode in biosensors that detect the analyte lactate, an alternative material for this electrode was evaluated in this study. These electrodes were fabricated from graphene carbon paste using the screen-printing technique. The materials and methods were selected for their cost-effectiveness and suitability for large-scale production. With the objective of evaluating the electrochemical properties (sensitivity) of these sensors and the manufacturing quality (reproducibility), cyclic voltammetry was used as the assessment technique. Additionally, with the objective of reducing costs and production steps, the suitability of an alternative WE, distinct from Ag/AgCl, was evaluated for applications involving the oxidation reactions of lactate using the LOx enzyme immobilized on the WE.
2 Materials and methods
2.1 Materials
Carbon/graphene paste and Ag/AgCl paste (silver/silver chloride) from Sunchemical were used to print electrodes onto a flexible polymeric substrate obtained from Coveme. The printing process employed steel screens with a 250 mm mesh, set at a 22.5° angle and a tension of 13 N, enabling the simultaneous fabrication of 40 electrodes. Starpac adhesives were used as insulating layers to delimit the effective area and immobilization area. Potassium ferrocyanide and potassium chloride (synth) were used for electrochemical characterization. Nafion 117 (5%, Sigma-Aldrich) and Lactate Oxidase (LOx) Enzyme from a commercial kit (Labtest® Kit) suspended in 50 mmol per L buffer pH 7.2, 4-aminoantipyrine ≥ 0.05 mmol per L peroxidase ≥ 1000 U L−1 and preservatives, lactate oxidase ≥ 1000 U L−1, N-ethyl-N-(2-hydroxy-3-sulfopropyl)-3-methyllaniline (TOOS) ≥ 1.5 mmol L−1 and preservatives were used to modify the sensors. Finally, a 40 mg per dL lactate enzyme standard solution (Labtest® commercial Kit) was used in the lactate detection assay. Ultrapure water was used to prepare all solutions.2.2 Sensor manufacturing
The sensors used in this study were provided by the startup Biosens, which authorised the presentation of the printing process steps. A semi-automatic screen printer (Stencil Printer, model SPR45-VA), equipped with steel screens was employed to fabricate two production processes of three-electrode systems on a flexible polymeric substrate to investigate the influence of WE composition. Each configuration comprised a 4 mm diameter working electrode (WE) and a counter electrode (CE), both screen-printed using carbon/graphene conductive ink. The systems differed in the conductive material used for the RE: in the first production process configuration, the RE was printed with carbon/graphene paste, while in the second process, a Ag/AgCl paste was applied.For the carbon/graphene three-electrode systems fabrication with carbon/graphene RE, screen 1 (engraved design of the WE, CE and RE electrodes) was positioned on a flexible substrate fixed to the screen-printing equipment, and the carbon/graphene paste was applied using a rubber spatula. After, the screen-printed electrodes were cured at 130 °C in a non-convection oven (ETHIK Technology, model 440-2D, 47 L), resulting in the screen-printed electrodes of Process 1 (referred to as SPE-C/G-RE).
For the carbon/graphene three-electrode systems fabrication with Ag/AgCl RE, screen 2 (engraved design of the RE electrode), was precisely positioned over the flexible substrate containing the initial print of the three-electrode systems and was fixed to the screen-printing equipment. Subsequently, the Ag/AgCl paste was uniformly applied using a rubber spatula. The print was then cured at 100 °C for 10 minutes, resulting in the screen-printed electrodes of Process 2 (referred to as SPE-Ag/AgCl-RE). Fig. 1 illustrates a detailed schematic of the screen-printed electrode fabrication process, as developed and provided by the startup Biosens.
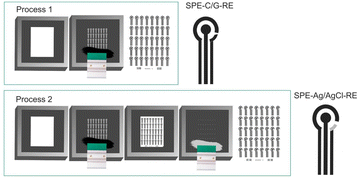 | ||
| Fig. 1 Differences in the sensor screen-printing process. (Process 1): Printing of SPE with carbon/graphene RE. (Process 2): Printing of SPE with Ag/AgCl RE. | ||
To define the effective area, insulating circular layers with an 8 mm diameter were adhered. Finally, the sensors were individually separated using a guillotine and the dimensions of each sensor was 10 × 25 mm2.
Each production was carried out in three batches of 15 prints/batch, resulting in the production of 1800 sensors with a carbon/graphene RE and 1800 sensors with an Ag/AgCl RE.
2.3 Characterization of the sensors
An electronic profilometer (Alpha-Step®, model D-500 Stylus Profiler) was used to characterize the thickness variation during the screen-printing process, carried out on 3 randomly selected sensors from each batch (therefore, n = 9/SPE process).Cyclic Voltammetry (CV) using a PalmSens4 portable potentiostat was carried out on 10 randomly selected sensors from each batch (therefore, n = 30/SPE process) to evaluate the electrochemical differences between the SPE-C/G-RE and SPE-Ag/AgCl-RE. The potential ranged from −0.4 to 0.6 V, with a scan rate of 100 mV s−1, over 10 cycles, and an electrolyte solution of potassium ferrocyanide (10 mM) in potassium chloride (1.0 M) was used as a redox probe. The data used for the analyses refer to the fifth cycle of the voltammograms. The variation of oxidation potential (ΔEp) was calculated by subtracting the reduction peak potential (Epc) from the oxidation peak potential (Epa) using the equation: ΔEp = Epa − Epc. In addition, data was extracted from the anodic and cathodic peak current, the current density was calculated using a WE area of 12.6 mm2 (Ja and Jc, respectively) and the electrochemical symmetry was obtained through the ratio of the current densities (Ja/Jc).
2.4 Immobilization of lactate oxidase (LOx) enzyme
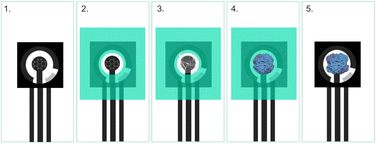
The immobilization of the lactate oxidase (LOx) enzyme was conducted on the surface of the working electrode (WE) in both screen-printed electrodes SPE-C/G-RE and SPE-Ag/AgCl-RE. Fig. 2 illustrates a detailed schematic of the LOx immobilization process. Initially, a circular adhesive with a diameter of 4 mm was applied to define the immobilization area on the WE surface. Following this, 5 μL of Nafion was deposited onto the WE to modify its surface properties, enhancing enzyme adherence and stability (this step is referred to as SPE-C/G-RE-Nafion and SPE-Ag/AgCl-RE-Nafion). The Nafion layer was allowed to dry for 5 minutes at room temperature to ensure proper coating, forming a polymeric membrane. Subsequently, 20 μL of lactate oxidase enzyme solution was carefully introduced onto the modified area and dried in a non-convection oven at 37 °C for 1 hour to promote enzyme attachment and maintain its functional integrity (this step referred to as SPE-C/G-RE-Nafion-LOx and SPE-Ag/AgCl-RE-Nafion-LOx). After the immobilization process was completed, the adhesive delimiter was removed, leaving a defined area of immobilized LOx on the WE for subsequent electrochemical measurements.After the bioreceptor immobilization, each sensor was individually packaged in aluminium pouches to protect against light with a sachet of silica gel for humidity control, and the packages were stored at room temperature for 10 days.
2.5 Characterization of LOx immobilization
The structural characteristics of the unmodified WE, modified with Nafion and with the enzyme LOx, were evaluated in triplicate (n = 3/immobilization step) to confirm the identified morphology obtained through the technique Field Emission Scanning Electron Microscopy (FESEM), carried out using an Inspect F50 – FEI microscope operating at a voltage of 10 to 20 kV and the sensor's samples were fixed onto aluminium stubs and coated with gold.Additionally, the SPE of processes 1 and 2 were evaluated in triplicate (n = 3/immobilization step) at each step of the immobilization process, based on their electrochemical performance using the CV technique, as detailed in Section 2.3.
2.6 Electrochemical detection of the lactate biomarker
The detection of the lactate biomarker was performed on SPE-C/G-RE-Nafion-LOx and SPE-Ag/AgCl-RE-Nafion-LOx. The biosensors were connected to the PalmSens4 portable potentiostat, 20 μL of lactate solution with different concentrations (10, 20, and 40 mg dL−1) were added to the effective area and evaluated in triplicate in the three production batches (n = 9/concentration) and subsequently discarded, classifying them as single-use sensors. The oxidation current resulting from the interaction between the analyte and the biological sample was kinetically evaluated through chronoamperometric measurement at a voltage of +0.6 V for 120 s. The electrical current value at 30 seconds was specifically extracted for further analyzis. The same procedure described above was performed with ultrapure water to represent the reaction blank sample.The electrochemical reaction of lactate evaluated in this study is depicted in Fig. 3. In this reaction, the lactate molecule is oxidised in the presence of lactate oxidase and oxygen, producing pyruvate and hydrogen peroxide. The hydrogen peroxide is subsequently decomposed electrochemically by the application of an electric potential. As the amount of hydrogen peroxide produced is directly proportional to the lactate concentration in the sample, it is hypothesised that the measured electrical current will exhibit a direct correlation with the lactate concentration.
 | ||
| Fig. 3 Lactate oxidation reaction. The reaction shows the oxidation of lactate to pyruvate by lactate oxidase (LOx) in the presence of oxygen (O2), generating hydrogen peroxide (H2O2) as a byproduct. | ||
2.7 Evaluation of biosensor selectivity
Based on the preliminary experiments with standard lactate solutions, the most effective conductive material for the WE in detecting the analyte was identified. The selectivity of the developed biosensor for detecting lactate was conducted using standard lactate samples containing interferents, specifically glucose and ascorbic acid. Glucose was chosen because it is part of the same metabolic cycle as lactate and can compete for enzymes or cofactors in enzymatic reactions. Ascorbic acid (commonly known as vitamin C) can interfere with lactate measurement because it is a strong reducing agent and can compete with lactate in the oxidation process, reducing the amount of H2O2 produced, which leads to an underestimation of lactate concentration. This may generate false signals or reduce the electrode response due to the redox properties of ascorbic acid itself.21For this test, 1.6 mg dL−1 of ascorbic acid and 99 mg dL−1 of glucose, representing their physiological concentrations in the human body, were electrochemically analyzed in a biosensor with immobilized LOx. These interferents were added separately to standard lactate solutions with previously evaluated standard concentrations. For this test, 1.6 mg dL−1 of ascorbic acid and 99 mg dL−1 of glucose were individually added to standard lactate solutions with pre-determined concentrations and subsequently analysed electrochemically using a biosensor with immobilized LOx. The electrochemical measurements and current extraction were performed as described in Section 2.6.
2.8 Evaluation of biosensor applied to biological samples
The biosensor's ability to detect the biological reaction shown in Fig. 3 was evaluated using human plasma samples, following the established method with standard lactate samples described in Section 2.6. The samples were anonymously sourced from a hospital in southern Brazil and the project received approval from the Ethics and Research Committee of the University of Vale do Rio dos Sinos. These samples were received with pre-determined lactate quantification from a clinical analyzis laboratory that used spectrophotometry as the detection technique. The samples were stored in the refrigerator (2–8 °C) for a period of 2 days before the test was performed. This method is based on quantifying the absorbed light (absorbance) at the wavelength corresponding to the radiation produced by the reaction between the biological sample and the enzyme.242.9 Data analyzes
The data obtained from electronic profilometry (thickness) and CV (Epa, Epc, ΔEp, Ja, Jc and Ja/Jc) were used to define the SPE characteristics, evaluate the repeatability of the production process, and confirm the immobilization of the bioreceptor onto the working electrode. The results are reported as average and standard deviations.The data obtained from chronoamperometric (oxidation electrical current) was used to correlate with the lactate concentration present in the standard solutions, and was evaluated individually for each production process. The one-way ANOVA test, using a 5% significance level was employed to evaluate two aspects: first, whether SPE-C/G-RE-Nafion-LOx and SPE-Ag/AgCl-RE-Nafion-LOx, exhibit statistically significant differences in the electric current obtained when analyzing different lactate concentrations. Secondly, the test was applied to determine whether different batches of the same production process, for both SPE-C/G-RE and SPE-Ag/AgCl-RE, show no statistically significant differences in the measured electric current, thereby demonstrating the ability to consistently reproduce results across batches.
To evaluate the analytical performance, amperometric sensitivity and the limit of detection (LOD) were calculated. For amperometric sensitivity, the slope of the calibration curve, which relates oxidation current to analyte concentration, was determined. To calculate the LOD, eqn (1) was used, where SD represents the standard deviation of the blank measurements.
 | (1) |
The comparison of the electrical current detected by the biosensor in standard solutions with three different lactate concentrations during interference tests (with glucose and ascorbic acid) was performed using a one-way ANOVA test with a 5% significance level. This analyzis was also applied to biological plasma samples.
3 Results
3.1 Sensor manufacturing
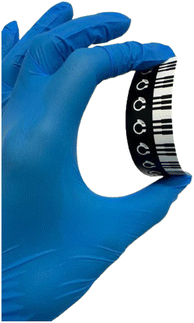
The research dedicated to the development of biosensors is experiencing exponential growth. However, there is a notable lack of studies addressing the productive capacity and repeatability of these devices. This gap presents a significant challenge in obtaining the necessary authorization from regulatory bodies for the production and marketing of these products. While artisanal manufacturing techniques are often cited, they face limitations in terms of time and repeatability. Conversely, complex and precise manufacturing techniques also encounter challenges, including lengthy processes and high associated costs.25The screen-printing method proposed in this study produced flexible biosensors (Fig. 4). For lactate detection applications, a flexible sensor can enable the integration of a wearable device designed for future use with non-invasive biological fluids. Flexible electrodes are typically made from materials that offer excellent mechanical strength, corrosion resistance, and stability. These properties ensure long-term performance and reliability, even under demanding conditions. Compared to rigid electrodes, flexible ones are less susceptible to mechanical failure, cracking, or delamination, which leads to extended operational lifetimes.26
Both production processes evaluated in this work (SPE-C/G-RE and SPE-Ag/AgCl-RE) result in electrodes 10.07 ± 1.29 μm thick, but Process 2 is more time-consuming for requiring additional steps, such as the screen printing of the Ag/AgCl RE. A yield calculation was performed for each process to assess productive efficiency at each stage, revealing that Process 1 allows for the production of 240 sensors per hour, while Process 2 produces approximately 163 sensors per hour (after printing, drying, and area delimitation). These results reinforce that the screen-printing technique used has promising potential for scaling and application in the growing market for remote lactate laboratory testing. The advantages of SPE-C/G-RE printing include reducing the number of steps in the production process and eliminating the need for noble materials.
3.2 Characterization of sensors
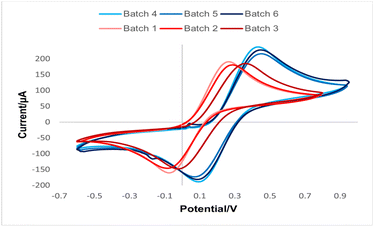
The printing method was initially evaluated by CV using ferrocyanide as a redox probe. According to Fig. 5, as expected, the voltammograms for the SPE with different WE are shifted. For a more comprehensive evaluation, the electrochemical parameters from the CVs in Fig. 5 are summarised in Table 1.| Process | Batch | Epaa (mV) | Epca (mV) | ΔEpa (mV) | Jaa (μA mm−2) | Jca (μA mm−2) | |Ja/Jc| |
|---|---|---|---|---|---|---|---|
| a n = 10. | |||||||
| 1 (SPE-C/G-RE) | 1 | 292 ± 23 | −67 ± 20 | 360 ± 25 | 17 ± 1.9 | −13 ± 0.7 | 0.82 ± 0.05 |
| 2 | 284 ± 26 | −59 ± 47 | 330 ± 37 | 14 ± 0.8 | −12 ± 0.9 | 0.83 ± 0.09 | |
| 3 | 361 ± 18 | −32 ± 15 | 395 ± 28 | 14 ± 0.5 | −11 ± 0.6 | 0.81 ± 0.04 | |
| 2 (SPE-Ag/AgCl-RE) | 4 | 428 ± 16 | −89 ± 8 | 520 ± 10 | 19 ± 1.1 | −15 ± 0.9 | 0.79 ± 0.01 |
| 5 | 447 ± 9 | −68 ± 7 | 515 ± 5 | 17 ± 0.9 | −13 ± 0.6 | 0.80 ± 0.02 | |
| 6 | 432 ± 19 | −87 ± 10 | 520 ± 11 | 18 ± 0.9 | −14 ± 0.8 | 0.79 ± 0.01 | |
Comparing the data displayed in Table 1, Process 1 (SPE-C/G-RE) resulted in ΔEp from 330 to 395 mV and a symmetry from 0.81 to 0.83, meanwhile Process 2 (SPE-Ag/AgCl-RE) presented ΔEp from 515 to 520 mV, a symmetry from 0.79 to 0.80. The larger value of ΔEp observed for Process 2 compared to Process 1 may be associated to an increase in charge transfer resistance due to a poor contact between the interface carbon-graphene|Ag/AgCl. Regarding the measured current densities, Process 2 exhibits a higher electric current density compared to Process 1. This observation suggests that the use of the Ag/AgCl reference electrode enhances the efficiency of the faradaic process. Notably, the symmetry between the anodic and cathodic current density peaks in both processes remains close to the ideal reference value (symmetry equal to 1).12 Moreover, across all evaluated parameters, sensors utilising Ag/AgCl exhibit lower standard deviation in the results, indicating superior repeatability in this production process.
3.3 Enzyme immobilization of lactate oxidase
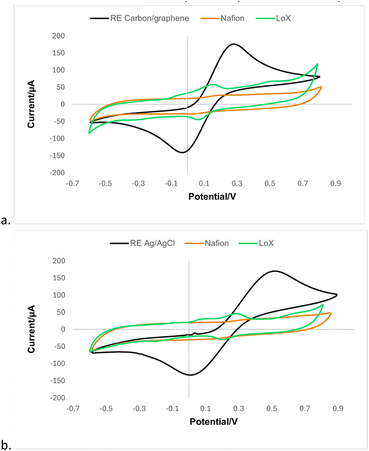
The FESEM images are presented in Fig. 6. The morphology of the unmodified sensor exhibited high roughness, which is characteristic of the screen printing process. The addition of Nafion for the modification of the WE reveals a smooth Nafion polymeric film, as previously reported in the literature.2 The homogeneity of this film is essential to ensure the availability of the enzyme's active sites on the sensor surface. Finally, the incorporation of the lactate oxidase enzyme resulted in a homogeneous surface coverage achieved through enzyme immobilization. One of the factors that contributed to the success was the modification of the sensor surface with a polymeric membrane, which has high ionic conductivity, chemical and thermal stability, in addition to the function of minimizing the interference of species such as glucose, uric acid and ascorbic acid, which affect oxidation reactions, such as in the formation of the lactate product.27Additionally, as observed in the morphological characterization of the bioreceptor immobilization process, the polymer membranes contributed to a more uniform surface on the working electrode, ensuring the availability of the active area for the LOx enzyme and thereby enhancing the orientation for the biological reaction. The surface functionalization was also characterised with CV measurements in electrolyte potassium ferrocyanide (10 mol L−1) and potassium chloride (1.0 mol L−1) (Fig. 7).
The modification with the polymeric membrane suppressed the oxidation–reduction peaks from the redox probe observed in unmodified sensors, indicating the insulating property of the polymer and confirming the modification of the WE. Upon the LOx enzyme immobilization to the surface resulted in a smaller overall current density compared to the bare electrode, associated with the blocking of interfacial electron transfer caused by the protein layer insulating the conductive support. However, one can notice distinct redox processes are displaced in the voltammograms associated with the interaction between the enzyme and co-factors. Similar behaviours were observed, independently of the WE, as expected.
According to the data presented in Table 2, SPE-Ag/AgCl-RE lead to a higher charge transfer resistance previously the modification. However, after the immobilization of the biomolecule, this difference is suppressed, resulting in similar values for both modified sensors, ΔEp equal of (75 ± 7) mV for SPE-Ag/AgCl-RE-Nafion-LOx and (73 ± 5) mV for SPE-C/G-RE-Nafion-LOx. Furthermore, the observed reduction in the symmetry of the current densities in both modified sensors provides evidence of the successful immobilization of the bioreceptor.
| Process | Steps | Epa (mV) | Epc (mV) | ΔEpa (mV) | Jaa (μA mm−2) | Jca (μA mm−2) | |Ja/Jc| |
|---|---|---|---|---|---|---|---|
| a n = 3. | |||||||
| 1 | SPE-C/G-RE | 296 ± 25 | −56 ± 15 | 353 ± 40 | 16 ± 0.27 | −13 ± 0.28 | 0.82 ± 0.01 |
| SPE-C/G-RE-nafion-LOx | 143 ± 5 | 70 ± 0 | 73 ± 5 | 4 ± 0.19 | −3 ± 0.14 | 0.77 ± 0.01 | |
| 2 | SPE-Ag/AgCl-RE | 453 ± 5 | −60 ± 0 | 513 ± 5 | 16 ± 1 | −13 ± 0.6 | 0.82 ± 3 |
| SPE-Ag/AgCl-RE-nafion-LOx | 285 ± 7 | 210 ± 0 | 75 ± 7 | 3 ± 0.08 | −2 ± 0.09 | 0.64 ± 0.01 | |
3.4 Electrochemical detection of the lactate biomarker
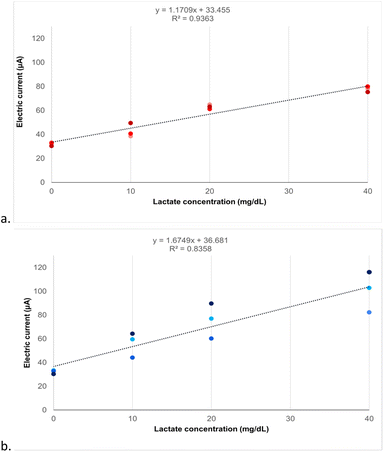
In this work it was observed a relationship between the increase in lactate concentration and the increase in electrical current. This correlation has already been previously reported in the literature in the context of developing lactate biosensors, also using chronoamperometry as a technique to measure the oxidation reaction of lactate mediated by the enzyme LOx in sensors made of laser-printed graphite carbon modified with platinum.28 However, the laser fabrication of biosensors increases their cost due to the need for complex equipment, while the screen-printing method simplifies and makes this process more accessible. The sensors, produced in this study using low-cost materials and methods, also demonstrate linear detection capabilities for the analyte, similar to findings reported in previous studies that utilized noble conductive materials and advanced microfabrication techniques.29In Fig. 8a and b are the responses for 3 different batches of printing, evaluating three different concentrations of lactate employing carbon/graphene or Ag/AgCl as WE, respectively. Comparing the results, one can notice the higher precision for the measurements with SPE-C/G-RE-Nafion-LOx, resulting in a better linearity (R2 = 0.94) compared to SPE-Ag/AgCl-RE-Nafion-LOx (R2 = 0.83).
Additionally, the 95% confidence interval shows the better capacity for the sensor distinguishing the concentrations when using carbon/graphene RE (Table 3). This finding underscores the superior ability of carbon/graphene WE sensors to consistently detect standard lactate concentrations. This reliability and consistency are crucial in applications requiring high accuracy and repeatability, such as in clinical analyses.
| Process | C (mg dL−1) | ia (μA) | CI 95% | p-valueb | p-valuec |
|---|---|---|---|---|---|
| a n = 9.b The p value represents the statistical difference between concentrations.c The p value represents the statistical difference between batches considering each concentration. Consider the electrical current for a blank sample as (32.1 ± 3.7) μA. | |||||
| 1 (SPE-C/G-RE-Nafion-LOx) | 10 | 42.86 (2.96) | 39.9–45.82 | 1.2 × 10⁻¹² | 0.05 |
| 20 | 63.03 (0.75) | 62.28–63.78 | 0.53 | ||
| 40 | 77.79 (2.85) | 74.94–80.64 | 0.56 | ||
| 2 (SPE-Ag/AgCl-RE-Nafion-LOx) | 10 | 55.94 (10.47) | 45.47–66.41 | 7 × 10⁻⁶ | 0.01 |
| 20 | 75.56 (16.07) | 59.49–91.63 | 0.04 | ||
| 40 | 100.35 (17.05) | 83.30–117.40 | 0.01 | ||
The one-way ANOVA test revealed statistically significant differences (p < 0.05) in the average electric currents measured for each concentration across both printing processes p values provided in Table 3. Furthermore, the ANOVA post hoc test confirmed statistically significant differences among the evaluated concentrations. However, when comparing the electrical currents across different batches at the same concentration, it was observed that only the sensors with a carbon/graphene WE showed no statistically significant difference (p > 0.05) in the measured current. This result, as shown in the last column of Table 3, reveals the reproducibility capability of the batches in this process.
The slope representing amperometric sensitivity was 1.17 μA (mg dL−1)−1 for the SPE-C/G-RE-Nafion-LOx and 1.67 μA (mg dL−1)−1 for the SPE-Ag/AgCl-RE-Nafion-LOx. Based on this result, it is possible to conclude that both sensors have high sensitivity, meaning that small variations in the concentration of the analyte result in perceptible and measurable changes in the electrical signal. This means that for each 1 mg dL−1 increase in the analyte concentration, the measured signal will increase by 1.17 or 1.67 μA. The calculated limits of detection were 9.38 mg dL−1 and 6.57 mg dL−1 for the carbon and Ag/AgCl reference sensors, respectively. This value indicates that the analytical method can detect analyte concentrations equal to or greater than these values. Also, concentrations below these values are indistinguishable from background noise and therefore cannot be reliably detected. This limit of detection found for a lactate test is satisfactory because the minimum concentration under human physiological conditions is 9 mg dL−1.15
When evaluating the impact of WE material on the detection of varying lactate concentrations, the study demonstrated a linear correlation between the increase in measured electrical current with increasing lactate concentration for both WE materials. Notably, sensors utilising carbon/graphene WE exhibited superior detection linearity (R2 = 0.94) and a higher capacity to reproduce results in inter-batch evaluations, indicating improved reproducibility of the results, as evidenced by the standard deviation of the oxidation current presented in Table 3. In comparison, sensors with Ag/AgCl WE demonstrated a slightly lower detection linearity (R2 = 0.83). For these reasons, the SPE-C/G-RE-Nafion-LOx sensors were used to analyze interferents and measure lactate in human plasma samples.
3.5 Evaluation of biosensor selectivity
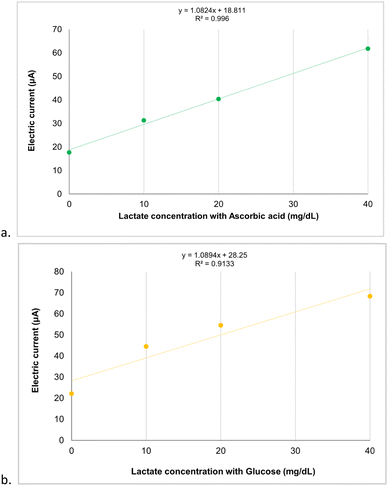
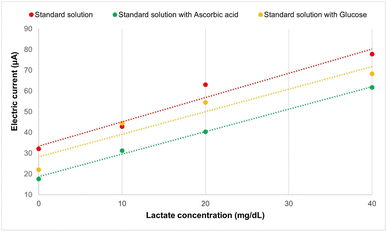
Preliminary tests of interferents, such as ascorbic acid (1.6 mg dL−1) and glucose (99 mg dL−1), confirmed the selectivity in detecting the lactate analyte in standard solutions. The linear responses of the relationship between electric current and different lactate concentrations containing interferents (R2 = 0.99 and R2 = 0.91, respectively) demonstrate that the SPE-C/G-RE-Nafion-LOx sensors have potential for selective detection of the lactate analyte, as can be observed in Fig. 9. Furthermore, for both evaluated interferents, the one-way ANOVA test revealed statistically significant differences in the average electric currents obtained for each concentration (p = 0.9 × 10⁻¹² for ascorbic acid and p = 1.1 × 10⁻¹² for glucose), indicating a highly significant effect (p < 0.05) that underscores the reliability of the results.Finally, as shown in Fig. 10, the presence of interferents in the standard lactate solutions did not compromise the differentiation of concentrations or the level of oxidative electrical current measured by the biosensor.
3.6 Evaluation of biosensor applied to biological samples
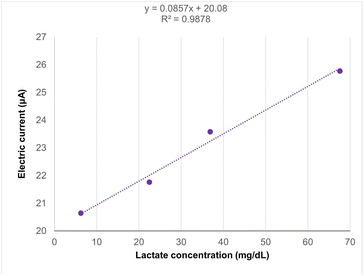
Preliminary tests conducted with plasma samples that contained lactate concentrations previously established by a clinical analyzis laboratory (6.3, 22.5, 36.9, and 67.6 mg dL−1) also demonstrated a linear relationship (R2 = 0.98), as illustrated in Fig. 11. However, a decrease in the resulting oxidation electric current levels was observed when compared to the results of the standard solution. Furthermore, the one-way ANOVA test indicated no statistically significant differences in the average electric currents obtained for each concentration (p = 0.52), confirming that the results are not statistically significant (p > 0.05). These results may be attributed to the influence of sample storage time (period between collection and testing), because the lactate levels can fluctuate or degrade over time. Using fresh samples would therefore help maintain accurate lactate measurements, improving the reliability and precision of the assay results. Currently, obtaining freshly collected samples is a limitation of this study, as the samples are only made available after the clinical laboratory report is released.3.7 Discussion of results with related works
From a review of printed sensors for enzymatic detection of the lactate analyte presented in Table 4, it was possible to observe that the majority previous studies modified the WE, which adds steps to the production process and increases the cost of the product when compared to the sensors developed in this work.29,31–34 All the articles used Ag/AgCl in the RE, and this work presented an alternative material for this electrode. Although the lactate detection sensitivity is lower when using the graphene carbon WE compared to the Ag/AgCl fabricated in this work, the SPE-C/G-RE still presents superior sensitivity to others reported in the literature that included Ag/AgCl in their RE composition.28–35| Production method | WE and RE conductive material | Immobilized enzyme and reagent | Immobilization method | Detection method | Sample | Sensitivity | Detection limit (mM) | Linearity (mM) | Reference |
|---|---|---|---|---|---|---|---|---|---|
| Electrodeposition | Tungsten; Ag/AgCl | LDH; gold nanoparticles-cysteamine | Covalent bond | Chronoamperometry | Standard solution | 31.40 μA (mM cm2)−1 | 0.411 | 0.5 to 7 | 28 |
| Laser-scribed and electrodeposition | Graphitic carbon modified with platinum; Ag/AgCl | LOx; chitosan | Drop casting | Chronoamperometry | Serum, artificial saliva | 35.8 μA (mM cm2)−1 | 0.11 | 0.2 to 3 | 29 |
| Printing | Carbon graphite; Ag/AgCl | LOx; glutaraldehyde | Drop casting | Amperometry | Sweat | 0.233 to 0.287 μA mM−1 | 0.022 | 0.05 to 1.5 | 30 |
| Screenprinting | Carbon modified with Meldola's blue-Reinecke salt; Ag/AgCl | LDH; glutaraldehyde | Drop casting | Amperometry | Serum | 0.00421 μA mM−1 | 0.55 | 0.25 to 10 | 31 |
| Screenprinting | Carbon with cobalt phthalocyanine; Ag/AgCl | LOx; mesoporous silica | Encapsulation | Amperometry | Blood | 4.54 μA (mM cm2)−1 | 0.0183 | 0.018 to 1.5 | 32 |
| Screenprinting | Gold with carbon nanotubes; Ag/AgCl | LOx; chitosan | Layer-by-layer | Chronoamperometry | Standard solution | 0.00191 μA mM−1 | 0.00162 | 0.005 to 0.34 | 33 |
| Screenprinting | Carbon modified with carbon nanotubes; Ag/AgCl | LOx and HRP; polysulfone membrane | Phase inversion | Chronoamperometry | Standard solution | 1168.8 μA (mM mm2)−1 | 0.0005 | 0.00111 to 0.0555 | 34 |
| Printing | Graphite, reduced graphene oxide; Ag/AgCl | LOx; chitosan | Drop casting | Amperometric and differential pulse voltammetry | Sweat | 3.36 μA mM−1 | 0.4 | 0.01 to 10 | 35 |
| Screenprinting | Carbon/graphene; carbon/graphene | LOx; Nafion | Drop casting | Chronoamperometry | Standard solution | 10.54 μA mM−1 | 1.04 | 0 to 4.44 | Our article |
| Screenprinting | Carbon/graphene; Ag/AgCl | LOx; Nafion | Drop casting | Chronoamperometry | Standard solution | 15.05 μA mM−1 | 0.73 | 0 to 4.44 | Our article |
Regarding the immobilization method, there is a prevalence in choosing the Drop Casting technique for enzymatic immobilization, mainly due to its advantages such as simplicity and low cost, the possibility of modifying irregular surfaces, application of multiple layers, scalability, and versatility of materials. By choosing more complex methods, such as covalent bonding and phase inversion, additional steps and materials are required to ensure the stabilization of the bioreceptor. Typically, when using drop casting, reagents like glutaraldehyde and chitosan were applied as an immobilizing matrix, but in this study, Nafion was used because it is a polymeric material with high protonic conductivity, facilitating ion transfer and ensuring good interaction between immobilized enzyme and the electrode. This is crucial for biosensor efficiency, where electrical communication between the enzyme and the electrode is fundamental. Since this is a cation-exchange polymer, it exhibits anti-fouling properties that prevent non-specific interactions between the analyte and the bioreceptor, contributing to the selectivity of the biosensor, thus preventing interference from substances like ascorbic acid in the reaction.36
Furthermore, this study was able to explore a wider range of lactate concentrations in standard solutions than other studies,29,30,32–34 demonstrating that this biosensor has the potential for use in hyperlactatemia scenarios among critically patients with lactate concentrations exceeding 18 mg dL−1. Future studies will evaluate the reason for the reduction in the measured electrical current using plasma samples, as this work proved that the biosensor is not impacted by biological interferents such as glucose and ascorbic acid. One hypothesis is that the result was compromised because the samples were not analyzed within the first hours after collection, and this may have altered the lactate concentration due to the contact of the analyte with the cells.37
4 Conclusion
The SPE production process has enabled the development of a scalable workflow. Electrochemical parameters derived from cyclic voltammetry characterizations reveal that sensors incorporating the Ag/AgCl WE exhibit superior detection capabilities for faradaic processes and enhanced repeatability. Nevertheless, the enzyme immobilization modifications applied to both sensors maintain the fundamental baseline characteristics of the electrodes. The statistical analyzes revealed a significant difference in the electrical current measured at each concentration across the two printing processes. However, when evaluating each concentration across different batches, only the sensors utilising a carbon/graphene WE demonstrated repeatability in detecting the same range of electrical currents. Consequently, carbon/graphene is identified as a viable alternative material for the WE in sensor design for lactate detection, highlighting the principal finding of this study.The SPE-C/G-RE-Nafion-LOx sensors demonstrated selectivity in distinguishing lactate concentrations, even in solutions containing interferents such as ascorbic acid and glucose, without changes in the measured current range. However, for this biosensor to be applied in analyte detection in biological samples, such as in point-of-care devices, further studies are needed to assess the stability of the biological sample post-collection using fingertip blood or sweat.
Data availability
The main data presented in this article in the sections characterization of sensor, enzyme immobilization of lactate oxidase and electrochemical detection of the lactate biomarker are available in the Lactate Article Repository at URL https://drive.google.com/drive/folders/1NauOw3awhqCbE8Qa6S5dWP5vP2Buxzpx?usp=sharing.Author contributions
J. K. M.: study conception, methodology definition, experiment conduction, data analyzis and interpretation, and manuscript preparation. M. G. S.: conducting characterization experiments, data collection and processing. G. V. M. J.: statistical data analyzis and manuscript writing. D. S. M.: performing main analyzes, data interpretation, and manuscript writing. T. S. P.: execution of the sensor printing procedure. I. J. F.: critical review of the manuscript. J. N. S.: project coordinator. J. F. L. S.: electrochemical data analysis and results discussion. W. H. C.: technical assistance in sensor production methods (Biosens CEO) P. S. L: study conception, provision of resources, and critical review of the manuscript.Conflicts of interest
The authors declare that there are no conflicts of interest related to this study. This work is the result of the institutional collaboration between the University of Vale do Rio dos Sinos and the company Biosens. The scientific disclosure of the methodologies and results was authorised.Acknowledgements
We would like to express our sincere gratitude for the partnership with the startup Biosens Development and Industry of Biosensors LTDA and the University of Vale do Rio dos Sinos (UNISINOS), particularly the Semiconductor Technology Institute (itt Chip) and the Nanosaúde project: Application of Nanomaterials in HealthCare Technology, funded by MCTI/FNDCT/FINEP 0086/21.References
- K. Beaver, A. Dantanarayana and S. D. Minteer, Materials approaches for improving electrochemical sensor performance, J. Phys. Chem. B, 2021, 125(43), 11820–11834, DOI:10.1021/acs.jpcb.1c07063.
- A. G. Ferrari, S. J. Rowley-Neale and C. E. Banks, Screen-printed electrodes: Transitioning the laboratory in-to-the field, Talanta Open, 2021, 3, 100032, DOI:10.1016/j.talo.2021.100032.
- R. Tortorich, H. Shamkhalichenar and J.-W. Choi, Inkjet-printed and paper-based electrochemical sensors, Appl. Sci., 2018, 8(2), 288, DOI:10.3390/app8020288.
- G. Paimard, E. Ghasali and M. Baeza, Screen-printed electrodes: Fabrication, modification, and biosensing applications, Chemosensors, 2023, 113 CrossRef CAS , https://www.mdpi.com/2227-9040/11/2/113.
- H. H. Nguyen, S. H. Lee, U. J. Lee, C. D. Fermin and M. Kim, Immobilized enzymes in biosensor applications, Materials, 2019, 12(1), 121, DOI:10.3390/ma12010121.
- G. S. Nunes and J.-L. Marty, Immobilization of Enzymes on Electrodes, in Methods in Biotechnology, ed. M. Jose, Humana Press, 2006 Search PubMed.
- M. A. Özbek, A. Yaşar, S. Çete, E. Er and N. Erk, A novel biosensor based on graphene/platinum nanoparticles/Nafion composites for determination of glucose, J. Solid State Electrochem., 2021, 25(5), 1601–1610, DOI:10.1007/s10008-021-04939-5.
- E. E. Herbei, P. Alexandru and M. Busila, Cyclic voltammetry of screen-printed carbon electrode coated with Ag-ZnO nanoparticles in chitosan matrix, Materials, 2023, 16(8), 3266, DOI:10.3390/ma16083266.
- N. Elgrishi, K. J. Rountree, B. D. McCarthy, E. S. Rountree, T. T. Eisenhart and J. L. Dempsey, A practical beginner's guide to cyclic voltammetry, J. Chem. Educ., 2018, 95(2), 197–206, DOI:10.1021/acs.jchemed.7b00361.
- T. Peter, R. William and W. R. Kissinger, in Laboratory Techniques in Electroanalytical Chemistry, Revised and Expanded, ed. P. T. Kissinger and W. R. Heinema, CRC Press, 2nd edn, Boca Raton, FL, 2018 Search PubMed.
- M. Grossi and B. Riccò, Electrical impedance spectroscopy (EIS) for biological analysis and food characterization: a review, J. Sens. Sens. Syst., 2017, 6(2), 303–325 CrossRef . https://jsss.copernicus.org/articles/6/303/2017/jsss-6-303-2017.pdf.
- J. Wang, Analytical Electrochemistry, John Wiley & Sons, 3rd edn, 2006 Search PubMed.
- E. Blohm, J. Lai and M. Neavyn, Drug-induced hyperlactatemia, Clin. Toxicol., 2017, 55(8), 869–878 CrossRef PubMed .https://pubmed.ncbi.nlm.nih.gov/28447886/.
- K. Rathee, V. Dhull, R. Dhull and S. Singh, Biosensors based on electrochemical lactate detection: A comprehensive review, Biochem. Biophys. Rep., 2016, 5, 35–54 Search PubMed . https://pubmed.ncbi.nlm.nih.gov/28955805/.
- M. Adeva-Andany, M. López-Ojén, R. Funcasta-Calderón, E. Ameneiros-Rodríguez, C. Donapetry-García and M. Vila-Altesor, et al., Comprehensive review on lactate metabolism in human health, Mitochondrion, 2014, 76–100 CrossRef CAS PubMed , https://pubmed.ncbi.nlm.nih.gov/24929216/.
- A. Rhodes, L. E. Evans, W. Alhazzani, M. M. Levy, M. Antonelli and R. Ferrer, et al., Surviving sepsis campaign: International guidelines for management of sepsis and septic shock, Intensive Care Med., 2017, 43(3), 304–377 CrossRef PubMed . https://pubmed.ncbi.nlm.nih.gov/28101605/.
- K. Budidha, M. Mamouei, N. Baishya, M. Qassem, P. Vadgama and P. A. Kyriacou, Identification and quantitative determination of lactate using optical spectroscopy—towards a noninvasive tool for early recognition of sepsis, Sensors, 2020, 20(18), 5402, DOI:10.3390/s20185402.
- E. Morris, D. McCartney, D. Lasserson, A. Van den Bruel, R. Fisher and G. Hayward, Point-of-care lactate testing for sepsis at presentation to health care: a systematic review of patient outcomes, Br. J. Gen. Pract., 2017, 67(665), e859–e870 CrossRef PubMed , https://pubmed.ncbi.nlm.nih.gov/29158243/.
- D. Chan, M. M. Barsan, Y. Korpan and C. M. A. Brett, L-lactate selective impedimetric bienzymatic biosensor based on lactate dehydrogenase and pyruvate oxidase, Electrochim. Acta, 2017, 231, 209–215, DOI:10.1016/j.electacta.2017.02.050.
- Methods and Protocols, Volume 2: Electrochemical, Bioelectronic, Piezoelectric, Cellular and Molecular Biosensors, Biosensors and Biodetection, ed. B. Prickril and A. Rasooly, Springer New York, New York, NY, 2017 Search PubMed.
- A. Schuck, H. E. Kim, J. K. Moreira, P. S. Lora and Y.-S. Kim, A graphene-based enzymatic biosensor using a common-gate field-effect transistor for L-lactic acid detection in blood plasma samples, Sensors, 2021, 21(5), 1852 CrossRef CAS PubMed . https://www.mdpi.com/1424-8220/21/5/1852.
- J. K. Moreira, D. Da Silva Moraes, M. G. Souza, G. V. M. Jantzch, B. F. Serafini, I. J. Fernandes, et al., Development of a low-cost graphene screen-printed paper-based electrochemical sensor with application of lactate detection: a biological biomarker, Em: 2023 IEEE BioSensors Conference (BioSensors), IEEE, 2023 Search PubMed.
- M. Kumari, V. Gupta, N. Kumar and R. K. Arun, Microfluidics-based nanobiosensors for healthcare monitoring, Mol. Biotechnol., 2024, 66(3), 378–401, DOI:10.1007/s12033-023-00760-9.
- C. S. Pundir, V. Narwal and B. Batra, Determination of lactic acid with special emphasis on biosensing methods: A review, Biosens. Bioelectron., 2016, 777–790 CrossRef CAS PubMed.
- F. Otero and E. Magner, Biosensors - recent advances and future challenges in electrode materials, Sensors, 2020, 20(12), 3561, DOI:10.3390/s20123561.
- G. Liang, Z. He, J. Zhen, H. Tian, L. Ai and L. Pan, et al., Development of the screen-printed electrodes: A mini review on the application for pesticide detection, Environ. Technol., 2022, 28, 102922, DOI:10.1016/j.eti.2022.102922.
- J. Liu, Q. Dang, L. Wang, D. Wang and L. Tang, Applications of flexible electrochemical electrodes in wastewater treatment: A review, Chin. Chem. Lett., 2024, 35(8), 109277 CrossRef CAS .Available from: https://linkinghub.elsevier.com/retrieve/pii/S1001841723010288.
- J. S. Narayanan and G. Slaughter, Lactic acid biosensor based on lactate dehydrogenase immobilized on Au nanoparticle modified microwire electrode, IEEE Sens. J., 2020, 20(8), 4034–4040, DOI:10.1109/jsen.2019.2963405.
- J. Madden, E. Vaughan, M. Thompson, A. O’ Riordan, P. Galvin and D. Iacopino, et al., Electrochemical sensor for enzymatic lactate detection based on laser-scribed graphitic carbon modified with platinum, chitosan and lactate oxidase, Talanta, 2022, 246, 123492, DOI:10.1016/j.talanta.2022.123492.
- X. Luo, H. Yu and Y. Cui, A wearable amperometric biosensor on a cotton fabric for lactate, IEEE Electron Device Lett., 2018, 39(1), 123–126, DOI:10.1109/led.2017.2777474.
- M. Piano, S. Serban, R. Pittson, G. A. Drago and J. P. Hart, Amperometric lactate biosensor for flow injection analysis based on a screen-printed carbon electrode containing Meldola's Blue-Reinecke salt, coated with lactate dehydrogenase and NAD+, Talanta, 2010, 82(1), 34–37, DOI:10.1016/j.talanta.2010.03.051.
- T. Shimomura, T. Sumiya, M. Ono, T. Ito and T.-A. Hanaoka, Amperometric L-lactate biosensor based on screen-printed carbon electrode containing cobalt phthalocyanine, coated with lactate oxidase-mesoporous silica conjugate layer, Anal. Chim. Acta, 2012, 714, 114–120, DOI:10.1016/j.aca.2011.11.053.
- R. Monošík, M. Streďanský, G. Greif and E. Šturdík, A rapid method for determination of l-lactic acid in real samples by amperometric biosensor utilizing nanocomposite, Food Control, 2012, 23(1), 238–244, DOI:10.1016/j.foodcont.2011.07.021.
- S. Pérez and E. Fàbregas, Amperometric bienzymatic biosensor for L-lactate analysis in wine and beer samples, Analyst, 2012, 137(16), 3854–3861, 10.1039/c2an35227c.
- A. Khan, M. Winder and G. Hossain, Modified graphene-based nanocomposite material for smart textile biosensor to detect lactate from human sweat, Biosens. Bioelectron.:X, 2022, 10, 100103, DOI:10.1016/j.biosx.2021.100103.
- L. S. Rocha and H. M. Carapuça, Ion-exchange voltammetry of dopamine at Nafion-coated glassy carbon electrodes: Quantitative features of ion-exchange partition and reassessment on the oxidation mechanism of dopamine in the presence of excess ascorbic acid, Bioelectrochemistry, 2006, 69(2), 258–266 CrossRef CAS PubMed . Available from: https://linkinghub.elsevier.com/retrieve/pii/S1567539406000648.
- J. C. Dale, Preanalytic variables in laboratory testing, Lab. Med., 1998, 29(9), 540–545, DOI:10.1093/labmed/29.9.540.
| This journal is © The Royal Society of Chemistry 2024 |

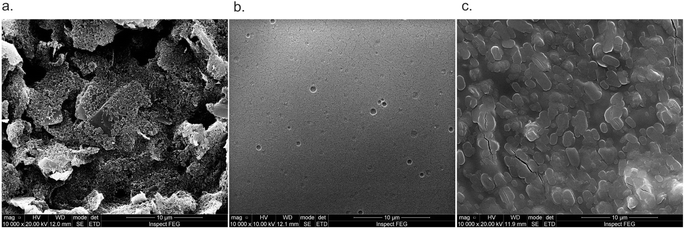
![[thin space (1/6-em)]](https://www.rsc.org/images/entities/char_2009.gif) 000× original magnification: (a) unmodified WE, (b) WE modified with a Nafion polymeric film, and (c) WE modified with Nafion and LOx.
000× original magnification: (a) unmodified WE, (b) WE modified with a Nafion polymeric film, and (c) WE modified with Nafion and LOx.